Pay vs Performance Disclosure - USD ($)
Dec. 31, 2024
Nov. 25, 2024
Dec. 31, 2025
Dec. 31, 2024
Dec. 31, 2023
Dec. 31, 2022
Dec. 31, 2021
Pay Versus Performance
Pay Versus Performance Table
In accordance with disclosure requirements under the Dodd-Frank Wall Street Reform and Consumer Protection Act and Item 402(v) of Regulation S-K, the following information describes the relationship between compensation actually paid to our NEOs and certain financial performance of the Company. For additional information regarding the alignment of our compensation programs with the Company’s performance, refer to our CD&A.
The table below summarizes Summary Compensation Table (“SCT”) total compensation reported for, and Compensation Actually Paid (“CAP”, as defined by the SEC) to, our former CEO, our interim CEO and, on average, our other NEOs.
Year | Summary Compensation Table Total for CEO(1) | Compensation Actually Paid to CEO(1)(2)(3) | Summary Compensation Table Total for Former CEO(1) | Compensation Actually Paid to Former CEO(1)(2)(3) | Avg Summary Compensation Table Total for Non-CEO NEOs(1)(2) | Average Compensation Actually Paid to Non-CEO NEOs(1)(2)(3) | Value of Initial Fixed $100 Investment Based on:(4) | Net Income (Loss) (Millions USD) | Adjusted EBITDA(5)(6) (Millions USD) | |||||||||||||||||||||||
Company TSR | Peer Group TSR | |||||||||||||||||||||||||||||||
2025 | $5,609,922 | $19,121,424 | $4,054,729 | $9,007,997 | $138 | $150 | $85 | $610 | ||||||||||||||||||||||||
2024 | $10,550,025 | $14,227,775 | $13,914,745 | $10,584,170 | $3,216,477 | $2,492,343 | $66 | $132 | ($57) | $395 | ||||||||||||||||||||||
2023 | $17,327,154 | $14,595,591 | $3,609,177 | $3,117,256 | $80 | $129 | $38 | $317 | ||||||||||||||||||||||||
2022 | $11,882,248 | $4,464,658 | $2,357,617 | $1,393,365 | $81 | $103 | ($242) | $700 | ||||||||||||||||||||||||
2021 | $10,616,003 | $12,396,926 | $2,112,689 | $2,368,441 | $119 | $129 | $197 | $795 | ||||||||||||||||||||||||
(1) | James K. Kamsickas, former Chairman of the Board, President and CEO, was our principal executive officer (“PEO”) through November 25, 2024. R. Bruce McDonald, Chairman of the Board, President and CEO, became our PEO effective November 25, 2024. The individuals comprising the non-CEO NEOs for each fiscal year presented are listed below. |
2021 | 2022 | 2023 | 2024 | 2025 | ||||||||||
Jonathan M. Collins | Timothy R. Kraus | Timothy R. Kraus | Timothy R. Kraus | Timothy R. Kraus | ||||||||||
Timothy R. Kraus | Aziz S. Aghili | Aziz S. Aghili | Byron S. Foster | Byron S. Foster | ||||||||||
Aziz S. Aghili | Byron S. Foster | Byron S. Foster | Brian K. Pour | Brian K. Pour | ||||||||||
Douglas H. Liedberg | Douglas H. Liedberg | Douglas H. Liedberg | Jeroen Decleer | Douglas H. Liedberg | ||||||||||
Antonio Valencia | Douglas H. Liedberg | |||||||||||||
(2) | These columns reflect Compensation Actually Paid (CAP) calculated in accordance with Item 402(v) of Regulation S-K. CAP does not necessarily reflect compensation actually earned, realized, or received. The amounts reflect the Summary Compensation Table totals with certain adjustments as described below. |
(3) | CAP reflects the deduction and addition of certain amounts for the CEO, the former CEO and the Non-CEO NEOs as set forth below. Amounts in the columns titled Deduction of Grant Date Fair Value of Stock Awards from Summary Compensation Table are the totals from the Stock Awards column shown in the Summary Compensation Table. Amounts in the columns titled Additions to Summary Compensation Table include the net addition of the following: (i) the year end fair value of any equity awards granted in the applicable year that are outstanding and unvested as of the end of the year; (ii) the change in fair value as of fiscal year end compared to prior year end fair value for unvested and outstanding awards granted in prior fiscal years; and (iii) the change in fair value as of vesting date compared to prior year end fair value for vested awards granted in prior years. |
Year | Summary Compensation Table Total for CEO | Deduction of Grant Date Fair Value of Stock Awards from Summary Compensation Table | Additions to Summary Compensation Table | Compensation Actually Paid to CEO | ||||||||||
2025 | $5,609,922 | ($4,124,985) | $17,636,487 | $19,121,424 | ||||||||||
2024 | $10,550,025 | ($10,399,995) | $14,077,745 | $14,227,775 | ||||||||||
Year | Summary Compensation Table Total for Former CEO | Deduction of Grant Date Fair Value of Stock Awards from Summary Compensation Table | Additions to Summary Compensation Table | Compensation Actually Paid to Former CEO | ||||||||||
2024 | $13,914,745 | ($10,247,499) | $6,916,924 | $10,584,170 | ||||||||||
2023 | $17,327,154 | ($11,958,807) | $9,227,244 | $14,595,591 | ||||||||||
2022 | $11,882,248 | ($9,139,212) | $1,721,622 | $4,464,658 | ||||||||||
2021 | $10,616,003 | ($8,478,178) | $10,259,101 | $12,396,926 | ||||||||||
Year | Summary Compensation Table Total for Non-CEO NEOs | Deduction of Grant Date Fair Value of Stock Awards from Summary Compensation Table | Additions to Summary Compensation Table | Compensation Actually Paid to Non-CEO NEOs | ||||||||||
2025 | $4,054,729 | ($1,829,801) | $6,783,069 | $9,007,997 | ||||||||||
2024 | $3,216,477 | ($1,719,984) | $995,850 | $2,492,343 | ||||||||||
2023 | $3,609,177 | ($1,889,546) | $1,397,625 | $3,117,256 | ||||||||||
2022 | $2,357,617 | ($1,491,462) | $527,210 | $1,393,365 | ||||||||||
2021 | $2,112,689 | ($1,341,617) | $1,597,369 | $2,368,441 | ||||||||||
The amounts deducted or added in calculating the equity award adjustments are as follows:
Year | Year End Value of Awards Granted During Covered Fiscal Year for CEO | Year over Year Change in Fair Value of Outstanding and Unvested Equity Awards Granted in Prior Fiscal Years | Change in Fair Value as of Vesting Date of Equity Awards Granted in Prior Fiscal Years that Vested in the Fiscal Year | Total for CEO | ||||||||||
2025 | $4,365,686 | $0 | $13,270,801 | $17,636,487 | ||||||||||
2024 | $14,077,745 | $0 | $0 | $14,077,745 | ||||||||||
Year | Year End Value of Awards Granted During Covered Fiscal Year for Former CEO | Year over Year Change in Fair Value of Outstanding and Unvested Equity Awards Granted in Prior Fiscal Years | Change in Fair Value as of Vesting Date of Equity Awards Granted in Prior Fiscal Years that Vested in the Fiscal Year | Total for Former CEO | ||||||||||
2024 | $9,079,449 | ($1,807,953) | ($354,572) | $6,916,924 | ||||||||||
2023 | $9,453,700 | ($1,341,376) | $1,114,920 | $9,227,244 | ||||||||||
2022 | $6,279,348 | ($4,196,181) | ($361,545) | $1,721,622 | ||||||||||
2021 | $7,280,424 | $2,411,826 | $566,851 | $10,259,101 | ||||||||||
Year | Year End Value of Awards Granted During Covered Fiscal Year for Non-CEO NEOs | Year over Year Change in Fair Value of Outstanding and Unvested Equity Awards Granted in Prior Fiscal Years | Change in Fair Value as of Vesting Date of Equity Awards Granted in Prior Fiscal Years that Vested in the Fiscal Year | Total for Non-CEO NEOs | ||||||||||
2025 | $2,976,441 | $3,551,449 | $255,180 | $6,783,069 | ||||||||||
2024 | $1,245,907 | ($163,718) | ($86,338) | $995,850 | ||||||||||
2023 | $1,492,741 | ($185,415) | $90,299 | $1,397,625 | ||||||||||
2022 | $1,032,045 | ($441,736) | ($63,099) | $527,210 | ||||||||||
2021 | $1,166,629 | $352,447 | $78,293 | $1,597,369 | ||||||||||
(4) | The peer groups used to calculate Peer Group TSR are our compensation peer group as disclosed in the CD&A section of this proxy statement, our 2025 proxy statement, our 2024 proxy statement, our 2023 proxy statement, and our 2022 proxy statement. TSR is based on the value of an initial fixed investment of $100 invested (with reinvestment of dividends) in the Company and in the peer group companies for the period starting December 31, 2020 through the end of the listed year, weighted by market capitalization in each applicable year. |
(5) | As previously disclosed, in connection with Dana’s divestiture of its Off-Highway business, the results of that business have been classified as discontinued operations in accordance with U.S. GAAP. The Company’s financial results for fiscal years 2025, 2024, and 2023 have been recast to reflect this classification. In accordance with the rules governing the accounting for discontinued operations, costs historically allocated to the Off-Highway business have been retained by continuing operations for the recast years. Financial results for fiscal years 2022 and 2021 have not been recast, as those periods were not retrospectively adjusted in the Company’s historical financial statements. Accordingly, amounts presented for the earlier years may not be directly comparable to amounts presented for the more recent periods. |
(6) | We determined Adjusted EBITDA to be the most important financial performance measure used to link Company performance to Compensation Actually Paid to our CEO and non-CEO NEOs in 2025. Adjusted EBITDA is defined as net income (loss) before interest, income taxes, depreciation, amortization, equity grant expense, restructuring expense, nonservice cost components of pension and other postretirement benefits costs and other adjustments not related to our core operations (gain/loss on debt extinguishment, pension settlements, divestitures, impairment, etc.). |
(1) | James K. Kamsickas, former Chairman of the Board, President and CEO, was our principal executive officer (“PEO”) through November 25, 2024. R. Bruce McDonald, Chairman of the Board, President and CEO, became our PEO effective November 25, 2024. The individuals comprising the non-CEO NEOs for each fiscal year presented are listed below. |
2021 | 2022 | 2023 | 2024 | 2025 | ||||||||||
Jonathan M. Collins | Timothy R. Kraus | Timothy R. Kraus | Timothy R. Kraus | Timothy R. Kraus | ||||||||||
Timothy R. Kraus | Aziz S. Aghili | Aziz S. Aghili | Byron S. Foster | Byron S. Foster | ||||||||||
Aziz S. Aghili | Byron S. Foster | Byron S. Foster | Brian K. Pour | Brian K. Pour | ||||||||||
Douglas H. Liedberg | Douglas H. Liedberg | Douglas H. Liedberg | Jeroen Decleer | Douglas H. Liedberg | ||||||||||
Antonio Valencia | Douglas H. Liedberg | |||||||||||||
(4) | The peer groups used to calculate Peer Group TSR are our compensation peer group as disclosed in the CD&A section of this proxy statement, our 2025 proxy statement, our 2024 proxy statement, our 2023 proxy statement, and our 2022 proxy statement. TSR is based on the value of an initial fixed investment of $100 invested (with reinvestment of dividends) in the Company and in the peer group companies for the period starting December 31, 2020 through the end of the listed year, weighted by market capitalization in each applicable year. |
(3) | CAP reflects the deduction and addition of certain amounts for the CEO, the former CEO and the Non-CEO NEOs as set forth below. Amounts in the columns titled Deduction of Grant Date Fair Value of Stock Awards from Summary Compensation Table are the totals from the Stock Awards column shown in the Summary Compensation Table. Amounts in the columns titled Additions to Summary Compensation Table include the net addition of the following: (i) the year end fair value of any equity awards granted in the applicable year that are outstanding and unvested as of the end of the year; (ii) the change in fair value as of fiscal year end compared to prior year end fair value for unvested and outstanding awards granted in prior fiscal years; and (iii) the change in fair value as of vesting date compared to prior year end fair value for vested awards granted in prior years. |
Year | Summary Compensation Table Total for CEO | Deduction of Grant Date Fair Value of Stock Awards from Summary Compensation Table | Additions to Summary Compensation Table | Compensation Actually Paid to CEO | ||||||||||
2025 | $5,609,922 | ($4,124,985) | $17,636,487 | $19,121,424 | ||||||||||
2024 | $10,550,025 | ($10,399,995) | $14,077,745 | $14,227,775 | ||||||||||
Year | Summary Compensation Table Total for Former CEO | Deduction of Grant Date Fair Value of Stock Awards from Summary Compensation Table | Additions to Summary Compensation Table | Compensation Actually Paid to Former CEO | ||||||||||
2024 | $13,914,745 | ($10,247,499) | $6,916,924 | $10,584,170 | ||||||||||
2023 | $17,327,154 | ($11,958,807) | $9,227,244 | $14,595,591 | ||||||||||
2022 | $11,882,248 | ($9,139,212) | $1,721,622 | $4,464,658 | ||||||||||
2021 | $10,616,003 | ($8,478,178) | $10,259,101 | $12,396,926 | ||||||||||
The amounts deducted or added in calculating the equity award adjustments are as follows:
Year | Year End Value of Awards Granted During Covered Fiscal Year for CEO | Year over Year Change in Fair Value of Outstanding and Unvested Equity Awards Granted in Prior Fiscal Years | Change in Fair Value as of Vesting Date of Equity Awards Granted in Prior Fiscal Years that Vested in the Fiscal Year | Total for CEO | ||||||||||
2025 | $4,365,686 | $0 | $13,270,801 | $17,636,487 | ||||||||||
2024 | $14,077,745 | $0 | $0 | $14,077,745 | ||||||||||
Year | Year End Value of Awards Granted During Covered Fiscal Year for Former CEO | Year over Year Change in Fair Value of Outstanding and Unvested Equity Awards Granted in Prior Fiscal Years | Change in Fair Value as of Vesting Date of Equity Awards Granted in Prior Fiscal Years that Vested in the Fiscal Year | Total for Former CEO | ||||||||||
2024 | $9,079,449 | ($1,807,953) | ($354,572) | $6,916,924 | ||||||||||
2023 | $9,453,700 | ($1,341,376) | $1,114,920 | $9,227,244 | ||||||||||
2022 | $6,279,348 | ($4,196,181) | ($361,545) | $1,721,622 | ||||||||||
2021 | $7,280,424 | $2,411,826 | $566,851 | $10,259,101 | ||||||||||
(3) | CAP reflects the deduction and addition of certain amounts for the CEO, the former CEO and the Non-CEO NEOs as set forth below. Amounts in the columns titled Deduction of Grant Date Fair Value of Stock Awards from Summary Compensation Table are the totals from the Stock Awards column shown in the Summary Compensation Table. Amounts in the columns titled Additions to Summary Compensation Table include the net addition of the following: (i) the year end fair value of any equity awards granted in the applicable year that are outstanding and unvested as of the end of the year; (ii) the change in fair value as of fiscal year end compared to prior year end fair value for unvested and outstanding awards granted in prior fiscal years; and (iii) the change in fair value as of vesting date compared to prior year end fair value for vested awards granted in prior years. |
Year | Summary Compensation Table Total for Non-CEO NEOs | Deduction of Grant Date Fair Value of Stock Awards from Summary Compensation Table | Additions to Summary Compensation Table | Compensation Actually Paid to Non-CEO NEOs | ||||||||||
2025 | $4,054,729 | ($1,829,801) | $6,783,069 | $9,007,997 | ||||||||||
2024 | $3,216,477 | ($1,719,984) | $995,850 | $2,492,343 | ||||||||||
2023 | $3,609,177 | ($1,889,546) | $1,397,625 | $3,117,256 | ||||||||||
2022 | $2,357,617 | ($1,491,462) | $527,210 | $1,393,365 | ||||||||||
2021 | $2,112,689 | ($1,341,617) | $1,597,369 | $2,368,441 | ||||||||||
The amounts deducted or added in calculating the equity award adjustments are as follows:
Year | Year End Value of Awards Granted During Covered Fiscal Year for Non-CEO NEOs | Year over Year Change in Fair Value of Outstanding and Unvested Equity Awards Granted in Prior Fiscal Years | Change in Fair Value as of Vesting Date of Equity Awards Granted in Prior Fiscal Years that Vested in the Fiscal Year | Total for Non-CEO NEOs | ||||||||||
2025 | $2,976,441 | $3,551,449 | $255,180 | $6,783,069 | ||||||||||
2024 | $1,245,907 | ($163,718) | ($86,338) | $995,850 | ||||||||||
2023 | $1,492,741 | ($185,415) | $90,299 | $1,397,625 | ||||||||||
2022 | $1,032,045 | ($441,736) | ($63,099) | $527,210 | ||||||||||
2021 | $1,166,629 | $352,447 | $78,293 | $1,597,369 | ||||||||||
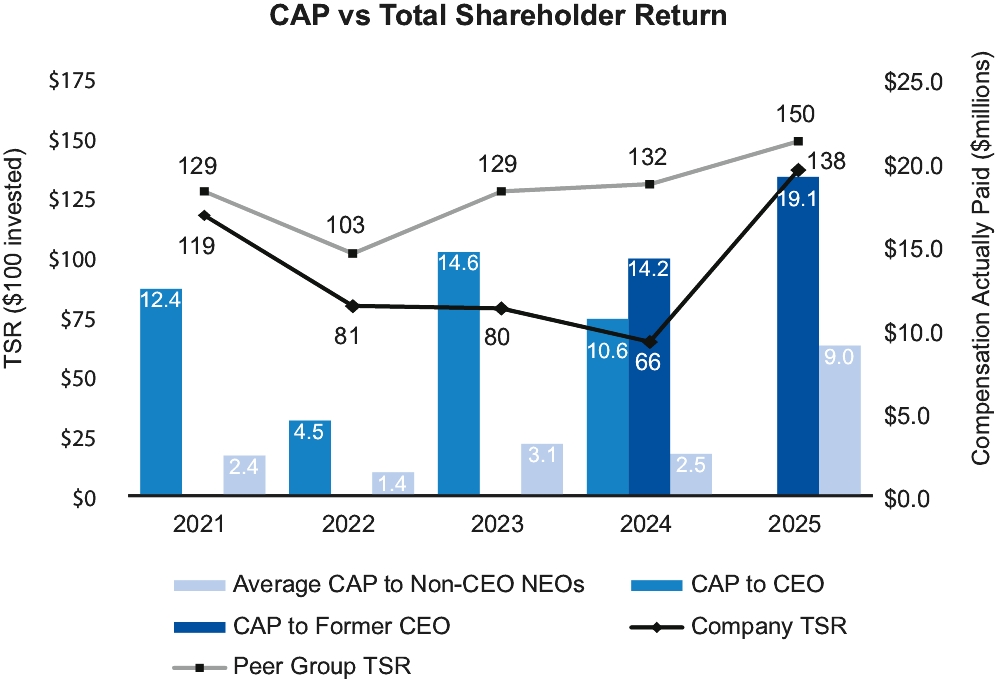
Relationship Between CEO and Non-CEO NEO Compensation Actually Paid and Total Shareholder Return (“TSR”)
The following chart depicts the relationship between Compensation Actually Paid to our former CEO, Compensation Actually Paid to our CEO, the average of Compensation Actually Paid to our Non-CEO NEOs, and TSR for the Company and our TSR peer group.
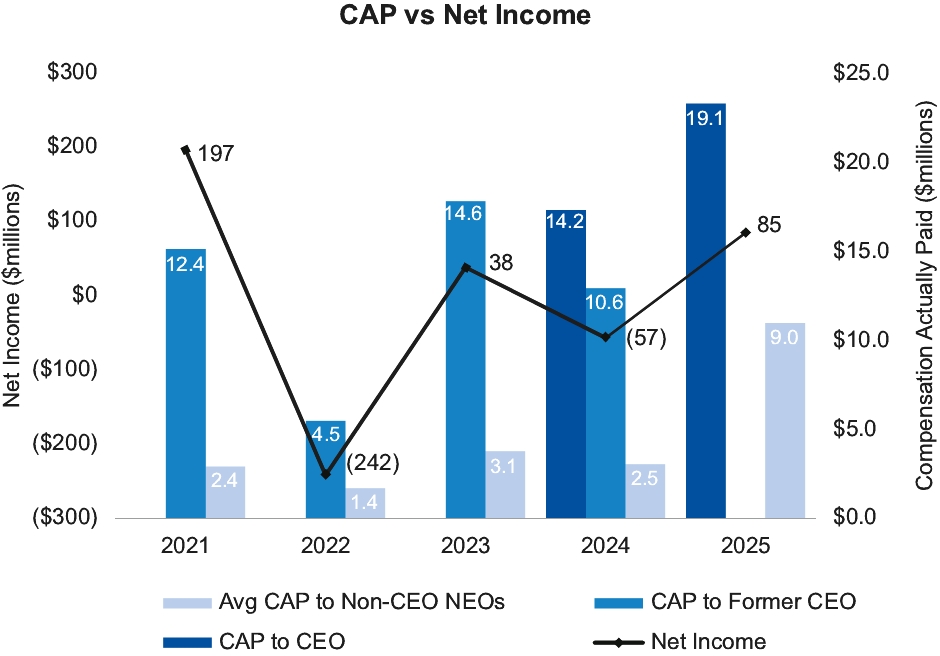
Relationship Between CEO and Non-CEO NEO Compensation Actually Paid and Net Income
The following chart sets forth the relationship between Compensation Actually Paid to our former CEO, Compensation Actually Paid to our CEO, the average of Compensation Actually Paid to our Non-CEO NEOs, and our net income (loss).
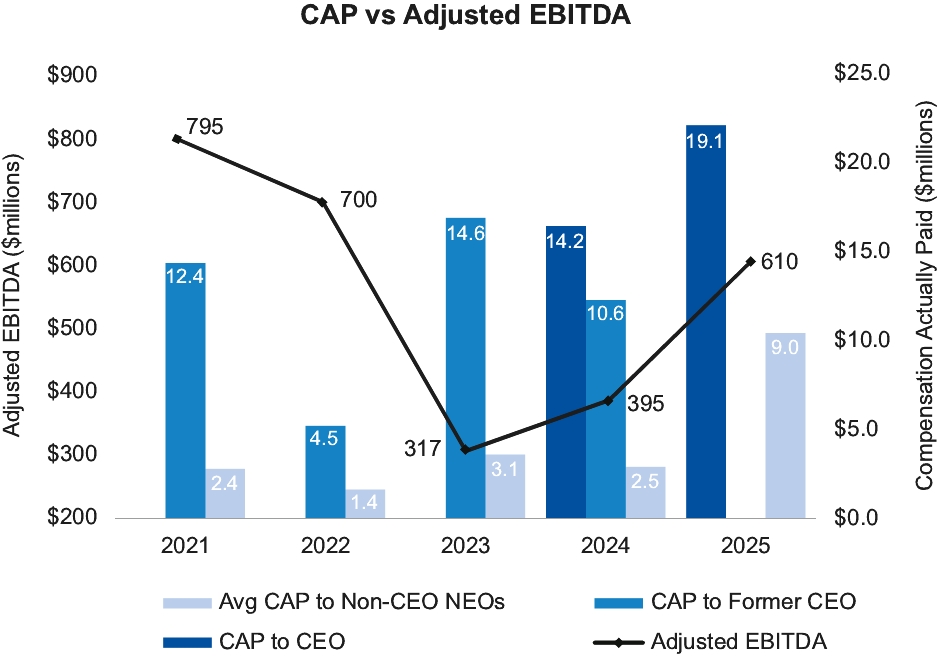
Relationship Between CEO and Non-CEO NEO Compensation Actually Paid and Adjusted EBITDA
The following chart sets forth the relationship between Compensation Actually Paid to our former CEO, Compensation Actually Paid to our CEO, the average of Compensation Actually Paid to our Non-CEO NEOs, and our Adjusted EBITDA.
Relationship Between CEO and Non-CEO NEO Compensation Actually Paid and Total Shareholder Return (“TSR”)
The following chart depicts the relationship between Compensation Actually Paid to our former CEO, Compensation Actually Paid to our CEO, the average of Compensation Actually Paid to our Non-CEO NEOs, and TSR for the Company and our TSR peer group.
2025 Performance Measures
The measures listed below represent the most important metrics we used to link executive pay to company performance for 2025 as described in our CD&A within the sections titled “Annual Performance-Based Cash Incentive” and “Long-Term Incentive Program”.
Most Important Performance Measures | |||||
Adjusted EBITDA | |||||
Pre-tax Unlevered Free Cash Flow | |||||
Run Rate Cost Reduction | |||||
Pre-tax Return on Invested Capital | |||||
Relative TSR | |||||
Discontinued Operations and Comparability of Periods
As noted in Footnote 5 of the Pay Versus Performance Table above, in connection with Dana’s divestiture of its Off-Highway business, the results of that business have been classified as discontinued operations for fiscal years 2025, 2024, and 2023. In accordance with the rules governing the accounting for discontinued operations, costs historically allocated to the Off-Highway business have been retained by continuing operations for the recast years. Financial performance measures for earlier periods were not retrospectively adjusted under U.S. GAAP and therefore include the results of the discontinued business. As a result, comparability across periods may be limited, and the relationships shown in the more recent years primarily reflect the Company’s ongoing operations.
The amounts deducted or added in calculating the equity award adjustments are as follows:
Year | Year End Value of Awards Granted During Covered Fiscal Year for CEO | Year over Year Change in Fair Value of Outstanding and Unvested Equity Awards Granted in Prior Fiscal Years | Change in Fair Value as of Vesting Date of Equity Awards Granted in Prior Fiscal Years that Vested in the Fiscal Year | Total for CEO | ||||||||||
2025 | $4,365,686 | $0 | $13,270,801 | $17,636,487 | ||||||||||
2024 | $14,077,745 | $0 | $0 | $14,077,745 | ||||||||||
Year | Year End Value of Awards Granted During Covered Fiscal Year for Former CEO | Year over Year Change in Fair Value of Outstanding and Unvested Equity Awards Granted in Prior Fiscal Years | Change in Fair Value as of Vesting Date of Equity Awards Granted in Prior Fiscal Years that Vested in the Fiscal Year | Total for Former CEO | ||||||||||
2024 | $9,079,449 | ($1,807,953) | ($354,572) | $6,916,924 | ||||||||||
2023 | $9,453,700 | ($1,341,376) | $1,114,920 | $9,227,244 | ||||||||||
2022 | $6,279,348 | ($4,196,181) | ($361,545) | $1,721,622 | ||||||||||
2021 | $7,280,424 | $2,411,826 | $566,851 | $10,259,101 | ||||||||||
Year | Year End Value of Awards Granted During Covered Fiscal Year for Non-CEO NEOs | Year over Year Change in Fair Value of Outstanding and Unvested Equity Awards Granted in Prior Fiscal Years | Change in Fair Value as of Vesting Date of Equity Awards Granted in Prior Fiscal Years that Vested in the Fiscal Year | Total for Non-CEO NEOs | ||||||||||
2025 | $2,976,441 | $3,551,449 | $255,180 | $6,783,069 | ||||||||||
2024 | $1,245,907 | ($163,718) | ($86,338) | $995,850 | ||||||||||
2023 | $1,492,741 | ($185,415) | $90,299 | $1,397,625 | ||||||||||
2022 | $1,032,045 | ($441,736) | ($63,099) | $527,210 | ||||||||||
2021 | $1,166,629 | $352,447 | $78,293 | $1,597,369 | ||||||||||