Pay vs Performance Disclosure
Dec. 31, 2025
USD ($)
Dec. 31, 2024
USD ($)
Dec. 31, 2023
USD ($)
Dec. 31, 2022
USD ($)
Dec. 31, 2021
USD ($)
PAY VERSUS PERFORMANCE
As required by the Dodd-Frank Wall Street Reform and Consumer Protection Act, and Item 402(v) of Regulation
S-K,
we are providing the following information about the relationship between total compensation actually paid to Matthew Moschner, our President and Chief Executive Officer, Robert J. Willett, our former President and Chief Executive Officer, and our named executive officers (as calculated in accordance with Item 402(v) of Regulation S-K)
and certain financial performance measures. Year |
Summary compensation table total for Mr. Moschner (1) |
Summary compensation table total for Mr. Willett (2) |
Compensation actually paid to Mr. Moschner (1)(3) |
Compensation actually paid to Mr. Willett (2)(3) |
Average summary compensation table total for non-CEO named executive officers (NEOs) (4) |
Average compensation actually paid for non-CEO NEOs (4)(5)(6) |
Value of initial fixed $100 investment based on: |
Net Income |
Adjusted EBITDA % (8) |
Operating Margin % (9) |
||||||||||||||||||||||||||||||||||
Total shareholder return (TSR) (7) |
Peer group TSR (7) |
|||||||||||||||||||||||||||||||||||||||||||
2025 |
$ | 8,099,369 | $ | 8,236,297 | $ | 10,018,696 | $ | 8,261,301 | $ | 2,992,406 | $ | 3,188,723 | $ | 46.23 | $ | 125.35 | $ | 114,442,000 | 21.5 | % | N/A | |||||||||||||||||||||||
2024 |
N/A | $ | 7,910,823 | N/A | $ | 3,119,917 | $ | 2,091,456 | $ | 1,141,732 | $ | 69.20 | $ | 114.14 | $ | 106,171,000 | 17.1 | % | N/A | |||||||||||||||||||||||||
2023 |
N/A | $ | 6,959,914 | N/A | $ | 3,092,562 | $ | 2,377,635 | $ | 1,313,623 | $ | 79.95 | $ | 129.10 | $ | 113,234,000 | N/A | 15.6 | % | |||||||||||||||||||||||||
2022 |
N/A | $ | 7,257,424 | N/A | $ | (3,658,243 | ) | $ | 2,596,662 | $ | (2,512,158 | ) | $ | 89.67 | $ | 100.58 | $ | 215,525,000 | N/A | 24.4 | % | |||||||||||||||||||||||
2021 |
N/A | $ | 10,534,520 | N/A | $ | 9,476,831 | $ | 1,019,293 | $ | 1,022,790 | $ | 147.25 | $ | 165.34 | $ | 279,881,000 | N/A | 30.4 | % | |||||||||||||||||||||||||
| (1) | Mr. Moschner was appointed President and Chief Executive Officer of Cognex effective June 27, 2025, following his February 20, 2025 promotion from Senior Vice President to President and Chief Operating Officer. |
| (2) | Robert J. Willett served as Chief Executive Officer throughout all of 2021, 2022, 2023, and 2024, and continued in that role until June 27, 2025. |
| (3) | Mr. Moschner’s and Mr. Willett’s compensation “actually paid” as presented above is calculated by deducting and adding the following amounts, in each case in accordance with Item 402(v)(2)(C) of Regulation S-K: |
2025 |
||||||||||||||||||||||||
CEO Compensation “Actually Paid” |
Mr. Moschner |
Mr. Willett |
2024 |
2023 |
2022 |
2021 |
||||||||||||||||||
Summary Compensation Table total for the covered fiscal year |
$ | 8,099,369 | $ | 8,236,297 | $ | 7,910,823 | $ | 6,959,914 | $ | 7,257,424 | $ | 10,534,520 | ||||||||||||
Less, Grant date fair value of awards reported in the Summary Compensation Table for the covered fiscal year |
$ | 6,499,951 | $ | 7,000,816 | $ | 6,500,024 | $ | 6,198,638 | $ | 6,200,799 | $ | 6,187,056 | ||||||||||||
Plus, Year-end fair value of awards granted for the covered fiscal year that were outstanding and unvested as of the end of the covered fiscal year |
$ | 8,499,806 | $ | 8,102,963 | $ | 4,783,447 | $ | 4,188,941 | $ | 3,294,711 | $ | 4,781,517 | ||||||||||||
Plus, Change in fair value of awards granted in prior years that were outstanding and unvested as of the end of the covered fiscal year (from prior fiscal year-end to covered fiscal year-end) |
$ | (80,811 | ) | $ | (829,439 | ) | $ | (2,637,666 | ) | $ | (2,154,769 | ) | $ | (6,805,316 | ) | $ | (363,960 | ) | ||||||
Plus, Change in fair value of awards granted in prior years that vested in the covered fiscal year (from prior fiscal year-end to vesting date) |
$ | 283 | $ | (247,704 | ) | $ | (436,663 | ) | $ | 297,114 | $ | (1,204,263 | ) | $ | 711,810 | |||||||||
Total Adjustments |
$ | 1,919,327 | $ | 25,004 | $ | (4,790,906 | ) | $ | (3,867,352 | ) | $ | (10,915,667 | ) | $ | (1,057,689 | ) | ||||||||
| (4) | In 2021, 2022, 2023, 2024, and 2025, neither our CEO nor any non-CEO NEO had any awards that vested in the same year that they were granted, any awards granted in prior years that failed to meet the applicable vesting conditions, or any dividends or other earnings paid on equity awards in the covered fiscal year prior to vesting that are not reflected in total compensation for the applicable year, and therefore, no adjustments for those items were included in calculating compensation “actually paid.” Further, in 2021, 2022, 2023, 2024, and 2025 neither our CEO nor any non-CEO NEO received any benefit under any defined benefit and actuarial plans and therefore, no adjustments for those items were included in calculating compensation “actually paid.” |
| (5) | Our non-CEO NEOs for each of the fiscal years presented above were: |
| • | 2025: Dennis Fehr, Carl W. Gerst III, Sheila M. DiPalma, and Joerg Kuechen |
| • | 2024: Dennis Fehr, Laura A. MacDonald, Paul D. Todgham, Carl W. Gerst III, Sheila M. DiPalma, and Joerg Kuechen |
| • | 2023: Paul D. Todgham, Carl W. Gerst III, Sheila M. DiPalma and Joerg Kuechen |
| • | 2022: Paul D. Todgham, Carl W. Gerst III, Sheila M. DiPalma and Joerg Kuechen |
| • | 2021: Robert J. Shillman, Paul D. Todgham, Carl W. Gerst III and Sheila M. DiPalma |
| (6) | Average non-CEO NEO compensation “actually paid” as presented above is calculated by deducting and adding the following amounts, in each case in accordance with Item 402(v)(2)(C) of Regulation S-K: |
Average Non-CEO Compensation “Actually Paid” |
2025 |
2024 |
2023 |
2022 |
2021 |
|||||||||||||||
Summary Compensation Table total for the covered fiscal year |
$ | 2,992,406 | $ | 2,091,456 | $ | 2,377,635 | $ | 2,596,662 | $ | 1,019,293 | ||||||||||
Less, Grant date fair value of awards reported in the Summary Compensation Table for the covered fiscal year |
$ | 2,187,792 | $ | 1,600,028 | $ | 2,003,523 | $ | 2,158,091 | $ | 373,852 | ||||||||||
Plus, Year-end fair value of awards granted for the covered fiscal year that were outstanding and unvested as of the end of the covered fiscal year |
$ | 2,532,067 | $ | 1,228,049 | $ | 1,564,037 | $ | 1,382,138 | $ | 297,237 | ||||||||||
Plus, Change in fair value of awards granted in prior years that were outstanding and unvested as of the end of the covered fiscal year (from prior fiscal year-end to covered fiscal year-end) |
$ | (69,777 | ) | $ | (453,064 | ) | $ | (662,444 | ) | $ | (3,519,480 | ) | $ | (183,252 | ) | |||||
Plus, Change in fair value of awards granted in prior years that vested in the covered fiscal year (from prior fiscal year-end to vesting date) |
$ | (78,181 | ) | $ | (124,681 | ) | $ | 37,918 | $ | (813,386 | ) | $ | 263,363 | |||||||
Total Adjustments |
$ | 196,317 | $ | (949,724 | ) | $ | (1,064,012 | ) | $ | (5,108,820 | ) | $ | 3,497 | |||||||
| (7) | Total shareholder return (“TSR”) of Cognex and the peer group are calculated by assuming that an investment of $100 was made in each of our common stock and in the Nasdaq Lab Apparatus & Analytical, Optical, Measuring & Controlling Instrument (SIC 3820-3829 US Companies) Index (“Peer Index”) starting from the market close on December 31, 2020, which is the last trading day before our fiscal year 2021, through and including the end of each fiscal year shown. Total shareholder return includes reinvestment of dividends into shares of common stock of the applicable company. Data for the Peer Index was provided to Cognex by Research Data Group, Inc. |
| (8) | Adjusted Earnings Before Interest, Taxes, Depreciation, and Amortization (“Adjusted EBITDA”) percentage is defined as operating income as a percentage of revenue adjusted for amortization of acquisition-related intangible assets and depreciation, as well as, if applicable, restructuring charges, reorganization charges, acquisition and integration costs and one-time discrete events, such as loss or recovery related to a fire. While we consider numerous financial and non-financial performance measures for the purpose of evaluating and determining executive compensation, for 2024 and 2025, we considered Adjusted EBITDA percentage, which is a primary factor used to determine annual cash incentive compensation for our NEOs, to be the most important performance measure used to link compensation “actually paid” to the NEOs to company performance. Prior to 2024, we used operating margin as a similar metric. The company switched to Adjusted EBITDA percentage to provide consistency between our internal and external metrics. Prior to 2024, we did not use Adjusted EBITDA percentage as a performance metric in our compensation program. |
| (9) | Operating margin is defined as our operating income as a percentage of revenue. While we consider numerous financial and non-financial performance measures for the purpose of evaluating and determining executive compensation, for 2023, 2022, and 2021, we considered operating margin, which was a primary factor used to determine annual cash incentive compensation for our NEOs, to be the most important performance measure used to link compensation “actually paid” to the NEOs to company performance. |
| (5) | Our non-CEO NEOs for each of the fiscal years presented above were: |
| • | 2025: Dennis Fehr, Carl W. Gerst III, Sheila M. DiPalma, and Joerg Kuechen |
| • | 2024: Dennis Fehr, Laura A. MacDonald, Paul D. Todgham, Carl W. Gerst III, Sheila M. DiPalma, and Joerg Kuechen |
| • | 2023: Paul D. Todgham, Carl W. Gerst III, Sheila M. DiPalma and Joerg Kuechen |
| • | 2022: Paul D. Todgham, Carl W. Gerst III, Sheila M. DiPalma and Joerg Kuechen |
| • | 2021: Robert J. Shillman, Paul D. Todgham, Carl W. Gerst III and Sheila M. DiPalma |
| (7) | Total shareholder return (“TSR”) of Cognex and the peer group are calculated by assuming that an investment of $100 was made in each of our common stock and in the Nasdaq Lab Apparatus & Analytical, Optical, Measuring & Controlling Instrument (SIC 3820-3829 US Companies) Index (“Peer Index”) starting from the market close on December 31, 2020, which is the last trading day before our fiscal year 2021, through and including the end of each fiscal year shown. Total shareholder return includes reinvestment of dividends into shares of common stock of the applicable company. Data for the Peer Index was provided to Cognex by Research Data Group, Inc. |
| (3) | Mr. Moschner’s and Mr. Willett’s compensation “actually paid” as presented above is calculated by deducting and adding the following amounts, in each case in accordance with Item 402(v)(2)(C) of Regulation S-K: |
2025 |
||||||||||||||||||||||||
CEO Compensation “Actually Paid” |
Mr. Moschner |
Mr. Willett |
2024 |
2023 |
2022 |
2021 |
||||||||||||||||||
Summary Compensation Table total for the covered fiscal year |
$ | 8,099,369 | $ | 8,236,297 | $ | 7,910,823 | $ | 6,959,914 | $ | 7,257,424 | $ | 10,534,520 | ||||||||||||
Less, Grant date fair value of awards reported in the Summary Compensation Table for the covered fiscal year |
$ | 6,499,951 | $ | 7,000,816 | $ | 6,500,024 | $ | 6,198,638 | $ | 6,200,799 | $ | 6,187,056 | ||||||||||||
Plus, Year-end fair value of awards granted for the covered fiscal year that were outstanding and unvested as of the end of the covered fiscal year |
$ | 8,499,806 | $ | 8,102,963 | $ | 4,783,447 | $ | 4,188,941 | $ | 3,294,711 | $ | 4,781,517 | ||||||||||||
Plus, Change in fair value of awards granted in prior years that were outstanding and unvested as of the end of the covered fiscal year (from prior fiscal year-end to covered fiscal year-end) |
$ | (80,811 | ) | $ | (829,439 | ) | $ | (2,637,666 | ) | $ | (2,154,769 | ) | $ | (6,805,316 | ) | $ | (363,960 | ) | ||||||
Plus, Change in fair value of awards granted in prior years that vested in the covered fiscal year (from prior fiscal year-end to vesting date) |
$ | 283 | $ | (247,704 | ) | $ | (436,663 | ) | $ | 297,114 | $ | (1,204,263 | ) | $ | 711,810 | |||||||||
Total Adjustments |
$ | 1,919,327 | $ | 25,004 | $ | (4,790,906 | ) | $ | (3,867,352 | ) | $ | (10,915,667 | ) | $ | (1,057,689 | ) | ||||||||
| (6) | Average non-CEO NEO compensation “actually paid” as presented above is calculated by deducting and adding the following amounts, in each case in accordance with Item 402(v)(2)(C) of Regulation S-K: |
Average Non-CEO Compensation “Actually Paid” |
2025 |
2024 |
2023 |
2022 |
2021 |
|||||||||||||||
Summary Compensation Table total for the covered fiscal year |
$ | 2,992,406 | $ | 2,091,456 | $ | 2,377,635 | $ | 2,596,662 | $ | 1,019,293 | ||||||||||
Less, Grant date fair value of awards reported in the Summary Compensation Table for the covered fiscal year |
$ | 2,187,792 | $ | 1,600,028 | $ | 2,003,523 | $ | 2,158,091 | $ | 373,852 | ||||||||||
Plus, Year-end fair value of awards granted for the covered fiscal year that were outstanding and unvested as of the end of the covered fiscal year |
$ | 2,532,067 | $ | 1,228,049 | $ | 1,564,037 | $ | 1,382,138 | $ | 297,237 | ||||||||||
Plus, Change in fair value of awards granted in prior years that were outstanding and unvested as of the end of the covered fiscal year (from prior fiscal year-end to covered fiscal year-end) |
$ | (69,777 | ) | $ | (453,064 | ) | $ | (662,444 | ) | $ | (3,519,480 | ) | $ | (183,252 | ) | |||||
Plus, Change in fair value of awards granted in prior years that vested in the covered fiscal year (from prior fiscal year-end to vesting date) |
$ | (78,181 | ) | $ | (124,681 | ) | $ | 37,918 | $ | (813,386 | ) | $ | 263,363 | |||||||
Total Adjustments |
$ | 196,317 | $ | (949,724 | ) | $ | (1,064,012 | ) | $ | (5,108,820 | ) | $ | 3,497 | |||||||
The following chart shows the relationship between the compensation “actually paid” (“CAP”) to our CEO, CAP to our
non-CEO
NEOs, Cognex’s TSR, and the Peer Index TSR. 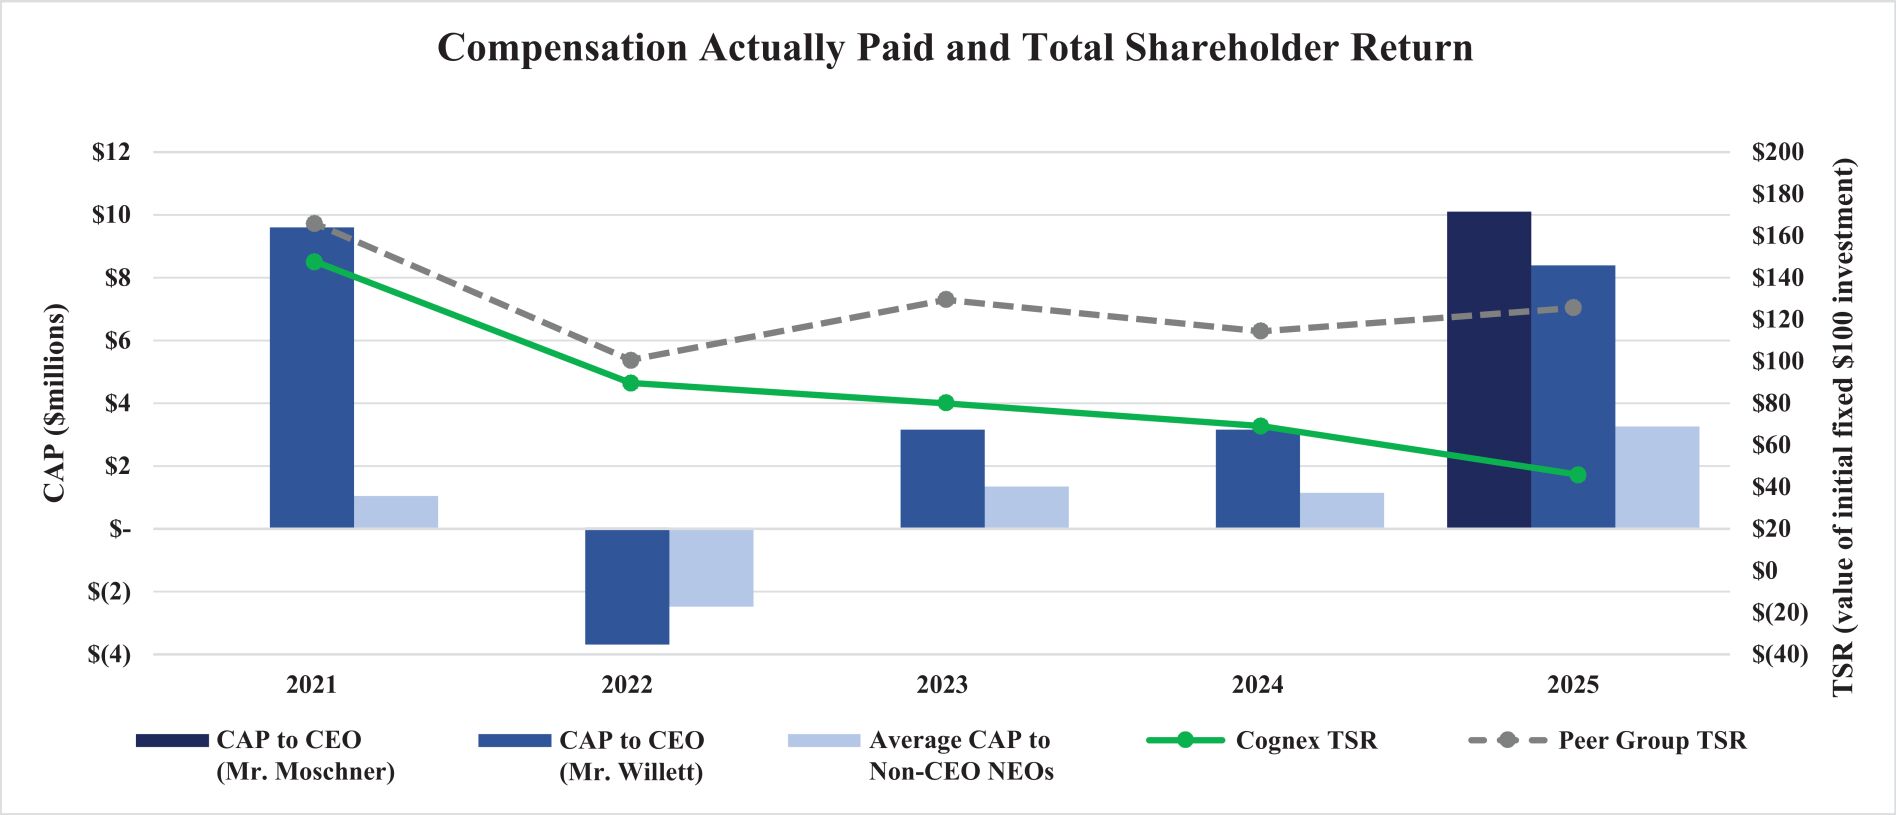
The following chart shows the relationship between CAP to our CEO, CAP to our
non-CEO
NEOs, and Cognex’s net income. 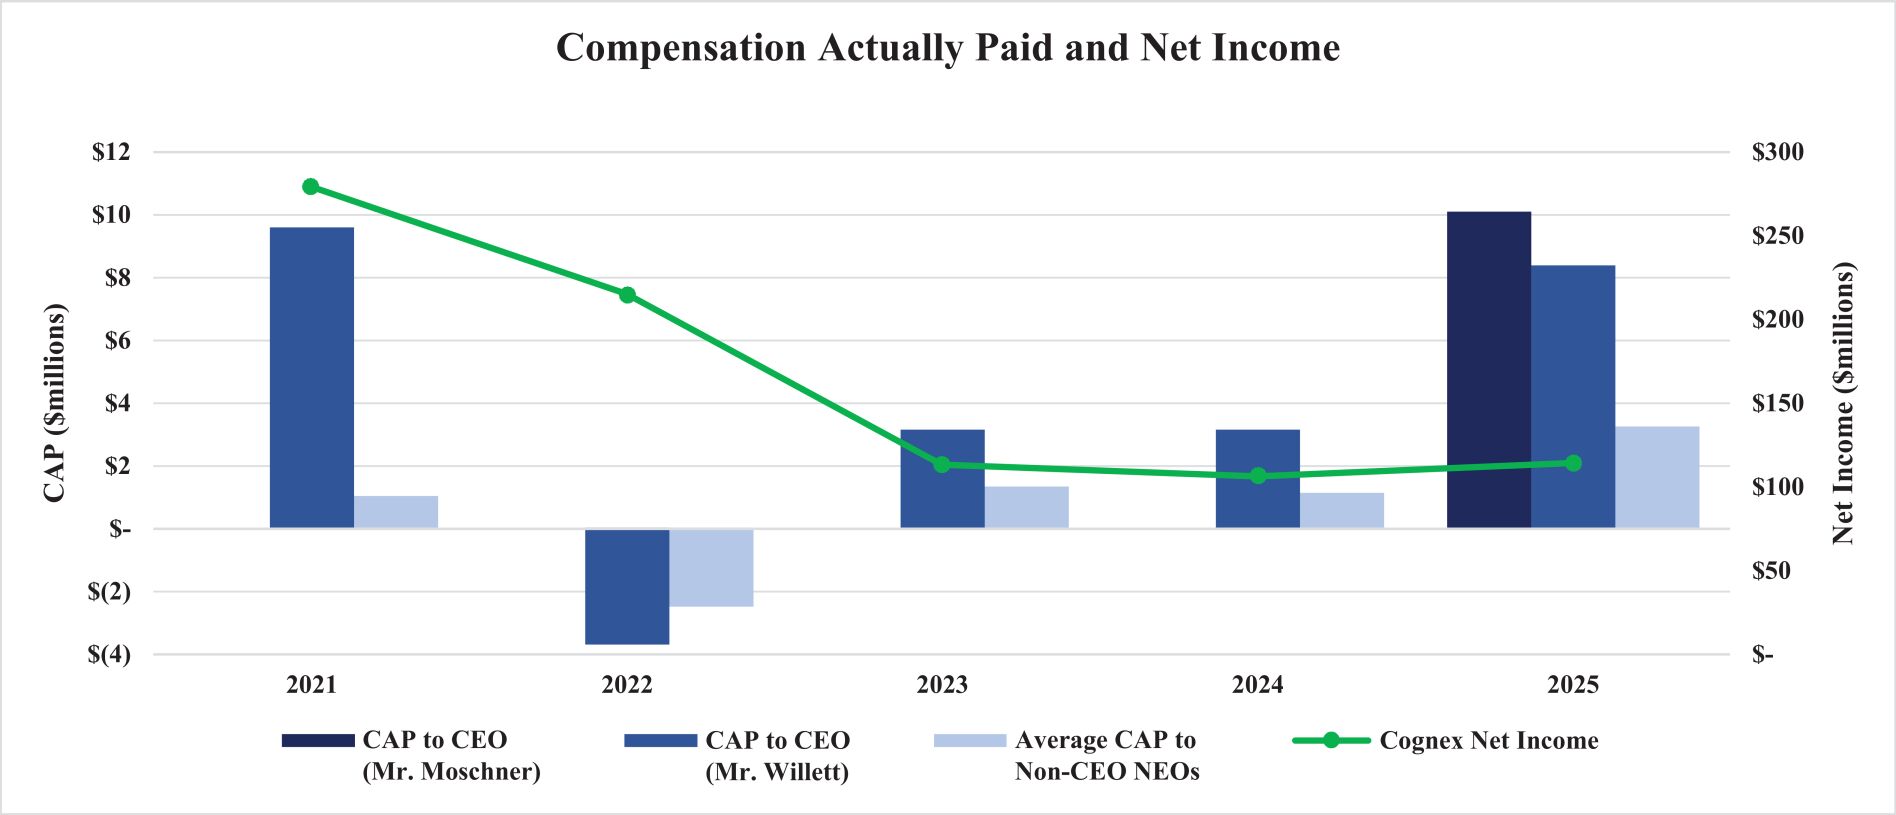
The following chart shows the relationship between CAP to our CEO, CAP to our
non-CEO
NEOs, and Cognex’s most important performance measure for determining incentive compensation, which was operating margin for the years 2021, 2022, and 2023, and adjusted EBITDA for the years 2024, and 2025. 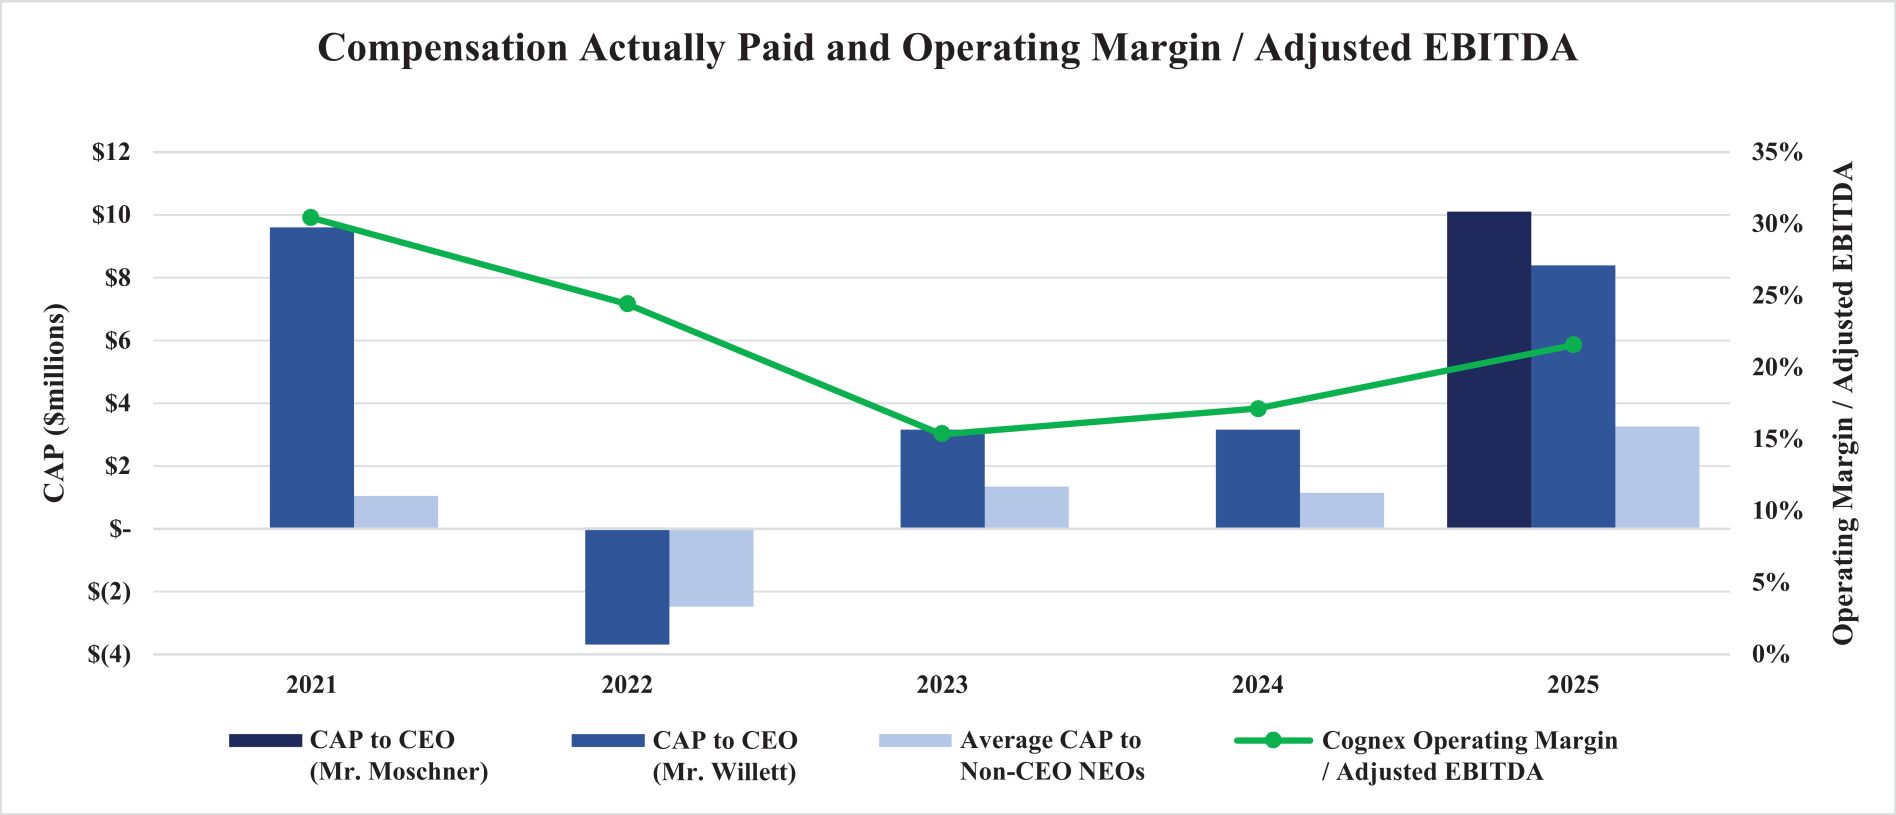
The following chart shows the relationship between the compensation “actually paid” (“CAP”) to our CEO, CAP to our
non-CEO
NEOs, Cognex’s TSR, and the Peer Index TSR. Tabular List of Most Important Financial Performance Measures
For Mr. Moschner, the financial performance measures that the company has determined are most important to link his compensation actually paid to the company’s performance in the last completed fiscal year are:
| • | revenue; |
| • | operating income; and |
| • | adjusted EBITDA. |
For Mr. Willett, the financial performance measures that the company has determined are most important to link his compensation actually paid to the company’s performance in the last completed fiscal year are:
| • | revenue; |
| • | operating income; |
| • | adjusted EBITDA; and |
| • | relative TSR. |
For our
non-CEO
NEOs, the financial performance measures that the company has determined are most important to link compensation actually paid to the company’s performance in the last completed fiscal year are: | • | revenue; |
| • | operating income; and |
| • | adjusted EBITDA. |