Value of Initial Fixed | ||||||||||||||||||||||||||||||
Average | $100 Investment | |||||||||||||||||||||||||||||
Summary | Average | Based on: | ||||||||||||||||||||||||||||
Comp. | comp. | Comp. | Healthpeak | Peer | ||||||||||||||||||||||||||
Summary Comp. | Summary Comp. | Actually | Table Total | Actually | Total | Total | ||||||||||||||||||||||||
Table Total | Comp. Actually | Table Total for | Paid to | Paid to | Paid to | Stock- | Stock- | Net | Normalized | |||||||||||||||||||||
for CEO | Paid to CEO | Former CEO | Former CEO | Non-PEO | Non-PEO | Holder | Holder | Income | FFO Per | |||||||||||||||||||||
Year | | (Mr. Brinker)(1)(2) | | (Mr. Brinker)(3) | | (Mr. Herzog)(1)(2) | | (Mr. Herzog)(3) | | NEOs(1)(2) | | NEOs(3) | | Return(4) | | Return(4) | | (in Millions)(5) | | Share(6) | ||||||||||
2025 |
| $ | 10,072,994 |
| $ | 3,346,104 | — | — | $ | 2,792,186 |
| $ | 1,016,898 |
| $ | 69.25 |
| $ | 126.72 |
| $ | 101.03 |
| $ | 1.84 | |||||
2024 |
| $ | 8,465,882 |
| $ | 10,253,081 | — | — | $ | 3,279,881 |
| $ | 3,804,968 |
| $ | 75.37 |
| $ | 117.56 |
| $ | 267.30 |
| $ | 1.81 | |||||
2023 |
| $ | 7,692,510 |
| $ | 2,500,263 | — | — | $ | 3,003,451 |
| $ | 1,549,751 |
| $ | 69.24 |
| $ | 112.04 |
| $ | 334.76 |
| $ | 1.78 | |||||
2022 |
| $ | 5,557,084 |
| $ | 2,901,565 | $ | 24,308,605 | $ | 19,911,300 | $ | 3,267,762 |
| $ | 1,959,250 |
| $ | 82.83 |
| $ | 100.62 |
| $ | 516.42 |
| $ | 1.73 | |||
2021 |
| — |
| — | $ | 11,713,883 | $ | 17,397,357 | $ | 3,767,688 |
| $ | 5,579,450 |
| $ | 114.25 |
| $ | 134.06 |
| $ | 525.93 |
| $ | 1.60 | |||||
| (1) | In accordance with applicable SEC rules, since Mr. Brinker and Mr. Herzog each served as PEO during covered fiscal years, they are each included in the table above and the footnotes that follow the table as a PEO for the fiscal years in which they served in such capacity. For 2021, our Non-PEO NEOs were Messrs. Brinker, Scott, Klaritch, and McHenry. For 2022, our Non-PEO NEOs were Messrs. Scott, Klaritch, Bohn, Mabry, and McHenry. For 2023, our Non-PEO NEOs were Messrs. Scott, Klaritch, Bohn, and Patadia. For 2024, our Non-PEO NEOs were Messrs. Scott, Klaritch, Bohn, and Mabry. For 2025, our Non-PEO NEOs were Messrs. Moses, Mabry, Bohn, and Ms. Porter. |
| (2) | See the Summary Compensation Table above, and the Summary Compensation Table as disclosed in our proxy statement filed with the SEC in calendar year 2025, for detail on the Summary Compensation Table total compensation for each CEO for each fiscal year covered in the table. The average compensation for the Non-PEO NEOs for 2025 was calculated from the Summary Compensation Table above. The average compensation for the Non-PEO NEOs for each of 2024, 2023, 2022, and 2021 was calculated from the Summary Compensation Table as disclosed in our Proxy Statement filed with the SEC in calendar year 2025, 2024, 2023, or 2022, respectively. |
| (3) | For purposes of this table, the compensation actually paid (also referred to as “CAP”) to each of our NEOs (including, for purposes of this table, former executive officers who are included in the Non-PEO NEO group for 2021, 2022, 2023, 2024 and 2025) is defined by the SEC and means each NEO’s total compensation as reflected in the Summary Compensation Table for the applicable fiscal year and adjusted as shown below. |
No stock options were granted, and no unvested stock options were outstanding, during the applicable fiscal years. There were no material modifications to any stock awards during the applicable fiscal years. In making each of these adjustments, the “value” of a stock award is the fair value of the award on the applicable date determined in accordance with FASB ASC Topic 718 using the valuation assumptions we then used to calculate the fair value of our equity awards. For more information on the valuation of our equity awards, see the notes to our financial statements that appear in our Annual Report on Form 10-K each fiscal year and the footnotes to the Summary Compensation Table that appears in our annual Proxy Statement. The table above reflects the CAP (determined as noted above) for each CEO and, for our Non-PEO NEOs, the average of the CAPs determined for the Non-PEO NEOs for each of the fiscal years shown in the table.
The following tables provide reconciliations of the Summary Compensation Table Total to Compensation Actually Paid for each of Mr. Brinker, our President and CEO, and Mr. Herzog, our former CEO. We believe the values reflected under Compensation Actually Paid (CAP) as presented herein may not provide an accurate reflection of the compensation we actually pay to our NEOs on a year-over-year basis for several reasons, particularly with respect to the transition in CEOs over the five-year period and timing of corresponding pay adjustments in terms of promoting Mr. Brinker to CEO.
Reconciliation of Summary Compensation Table Total to | Fiscal Year | Fiscal Year | Fiscal Year | Fiscal Year | Fiscal Year | |||||
Compensation Actually Paid for CEO (Mr. Brinker) | | 2025 ($) | | 2024 ($) | | 2023 ($) | | 2022 ($) | | 2021 ($) |
Summary Compensation Table Total |
| 10,072,994 |
| 8,465,882 |
| 7,692,510 |
| 5,557,084 |
| — |
Grant Date Fair Value of Stock Awards Granted in Fiscal Year | (7,208,688) | (5,714,406) | (5,204,310) | (3,134,399) | — | |||||
Fair Value at Fiscal Year-End of Outstanding and Unvested Stock Awards Granted in Fiscal Year |
| 4,097,425 |
| 6,903,188 |
| 2,997,838 |
| 2,541,379 |
| — |
Change in Fair Value of Outstanding and Unvested Stock Awards Granted in Prior Fiscal Years |
| (4,052,476) |
| 290,155 |
| (2,282,005) |
| (2,232,034) |
| — |
Fair Value at Vesting of Stock Awards Granted in Fiscal Year That Vested During Fiscal Year |
| — |
| — |
| — |
| 402,297 |
| — |
Change in Fair Value as of Vesting Date of Stock Awards Granted in Prior Fiscal Years For Which Applicable Vesting Conditions Were Satisfied During Fiscal Year |
| (94,518) |
| (29,362) |
| (960,951) |
| (445,419) |
| — |
Fair Value as of Prior Fiscal Year-End of Stock Awards Granted in Prior Fiscal Years That Failed to Meet Applicable Vesting Conditions During Fiscal Year | — | — | — | — | — | |||||
Dividends Paid on Outstanding and Unvested Stock Awards |
| 531,367 |
| 337,624 |
| 257,182 |
| 212,657 |
| — |
Compensation Actually Paid |
| 3,346,104 |
| 10,253,081 |
| 2,500,263 |
| 2,901,565 |
| — |
Reconciliation of Summary Compensation Table Total to | Fiscal Year | Fiscal Year | Fiscal Year | Fiscal Year | Fiscal Year | |||||
Compensation Actually Paid for Former CEO (Mr. Herzog) | | 2025 ($) | | 2024 ($) | | 2023 ($) | | 2022 ($) | | 2021 ($) |
Summary Compensation Table Total |
| — |
| — |
| — |
| 24,308,605 |
| 11,713,883 |
Grant Date Fair Value of Stock Awards Granted in Fiscal Year | — | — | — | (7,374,832) | (7,102,283) | |||||
Fair Value at Fiscal Year-End of Outstanding and Unvested Stock Awards Granted in Fiscal Year |
| — |
| — |
| — |
| 5,979,535 |
| 8,283,835 |
Change in Fair Value of Outstanding and Unvested Stock Awards Granted in Prior Fiscal Years |
| — |
| — |
| — |
| (3,306,057) |
| 3,328,563 |
Fair Value at Vesting of Stock Awards Granted in Fiscal Year That Vested During Fiscal Year |
| — |
| — |
| — |
| 685,203 |
| 751,962 |
Change in Fair Value as of Vesting Date of Stock Awards Granted in Prior Fiscal Years For Which Applicable Vesting Conditions Were Satisfied During Fiscal Year |
| — |
| — |
| — |
| (611,707) |
| 224,226 |
Fair Value as of Prior Fiscal Year-End of Stock Awards Granted in Prior Fiscal Years That Failed to Meet Applicable Vesting Conditions During Fiscal Year | — | — | — | — | — | |||||
Dividends Paid on Outstanding and Unvested Stock Awards |
| — |
| — |
| — |
| 230,553 |
| 197,171 |
Compensation Actually Paid |
| — |
| — |
| — |
| 19,911,300 |
| 17,397,357 |
The following table provides a reconciliation of the average of the Summary Compensation Table Total for the Non-PEO NEOs for a fiscal year to the average of the Compensation Actually Paid for the Non-PEO NEOs for that fiscal year.
Reconciliation of Average Summary Compensation Table | Fiscal Year | Fiscal Year | Fiscal Year | Fiscal Year | Fiscal Year | |||||
Total to Average Compensation Actually Paid for Non-PEO NEOs | | 2025 ($) | | 2024 ($) | | 2023 ($) | | 2022 ($) | | 2021 ($) |
Summary Compensation Table Total |
| 2,792,186 |
| 3,279,881 |
| 3,003,451 |
| 3,267,762 |
| 3,767,688 |
Grant Date Fair Value of Stock Awards Granted in Fiscal Year | (1,640,620) | (1,452,864) | (1,387,525) | (1,535,477) | (1,718,594) | |||||
Fair Value at Fiscal Year-End of Outstanding and Unvested Stock Awards Granted in Fiscal Year |
| 771,717 |
| 1,755,106 |
| 822,314 |
| 1,087,331 |
| 2,004,500 |
Change in Fair Value of Outstanding and Unvested Stock Awards Granted in Prior Fiscal Years |
| (435,883) |
| 112,401 |
| (671,242) |
| (368,699) |
| 1,104,314 |
Fair Value at Vesting of Stock Awards Granted in Fiscal Year That Vested During Fiscal Year |
| — |
| — |
| — |
| 103,198 |
| 249,639 |
Change in Fair Value as of Vesting Date of Stock Awards Granted in Prior Fiscal Years For Which Applicable Vesting Conditions Were Satisfied During Fiscal Year |
| (20,500) |
| 6,808 |
| (292,301) |
| (132,238) |
| 59,047 |
Fair Value as of Prior Fiscal Year-End of Stock Awards Granted in Prior Fiscal Years That Failed to Meet Applicable Vesting Conditions During Fiscal Year | (543,670) | — | — | (516,184) | — | |||||
Dividends Paid on Outstanding and Unvested Stock Awards |
| 93,668 |
| 103,636 |
| 75,053 |
| 53,557 |
| 112,856 |
Compensation Actually Paid |
| 1,016,898 |
| 3,804,968 |
| 1,549,751 |
| 1,959,250 |
| 5,579,450 |
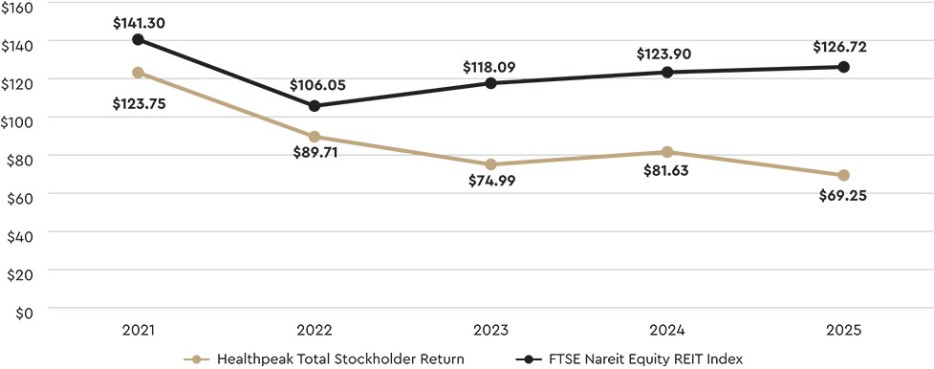
| (4) | Healthpeak TSR represents cumulative total stockholder return on a fixed investment of $100 in our common stock for the period beginning at the close of trading on the last trading day of 2020 through the end of the applicable fiscal year, and is calculated assuming the reinvestment of dividends before consideration of income taxes. Peer total stockholder return represents cumulative total stockholder return on a fixed investment of $100 in the Equity REIT Index of Nareit for the period beginning at the close of trading on the last trading day of 2020 through the end of the applicable fiscal year, and is calculated assuming the reinvestment of dividends before consideration of income taxes. |
The following chart illustrates our TSR for each of the last four fiscal years against our TSR and the TSR for the Equity REIT Index of Nareit, or the FTSE Nareit Equity REIT Index (each calculated as described above) over that period of time.
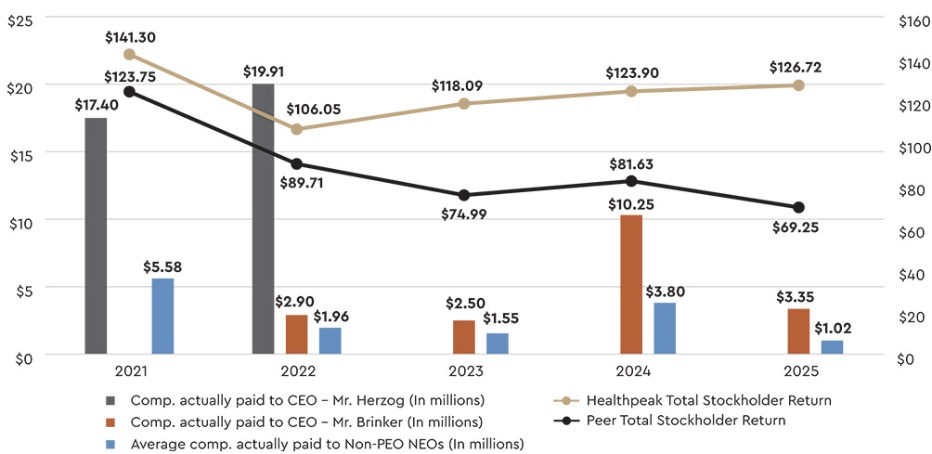
The following chart illustrates the CAP for each CEO and the average CAP for our Non-PEO NEOs for each of the last four fiscal years against our TSR and the TSR for the Equity REIT Index of Nareit (each calculated as described above) over that period of time.
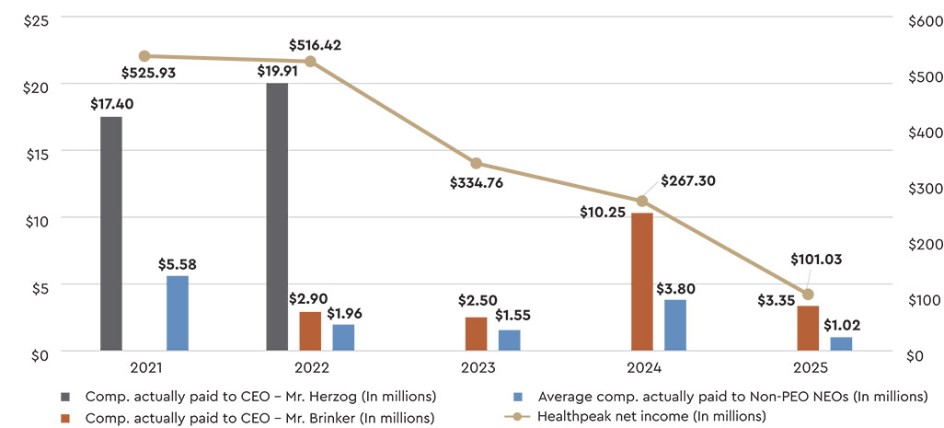
| (5) | This column shows Healthpeak’s net income for each fiscal year covered by the table. The following chart illustrates the CAP for each CEO and the average CAP for our Non-PEO NEOs for each of the last four fiscal years against our net income for each of those years. |
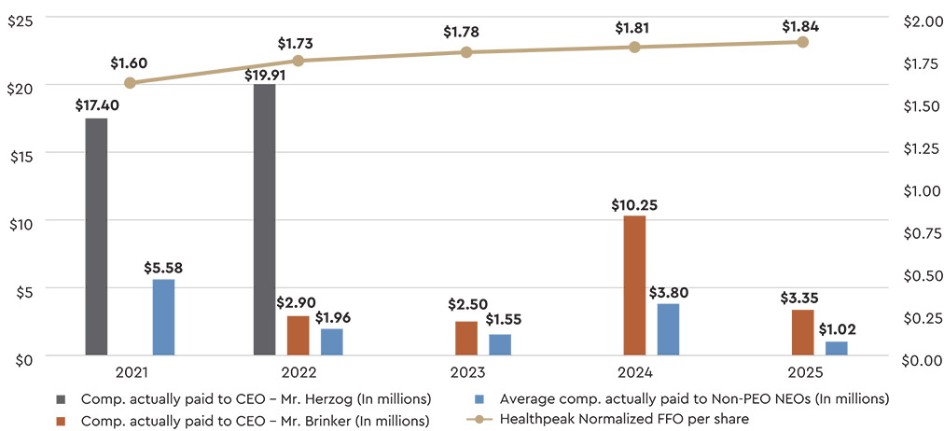
| (6) | This column shows Healthpeak’s Normalized FFO per share for each fiscal year covered by the table. We consider Normalized FFO per share, which we also refer to as FFO as Adjusted per common share, to be a key metric in our executive compensation program; see the Compensation Discussion and Analysis section of this proxy statement for more information regarding the use of this performance measure. For the definition and reconciliation of Normalized FFO per share to the most directly comparable GAAP measure, see Appendix A. The following chart illustrates the CAP for each CEO and the average CAP for our Non-PEO NEOs for each of the last four fiscal years against our Normalized FFO per share for each of those years. |
Value of Initial Fixed | ||||||||||||||||||||||||||||||
Average | $100 Investment | |||||||||||||||||||||||||||||
Summary | Average | Based on: | ||||||||||||||||||||||||||||
Comp. | comp. | Comp. | Healthpeak | Peer | ||||||||||||||||||||||||||
Summary Comp. | Summary Comp. | Actually | Table Total | Actually | Total | Total | ||||||||||||||||||||||||
Table Total | Comp. Actually | Table Total for | Paid to | Paid to | Paid to | Stock- | Stock- | Net | Normalized | |||||||||||||||||||||
for CEO | Paid to CEO | Former CEO | Former CEO | Non-PEO | Non-PEO | Holder | Holder | Income | FFO Per | |||||||||||||||||||||
Year | | (Mr. Brinker)(1)(2) | | (Mr. Brinker)(3) | | (Mr. Herzog)(1)(2) | | (Mr. Herzog)(3) | | NEOs(1)(2) | | NEOs(3) | | Return(4) | | Return(4) | | (in Millions)(5) | | Share(6) | ||||||||||
2025 |
| $ | 10,072,994 |
| $ | 3,346,104 | — | — | $ | 2,792,186 |
| $ | 1,016,898 |
| $ | 69.25 |
| $ | 126.72 |
| $ | 101.03 |
| $ | 1.84 | |||||
2024 |
| $ | 8,465,882 |
| $ | 10,253,081 | — | — | $ | 3,279,881 |
| $ | 3,804,968 |
| $ | 75.37 |
| $ | 117.56 |
| $ | 267.30 |
| $ | 1.81 | |||||
2023 |
| $ | 7,692,510 |
| $ | 2,500,263 | — | — | $ | 3,003,451 |
| $ | 1,549,751 |
| $ | 69.24 |
| $ | 112.04 |
| $ | 334.76 |
| $ | 1.78 | |||||
2022 |
| $ | 5,557,084 |
| $ | 2,901,565 | $ | 24,308,605 | $ | 19,911,300 | $ | 3,267,762 |
| $ | 1,959,250 |
| $ | 82.83 |
| $ | 100.62 |
| $ | 516.42 |
| $ | 1.73 | |||
2021 |
| — |
| — | $ | 11,713,883 | $ | 17,397,357 | $ | 3,767,688 |
| $ | 5,579,450 |
| $ | 114.25 |
| $ | 134.06 |
| $ | 525.93 |
| $ | 1.60 | |||||
| (1) | In accordance with applicable SEC rules, since Mr. Brinker and Mr. Herzog each served as PEO during covered fiscal years, they are each included in the table above and the footnotes that follow the table as a PEO for the fiscal years in which they served in such capacity. For 2021, our Non-PEO NEOs were Messrs. Brinker, Scott, Klaritch, and McHenry. For 2022, our Non-PEO NEOs were Messrs. Scott, Klaritch, Bohn, Mabry, and McHenry. For 2023, our Non-PEO NEOs were Messrs. Scott, Klaritch, Bohn, and Patadia. For 2024, our Non-PEO NEOs were Messrs. Scott, Klaritch, Bohn, and Mabry. For 2025, our Non-PEO NEOs were Messrs. Moses, Mabry, Bohn, and Ms. Porter. |
Reconciliation of Average Summary Compensation Table | Fiscal Year | Fiscal Year | Fiscal Year | Fiscal Year | Fiscal Year | |||||
Total to Average Compensation Actually Paid for Non-PEO NEOs | | 2025 ($) | | 2024 ($) | | 2023 ($) | | 2022 ($) | | 2021 ($) |
Summary Compensation Table Total |
| 2,792,186 |
| 3,279,881 |
| 3,003,451 |
| 3,267,762 |
| 3,767,688 |
Grant Date Fair Value of Stock Awards Granted in Fiscal Year | (1,640,620) | (1,452,864) | (1,387,525) | (1,535,477) | (1,718,594) | |||||
Fair Value at Fiscal Year-End of Outstanding and Unvested Stock Awards Granted in Fiscal Year |
| 771,717 |
| 1,755,106 |
| 822,314 |
| 1,087,331 |
| 2,004,500 |
Change in Fair Value of Outstanding and Unvested Stock Awards Granted in Prior Fiscal Years |
| (435,883) |
| 112,401 |
| (671,242) |
| (368,699) |
| 1,104,314 |
Fair Value at Vesting of Stock Awards Granted in Fiscal Year That Vested During Fiscal Year |
| — |
| — |
| — |
| 103,198 |
| 249,639 |
Change in Fair Value as of Vesting Date of Stock Awards Granted in Prior Fiscal Years For Which Applicable Vesting Conditions Were Satisfied During Fiscal Year |
| (20,500) |
| 6,808 |
| (292,301) |
| (132,238) |
| 59,047 |
Fair Value as of Prior Fiscal Year-End of Stock Awards Granted in Prior Fiscal Years That Failed to Meet Applicable Vesting Conditions During Fiscal Year | (543,670) | — | — | (516,184) | — | |||||
Dividends Paid on Outstanding and Unvested Stock Awards |
| 93,668 |
| 103,636 |
| 75,053 |
| 53,557 |
| 112,856 |
Compensation Actually Paid |
| 1,016,898 |
| 3,804,968 |
| 1,549,751 |
| 1,959,250 |
| 5,579,450 |
The following tables provide reconciliations of the Summary Compensation Table Total to Compensation Actually Paid for each of Mr. Brinker, our President and CEO, and Mr. Herzog, our former CEO. We believe the values reflected under Compensation Actually Paid (CAP) as presented herein may not provide an accurate reflection of the compensation we actually pay to our NEOs on a year-over-year basis for several reasons, particularly with respect to the transition in CEOs over the five-year period and timing of corresponding pay adjustments in terms of promoting Mr. Brinker to CEO.
Reconciliation of Summary Compensation Table Total to | Fiscal Year | Fiscal Year | Fiscal Year | Fiscal Year | Fiscal Year | |||||
Compensation Actually Paid for CEO (Mr. Brinker) | | 2025 ($) | | 2024 ($) | | 2023 ($) | | 2022 ($) | | 2021 ($) |
Summary Compensation Table Total |
| 10,072,994 |
| 8,465,882 |
| 7,692,510 |
| 5,557,084 |
| — |
Grant Date Fair Value of Stock Awards Granted in Fiscal Year | (7,208,688) | (5,714,406) | (5,204,310) | (3,134,399) | — | |||||
Fair Value at Fiscal Year-End of Outstanding and Unvested Stock Awards Granted in Fiscal Year |
| 4,097,425 |
| 6,903,188 |
| 2,997,838 |
| 2,541,379 |
| — |
Change in Fair Value of Outstanding and Unvested Stock Awards Granted in Prior Fiscal Years |
| (4,052,476) |
| 290,155 |
| (2,282,005) |
| (2,232,034) |
| — |
Fair Value at Vesting of Stock Awards Granted in Fiscal Year That Vested During Fiscal Year |
| — |
| — |
| — |
| 402,297 |
| — |
Change in Fair Value as of Vesting Date of Stock Awards Granted in Prior Fiscal Years For Which Applicable Vesting Conditions Were Satisfied During Fiscal Year |
| (94,518) |
| (29,362) |
| (960,951) |
| (445,419) |
| — |
Fair Value as of Prior Fiscal Year-End of Stock Awards Granted in Prior Fiscal Years That Failed to Meet Applicable Vesting Conditions During Fiscal Year | — | — | — | — | — | |||||
Dividends Paid on Outstanding and Unvested Stock Awards |
| 531,367 |
| 337,624 |
| 257,182 |
| 212,657 |
| — |
Compensation Actually Paid |
| 3,346,104 |
| 10,253,081 |
| 2,500,263 |
| 2,901,565 |
| — |
Reconciliation of Summary Compensation Table Total to | Fiscal Year | Fiscal Year | Fiscal Year | Fiscal Year | Fiscal Year | |||||
Compensation Actually Paid for Former CEO (Mr. Herzog) | | 2025 ($) | | 2024 ($) | | 2023 ($) | | 2022 ($) | | 2021 ($) |
Summary Compensation Table Total |
| — |
| — |
| — |
| 24,308,605 |
| 11,713,883 |
Grant Date Fair Value of Stock Awards Granted in Fiscal Year | — | — | — | (7,374,832) | (7,102,283) | |||||
Fair Value at Fiscal Year-End of Outstanding and Unvested Stock Awards Granted in Fiscal Year |
| — |
| — |
| — |
| 5,979,535 |
| 8,283,835 |
Change in Fair Value of Outstanding and Unvested Stock Awards Granted in Prior Fiscal Years |
| — |
| — |
| — |
| (3,306,057) |
| 3,328,563 |
Fair Value at Vesting of Stock Awards Granted in Fiscal Year That Vested During Fiscal Year |
| — |
| — |
| — |
| 685,203 |
| 751,962 |
Change in Fair Value as of Vesting Date of Stock Awards Granted in Prior Fiscal Years For Which Applicable Vesting Conditions Were Satisfied During Fiscal Year |
| — |
| — |
| — |
| (611,707) |
| 224,226 |
Fair Value as of Prior Fiscal Year-End of Stock Awards Granted in Prior Fiscal Years That Failed to Meet Applicable Vesting Conditions During Fiscal Year | — | — | — | — | — | |||||
Dividends Paid on Outstanding and Unvested Stock Awards |
| — |
| — |
| — |
| 230,553 |
| 197,171 |
Compensation Actually Paid |
| — |
| — |
| — |
| 19,911,300 |
| 17,397,357 |
The following table provides a reconciliation of the average of the Summary Compensation Table Total for the Non-PEO NEOs for a fiscal year to the average of the Compensation Actually Paid for the Non-PEO NEOs for that fiscal year.
Reconciliation of Average Summary Compensation Table | Fiscal Year | Fiscal Year | Fiscal Year | Fiscal Year | Fiscal Year | |||||
Total to Average Compensation Actually Paid for Non-PEO NEOs | | 2025 ($) | | 2024 ($) | | 2023 ($) | | 2022 ($) | | 2021 ($) |
Summary Compensation Table Total |
| 2,792,186 |
| 3,279,881 |
| 3,003,451 |
| 3,267,762 |
| 3,767,688 |
Grant Date Fair Value of Stock Awards Granted in Fiscal Year | (1,640,620) | (1,452,864) | (1,387,525) | (1,535,477) | (1,718,594) | |||||
Fair Value at Fiscal Year-End of Outstanding and Unvested Stock Awards Granted in Fiscal Year |
| 771,717 |
| 1,755,106 |
| 822,314 |
| 1,087,331 |
| 2,004,500 |
Change in Fair Value of Outstanding and Unvested Stock Awards Granted in Prior Fiscal Years |
| (435,883) |
| 112,401 |
| (671,242) |
| (368,699) |
| 1,104,314 |
Fair Value at Vesting of Stock Awards Granted in Fiscal Year That Vested During Fiscal Year |
| — |
| — |
| — |
| 103,198 |
| 249,639 |
Change in Fair Value as of Vesting Date of Stock Awards Granted in Prior Fiscal Years For Which Applicable Vesting Conditions Were Satisfied During Fiscal Year |
| (20,500) |
| 6,808 |
| (292,301) |
| (132,238) |
| 59,047 |
Fair Value as of Prior Fiscal Year-End of Stock Awards Granted in Prior Fiscal Years That Failed to Meet Applicable Vesting Conditions During Fiscal Year | (543,670) | — | — | (516,184) | — | |||||
Dividends Paid on Outstanding and Unvested Stock Awards |
| 93,668 |
| 103,636 |
| 75,053 |
| 53,557 |
| 112,856 |
Compensation Actually Paid |
| 1,016,898 |
| 3,804,968 |
| 1,549,751 |
| 1,959,250 |
| 5,579,450 |
Following is an unranked list of our financial performance measures we consider most important in linking the compensation actually paid to our NEOs for 2025 with our performance. In addition to the financial performance measures listed below, we view our stock price, upon which the value of all of our LTIP awards is dependent, as a key performance-based component of our executive compensation program in order to further align the interests of our senior management team with the interests of our stockholders.
| ● | Normalized FFO per share (used in our 2025 STIP and Retentive Awards) |
| ● | Net Debt to Adjusted EBITDAre (used in our 2025 STIP and Retentive Awards) |
| ● | Relative TSR (used in our Performance-Based Awards) |