PAY VERSUS PERFORMANCE
In accordance with Item 402(v) of Regulation S-K, we are providing the following information regarding the relationship between compensation of our CEO or Principal Executive Officer (PEO) and NEOs and certain financial performance measures of PSEG for the fiscal years ended on December 31, 2025, 2024, 2023, 2022 and 2021. For further information on PSEG’s pay-for-performance philosophy and how executive compensation aligns with the Company’s performance, refer to the Compensation Discussion and Analysis section of this Proxy Statement.
Year |
|
Summary |
|
Compensation |
|
Summary |
|
Compensation |
|
Average |
|
Average |
|
Value of Initial |
|
Value of Initial |
|
Net Income |
|
Operating |
||||||||||
|
|
|
|
|
|
|
|
|
|
|
|
|
|
|
|
|
|
|
|
|
|
|
|
|
|
|
|
|
|
|
|
|
|
|
|
|
|
|
|
|
|
|
|
|
|
|
|
|
|
|
|
|
|
|
|
|
|
|
|
|
|
2025 |
|
- |
|
|
- |
|
|
13,866,735 |
|
|
11,342,953 |
|
|
3,747,184 |
|
|
3,207,126 |
|
|
162.80 |
|
|
144.69 |
|
|
2,111 |
|
|
4.05 |
|
|
|
|
|
|
|
|
|
|
|
|
|
|
|
|
|
|
|
|
|
|
|
|
|
|
|
|
|
|
|
|
|
|
|
|
|
|
|
|
|
|
|
|
|
|
|
|
|
|
|
|
|
|
|
|
|
|
|
|
|
|
|
2024 |
|
- |
|
|
- |
|
|
12,367,961 |
|
|
31,359,707 |
|
|
3,498,175 |
|
|
7,157,809 |
|
|
165.95 |
|
|
129.21 |
|
|
1,772 |
|
|
3.68 |
|
|
|
|
|
|
|
|
|
|
|
|
|
|
|
|
|
|
|
|
|
|
|
|
|
|
|
|
|
|
|
|
|
|
|
|
|
|
|
|
|
|
|
|
|
|
|
|
|
|
|
|
|
|
|
|
|
|
|
|
|
|
|
2023 |
|
- |
|
|
- |
|
|
11,778,863 |
|
|
12,972,702 |
|
|
3,578,301 |
|
|
3,490,761 |
|
|
116.36 |
|
|
112.19 |
|
|
2,563 |
|
|
3.48 |
|
|
|
|
|
|
|
|
|
|
|
|
|
|
|
|
|
|
|
|
|
|
|
|
|
|
|
|
|
|
|
|
|
|
|
|
|
|
|
|
|
|
|
|
|
|
|
|
|
|
|
|
|
|
|
|
|
|
|
|
|
|
|
2022 |
|
12,869,210 |
|
|
1,495,352 |
|
|
9,510,542 |
|
|
6,408,817 |
|
|
2,733,718 |
|
|
1,371,783 |
|
|
112.30 |
|
|
118.96 |
|
|
1,031 |
|
|
3.47 |
|
|
|
|
|
|
|
|
|
|
|
|
|
|
|
|
|
|
|
|
|
|
|
|
|
|
|
|
|
|
|
|
|
|
|
|
|
|
|
|
|
|
|
|
|
|
|
|
|
|
|
|
|
|
|
|
|
|
|
|
|
|
|
2021 |
|
14,208,674 |
|
|
16,757,115 |
|
|
- |
|
|
- |
|
|
3,834,217 |
|
|
4,311,559 |
|
|
118.33 |
|
|
117.01 |
|
|
(648) |
|
|
3.65 |
|
|
|
|
|
|
|
|
|
|
|
|
|
|
|
|
|
|
|
|
|
|
|
|
|
|
|
|
|
|
|
|
(1) |
NEOs included in these columns reflect the following: |
Year |
PEO#1 |
PEO#2 |
Non-PEO NEOs |
|
|
|
|
2025 |
N/A |
Mr. LaRossa |
Mr. Cregg, Ms. Hanemann, Ms. Park and Mr. McFeaters |
2024 |
N/A |
Mr. LaRossa |
Mr. Cregg, Ms. Hanemann, Ms. Linde and Mr. McFeaters |
2023 |
N/A |
Mr. LaRossa |
Mr. Cregg, Ms. Hanemann, Ms. Linde and Mr. McFeaters |
2022 |
Mr. Izzo |
Mr. LaRossa |
Mr. Cregg, Ms. Hanemann, Ms. Linde and Mr. Carr |
2021 |
Mr. Izzo |
N/A |
Mr. Cregg, Mr. LaRossa, Ms. Linde and Mr. Daly |
(2) |
Amounts reflect the total compensation for our NEOs, as reported in the Summary Compensation Table for each applicable year. |
(3) |
In accordance with Item 402(v) requirements, the fair values of unvested and outstanding equity awards were remeasured as of the end of each fiscal year, and as of each vesting date, during the years displayed in the tables below. For PSUs with a relative TSR metric, the fair values as of each measurement date (prior to the end of the performance period) were determined using a Monte Carlo simulation pricing model, with assumptions and methodologies that are generally consistent with those used to estimate fair value at grant under U.S. GAAP. The range of estimates used in the Monte Carlo calculations are as follows: (i) for 2025, volatility between 21.3%-20.3% and risk-free rate of 3.4%; (ii) for 2024, volatility between 19.1%-19.3% and risk-free rate between 4.1%-4.2%; (iii) for 2023, volatility between 20%-22% and risk-free rate between 4.1%-4.7%; (iv) for 2022, volatility between 19%-41% and risk-free rate of 0.1%; and (v) for 2021, volatility between 30%-32% and risk-free rate between 0.4%-0.7%. For PSUs with a ROIC metric, fair values reflect the probable outcome of the performance vesting conditions as of each measurement date. For a discussion of the assumptions made in the valuation at grant, see Note 17 to the Consolidated Financial Statements included in our Form 10-K. In calculating the ‘compensation actually paid’ amounts reflected in the columns below, the adjustments made to the pension benefit values were computed in accordance with U.S. GAAP. For each fiscal year reflected, the ‘compensation actually paid’ to the PEO and the average ‘compensation actually paid’ to the non-PEO NEOs reflect the following adjustments made to the total compensation amounts reported in the Summary Compensation Table for each applicable fiscal year, computed in accordance with Item 402(v) of Regulation S-K. |
|
|
2025 |
|||
|
|
|
|
|
|
|
|
|
|
|
|
Summary Compensation Table Total for PEO |
|
|
13,866,735 |
|
|
|
|
|
|
|
|
|
|
|
|
|
|
Minus: Grant Date Fair Value of Equity Awards Granted in Fiscal Year |
|
|
(9,000,153 |
) |
|
|
|
|
|
|
|
|
|
|
|
|
|
Minus: Change in Pension Value |
|
|
(734,000 |
) |
|
|
|
|
|
|
|
|
|
|
|
|
|
Plus: Pension Service Cost and Associated Prior Service Cost |
|
|
234,084 |
|
|
|
|
|
|
|
|
|
|
|
|
|
|
Plus: Fair Value at Fiscal Year End of Outstanding and Unvested Equity Awards Granted in the Fiscal Year |
|
|
5,491,203 |
|
|
|
|
|
|
|
|
|
|
|
|
|
|
Plus: Change in Fair Value of Outstanding and Unvested Equity Awards Granted in Prior Fiscal Years |
|
|
(1,184,471 |
) |
|
|
|
|
|
|
|
|
|
|
|
|
|
Plus: Fair Value at Vesting of Equity Awards Granted and Vested in the Fiscal Year |
|
|
2,188,875 |
|
|
|
|
|
|
|
|
|
|
|
|
|
|
Plus: Change in Fair Value as of the Vesting Date of Equity Awards Granted in Prior Fiscal Years that Vested in the Fiscal Year |
|
|
(797,184 |
) |
|
|
|
|
|
|
|
|
|
|
|
|
|
Minus: Fair Value as of the Prior Fiscal Year End of Equity Awards Granted in Prior Fiscal Years that Failed to Meet Vesting Conditions in the Fiscal Year |
|
|
- |
|
|
|
|
|
|
|
|
|
|
|
|
|
|
Plus: Value of Dividends or Other Earnings Paid on Equity Awards Not Otherwise Reflected in Total Compensation |
|
|
1,277,864 |
|
|
|
|
|
|
|
|
|
|
|
|
|
|
Compensation Actually Paid for PEO |
|
|
11,342,953 |
|
|
|
|
|
|
|
|
|
|
2025 |
|||
|
|
|
|
|
|
|
|
|
|
|
|
Summary Compensation Table Total for NEOs (other than PEO) |
|
|
3,747,184 |
|
|
|
|
|
|
|
|
|
|
|
|
|
|
Minus: Grant Date Fair Value of Equity Awards Granted in Fiscal Year |
|
|
(1,800,088 |
) |
|
|
|
|
|
|
|
|
|
|
|
|
|
Minus: Change in Pension Value |
|
|
(253,750 |
) |
|
|
|
|
|
|
|
|
|
|
|
|
|
Plus: Pension Service Cost and Associated Prior Service Cost |
|
|
91,102 |
|
|
|
|
|
|
|
|
|
|
|
|
|
|
Plus: Fair Value at Fiscal Year End of Outstanding and Unvested Equity Awards Granted in the Fiscal Year |
|
|
1,182,165 |
|
|
|
|
|
|
|
|
|
|
|
|
|
|
Plus: Change in Fair Value of Outstanding and Unvested Equity Awards Granted in Prior Fiscal Years |
|
|
(207,056 |
) |
|
|
|
|
|
|
|
|
|
|
|
|
|
Plus: Fair Value at Vesting of Equity Awards Granted and Vested in the Fiscal Year |
|
|
352,659 |
|
|
|
|
|
|
|
|
|
|
|
|
|
|
Plus: Change in Fair Value as of the Vesting Date of Equity Awards Granted in Prior Fiscal Years that Vested in the Fiscal Year |
|
|
(113,998 |
) |
|
|
|
|
|
|
|
|
|
|
|
|
|
Minus: Fair Value as of the Prior Fiscal Year End of Equity Awards Granted in Prior Fiscal Years that Failed to Meet Vesting Conditions in the Fiscal Year |
|
|
- |
|
|
|
|
|
|
|
|
|
|
|
|
|
|
Plus: Value of Dividends or Other Earnings Paid on Equity Awards Not Otherwise Reflected in Total Compensation |
|
|
208,908 |
|
|
|
|
|
|
|
|
|
|
|
|
|
|
Compensation Actually Paid for NEOs (other than PEO) |
|
|
3,207,126 |
|
|
|
|
|
|
|
|
(1) |
NEOs included in these columns reflect the following: |
Year |
PEO#1 |
PEO#2 |
Non-PEO NEOs |
|
|
|
|
2025 |
N/A |
Mr. LaRossa |
Mr. Cregg, Ms. Hanemann, Ms. Park and Mr. McFeaters |
2024 |
N/A |
Mr. LaRossa |
Mr. Cregg, Ms. Hanemann, Ms. Linde and Mr. McFeaters |
2023 |
N/A |
Mr. LaRossa |
Mr. Cregg, Ms. Hanemann, Ms. Linde and Mr. McFeaters |
2022 |
Mr. Izzo |
Mr. LaRossa |
Mr. Cregg, Ms. Hanemann, Ms. Linde and Mr. Carr |
2021 |
Mr. Izzo |
N/A |
Mr. Cregg, Mr. LaRossa, Ms. Linde and Mr. Daly |
|
|
2025 |
|||
|
|
|
|
|
|
|
|
|
|
|
|
Summary Compensation Table Total for PEO |
|
|
13,866,735 |
|
|
|
|
|
|
|
|
|
|
|
|
|
|
Minus: Grant Date Fair Value of Equity Awards Granted in Fiscal Year |
|
|
(9,000,153 |
) |
|
|
|
|
|
|
|
|
|
|
|
|
|
Minus: Change in Pension Value |
|
|
(734,000 |
) |
|
|
|
|
|
|
|
|
|
|
|
|
|
Plus: Pension Service Cost and Associated Prior Service Cost |
|
|
234,084 |
|
|
|
|
|
|
|
|
|
|
|
|
|
|
Plus: Fair Value at Fiscal Year End of Outstanding and Unvested Equity Awards Granted in the Fiscal Year |
|
|
5,491,203 |
|
|
|
|
|
|
|
|
|
|
|
|
|
|
Plus: Change in Fair Value of Outstanding and Unvested Equity Awards Granted in Prior Fiscal Years |
|
|
(1,184,471 |
) |
|
|
|
|
|
|
|
|
|
|
|
|
|
Plus: Fair Value at Vesting of Equity Awards Granted and Vested in the Fiscal Year |
|
|
2,188,875 |
|
|
|
|
|
|
|
|
|
|
|
|
|
|
Plus: Change in Fair Value as of the Vesting Date of Equity Awards Granted in Prior Fiscal Years that Vested in the Fiscal Year |
|
|
(797,184 |
) |
|
|
|
|
|
|
|
|
|
|
|
|
|
Minus: Fair Value as of the Prior Fiscal Year End of Equity Awards Granted in Prior Fiscal Years that Failed to Meet Vesting Conditions in the Fiscal Year |
|
|
- |
|
|
|
|
|
|
|
|
|
|
|
|
|
|
Plus: Value of Dividends or Other Earnings Paid on Equity Awards Not Otherwise Reflected in Total Compensation |
|
|
1,277,864 |
|
|
|
|
|
|
|
|
|
|
|
|
|
|
Compensation Actually Paid for PEO |
|
|
11,342,953 |
|
|
|
|
|
|
|
|
|
|
2025 |
|||
|
|
|
|
|
|
|
|
|
|
|
|
Summary Compensation Table Total for NEOs (other than PEO) |
|
|
3,747,184 |
|
|
|
|
|
|
|
|
|
|
|
|
|
|
Minus: Grant Date Fair Value of Equity Awards Granted in Fiscal Year |
|
|
(1,800,088 |
) |
|
|
|
|
|
|
|
|
|
|
|
|
|
Minus: Change in Pension Value |
|
|
(253,750 |
) |
|
|
|
|
|
|
|
|
|
|
|
|
|
Plus: Pension Service Cost and Associated Prior Service Cost |
|
|
91,102 |
|
|
|
|
|
|
|
|
|
|
|
|
|
|
Plus: Fair Value at Fiscal Year End of Outstanding and Unvested Equity Awards Granted in the Fiscal Year |
|
|
1,182,165 |
|
|
|
|
|
|
|
|
|
|
|
|
|
|
Plus: Change in Fair Value of Outstanding and Unvested Equity Awards Granted in Prior Fiscal Years |
|
|
(207,056 |
) |
|
|
|
|
|
|
|
|
|
|
|
|
|
Plus: Fair Value at Vesting of Equity Awards Granted and Vested in the Fiscal Year |
|
|
352,659 |
|
|
|
|
|
|
|
|
|
|
|
|
|
|
Plus: Change in Fair Value as of the Vesting Date of Equity Awards Granted in Prior Fiscal Years that Vested in the Fiscal Year |
|
|
(113,998 |
) |
|
|
|
|
|
|
|
|
|
|
|
|
|
Minus: Fair Value as of the Prior Fiscal Year End of Equity Awards Granted in Prior Fiscal Years that Failed to Meet Vesting Conditions in the Fiscal Year |
|
|
- |
|
|
|
|
|
|
|
|
|
|
|
|
|
|
Plus: Value of Dividends or Other Earnings Paid on Equity Awards Not Otherwise Reflected in Total Compensation |
|
|
208,908 |
|
|
|
|
|
|
|
|
|
|
|
|
|
|
Compensation Actually Paid for NEOs (other than PEO) |
|
|
3,207,126 |
|
|
|
|
|
|
|
|
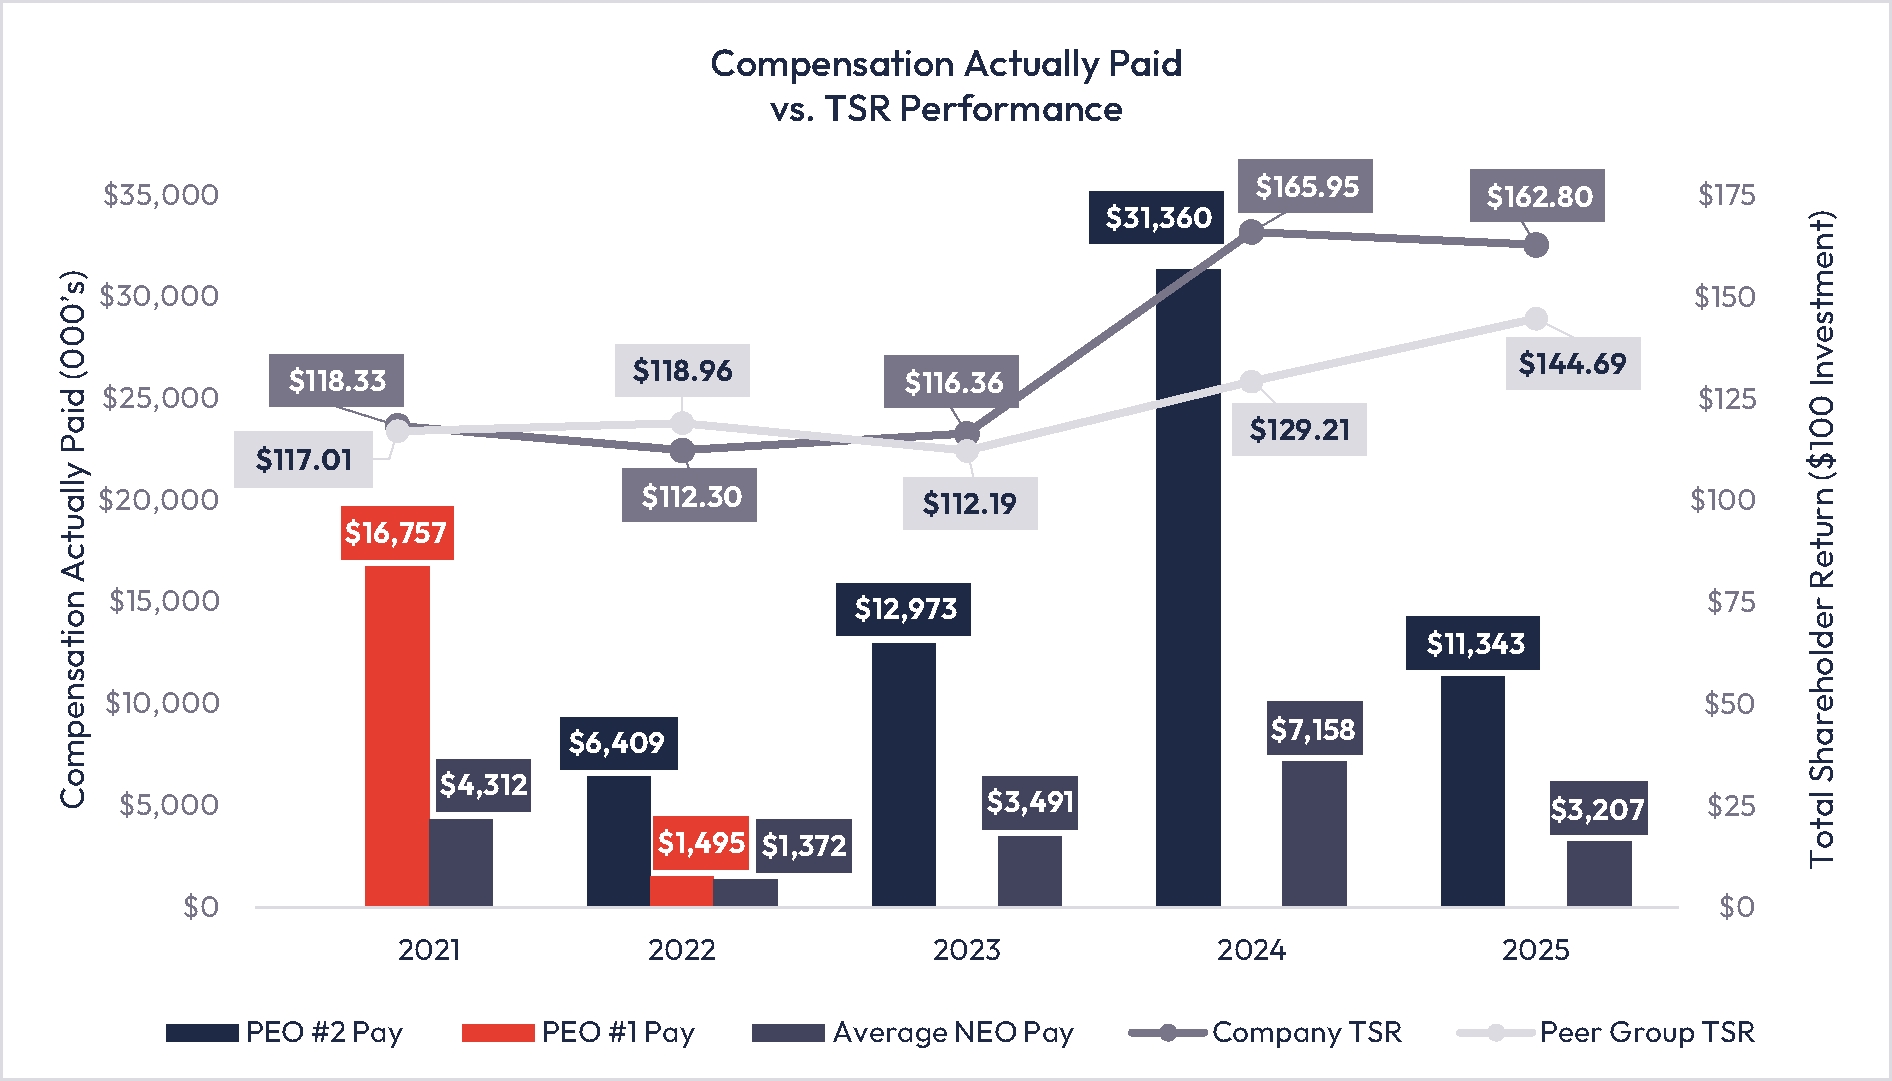
Relationship Between Compensation Actually Paid for CEO and NEOs (Average) vs. Cumulative TSR of Company and the Peer Group
The graph below illustrates the trend in “compensation actually paid” over the five years compared to our TSR performance, as well as TSR relative to the DJU Index. This illustrates that compensation decreased in 2022 in alignment with our TSR performance. In 2023 and 2024, compensation increased in alignment with our TSR performance. For 2025, compensation decreased in alignment with our TSR performance. Our TSR performance was stronger than the DJU Index in 2021, 2023, 2024 and 2025.
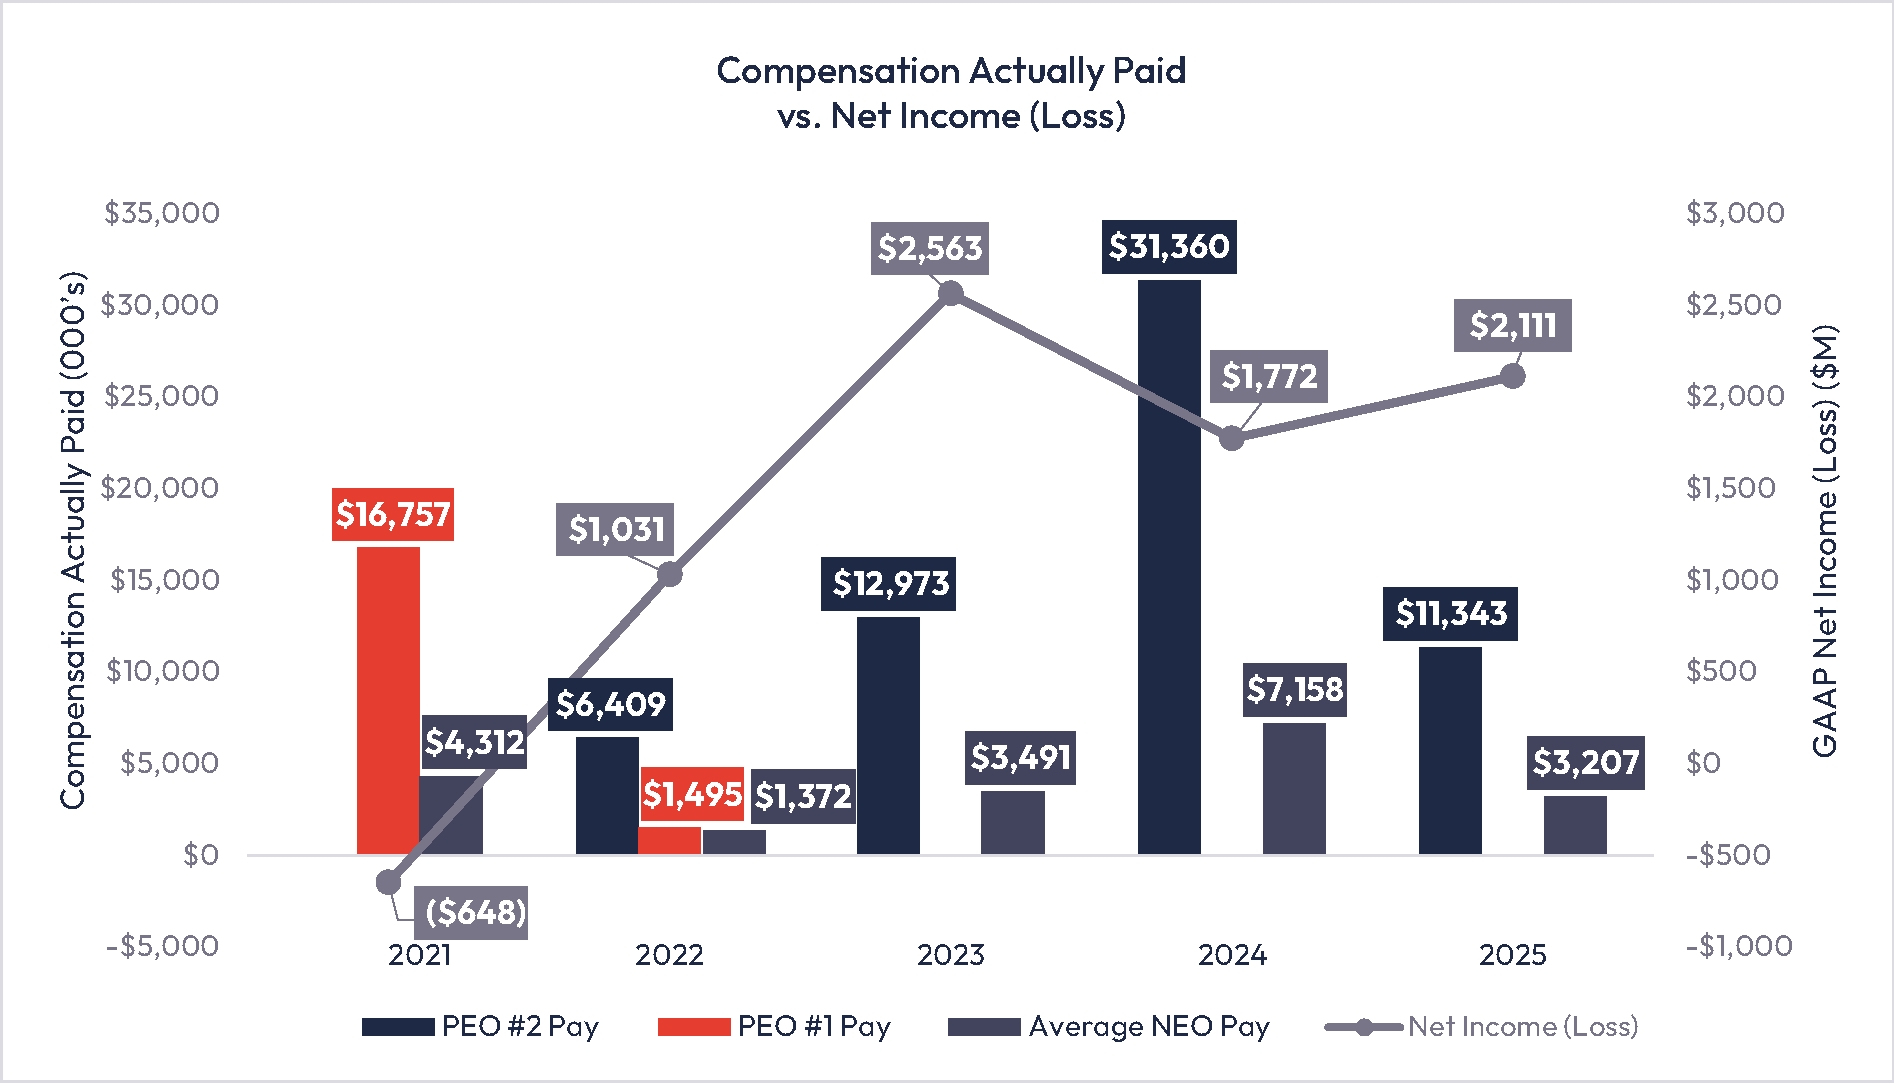
Relationship Between Compensation Actually Paid for CEO and NEOs (Average) vs. Net Income (Loss)
The graph below illustrates the trend in “compensation actually paid” over the five years to our GAAP Net Income (Loss). This illustrates that in 2022 compensation decreased and net income increased. For 2023, compensation increased alongside net income. For 2024, compensation increased and net income decreased. In 2025, compensation decreased and net income increased. See Appendix A for a complete list of items excluded from Net Income (Loss) in the determination of non-GAAP Operating Earnings.
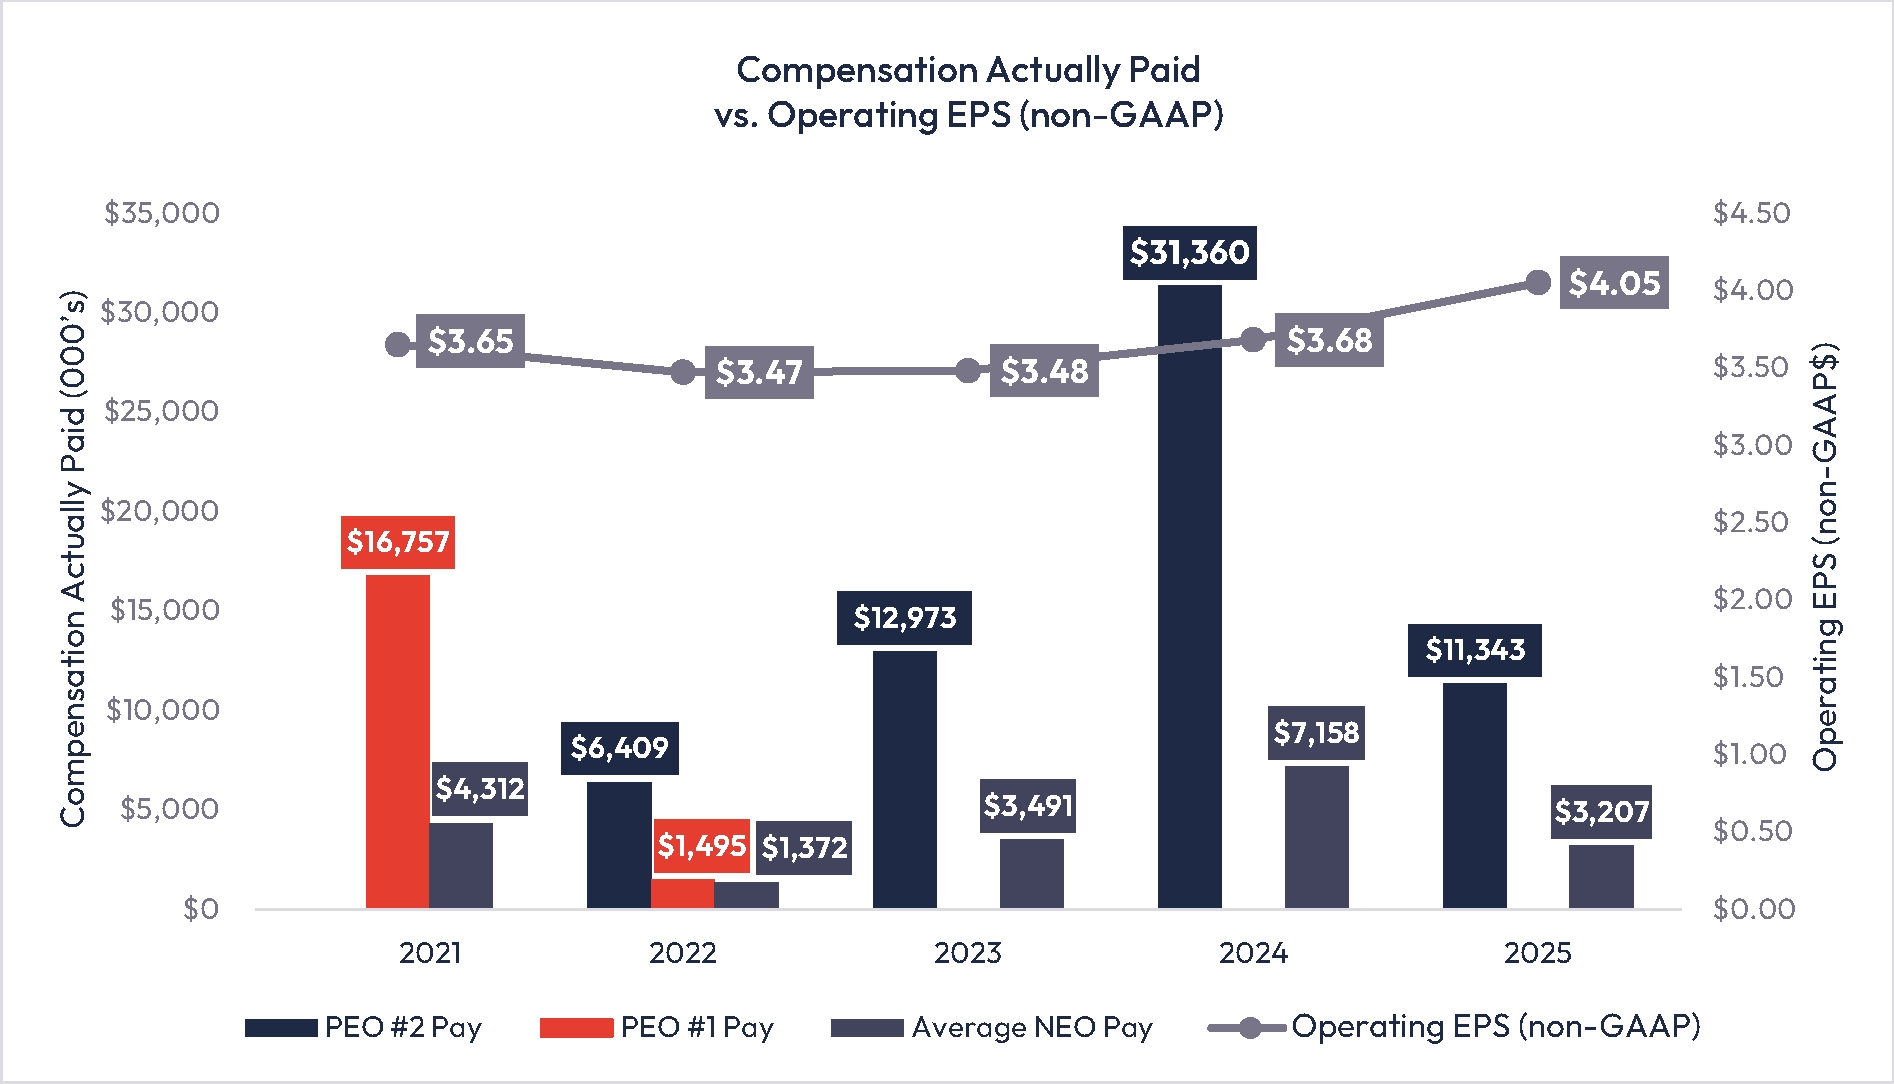
Relationship Between Compensation Actually Paid for CEO and NEOs (Average) vs. Non-GAAP Operating EPS
The graph below illustrates the trend in “compensation actually paid” over the five years to our Operating EPS (non-GAAP). This illustrates that in 2022 compensation decreased with Operating EPS. In 2023 and 2024, compensation increased in alignment with Operating EPS. For 2025, compensation decreased while Operating EPS increased. See Appendix A for a complete list of items excluded from Net Income (Loss) in the determination of non-GAAP Operating Earnings.
Relationship Between Compensation Actually Paid for CEO and NEOs (Average) vs. Cumulative TSR of Company and the Peer Group
The graph below illustrates the trend in “compensation actually paid” over the five years compared to our TSR performance, as well as TSR relative to the DJU Index. This illustrates that compensation decreased in 2022 in alignment with our TSR performance. In 2023 and 2024, compensation increased in alignment with our TSR performance. For 2025, compensation decreased in alignment with our TSR performance. Our TSR performance was stronger than the DJU Index in 2021, 2023, 2024 and 2025.
Most Important Company Performance Measures for Determining Executive Compensation
As also required by Section 953(a) of the Dodd-Frank Wall Street Reform and Consumer Protection Act and Item 402(v) of Regulation S-K, below is a list of the performance measures that were considered the most important by the Company in determining executive compensation for the 2025 performance year. The performance measures included in this table are not ranked by relative importance.
Most Important Performance Measures |
Operating Earnings Per Share (non-GAAP) |
Relative Total Shareholder Return |
Earnings Per Share Growth |
Sustainability Index |