Value of Initial Fixed $100 Investment Based On (3) | ||||||||||||||||
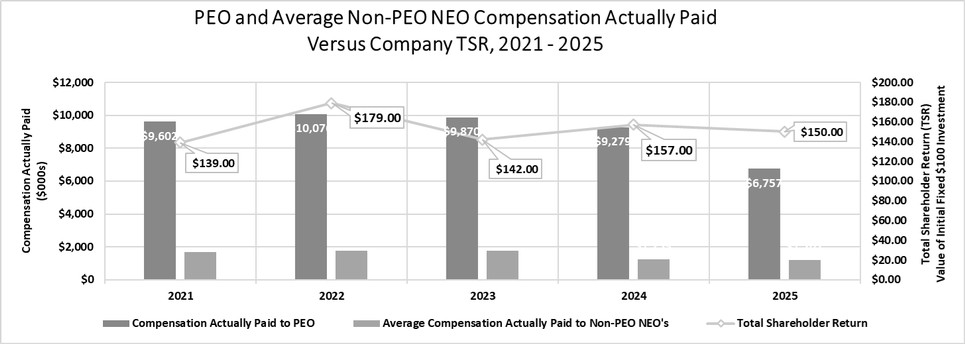
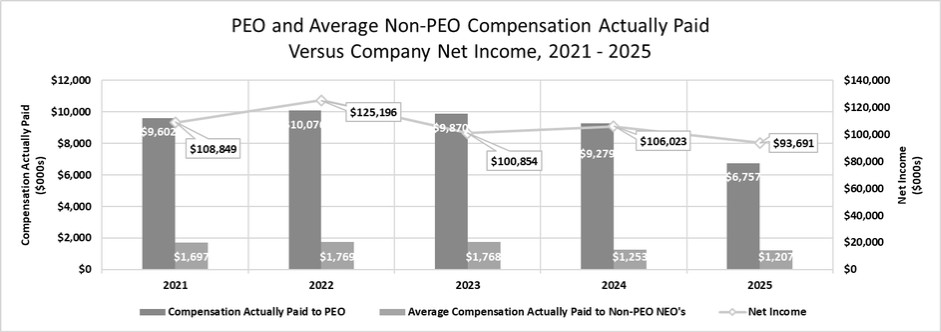
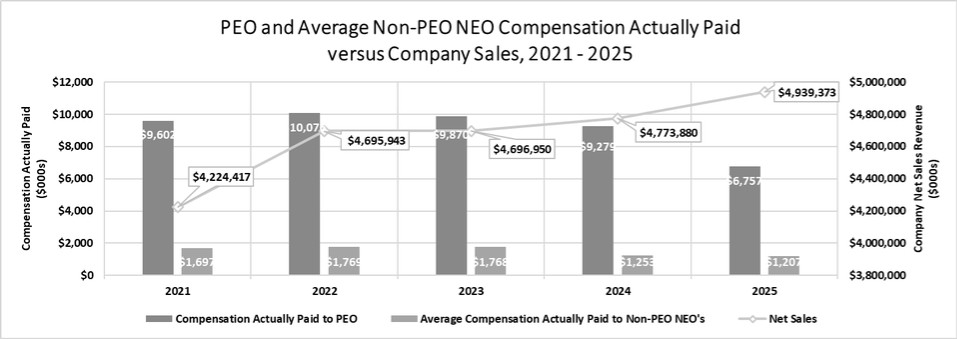
Year | Summary Compensation Table Total for PEO (1) | Compensation Actually Paid to PEO (2) | Average Summary Compensation Table Total for Non-PEO NEOs (1) | Average Compensation Actually Paid to Non-PEO NEOs (2) | Total Shareholder Return | Peer Group Total Shareholder Return | Net Income ($000s) | Net Sales ($000s) | ||||||||
2025 | $6,756,936 | $6,756,936 | $1,206,960 | $1,206,960 | $150 | $225 | $93,691 | $4,939,373 | ||||||||
2024 | $9,278,502 | $9,278,502 | $1,252,882 | $1,252,882 | $157 | $208 | $106,023 | $4,773,880 | ||||||||
2023 | $9,870,137 | $9,870,137 | $1,767,557 | $1,767,557 | $142 | $140 | $100,854 | $4,696,950 | ||||||||
2022 | $10,076,172 | $10,076,172 | $1,769,100 | $1,769,100 | $179 | $130 | $125,196 | $4,695,943 | ||||||||
2021 | $9,601,709 | $9,601,709 | $1,697,339 | $1,697,339 | $139 | $132 | $108,849 | $4,224,417 | ||||||||
| (1) | The amounts reflect the Summary Compensation Table total compensation figures for Jonathan H. Weis, our principal executive officer (“PEO”), for each of the years listed. The Non-PEO NEOs for whom the Summary Compensation Table total average compensation is presented are: for 2025, Robert G. Gleeson, Michael T. Lockard, R. Gregory Zeh Jr., and James E. Marcil; for 2024, Michael T. Lockard, R. Gregory Zeh Jr., David W. Gose II, and Robert G. Gleeson; for 2023, Kurt A. Schertle, Michael T. Lockard, R. Gregory Zeh Jr. and Harold G. Graber; for 2022, Kurt A. Schertle, Michael T. Lockard, Harold G. Graber, and David W. Gose II; and for 2021 Kurt A. Schertle, Scott F. Frost, Harold G. Graber, and David W. Gose II. |
| (2) | The amounts shown for Compensation Actually Paid to our PEO and Average Compensation Actually Paid to Non-PEO NEOs have been calculated in accordance with Item 402(v) of Regulation S-K and do not reflect compensation actually realized or received by such persons. These amounts reflect total compensation as set forth in the Summary Compensation Table above for each year. None of the adjustments required by Item 402(v) are applicable to the Company. |
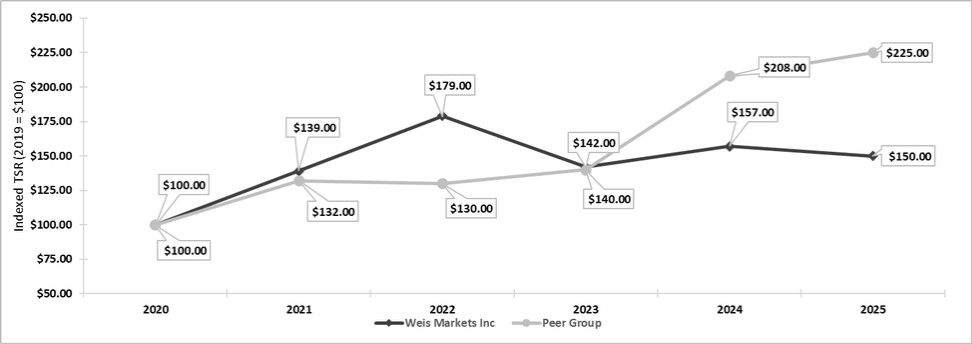
| (3) | This column shows Company Total Shareholder Return (“TSR”) and peer group TSR on a cumulative basis for each year of the five-year period from 2021 through 2025. For purposes of this disclosure, the peer group consists of the updated peer group used for our stock performance graph, as presented in Item 5 of the Company’s Annual Report on Form 10-K. The companies making up the updated peer group, in no particular order, are Ingles Markets, Inc.; Koninklijke Ahold Delhaize N.V.; Village Super Market, Inc.; Sprouts Farmers Market, Inc. and The Kroger Company. SpartanNash Co. has been removed from the peer group due to the acquisition of the company by C&S Wholesale Grocers in September 2025. The updated peer group is made up of five retail grocers that the Company feels most closely relate to its size and business profile, including one national grocer the Company believes to be an industry market leader. Dollar values assume $100 was invested for the cumulative period from fiscal year 2021 |
| through fiscal year 2025, in either the Company or the peer group, and reinvestment of the pre-tax value of dividends paid. Had the prior peer group for fiscal 2024 been used, peer group TSR for each of fiscal years 2021, 2022, 2023, 2024 and 2025 would have been $132.22, $130.59, $140.44, $206.85, and $224.88. Historical stock performance is not necessarily indicative of future stock performance. |
| (1) | The amounts reflect the Summary Compensation Table total compensation figures for Jonathan H. Weis, our principal executive officer (“PEO”), for each of the years listed. The Non-PEO NEOs for whom the Summary Compensation Table total average compensation is presented are: for 2025, Robert G. Gleeson, Michael T. Lockard, R. Gregory Zeh Jr., and James E. Marcil; for 2024, Michael T. Lockard, R. Gregory Zeh Jr., David W. Gose II, and Robert G. Gleeson; for 2023, Kurt A. Schertle, Michael T. Lockard, R. Gregory Zeh Jr. and Harold G. Graber; for 2022, Kurt A. Schertle, Michael T. Lockard, Harold G. Graber, and David W. Gose II; and for 2021 Kurt A. Schertle, Scott F. Frost, Harold G. Graber, and David W. Gose II. |
| (2) | The amounts shown for Compensation Actually Paid to our PEO and Average Compensation Actually Paid to Non-PEO NEOs have been calculated in accordance with Item 402(v) of Regulation S-K and do not reflect compensation actually realized or received by such persons. These amounts reflect total compensation as set forth in the Summary Compensation Table above for each year. None of the adjustments required by Item 402(v) are applicable to the Company. |
| (3) | This column shows Company Total Shareholder Return (“TSR”) and peer group TSR on a cumulative basis for each year of the five-year period from 2021 through 2025. For purposes of this disclosure, the peer group consists of the updated peer group used for our stock performance graph, as presented in Item 5 of the Company’s Annual Report on Form 10-K. The companies making up the updated peer group, in no particular order, are Ingles Markets, Inc.; Koninklijke Ahold Delhaize N.V.; Village Super Market, Inc.; Sprouts Farmers Market, Inc. and The Kroger Company. SpartanNash Co. has been removed from the peer group due to the acquisition of the company by C&S Wholesale Grocers in September 2025. The updated peer group is made up of five retail grocers that the Company feels most closely relate to its size and business profile, including one national grocer the Company believes to be an industry market leader. Dollar values assume $100 was invested for the cumulative period from fiscal year 2021 |
| through fiscal year 2025, in either the Company or the peer group, and reinvestment of the pre-tax value of dividends paid. Had the prior peer group for fiscal 2024 been used, peer group TSR for each of fiscal years 2021, 2022, 2023, 2024 and 2025 would have been $132.22, $130.59, $140.44, $206.85, and $224.88. Historical stock performance is not necessarily indicative of future stock performance. |
| (2) | The amounts shown for Compensation Actually Paid to our PEO and Average Compensation Actually Paid to Non-PEO NEOs have been calculated in accordance with Item 402(v) of Regulation S-K and do not reflect compensation actually realized or received by such persons. These amounts reflect total compensation as set forth in the Summary Compensation Table above for each year. None of the adjustments required by Item 402(v) are applicable to the Company. |
| (2) | The amounts shown for Compensation Actually Paid to our PEO and Average Compensation Actually Paid to Non-PEO NEOs have been calculated in accordance with Item 402(v) of Regulation S-K and do not reflect compensation actually realized or received by such persons. These amounts reflect total compensation as set forth in the Summary Compensation Table above for each year. None of the adjustments required by Item 402(v) are applicable to the Company. |
2025 Tabular List of Most Important Financial Measures
The following table presents the financial performance measures that the Company considers to have been the most important in linking Compensation Actually Paid to our PEO and Non-PEO NEOs in 2025 to Company performance. The measures in this table are not ranked.
Net Sales | ||||
Operating Income | ||||
Modified Return On Invested Capital (MROIC) |