Pay vs Performance Disclosure - USD ($)
Dec. 31, 2025
Dec. 31, 2024
Dec. 31, 2023
Dec. 31, 2022
Dec. 31, 2021
Pay Versus Performance
In accordance with Section 953(a) of the Dodd‑Frank Wall Street Reform and Consumer Protection Act and Item 402(v) of Regulation S‑K, we are providing the following information about the relationships between compensation actually paid to named executives and company performance. In this section, we refer to “compensation actually paid” and other terms used in the applicable SEC rules. For information concerning the company’s compensation philosophy and how the company aligns executive compensation with its financial and operational performance, refer to Incentive Compensation starting on page 41. We refer collectively to awards of RSUs, PSUs, performance shares and stock options as equity awards in this Pay versus Performance section.
YEAR(1) | SUMMARY COMPENSATION TABLE TOTAL FOR PEO(1) | COMPENSATION ACTUALLY PAID TO PEO(1)(2) | AVERAGE SUMMARY COMPENSATION TABLE TOTAL FOR NON‑PEO NAMED EXECUTIVES(1) | AVERAGE COMPENSATION ACTUALLY PAID TO NON‑PEO NAMED EXECUTIVES(1)(2) | VALUE OF INITIAL FIXED $100 INVESTMENT BASED ON: | NET INCOME ($M)(5) | COMPANY- SELECTED PERFORMANCE MEASURE: FREE CASH FLOW ($M)(5)(6) | |||||||||||||||||||||||||||||||||||||||||||||||||
| TOTAL SHAREHOLDER RETURN | PEER GROUP TOTAL SHAREHOLDER RETURN(4) | |||||||||||||||||||||||||||||||||||||||||||||||||||||||
| 2025 | $ | 45,616,160 | $ | 213,466,111 | (3) | $ | 9,447,149 | $ | 29,277,772 | (3) | $ | 586 | $ | 189 | $ | 8,698 | $ | 7,694 | ||||||||||||||||||||||||||||||||||||||
| 2024 | $ | 88,954,586 | $ | 284,666,600 | $ | 8,750,322 | $ | 16,162,691 | $ | 316 | $ | 158 | $ | 6,556 | $ | 6,089 | ||||||||||||||||||||||||||||||||||||||||
| 2023 | $ | 14,698,285 | $ | 182,548,275 | $ | 7,708,170 | $ | 24,033,475 | $ | 191 | $ | 135 | $ | 9,443 | $ | 5,150 | ||||||||||||||||||||||||||||||||||||||||
| 2022 | $ | 8,198,024 | $ | (23,798,500) | $ | 8,969,318 | $ | 3,579,820 | $ | 98 | $ | 114 | $ | 292 | $ | 4,758 | ||||||||||||||||||||||||||||||||||||||||
| 2021 | $ | 22,663,449 | $ | 21,302,944 | $ | 8,584,656 | $ | 7,655,599 | $ | 110 | $ | 121 | $ | (6,591) | $ | 1,889 | ||||||||||||||||||||||||||||||||||||||||
| YEAR | PRINCIPAL EXECUTIVE OFFICER (PEO) | NON‑PEO NAMED EXECUTIVES | ||||||
| 2025 | H. Lawrence Culp, Jr. | Rahul Ghai, Russell Stokes, Mohamed Ali, John Phillips, III | ||||||
| 2024 | H. Lawrence Culp, Jr. | Rahul Ghai, Russell Stokes, Christian Meisner, John Phillips, III, L. Kevin Cox, Michael Holston | ||||||
| 2023 | H. Lawrence Culp, Jr. | Rahul Ghai, Carolina Dybeck Happe, Russell Stokes, Michael Holston, L. Kevin Cox | ||||||
| 2022 | H. Lawrence Culp, Jr. | Carolina Dybeck Happe, John Slattery, Peter Arduini, Russell Stokes | ||||||
| 2021 | H. Lawrence Culp, Jr. | Carolina Dybeck Happe, John Slattery, Russell Stokes, Kieran Murphy | ||||||
| PEO | AVERAGE OF NON‑PEOs | |||||||||||||
| TOTAL REPORTED IN 2025 SUMMARY COMPENSATION TABLE | $ | 45,616,160 | $ | 9,447,149 | ||||||||||
| Less, value of equity awards reported in the Summary Compensation Table | 32,139,930 | 5,896,174 | ||||||||||||
| Add, year‑end value of equity awards granted in 2025 that are unvested and outstanding | 70,981,180 | 12,767,359 | ||||||||||||
| Add, change in fair value (from prior year‑end) of prior year equity awards that are unvested and outstanding | 131,572,969 | 10,704,131 | ||||||||||||
Add, vesting date fair market value of equity awards granted in 2025 and that vested in 2025 | - | - | ||||||||||||
| Add, change in fair value (from prior year‑end) of prior year equity awards that vested in 2025 | - | 2,719,752 | ||||||||||||
Less, prior year‑end fair value of prior year equity awards that failed to vest in 2025 | - | - | ||||||||||||
Add, dividends and dividend equivalent payments paid during 2025 on unvested equity awards | - | - | ||||||||||||
| Less, change in present value of accumulated pension plan benefits reported in the Summary Compensation Table | 3,213,268 | 551,694 | ||||||||||||
| Add, service cost for defined benefit and pension plans | 649,000 | 87,250 | ||||||||||||
| Add, prior service cost for defined benefit and pension plans | - | - | ||||||||||||
Compensation Actually Paid for Fiscal Year 2025 | $ | 213,466,111 | $ | 29,277,772 | ||||||||||
Certain columns may not add due to the use of rounded numbers.
The chart below depicts compensation actually paid and the cumulative TSR of GE Aerospace and the S&P 500 Industrials Index for the five years shown. A significant portion of our executive compensation program comprises equity awards, and compensation actually paid for such years was most strongly affected by our stock price performance, as reflected in the equity award valuations required by SEC rules. For 2025, our stock price increased 85% year over year, compared to 18% for our peer group (the S&P 500 Industrials Index), resulting in our TSR increasing by close to 2x for 2025 and our five‑year total TSR ending significantly higher than that of our peer group. This performance resulted in a substantial increase in our PSU award valuations included in the calculation of compensation actually paid for 2025, including the value of unvested and outstanding equity awards granted in 2025 and the change in value of prior year equity awards that vested in 2025. Conversely, our TSR performance being below that of the peer group for 2021 and 2022 adversely affected our named executives’ equity award compensation, resulting in a downward adjustment to the value of the 2021 PSU awards, for which three‑year TSR performance is a modifier.
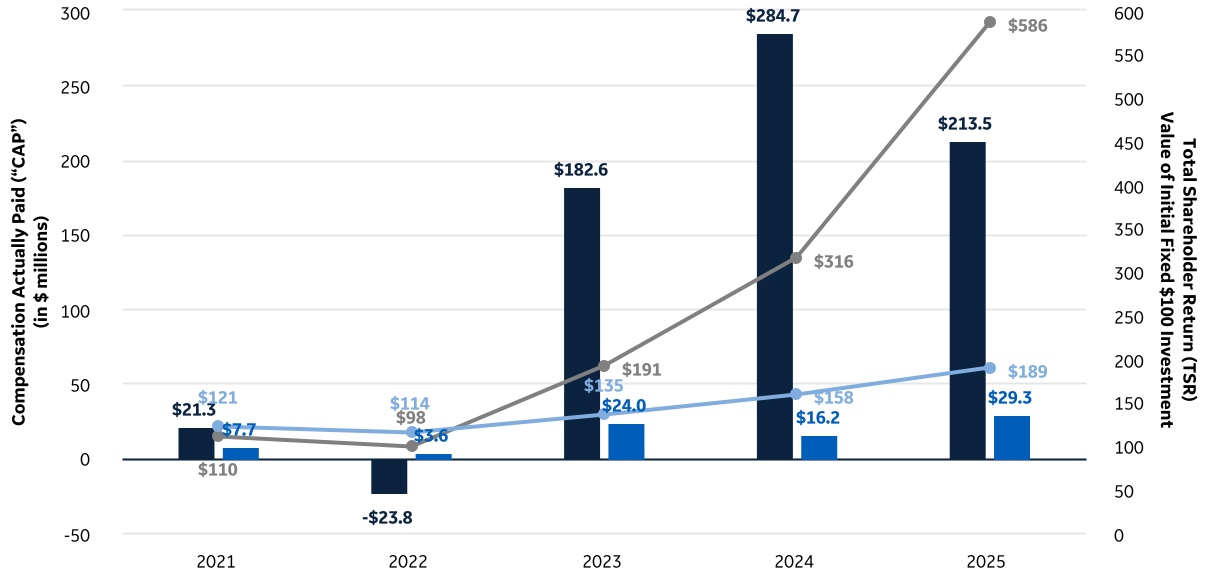
 | CAP to PEO |  | Average CAP to Non-PEO NEOs |  | Company TSR |  | Peer Group TSR | |||||||||||||||||||||||||
Net income is not a financial performance measure that we use in the compensation program design for our named executives. Accordingly, there is not a direct relationship between the compensation actually paid to our named executives and net income. In addition, a meaningful portion of incentive compensation for our named executives who are leaders of a business is tied to the financial performance of that business, rather than enterprise‑wide performance measures such as net income.
A significant portion of our compensation program is linked to our free cash flow performance for the total company and the applicable business, as described in the Compensation Discussion & Analysis section of this proxy statement. While our free cash flow performance improved sequentially in each of the five years shown, there is not a direct relationship with compensation actually paid because compensation actually paid more strongly reflects the required adjustments for equity award valuations under SEC rules.
| Most Important Financial Performance Measures | ||
| Free Cash Flow* | ||
| Adjusted Revenue Growth* | ||
| Operating Profit* | ||
| Adjusted Earnings Per Share* | ||
* Non‑GAAP Financial Measure
In accordance with Item 402(v) of Regulation S‑K, the company is providing the following descriptions of the relationships between information presented in the Pay versus Performance table. The calculation of compensation actually paid in each of the years shown reflects required adjustments to equity award valuations under SEC rules, which were in turn impacted by our stock price performance and cancellation of performance‑based awards that did not meet their established thresholds, if any. When the committee selected performance measures in support of the design of our 2025 executive compensation program, it focused on factors that it believed would further the company’s and business units’ goals for the year, align with GE Aerospace’s long‑term strategic objectives and contribute to the creation of long‑term shareholder value, including our ability to generate free cash flow, adjusted revenue growth and operating profit, as well as our adjusted earnings per share and operational measures such as safety performance. For more information about these factors and decisions that impacted the 2025 compensation of our named executive officers, see the Compensation Discussion & Analysis section of this proxy statement.