Pay vs Performance Disclosure - USD ($)
Dec. 31, 2025
Dec. 31, 2024
Dec. 31, 2023
Dec. 31, 2022
Dec. 31, 2021
VALUE OF INITIAL FIXED $100 INVESTMENT BASED ON: | |||||||||||||||||||||||||||||
| YEAR | SUMMARY COMPENSATION TABLE TOTAL FOR PEO(1) ($) | COMPENSATION ACTUALLY PAID TO PEO(2) ($) | AVERAGE SUMMARY COMPENSATION TABLE TOTAL FOR NON-PEO NEOs(3) ($) | AVERAGE COMPENSATION ACTUALLY PAID TO NON-PEO NEOs(4) ($) | TOTAL SHAREHOLDER RETURN(5) ($) | PEER GROUP TOTAL SHAREHOLDER RETURN(5) ($) | NET INCOME (IN MILLIONS)(6) ($) | ADJUSTED EBITDA (IN MILLIONS)(7) ($) | |||||||||||||||||||||
| 2025 | 11,762,101 | (6,283,374) | 2,223,994 | (293,153) | 316.64 | 143.95 | 470.6 | 1,019.4 | |||||||||||||||||||||
| 2024 | 11,077,176 | 34,569,788 | 2,205,474 | 4,867,595 | 434.92 | 188.41 | 502.5 | 1,006.8 | |||||||||||||||||||||
| 2023 | 10,558,129 | 24,863,240 | 2,034,908 | 4,042,881 | 308.75 | 168.04 | 556.8 | 1,058.5 | |||||||||||||||||||||
| 2022 | 10,357,375 | 30,079,550 | 2,014,941 | 4,755,789 | 242.30 | 138.26 | 672.9 | 1,190.9 | |||||||||||||||||||||
| 2021 | 8,638,157 | 26,515,786 | 1,929,664 | 3,839,836 | 171.82 | 202.49 | 396.9 | 828.0 | |||||||||||||||||||||
(2)The dollar amounts shown in this column reflect “compensation actually paid” for the PEO calculated in accordance with SEC rules. As required, the dollar amounts include (among other items) unpaid amounts of equity compensation that may be realizable in future periods, and as such, the dollar amounts shown do not fully represent the actual final amount of compensation earned or actually paid to the individual during the applicable years. The adjustments made to Mr. Clyde’s total compensation for each year to determine CAP are shown in tables below. For information regarding the decisions made by our Executive Compensation Committee in regards to the Mr. Clyde’s compensation for fiscal year 2025, see the Compensation Discussion and Analysis section beginning on page 27.
PEO – Reconciliation of SCT Total to CAP Total(a)
| YEAR | SCT TOTAL ($) | MINUS: GRANT DATE FAIR VALUE OF AWARDS GRANTED DURING YEAR(b) ($) | PLUS: FAIR VALUE OF EQUITY CALCULATED USING SEC METHODOLOGY(c) ($) | MINUS: CHANGE IN ACTUARIAL VALUE OF PENSION BENEFITS DURING YEAR ($) | CAP TOTAL ($) | |||||||||||||||||||||||||||
| 2025 | 11,762,101 | 8,265,726 | (9,779,749) | — | (6,283,374) | |||||||||||||||||||||||||||
| 2024 | 11,077,176 | 8,340,048 | 31,832,660 | — | 34,569,788 | |||||||||||||||||||||||||||
| 2023 | 10,558,129 | 6,460,124 | 20,765,235 | — | 24,863,240 | |||||||||||||||||||||||||||
| 2022 | 10,357,375 | 5,869,983 | 25,592,158 | — | 30,079,550 | |||||||||||||||||||||||||||
| 2021 | 8,638,157 | 5,060,085 | 22,937,714 | — | 26,515,786 | |||||||||||||||||||||||||||
(a)As shown in these tables, the CAP totals represent the SCT totals for the applicable year but are adjusted as required by SEC rules to (1) include the fair value of current and prior year annual equity awards that are outstanding, vested or forfeited during the applicable year, instead of the grant-date value of awards granted during the applicable year, and (2) exclude any positive aggregate change in the actuarial present value of all defined benefit pension plan benefits for the applicable year. We note the SEC rules also require CAP to include any actuarially determined service cost or prior service cost under pension plans for services rendered by the executive during the applicable year. However, our PEO has never participated in any pension plans while with the Company.
(b)Represents the total of the amounts reported in Stock Awards and Option Awards columns of the SCT for the applicable year.
(c)The fair value of equity component of the CAP calculation was determined in accordance with SEC methodology for this disclosure. Unlike the SCT on page 42, which requires us to show the grant-date value of annual equity awards granted during the applicable year, the CAP table requires us to calculate equity fair value as follows:
•for awards granted during the applicable year (and which are still outstanding and unvested), the year-end fair value; plus
•for awards granted during prior years that were still outstanding and unvested as of the applicable year-end, the change in fair value as of the applicable year-end compared against the prior year-end; plus
•for awards granted in prior years that vested during the applicable year, the change in fair value as of the vesting date compared against the prior year-end; plus
•for any awards granted in the applicable year that vested during the applicable year, the fair value as of the vesting date; plus
•the dollar value of any dividends or other earnings paid on stock or option awards in the covered fiscal year prior to the vesting date that are not otherwise included in the total compensation for the covered fiscal year; minus
•for awards granted in prior years that were forfeited during the applicable year, the fair value as of the prior year-end.
PEO – CAP Fair Value of Equity Calculation
| YEAR | YE FAIR VALUE OF CURRENT YEAR AWARDS UNVESTED AS OF YE ($) | PLUS: CHANGE IN FAIR VALUE AS OF YE FOR PRIOR YEAR AWARDS UNVESTED AS OF YE ($) | PLUS: CHANGE IN FAIR VALUE AS OF VESTING DATE FOR PRIOR YEAR AWARDS THAT VESTED DURING THE YEAR ($) | PLUS: FAIR VALUE AS OF VESTING DATE FOR CURRENT YEAR AWARDS THAT VESTED DURING THE YEAR ($) | PLUS: DIVIDEND EQUIVALENTS PAID DURING THE YEAR NOT OTHERWISE INCLUDED IN TOTAL COMPENSATION ($) | MINUS: FAIR VALUE AS OF PRIOR YE FOR PRIOR YEAR AWARDS FORFEITED DURING THE YEAR ($) | VALUE OF EQUITY FOR CAP PURPOSES ($) | |||||||||||||||||||||||||||||||||||||
| 2025 | 4,163,197 | (13,233,858) | (958,006) | — | 248,918 | — | (9,779,749) | |||||||||||||||||||||||||||||||||||||
| 2024 | 14,593,796 | 14,192,333 | 2,736,040 | — | 310,491 | — | 31,832,660 | |||||||||||||||||||||||||||||||||||||
| 2023 | 12,282,968 | 9,574,342 | (1,264,654) | — | 172,579 | — | 20,765,235 | |||||||||||||||||||||||||||||||||||||
| 2022 | 13,688,240 | 13,509,920 | (1,701,122) | — | 95,120 | — | 25,592,158 | |||||||||||||||||||||||||||||||||||||
| 2021 | 11,894,697 | 11,368,046 | (333,974) | — | 8,945 | — | 22,937,714 | |||||||||||||||||||||||||||||||||||||
Non-PEO NEOs (Average) – Reconciliation of SCT Total to CAP Total(a)
| YEAR | SCT TOTAL ($) | MINUS: GRANT DATE FAIR VALUE OF AWARDS GRANTED DURING YEAR(b) ($) | PLUS: FAIR VALUE OF EQUITY CALCULATED USING SEC METHODOLOGY(c) ($) | MINUS: CHANGE IN ACTUARIAL VALUE OF PENSION BENEFITS DURING YEAR ($) | CAP TOTAL ($) | |||||||||||||||||||||||||||
| 2025 | 2,223,994 | 1,219,715 | (1,286,651) | 10,781 | (293,153) | |||||||||||||||||||||||||||
| 2024 | 2,205,474 | 1,206,402 | 3,868,523 | — | 4,867,595 | |||||||||||||||||||||||||||
| 2023 | 2,034,908 | 829,120 | 2,853,777 | 16,684 | 4,042,881 | |||||||||||||||||||||||||||
| 2022 | 2,014,941 | 746,020 | 3,486,868 | — | 4,755,789 | |||||||||||||||||||||||||||
| 2021 | 1,929,664 | 684,245 | 2,595,545 | 1,128 | 3,839,836 | |||||||||||||||||||||||||||
(a)The CAP total figures were calculated using the same methodology described above in footnote (a) to the PEO “Reconciliation of SCT Total to CAP Total” tables shown above. The aggregate change in actuarial present value of accumulated benefit under pension plans reflects the amount reported for the applicable year in the SCT; the amounts shown reflect the annual change in accumulated benefits for the applicable non-PEO NEOs’ accounts in the Murphy Oil Supplemental Executive Retirement Plan (“Murphy Oil SERP”), liability for which was assumed by Murphy USA in connection with the Spin-Off. However, given that the Murphy Oil SERP has been frozen, there is no applicable service cost or prior service cost to report under the plan.
(b)Represents the average total of the amounts reported in the Stock Awards and Option Awards columns of the SCT for these NEOs for the applicable year.
(c)The fair value of equity component of the CAP calculation was determined using the same methodology described above in footnote (c) to the PEO “Reconciliation of SCT Total to CAP Total” table shown above, using averages for the included non-PEO NEOs. The specific calculations for the included non-PEO NEOs for the relevant years are shown in the table below.
Non-PEO NEOs (Average) – CAP Fair Value of Equity Calculation
| YEAR | YE FAIR VALUE OF CURRENT YEAR AWARDS UNVESTED AS OF YE ($) | PLUS: CHANGE IN FAIR VALUE AS OF YE FOR PRIOR YEAR AWARDS UNVESTED AS OF YE ($) | PLUS: CHANGE IN FAIR VALUE AS OF VESTING DATE FOR PRIOR YEAR AWARDS THAT VESTED DURING THE YEAR ($) | PLUS: FAIR VALUE AS OF VESTING DATE FOR CURRENT YEAR AWARDS THAT VESTED DURING THE YEAR ($) | PLUS: DIVIDEND EQUIVALENTS PAID DURING THE YEAR NOT OTHERWISE INCLUDED IN TOTAL COMPENSATION ($) | MINUS: FAIR VALUE AS OF PRIOR YE FOR PRIOR YEAR AWARDS FORFEITED DURING THE YEAR ($) | VALUE OF EQUITY FOR CAP PURPOSES ($) | |||||||||||||||||||||||||||||||||||||
| 2025 | 495,776 | (1,385,810) | (87,330) | — | 22,119 | 331,406(8) | (1,286,651) | |||||||||||||||||||||||||||||||||||||
| 2024 | 2,078,538 | 1,449,024 | 305,879 | — | 35,082 | — | 3,868,523 | |||||||||||||||||||||||||||||||||||||
| 2023 | 1,576,396 | 1,290,150 | (51,915) | — | 39,146 | — | 2,853,777 | |||||||||||||||||||||||||||||||||||||
| 2022 | 1,740,793 | 1,951,451 | (217,606) | — | 12,230 | — | 3,486,868 | |||||||||||||||||||||||||||||||||||||
| 2021 | 1,389,396 | 1,583,283 | (48,393) | — | 1,346 | 330,087 | 2,595,545 | |||||||||||||||||||||||||||||||||||||
*Please refer to the reconciliation in Appendix A.
| Performance Measure | ||
| Adjusted EBITDA | ||
| Relative TSR | ||
| Return on Average Capital Employed | ||
| Fuel Volume | ||
| Fuel Margin Contribution | ||
| Merchandise Margin Contribution | ||
| Coverage Ratio | ||
Pay Versus Performance
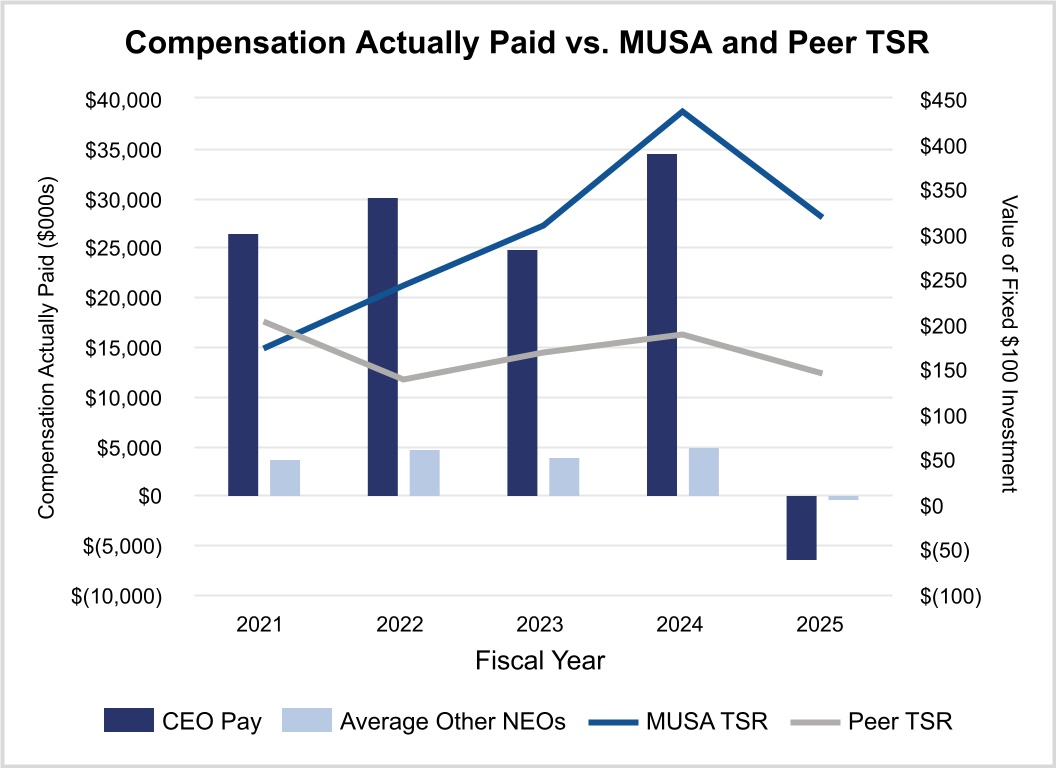
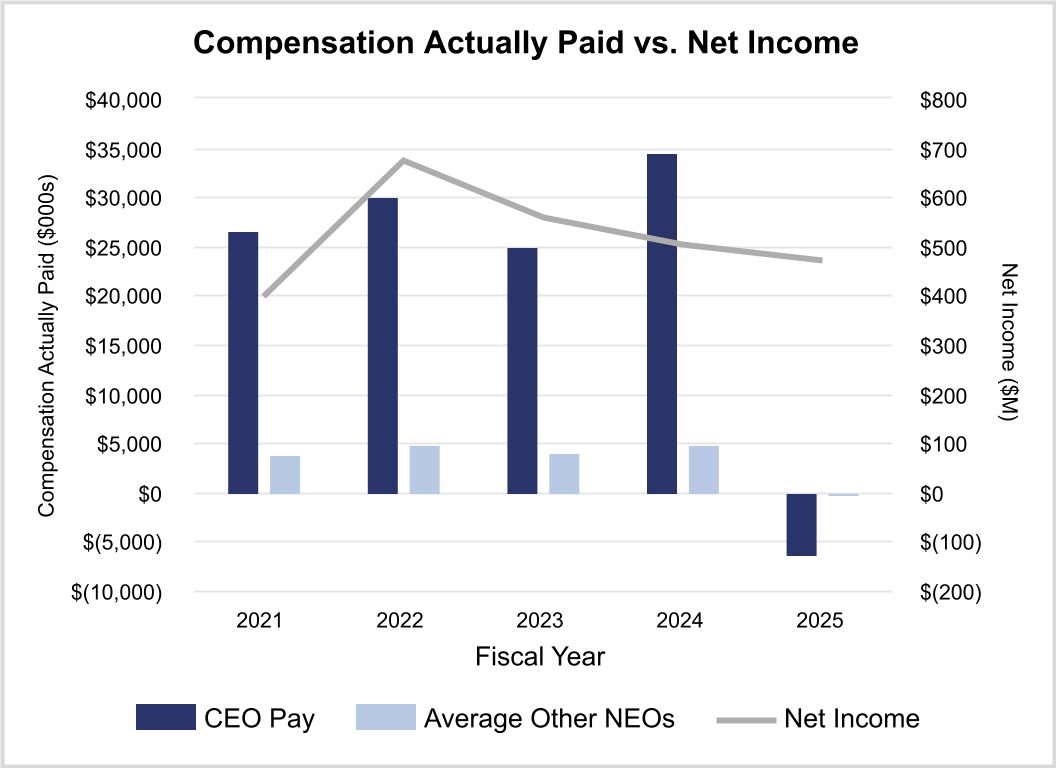
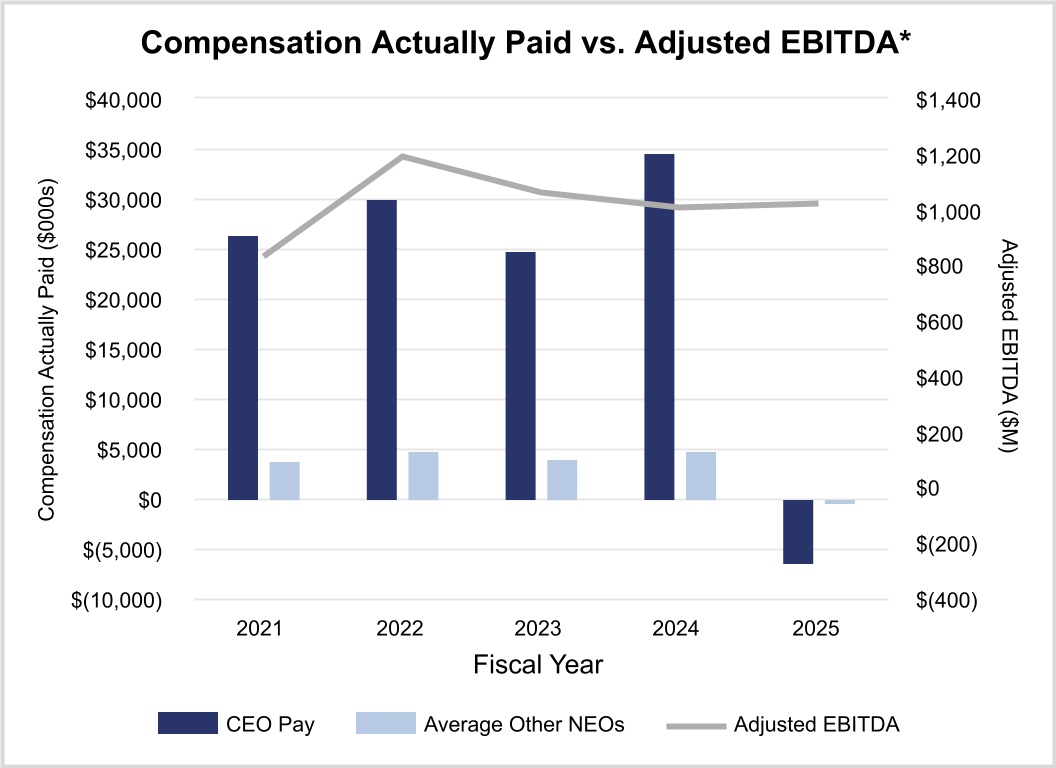
The following table sets forth the compensation for our Principal Executive Officer (“PEO” or “CEO”) and the average compensation for our other NEOs (non-PEO NEOs), both as reported in the Summary Compensation Table (“SCT”) and with certain adjustments to reflect the “compensation actually paid” (“CAP”) to such individuals, as defined under SEC rules, for of the years ended December 31, 2025, 2024, 2023, 2022 and 2021. The table also provides information on our cumulative total stockholder return (“TSR”), the cumulative TSR of our peer group, Net Income and our Company Selected Measure, Adjusted EBITDA, over these years in accordance with SEC rules.
Murphy USA’s compensation program is focused on aligning pay with performance. Adjusted EBITDA, which encompasses all the moving parts of our business, serves as the largest component of the AIP, and half of our PSU program, and is a driving factor in ROACE. For detail on our executive compensation programs, see the Compensation Discussion and Analysis section beginning on page 27.
CAP, like compensation disclosed in the SCT, does not necessarily reflect the target value of compensation as approved by our Executive Compensation Committee or value of compensation realized by our executives based on Company and individual performance. Our Executive Compensation Committee has not used CAP as a basis for making compensation decisions. In addition, a significant portion of the CAP amounts shown relate to changes in values of unvested awards since they were awarded due to changes in our stock price. These unvested awards remain subject to significant risk from forfeiture conditions and possible future changes in value based on changes in our stock price. As described in detail in the Compensation Discussion
and Analysis, our PSUs are subject to multi-year performance conditions tied to two performance metrics and all of our annual equity awards are subject to time vesting conditions. The ultimate values actually realized by our NEOs from unvested annual equity awards, if any, will not be determined
The following table sets forth an unranked list of the financial performance measures that we view as the “most important” measures used to determine our PEO’s and non-PEO NEOs’ Compensation Actually Paid. For additional information illustrating the link between pay and performance at Murphy USA, please see the Compensation Discussion and Analysis beginning on page 27.
The graphs below compare the compensation actually paid to our PEO and the average of the compensation actually paid to our non-PEO NEOs, with (i) our TSR, (ii) our Net Income, and (iii) Adjusted EBITDA, which is our Company Selected Measure, for the fiscal years ended December 31, 2025, 2024, 2023, 2022 and 2021. In addition, the graphs below compare our TSR with our Peer Group TSR. Our performance has positively impacted our share price and as a result, compensation actually paid amounts for the PEO and non-PEO NEOs has been higher in each year presented as equity incentives, which comprise the largest portion of compensation for our executives, increase in value with the corresponding increase in the underlying stock
price. For additional information illustrating how we link pay and performance at Murphy USA, please see the Compensation Discussion and Analysis beginning on page 27.