Pay vs Performance Disclosure
Jan. 23, 2021
Dec. 31, 2020
Dec. 31, 2021
Dec. 31, 2026
Dec. 31, 2025
USD ($)
$ / shares
Dec. 31, 2024
USD ($)
$ / shares
Dec. 31, 2023
USD ($)
$ / shares
Dec. 31, 2022
USD ($)
$ / shares
Dec. 31, 2021
USD ($)
$ / shares
Year | Summary Compen- sation Table Total for First PEO1 2 | Summary Compen- sation Table Total for Second PEO1 2 | Compen- sation Actually Paid to First PEO3 | Compen- sation Actually Paid to Second PEO3 | Average Summary Compen- sation Table Total for non-PEO NEOs4 | Average Compen- sation Actually Paid to non-PEO NEOs5 | Value of Initial Fixed $100 Investment Based on: | Net Income8 | Company- Selected Financial Measure: Adjusted Earnings Per Share9 | |||||||||||||||||||||||
Company Total Share- holder Return6 | Peer Group Total Share- holder Return7 | |||||||||||||||||||||||||||||||
(a) | (b) | (b) | (c) | (c) | (d) | (e) | (f) | (g) | (h) | (i) | ||||||||||||||||||||||
2025 | $ | 7,918,150 | N/A | $ | 10,548,321 | N/A | $ | 1,892,698 | $ | 2,272,785 | $152.17 | $129.40 | $ | 312,994 | $6.80 | |||||||||||||||||
2024 | 11,702,922 | N/A | 16,368,170 | N/A | 2,174,490 | 2,738,132 | 131.43 | 124.82 | 60,258 | 4.43 | ||||||||||||||||||||||
2023 | 6,648,238 | N/A | 7,647,637 | N/A | 1,427,590 | 1,452,494 | 108.62 | 107.12 | 171,891 | 3.85 | ||||||||||||||||||||||
2022 | 8,052,476 | N/A | 7,889,221 | N/A | 1,691,250 | 1,640,899 | 101.36 | 113.76 | 315,228 | 3.13 | ||||||||||||||||||||||
2021 | 23,622,960 | $1,196,558 | 22,378,121 | $1,161,996 | 1,696,160 | 1,553,822 | 101.26 | 139.01 | 235,218 | 4.78 | ||||||||||||||||||||||
2 The dollar amounts reported in column (b) are the amounts of total compensation reported for the Company’s PEOs for each corresponding year in the “Total” column of the Summary Compensation Table. Refer to “Executive Compensation – Executive Compensation Tables – 2025 Summary Compensation Table” of this Proxy Statement and the Company’s proxy statements in 2025, 2024, 2023, and 2022.
The dollar amounts reported in column (d) represent the average of the amounts reported for the Company’s named executive officers (“NEOs”) as a group (excluding persons serving as PEOs) in the “Total” column of the Summary Compensation Table in each applicable year. The names of each of the NEOs (excluding such PEOs) included for purposes of calculating the average amounts in each applicable year are as follows: (i) for 2025 and 2024, J. Matthew Scurlock, John W. Cummings, David W. Oman and Anna M. Alvarado-Pearce, (ii) for 2023 and 2022, J. Matthew Scurlock, John W. Cummings, Tim J. Storms and Anna M. Alvarado-Pearce; and (iii) for 2021, Julie L. Anderson, Tim J. Storms and Anna M. Alvarado-Pearce.
Year | Name of PEO | Reported Summary Compensation Table Total For PEO | [Less] Reported Value of Equity Awards(a) | [Plus/Minus] Equity Award Adjustments(b) | [Less] Reported Change in the Actuarial Present Value of Pension Benefits(c) | [Plus/Minus] Pension Benefit Adjustments(d) | [Equals] Compensation Actually Paid to PEO | ||||||||||||||||
2025 | Rob C. Holmes | $ | 7,918,150 | $ | (4,473,537) | $ | 7,103,708 | $ | — | $ | — | $ | 10,548,321 | ||||||||||
(a) The grant date fair value of equity awards represents the total of the amounts reported in the “Stock Awards” and “Option Awards” columns in the Summary Compensation Table for each applicable year.
(b) The equity award adjustments for each applicable year include the addition (or subtraction, as applicable) of the following: (i) the year-end fair value of any equity awards granted in the applicable year that are outstanding and unvested as of the end of the year; (ii) the amount of change as of the end of the applicable year (from the end of the prior fiscal year) in fair value of any awards granted in prior years that are outstanding and unvested as of the end of the applicable year; (iii) for awards that are granted and vest in same applicable year, the fair value as of the vesting date; (iv) for awards granted in prior years that vest in the applicable year, the amount equal to the change as of the vesting date (from the end of the prior fiscal year) in fair value; (v) for awards granted in prior years that are determined to fail to meet the applicable vesting conditions during the applicable year, a deduction for the amount equal to the fair value at the end of the prior fiscal year; and (vi) the dollar value of any dividends or other earnings paid on stock or option awards in the applicable year prior to the vesting date that are not otherwise reflected in the fair value of such award or included in any other component of total compensation for the applicable year. The valuation assumptions used to calculate fair values did not materially differ from those disclosed at the time of grant, except that the Company’s outstanding 2023 NEO performance-based RSUs granted on February 9, 2023 are calculated using an aggregate performance factor of 80.0%. The amounts deducted or added in calculating the equity award adjustments are as follows:
Year | Name of PEO | Year End Fair Value of Equity Awards Granted in Current Year | Year over Year Change in Fair Value of Outstanding and Unvested Equity Awards | Fair Value as of Vesting Date of Equity Awards Granted and Vested in the Year | Year over Year Change in Fair Value of Equity Awards Granted in Prior Years that Vested in the Year | Fair Value at the End of the Prior Year of Equity Awards that Failed to Meet Vesting Conditions in the Year | Value of Dividends or other Earnings Paid on Stock or Option Awards not Otherwise Reflected in Fair Value or Total Compensation | Total Equity Award Adjustments | ||||||||||||||||||
2025 | Rob C. Holmes | $ | 5,430,945 | $ | 1,308,682 | $ | 51,757 | $ | 312,324 | $ | — | $ | — | $ | 7,103,708 | |||||||||||
(c) The amounts included in this column are the amounts reported in the “Change in Pension and Nonqualified Deferred Compensation” column of the Summary Compensation Table for each applicable year.
(d) There were no pension benefits adjustments for the years in the table.
Year | Average Reported Summary Compensation Table Total for Non-PEO NEOs | [Less] Average Reported Value of Equity Awards | [Plus/Minus] Average Equity Award Adjustments(a) | [Less] Average Reported Change in the Actuarial Present Value of Pension Benefits | [Plus/Minus] Average Pension Benefit Adjustments | Average Compensation Actually Paid to Non-PEO NEOs | ||||||||||||||
2025 | $ | 1,892,698 | $ | (790,551) | $ | 1,170,638 | $ | — | $ | — | $ | 2,272,785 | ||||||||
(a) The amounts deducted or added in calculating the total average equity award adjustments are as follows:
Year | Average Year End Fair Value of Equity Awards Granted in Current Year | Year over Year Average Change in Fair Value of Outstanding and Unvested Equity Awards | Average Fair Value as of Vesting Date of Equity Awards Granted and Vested in the Year | Year over Year Average Change in Fair Value of Equity Awards Granted in Prior Years that Vested in the Year | Average Fair Value at the End of the Prior Year of Equity Awards that Failed to Meet Vesting Conditions in the Year | Average Value of Dividends or other Earnings Paid on Stock or Option Awards not Otherwise Reflected in Fair Value or Total Compensation | Total Average Equity Award Adjustments | ||||||||||||||||
2025 | $ | 970,391 | $ | 165,887 | $ | — | $ | 34,360 | $ | — | $ | — | $ | 1,170,638 | |||||||||
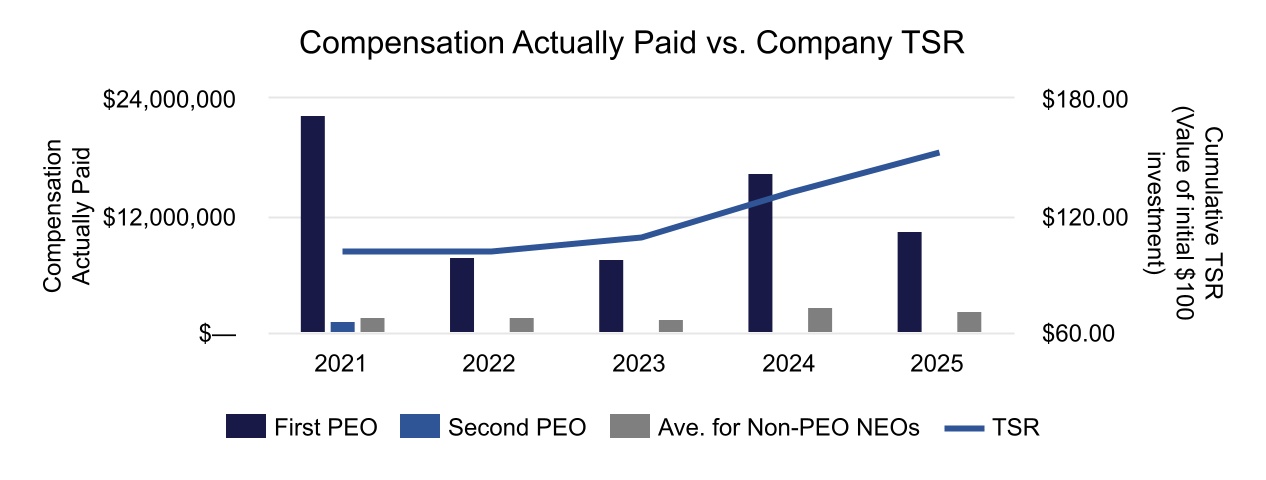
As demonstrated by the following graph, the amount of compensation actually paid to the PEOs and the average amount of compensation actually paid to the Company’s NEOs as a group (excluding the PEOs) is generally aligned with the Company’s cumulative TSR over the five years presented in the table. The alignment of compensation actually paid with the Company’s cumulative TSR over the period presented is because a significant portion of the compensation actually paid to the PEOs and to the other NEOs is comprised of equity awards. As described in more detail in the section entitled “Compensation Discussion and Analysis”, the Company targets that more than 58% of the value of the PEOs’ total target compensation (and more than 40% of the value of the other NEOs’ total target compensation) is comprised of equity awards, including performance-based and time-based restricted stock units.
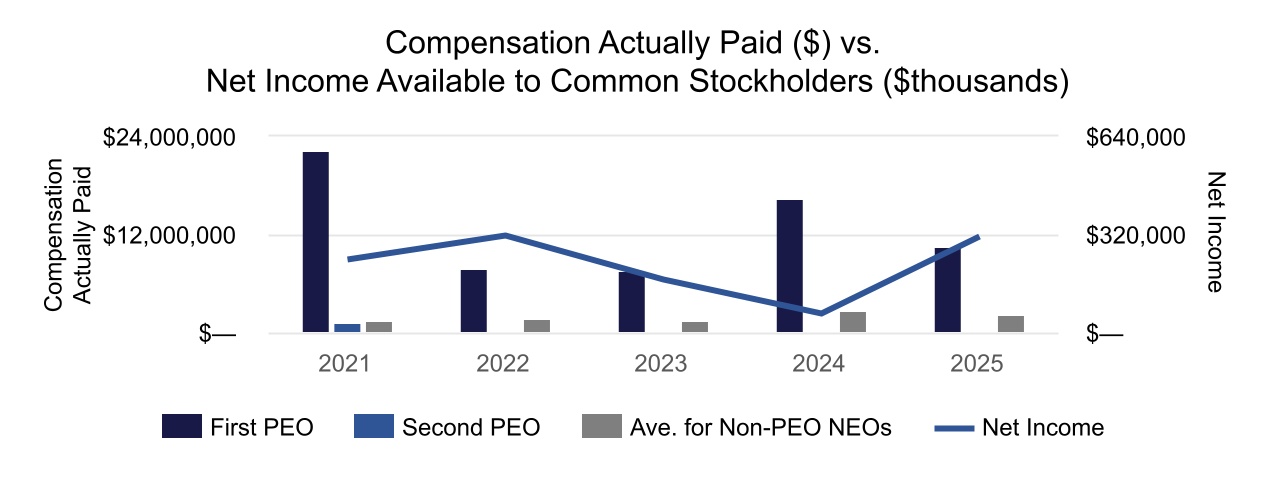
As demonstrated by the following graph, the amount of compensation actually paid to the PEOs and the average amount of compensation actually paid to the Company’s NEOs as a group (excluding the PEOs) is generally aligned with the Company’s net income over the five years presented in the graph. For 2024, the CEO received a one-time equity award in connection with the execution of a new employment agreement, which accounts for a portion of the CEO’s higher “Compensation Actually Paid” for that year. As described in more detail in the section entitled “Compensation Discussion and Analysis”, the Company targets that approximately 26% of the value of total compensation awarded to the NEOs consists of amounts determined under the Company short-term annual incentive compensation plan.
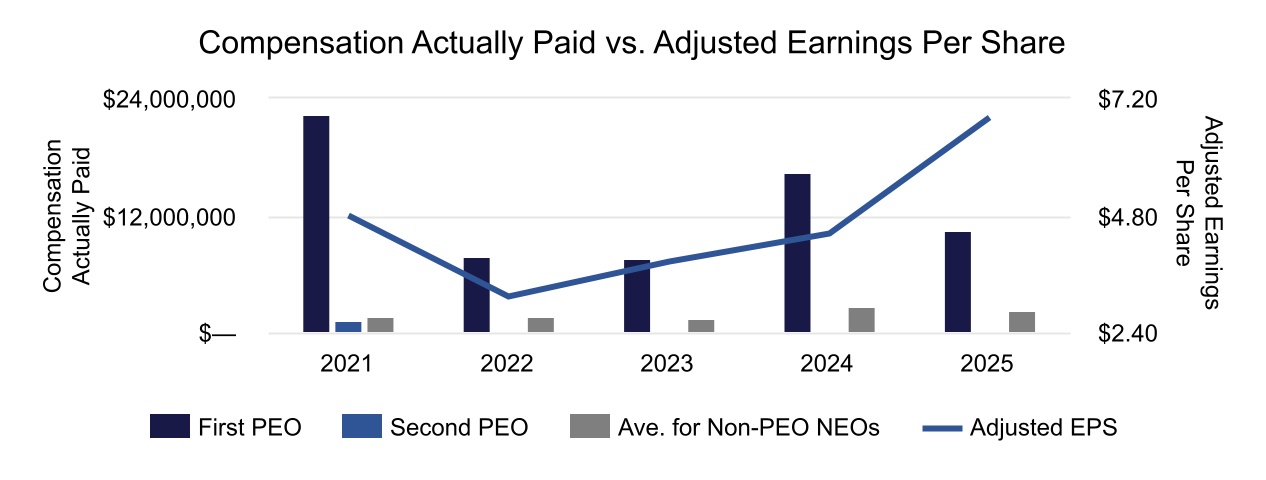
As demonstrated by the following graph, the amount of compensation actually paid to the Company’s PEOs and the average amount of compensation actually paid to the Company’s NEOs as a group (excluding the PEOs) is generally aligned with the Company’s Adjusted Earnings Per Share over the five years presented in the graph. Although the Company uses numerous financial and non-financial performance measures for the purpose of evaluating performance for the Company’s compensation programs, the Company has determined that Adjusted Earnings Per Share is the financial performance measure that, in the Company’s assessment, represents the most important performance measure (that is not otherwise required to be disclosed in the table) used by the Company to link compensation actually paid to the Company’s NEOs, for the most recently completed fiscal year, to Company performance. Earnings Per Share is closely correlated with both of the two financial measures used in the 2025 annual (short-term) incentive plan — Return on Average Assets and Efficiency Ratio — and both of the two financial measures used in the 2025 long-term incentive plan — Average ROTCE and Relative TSR — for performance-based RSUs granted during 2025. While more recently the Company has moved away from utilizing Earnings Per Share as an express performance measure, the Compensation Committee still considers Adjusted Earnings Per Share in setting final overall pay. For more information regarding the information that the Compensation Committee considers when determining compensation, refer to “Compensation Discussion and Analysis”.
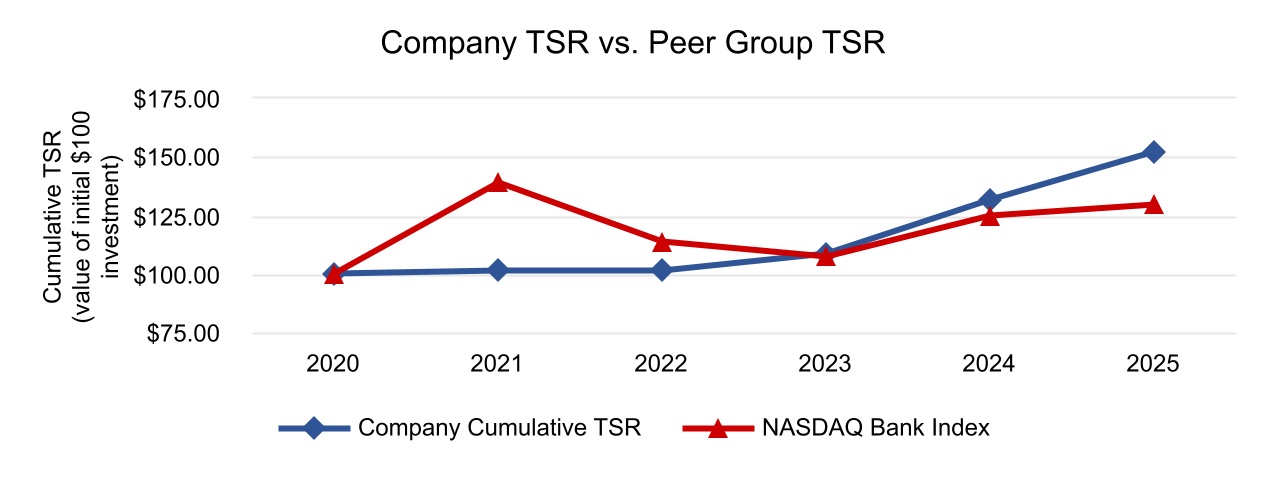
As demonstrated by the following graph, the Company’s cumulative TSR over the five year period presented in the table was $152.17, while the cumulative TSR of the peer group presented for this purpose, the NASDAQ Bank Index, was $129.40 over the same period. The Company’s cumulative TSR outperformed the NASDAQ Bank Index during three of the last five years presented in the table, representing the Company’s financial performance as compared to the companies comprising the NASDAQ Bank Index peer group. For more information regarding the Company’s performance and the companies that the Compensation Committee considers when determining compensation, refer to “Compensation Discussion and Analysis”.