
Exhibit 99.2
CION Investment Corporation Fourth Quarter 2025 Earnings Presentation
Disclosures and Forward - Looking Statements 2 The information contained in this earnings presentation should be viewed in conjunction with the earnings conference call of CION Investment Corporation (NYSE : CION) (“CION” or the “Company”) held on Thursday, March 12 , 2026 as well as the Company’s Annual Report on Form 10 - K for the year ended December 31 , 2025 that was filed with the Securities and Exchange Commission (the “SEC”) on March 12 , 2026 . The information contained herein may not be used, reproduced or distributed to others, in whole or in part, for any other purpose without the prior written consent of the Company . This earnings presentation may contain forward - looking statements that involve substantial risks and uncertainties, including the impact of tariffs and trade disputes with other countries, changes in inflation, high interest rates and the risk of recession on the business, future operating results, access to capital and liquidity of the Company and its portfolio companies . You can identify these statements by the use of forward - looking terminology such as “may,” “will,” “should,” “expect,” “anticipate,” “project,” “target,” “estimate,” “intend,” “continue,” or “believe” or the negatives thereof or other variations thereon or comparable terminology, including references to assumptions, forecasts of future results, shareholder diversification, institutional research coverage and availability and access to capital . You should read statements that contain these words carefully because they discuss the Company’s plans, strategies, prospects and expectations concerning its business, operating results, financial condition and other similar matters . These statements represent the Company’s belief regarding future events that, by their nature, are uncertain and outside of the Company’s control, such as the price at which the Company’s shares of common stock and other securities will trade on the NYSE . Any forward - looking statement made by the Company in this earnings presentation speaks only as of the date on which the Company makes it . Factors or events that could cause the Company’s actual results to differ, possibly materially from its expectations, include, but are not limited to, the risks, uncertainties and other factors the Company identifies in the sections entitled “Risk Factors” and “Forward - Looking Statements” in filings the Company makes with the SEC, and it is not possible for the Company to predict or identify all of them . The Company undertakes no obligation to update or revise publicly any forward - looking statements, whether as a result of new information, future events or otherwise, except as required by law . This earnings presentation does not constitute a prospectus and should under no circumstances be understood as an offer to sell or the solicitation of an offer to buy the Company’s common stock or any other securities nor will there be any sale of common stock or any other securities referred to in this earnings presentation in any state or jurisdiction in which such offer, solicitation or sale would be unlawful prior to the registration or qualification under the securities laws of such state or jurisdiction . Nothing in these materials should be construed as a recommendation to invest in any securities that may be issued by the Company or as legal, accounting or tax advice . An investment in securities of the type described herein presents certain risks . The Company is managed by CION Investment Management, LLC, an affiliate of the Company . Nothing contained herein shall be relied upon as a promise or representation whether as to past or future performance . The information contained in this earnings presentation is summary information that is intended to be considered in the context of other public announcements that the Company may make, by press release or otherwise, from time to time . The Company undertakes no duty or obligation to publicly update or revise the information contained in this earnings presentation, except as required by law . These materials contain information about the Company, certain of its personnel and affiliates and its historical performance . You should not view information related to past performance of the Company as indicative of its future results, the achievement of which cannot be assured . Past performance does not guarantee future results, which may vary . The value of investments and the income derived from investments will fluctuate and can go down as well as up . A loss of principal may occur .
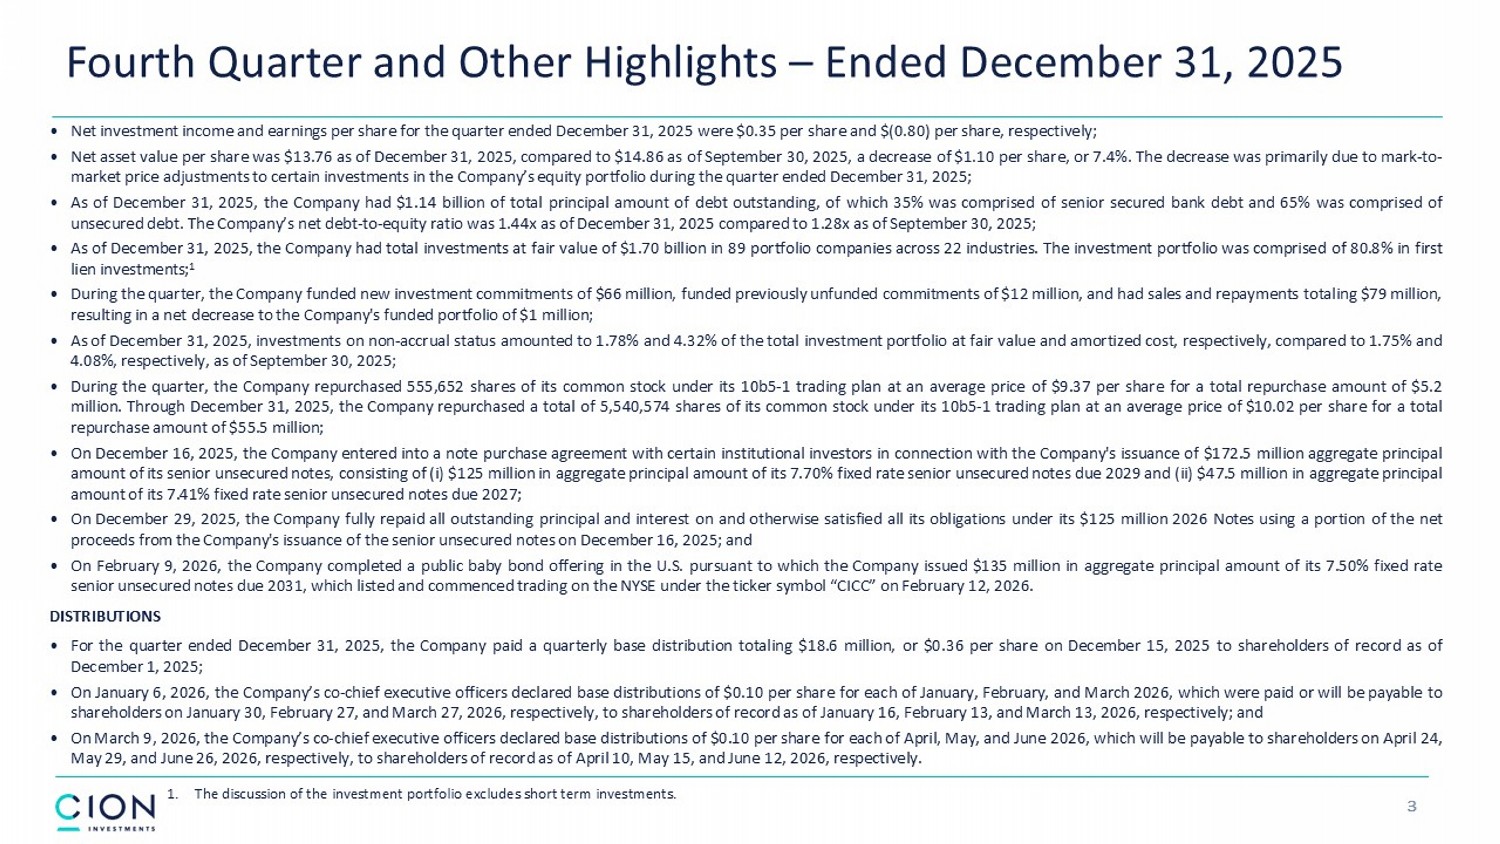
3 1. The discussion of the investment portfolio excludes short term investments. Fourth Quarter and Other Highlights – Ended December 31, 2025 • Net investment income and earnings per share for the quarter ended December 31 , 2025 were $ 0 . 35 per share and $ ( 0 . 80 ) per share, respectively ; • Net asset value per share was $ 13 . 76 as of December 31 , 2025 , compared to $ 14 . 86 as of September 30 , 2025 , a decrease of $ 1 . 10 per share, or 7 . 4 % . The decrease was primarily due to mark - to - market price adjustments to certain investments in the Company’s equity portfolio during the quarter ended December 31 , 2025 ; • As of December 31 , 2025 , the Company had $ 1 . 14 billion of total principal amount of debt outstanding, of which 35 % was comprised of senior secured bank debt and 65 % was comprised of unsecured debt . The Company’s net debt - to - equity ratio was 1 . 44 x as of December 31 , 2025 compared to 1 . 28 x as of September 30 , 2025 ; • As of December 31 , 2025 , the Company had total investments at fair value of $ 1 . 70 billion in 89 portfolio companies across 22 industries . The investment portfolio was comprised of 80 . 8 % in first lien investments ; 1 • During the quarter, the Company funded new investment commitments of $ 66 million, funded previously unfunded commitments of $ 12 million, and had sales and repayments totaling $ 79 million, resulting in a net decrease to the Company's funded portfolio of $ 1 million ; • As of December 31 , 2025 , investments on non - accrual status amounted to 1 . 78 % and 4 . 32 % of the total investment portfolio at fair value and amortized cost, respectively, compared to 1 . 75 % and 4 . 08 % , respectively, as of September 30 , 2025 ; • During the quarter, the Company repurchased 555 , 652 shares of its common stock under its 10 b 5 - 1 trading plan at an average price of $ 9 . 37 per share for a total repurchase amount of $ 5 . 2 million . Through December 31 , 2025 , the Company repurchased a total of 5 , 540 , 574 shares of its common stock under its 10 b 5 - 1 trading plan at an average price of $ 10 . 02 per share for a total repurchase amount of $ 55 . 5 million ; • On December 16 , 2025 , the Company entered into a note purchase agreement with certain institutional investors in connection with the Company's issuance of $ 172 . 5 million aggregate principal amount of its senior unsecured notes, consisting of (i) $ 125 million in aggregate principal amount of its 7 . 70 % fixed rate senior unsecured notes due 2029 and (ii) $ 47 . 5 million in aggregate principal amount of its 7 . 41 % fixed rate senior unsecured notes due 2027 ; • On December 29 , 2025 , the Company fully repaid all outstanding principal and interest on and otherwise satisfied all its obligations under its $ 125 million 2026 Notes using a portion of the net proceeds from the Company's issuance of the senior unsecured notes on December 16 , 2025 ; and • On February 9 , 2026 , the Company completed a public baby bond offering in the U . S . pursuant to which the Company issued $ 135 million in aggregate principal amount of its 7 . 50 % fixed rate senior unsecured notes due 2031 , which listed and commenced trading on the NYSE under the ticker symbol “CICC” on February 12 , 2026 . DISTRIBUTIONS • For the quarter ended December 31 , 2025 , the Company paid a quarterly base distribution totaling $ 18 . 6 million, or $ 0 . 36 per share on December 15 , 2025 to shareholders of record as of December 1 , 2025 ; • On January 6 , 2026 , the Company’s co - chief executive officers declared base distributions of $ 0 . 10 per share for each of January, February, and March 2026 , which were paid or will be payable to shareholders on January 30 , February 27 , and March 27 , 2026 , respectively, to shareholders of record as of January 16 , February 13 , and March 13 , 2026 , respectively ; and • On March 9 , 2026 , the Company’s co - chief executive officers declared base distributions of $ 0 . 10 per share for each of April, May, and June 2026 , which will be payable to shareholders on April 24 , May 29 , and June 26 , 2026 , respectively, to shareholders of record as of April 10 , May 15 , and June 12 , 2026 , respectively .
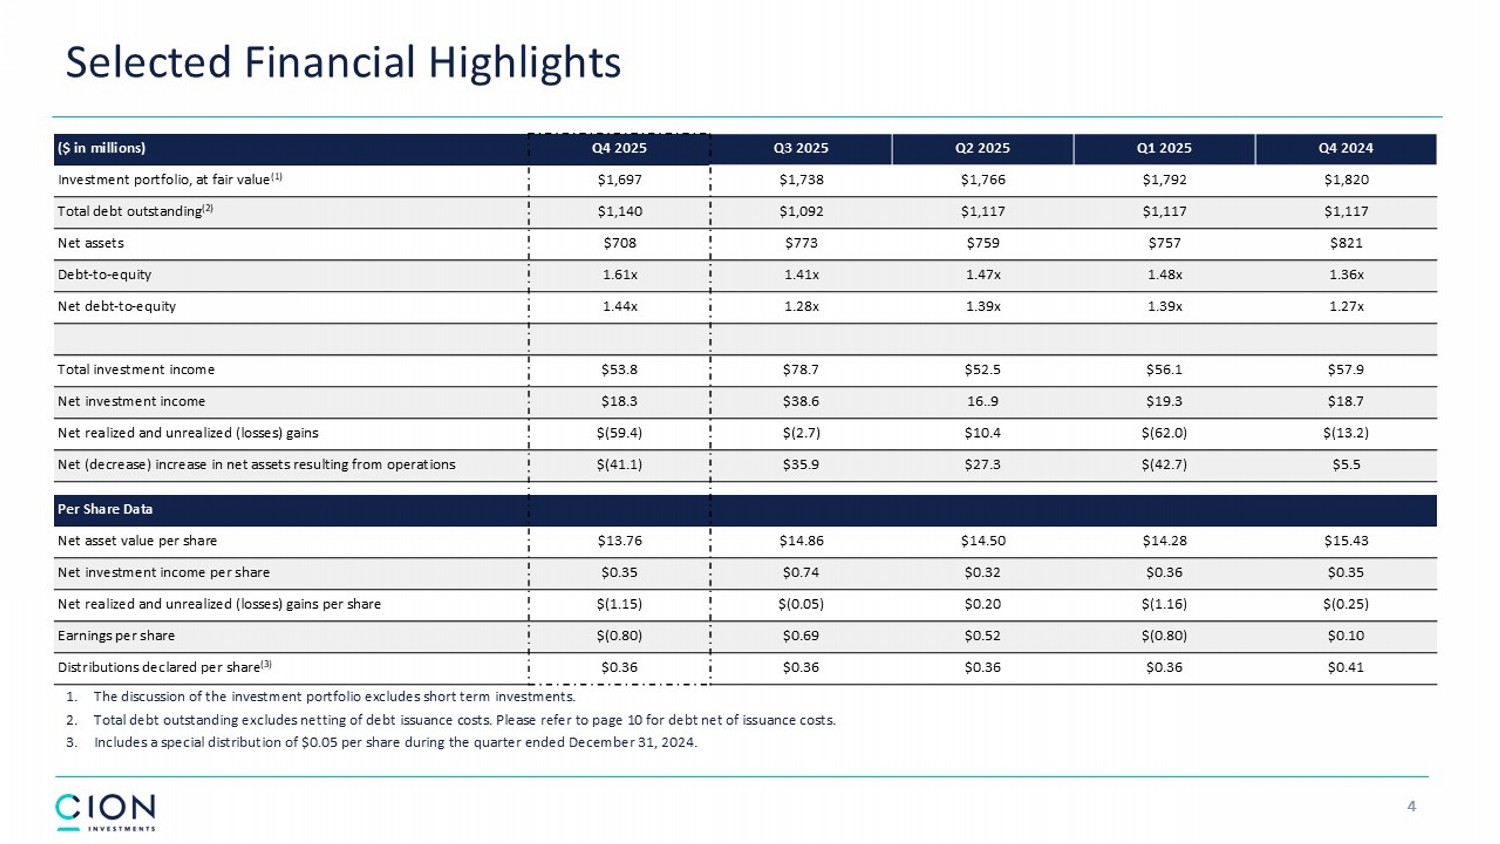
4 Selected Financial Highlights 1. The discussion of the investment portfolio excludes short term investments. 2. Total debt outstanding excludes netting of debt issuance costs. Please refer to page 10 for debt net of issuance costs. 3. Includes a special distribution of $0.05 per share during the quarter ended December 31, 2024. Q4 2024 Q1 2025 Q2 2025 Q3 2025 Q4 2025 ($ in millions) $1,820 $1,792 $1,766 $1,738 $1,697 Investment portfolio, at fair value (1) $1,117 $1,117 $1,117 $1,092 $1,140 Total debt outstanding (2) $821 $757 $759 $773 $708 Net assets 1.36x 1.48x 1.47x 1.41x 1.61x Debt - to - equity 1.27x 1.39x 1.39x 1.28x 1.44x Net debt - to - equity $57.9 $56.1 $52.5 $78.7 $53.8 Total investment income $18.7 $19.3 16..9 $38.6 $18.3 Net investment income $(13.2) $(62.0) $10.4 $(2.7) $(59.4) Net realized and unrealized (losses) gains $5.5 $(42.7) $27.3 $35.9 $(41.1) Net (decrease) increase in net assets resulting from operations Per Share Data $15.43 $14.28 $14.50 $14.86 $13.76 Net asset value per share $0.35 $0.36 $0.32 $0.74 $0.35 Net investment income per share $(0.25) $(1.16) $0.20 $(0.05) $(1.15) Net realized and unrealized (losses) gains per share $0.10 $(0.80) $0.52 $0.69 $(0.80) Earnings per share $0.41 $0.36 $0.36 $0.36 $0.36 Distributions declared per share (3)
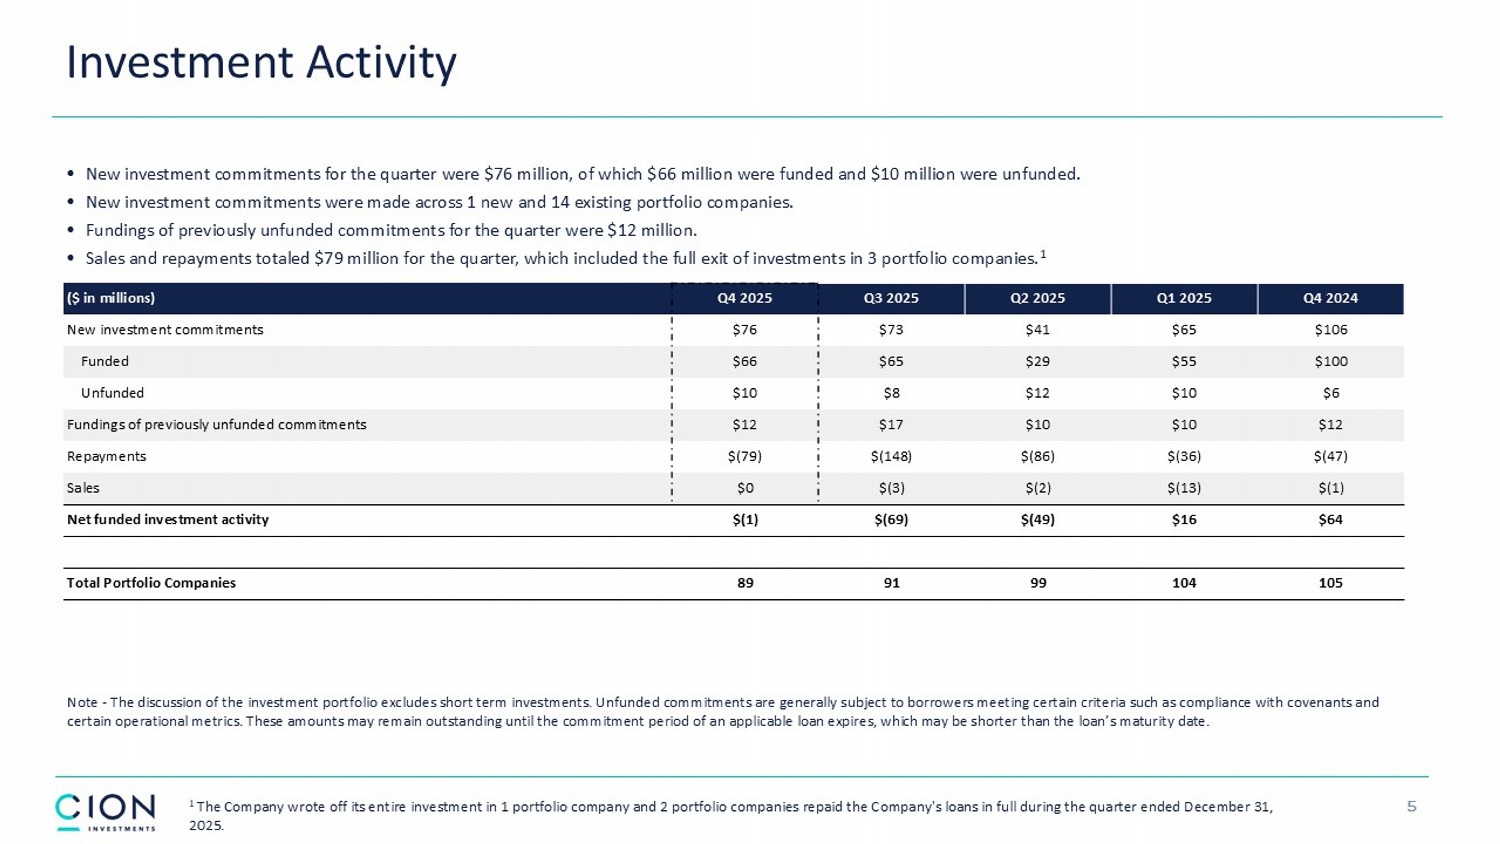
Investment Activity • New investment commitments for the quarter were $76 million, of which $66 million were funded and $10 million were unfunded. • New investment commitments were made across 1 new and 14 existing portfolio companies. • Fundings of previously unfunded commitments for the quarter were $12 million. • Sales and repayments totaled $79 million for the quarter, which included the full exit of investments in 3 portfolio companie s. 1 Note - The discussion of the investment portfolio excludes short term investments. Unfunded commitments are generally subject to borrowers meeting certain criteria such as compliance with covenants and certain operational metrics. These amounts may remain outstanding until the commitment period of an applicable loan expires, whi ch may be shorter than the loan’s maturity date. 5 Q4 2024 Q1 2025 Q2 2025 Q3 2025 Q4 2025 ($ in millions) $106 $65 $41 $73 $76 New investment commitments $100 $55 $29 $65 $66 Funded $6 $10 $12 $8 $10 Unfunded $12 $10 $10 $17 $12 Fundings of previously unfunded commitments $(47) $(36) $(86) $(148) $(79) Repayments $(1) $(13) $(2) $(3) $0 Sales $64 $16 $(49) $(69) $(1) Net funded investment activity 105 104 99 91 89 Total Portfolio Companies 1 The Company wrote off its entire investment in 1 portfolio company and 2 portfolio companies repaid the Company's loans in fu ll during the quarter ended December 31, 2025.
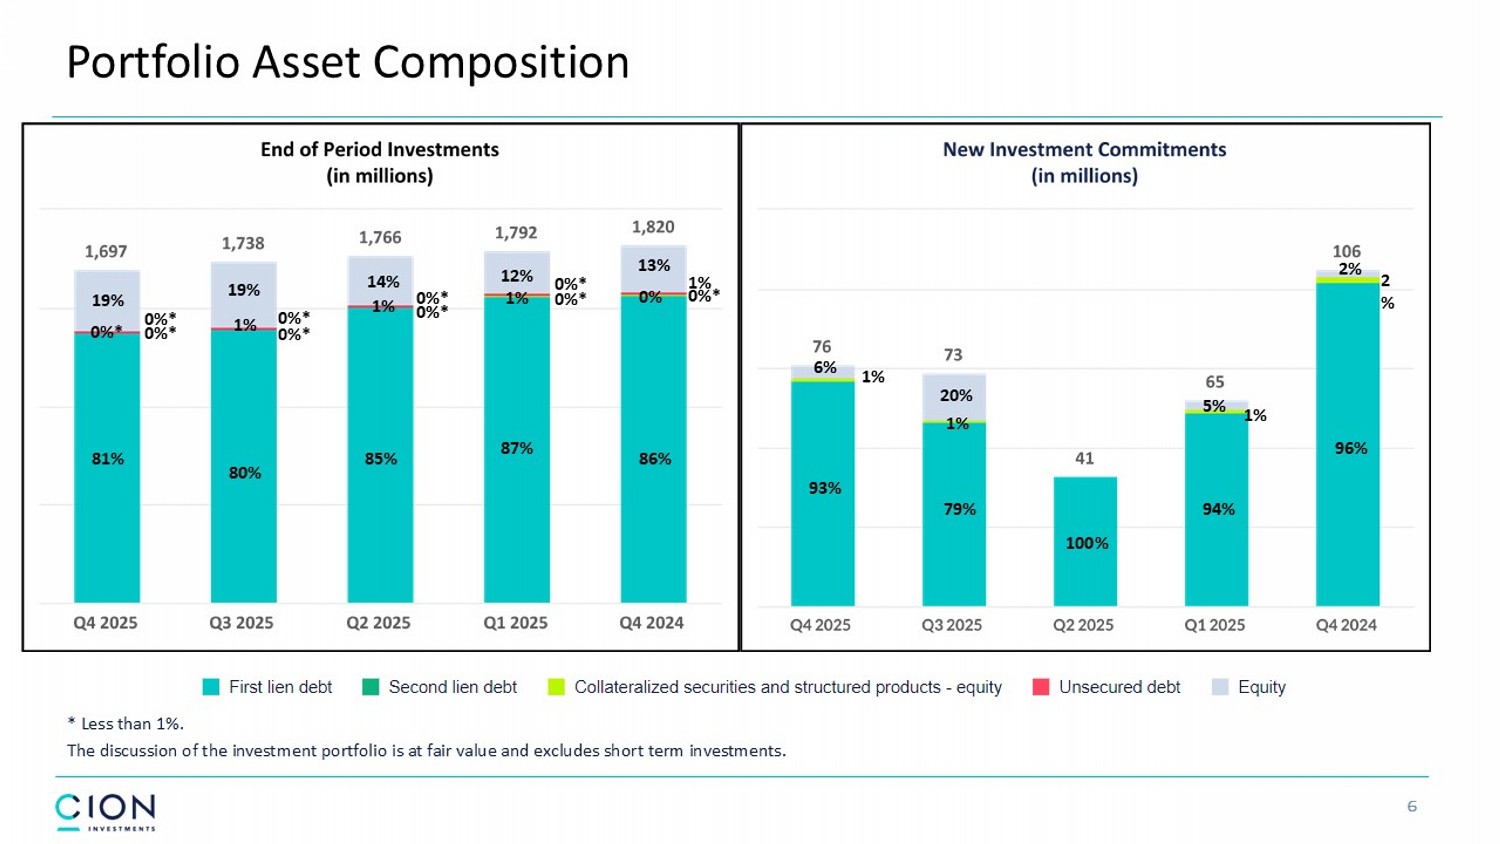
6 Portfolio Asset Composition * Less than 1%. The discussion of the investment portfolio is at fair value and excludes short term investments. 96% 93% 100% 79% 1% 87% 19% 0%* 0%* 0%* 0%* 0%* 0%* 1% 86% 1% 12% 81% 13% 0% 85% 1% 19% 14% 1% 0%* 94% 5% 80% 0%* 0%* 0%* 6% 1% 20% 1% 2% 2 %
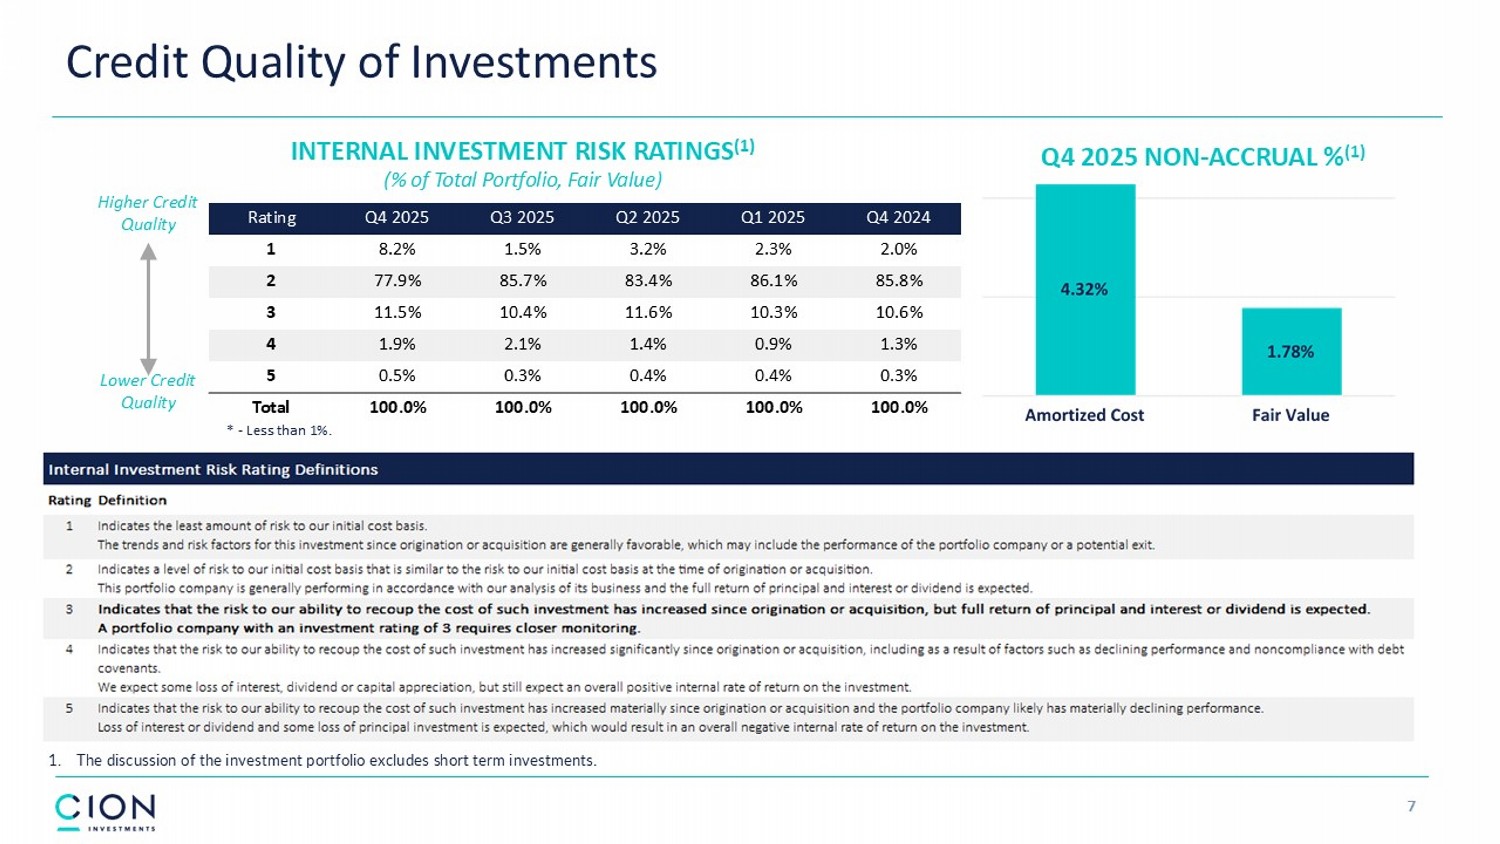
7 INTERNAL INVESTMENT RISK RATINGS (1) (% of Total Portfolio, Fair Value) Q4 2025 NON - ACCRUAL % (1) Higher Credit Quality Lower Credit Quality Credit Quality of Investments 1. The discussion of the investment portfolio excludes short term investments. * - Less than 1%. Q4 2024 Q1 2025 Q2 2025 Q3 2025 Q4 2025 Rating 2.0% 2.3% 3.2% 1.5% 8.2% 1 85.8% 86.1% 83.4% 85.7% 77.9% 2 10.6% 10.3% 11.6% 10.4% 11.5% 3 1.3% 0.9% 1.4% 2.1% 1.9% 4 0.3% 0.4% 0.4% 0.3% 0.5% 5 100.0% 100.0% 100.0% 100.0% 100.0% Total
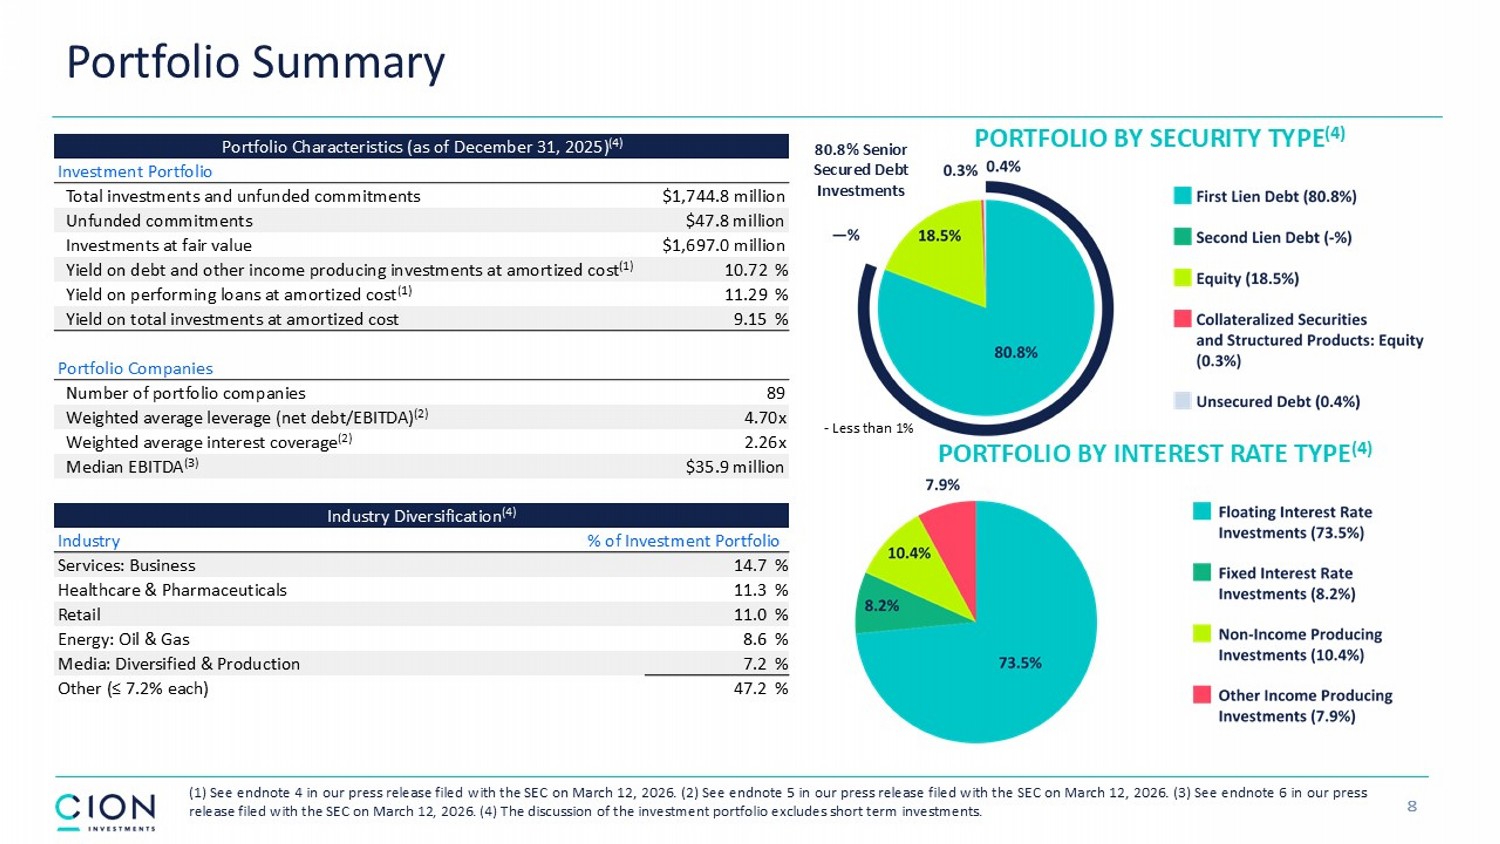
PORTFOLIO BY SECURITY TYPE (4) PORTFOLIO BY INTEREST RATE TYPE (4) Portfolio Summary 8 ( 1 ) See endnote 4 in our press release filed with the SEC on March 12 , 2026 . ( 2 ) See endnote 5 in our press release filed with the SEC on March 12 , 2026 . ( 3 ) See endnote 6 in our press release filed with the SEC on March 12 , 2026 . ( 4 ) The discussion of the investment portfolio excludes short term investments . Portfolio Characteristics (as of December 31, 2025) (4) Investment Portfolio $1,744.8 million Total investments and unfunded commitments $47.8 million Unfunded commitments $1,697.0 million Investments at fair value 10.72 % Yield on debt and other income producing investments at amortized cost (1) 11.29 % Yield on performing loans at amortized cost (1) 9.15 % Yield on total investments at amortized cost Portfolio Companies 89 Number of portfolio companies 4.70x Weighted average leverage (net debt/EBITDA) (2) 2.26x Weighted average interest coverage (2) $35.9 million Median EBITDA (3) Industry Diversification (4) % of Investment Portfolio Industry 14.7 % Services: Business 11.3 % Healthcare & Pharmaceuticals 11.0 % Retail 8.6 % Energy: Oil & Gas 7.2 % Media: Diversified & Production 47.2 % Other (≤ 7.2% each) 80.8% Senior Secured Debt Investments - Less than 1%
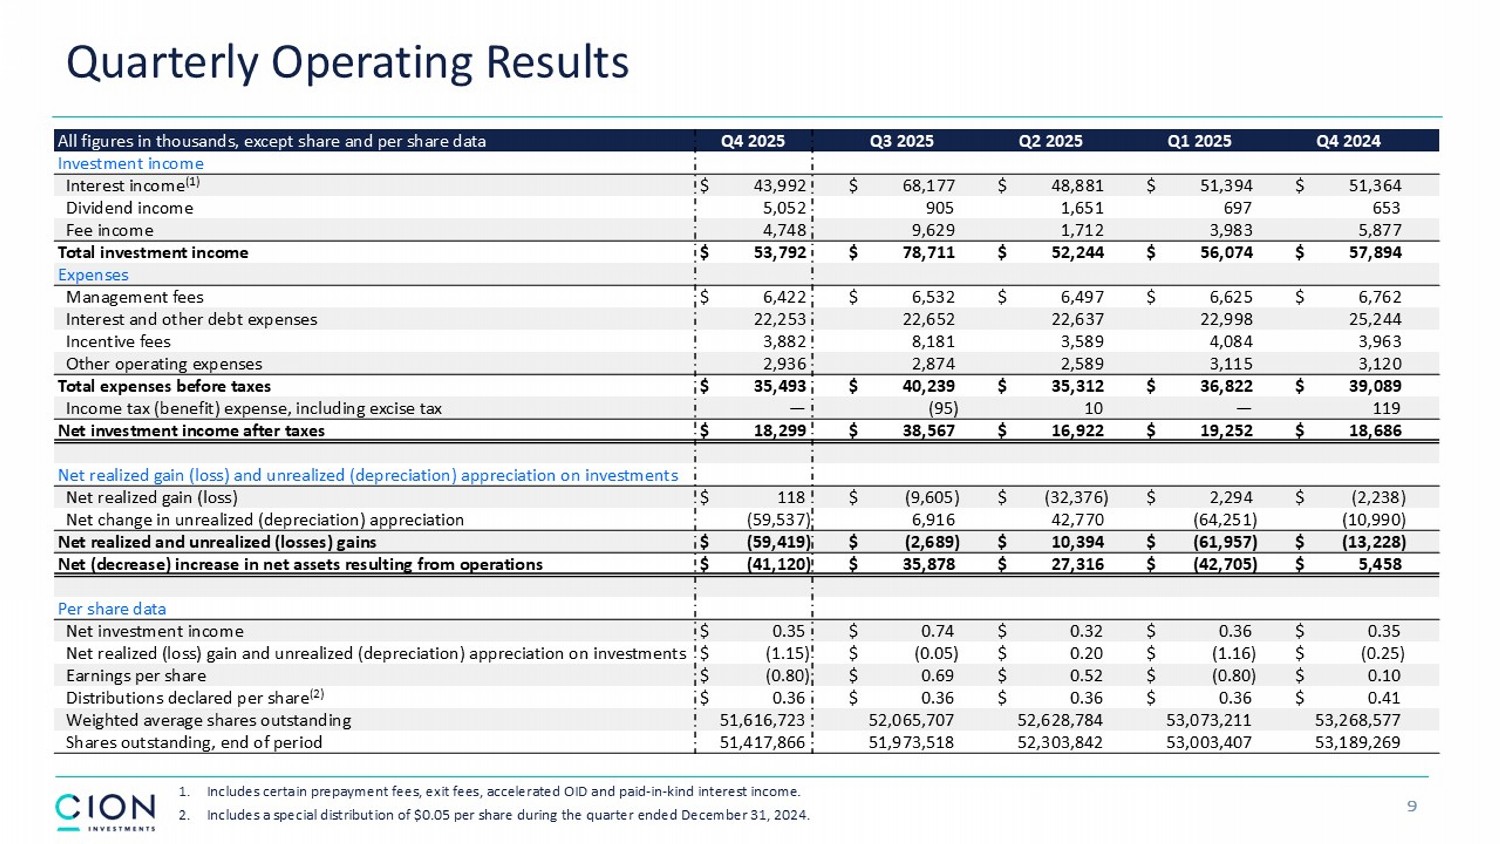
Quarterly Operating Results 9 Q4 2024 Q1 2025 Q2 2025 Q3 2025 Q4 2025 All figures in thousands, except share and per share data Investment income $ 51,364 $ 51,394 $ 48,881 $ 68,177 $ 43,992 Interest income (1) 653 697 1,651 905 5,052 Dividend income 5,877 3,983 1,712 9,629 4,748 Fee income $ 57,894 $ 56,074 $ 52,244 $ 78,711 $ 53,792 Total investment income Expenses $ 6,762 $ 6,625 $ 6,497 $ 6,532 $ 6,422 Management fees 25,244 22,998 22,637 22,652 22,253 Interest and other debt expenses 3,963 4,084 3,589 8,181 3,882 Incentive fees 3,120 3,115 2,589 2,874 2,936 Other operating expenses $ 39,089 $ 36,822 $ 35,312 $ 40,239 $ 35,493 Total expenses before taxes 119 — 10 (95) — Income tax (benefit) expense, including excise tax $ 18,686 $ 19,252 $ 16,922 $ 38,567 $ 18,299 Net investment income after taxes Net realized gain (loss) and unrealized (depreciation) appreciation on investments $ (2,238) $ 2,294 $ (32,376) $ (9,605) $ 118 Net realized gain (loss) (10,990) (64,251) 42,770 6,916 (59,537) Net change in unrealized (depreciation) appreciation $ (13,228) $ (61,957) $ 10,394 $ (2,689) $ (59,419) Net realized and unrealized (losses) gains $ 5,458 $ (42,705) $ 27,316 $ 35,878 $ (41,120) Net (decrease) increase in net assets resulting from operations Per share data $ 0.35 $ 0.36 $ 0.32 $ 0.74 $ 0.35 Net investment income $ (0.25) $ (1.16) $ 0.20 $ (0.05) $ (1.15) Net realized (loss) gain and unrealized (depreciation) appreciation on investments $ 0.10 $ (0.80) $ 0.52 $ 0.69 $ (0.80) Earnings per share $ 0.41 $ 0.36 $ 0.36 $ 0.36 $ 0.36 Distributions declared per share (2) 53,268,577 53,073,211 52,628,784 52,065,707 51,616,723 Weighted average shares outstanding 53,189,269 53,003,407 52,303,842 51,973,518 51,417,866 Shares outstanding, end of period 1. Includes certain prepayment fees, exit fees, accelerated OID and paid - in - kind interest income. 2. Includes a special distribution of $0.05 per share during the quarter ended December 31, 2024.
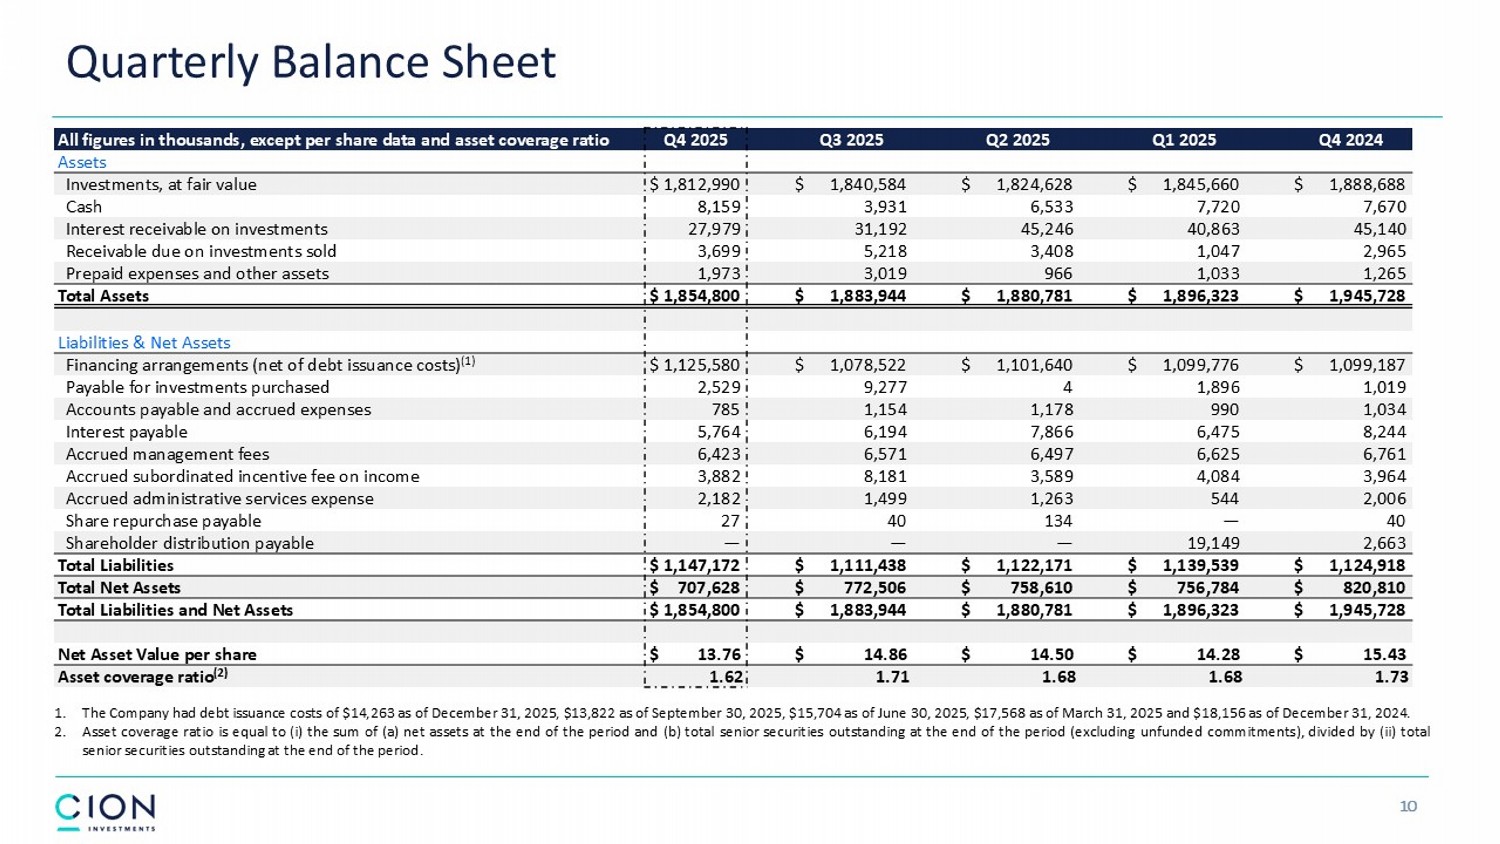
Quarterly Balance Sheet 10 Q4 2024 Q1 2025 Q2 2025 Q3 2025 Q4 2025 All figures in thousands, except per share data and asset coverage ratio Assets $ 1,888,688 $ 1,845,660 $ 1,824,628 $ 1,840,584 $ 1,812,990 Investments, at fair value 7,670 7,720 6,533 3,931 8,159 Cash 45,140 40,863 45,246 31,192 27,979 Interest receivable on investments 2,965 1,047 3,408 5,218 3,699 Receivable due on investments sold 1,265 1,033 966 3,019 1,973 Prepaid expenses and other assets $ 1,945,728 $ 1,896,323 $ 1,880,781 $ 1,883,944 $ 1,854,800 Total Assets Liabilities & Net Assets $ 1,099,187 $ 1,099,776 $ 1,101,640 $ 1,078,522 $ 1,125,580 Financing arrangements (net of debt issuance costs) (1) 1,019 1,896 4 9,277 2,529 Payable for investments purchased 1,034 990 1,178 1,154 785 Accounts payable and accrued expenses 8,244 6,475 7,866 6,194 5,764 Interest payable 6,761 6,625 6,497 6,571 6,423 Accrued management fees 3,964 4,084 3,589 8,181 3,882 Accrued subordinated incentive fee on income 2,006 544 1,263 1,499 2,182 Accrued administrative services expense 40 — 134 40 27 Share repurchase payable 2,663 19,149 — — — Shareholder distribution payable $ 1,124,918 $ 1,139,539 $ 1,122,171 $ 1,111,438 $ 1,147,172 Total Liabilities $ 820,810 $ 756,784 $ 758,610 $ 772,506 $ 707,628 Total Net Assets $ 1,945,728 $ 1,896,323 $ 1,880,781 $ 1,883,944 $ 1,854,800 Total Liabilities and Net Assets $ 15.43 $ 14.28 $ 14.50 $ 14.86 $ 13.76 Net Asset Value per share 1.73 1.68 1.68 1.71 1.62 Asset coverage ratio (2) 1. The Company had debt issuance costs of $ 14 , 263 as of December 31 , 2025 , $ 13 , 822 as of September 30 , 2025 , $ 15 , 704 as of June 30 , 2025 , $ 17 , 568 as of March 31 , 2025 and $ 18 , 156 as of December 31 , 2024 . 2. Asset coverage ratio is equal to (i) the sum of (a) net assets at the end of the period and (b) total senior securities outstanding at the end of the period (excluding unfunded commitments), divided by (ii) total senior securities outstanding at the end of the period .
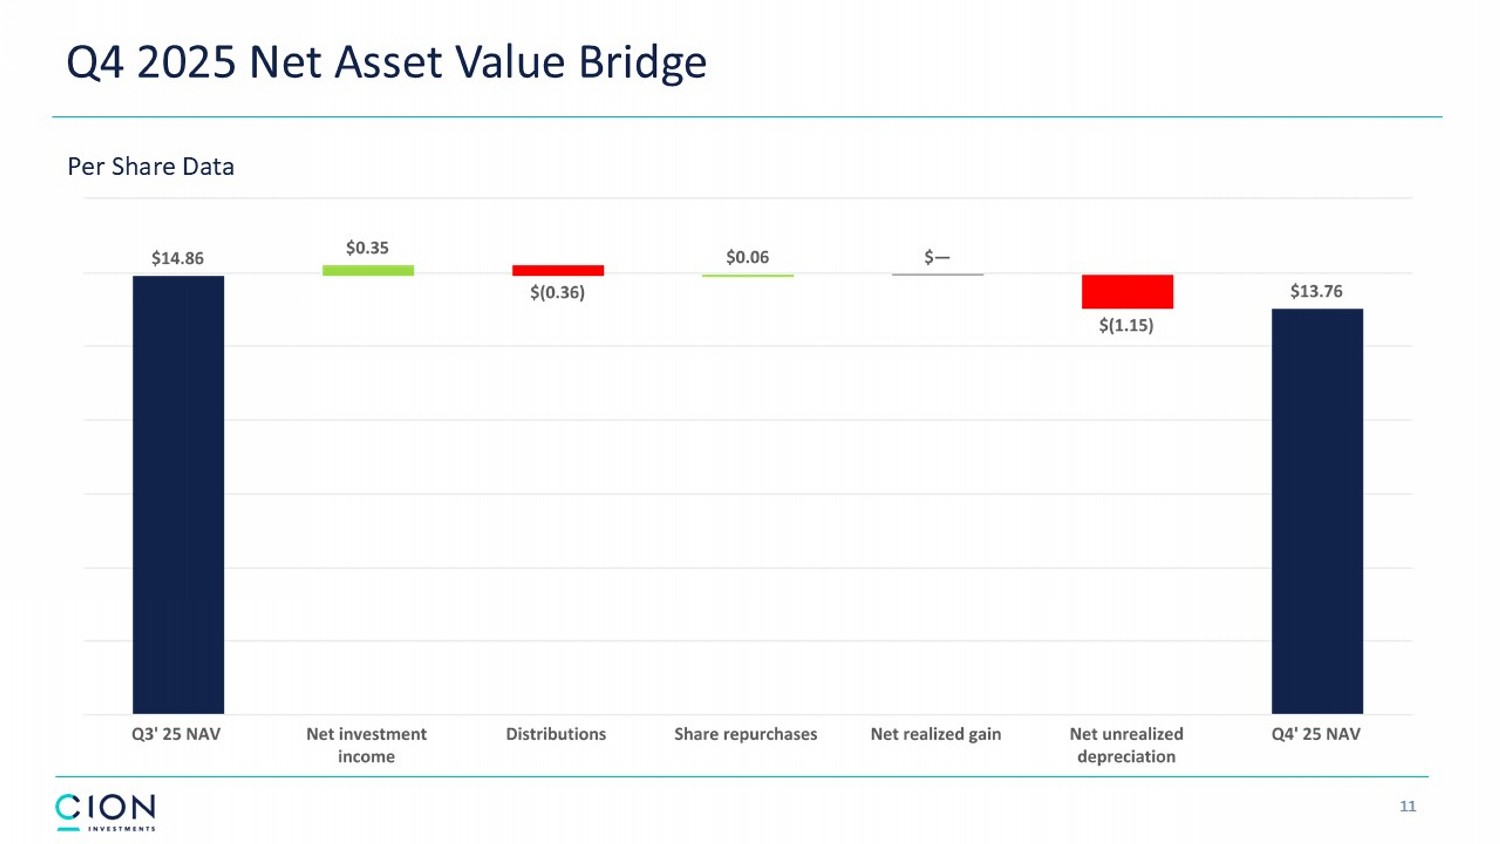
11 Q4 2025 Net Asset Value Bridge Per Share Data
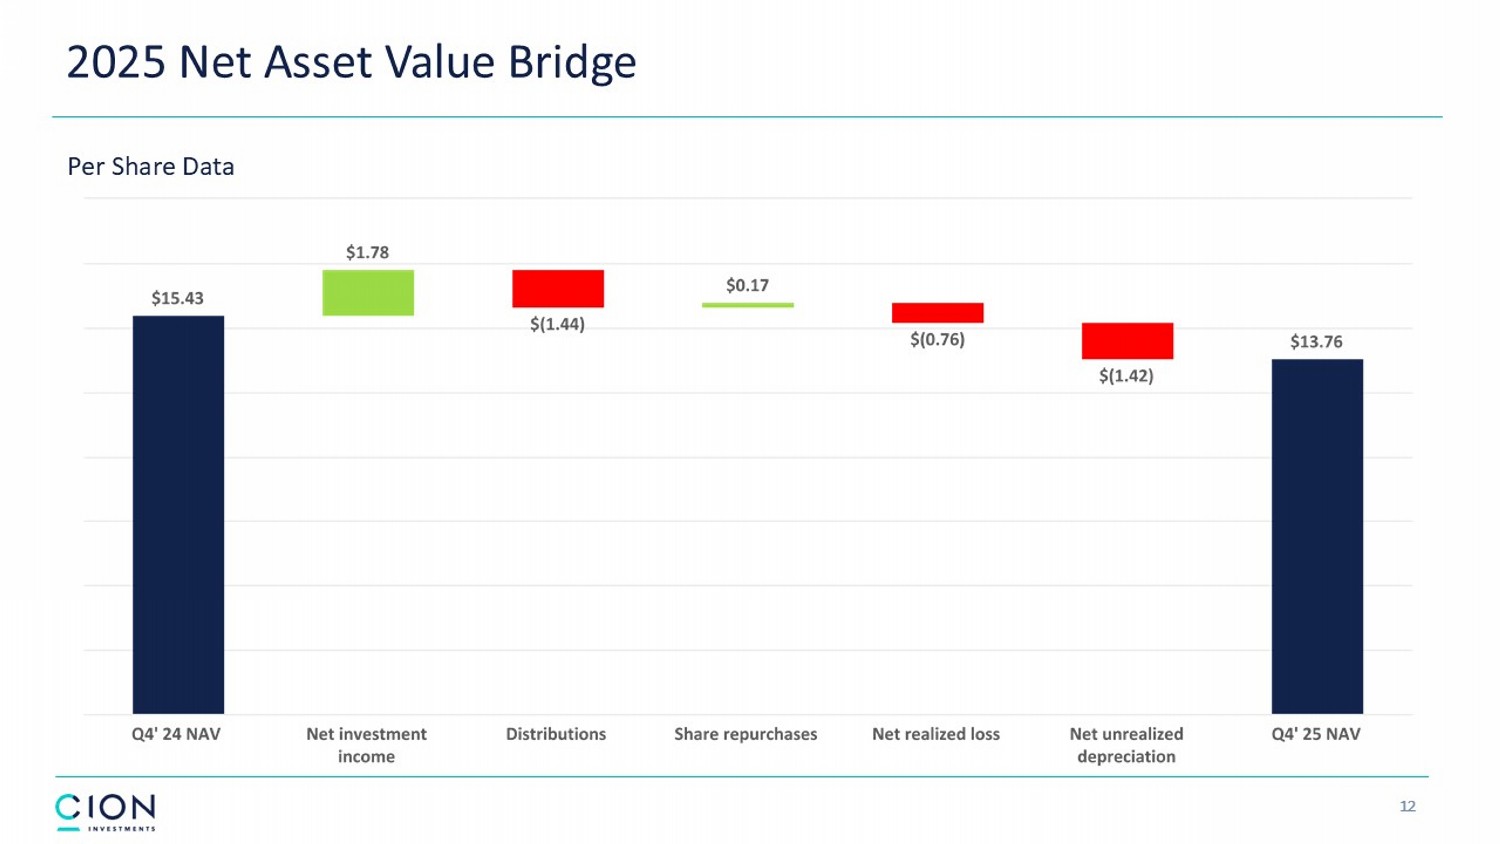
12 2025 Net Asset Value Bridge Per Share Data
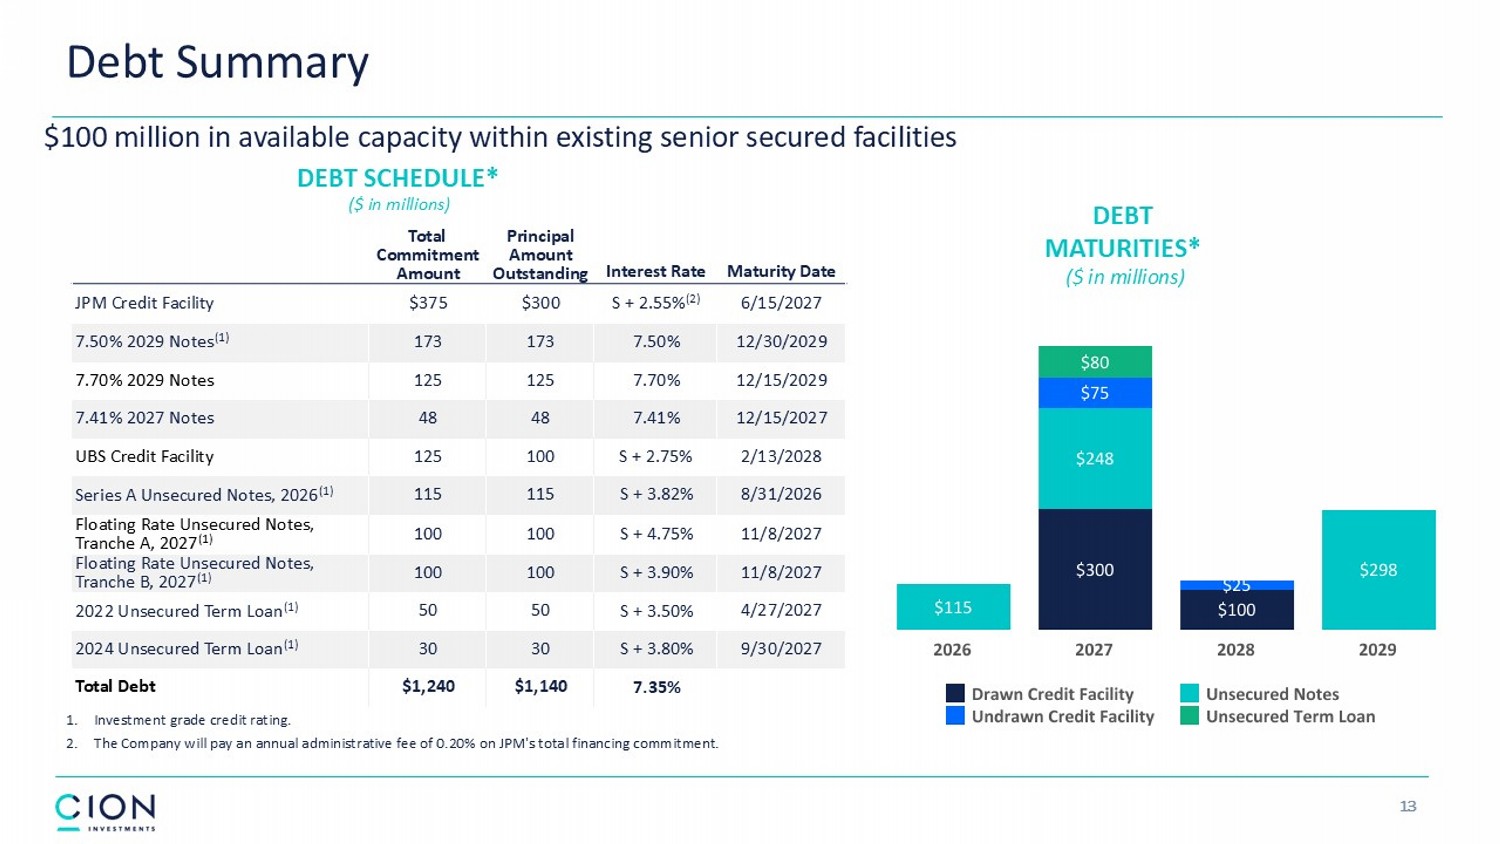
13 Maturity Date Interest Rate Principal Amount Outstanding Total Commitment Amount 6/15/2027 S + 2.55% (2) $300 $375 JPM Credit Facility 12/30/2029 7.50% 173 173 7.50% 2029 Notes (1) 12/15/2029 7.70% 125 125 7.70% 2029 Notes 12/15/2027 7.41% 48 48 7.41% 2027 Notes 2/13/2028 S + 2.75% 100 125 UBS Credit Facility 8/31/2026 S + 3.82% 115 115 Series A Unsecured Notes, 2026 (1) 11/8/2027 S + 4.75% 100 100 Floating Rate Unsecured Notes, Tranche A, 2027 (1) 11/8/2027 S + 3.90% 100 100 Floating Rate Unsecured Notes, Tranche B, 2027 (1) 4/27/2027 S + 3.50% 50 50 2022 Unsecured Term Loan (1) 9/30/2027 S + 3.80% 30 30 2024 Unsecured Term Loan (1) 7.35% $1,140 $1,240 Total Debt Debt Summary DEBT MATURITIES* ($ in millions) DEBT SCHEDULE* ($ in millions) $100 million in available capacity within existing senior secured facilities 1. Investment grade credit rating. 2. The Company will pay an annual administrative fee of 0.20% on JPM's total financing commitment.
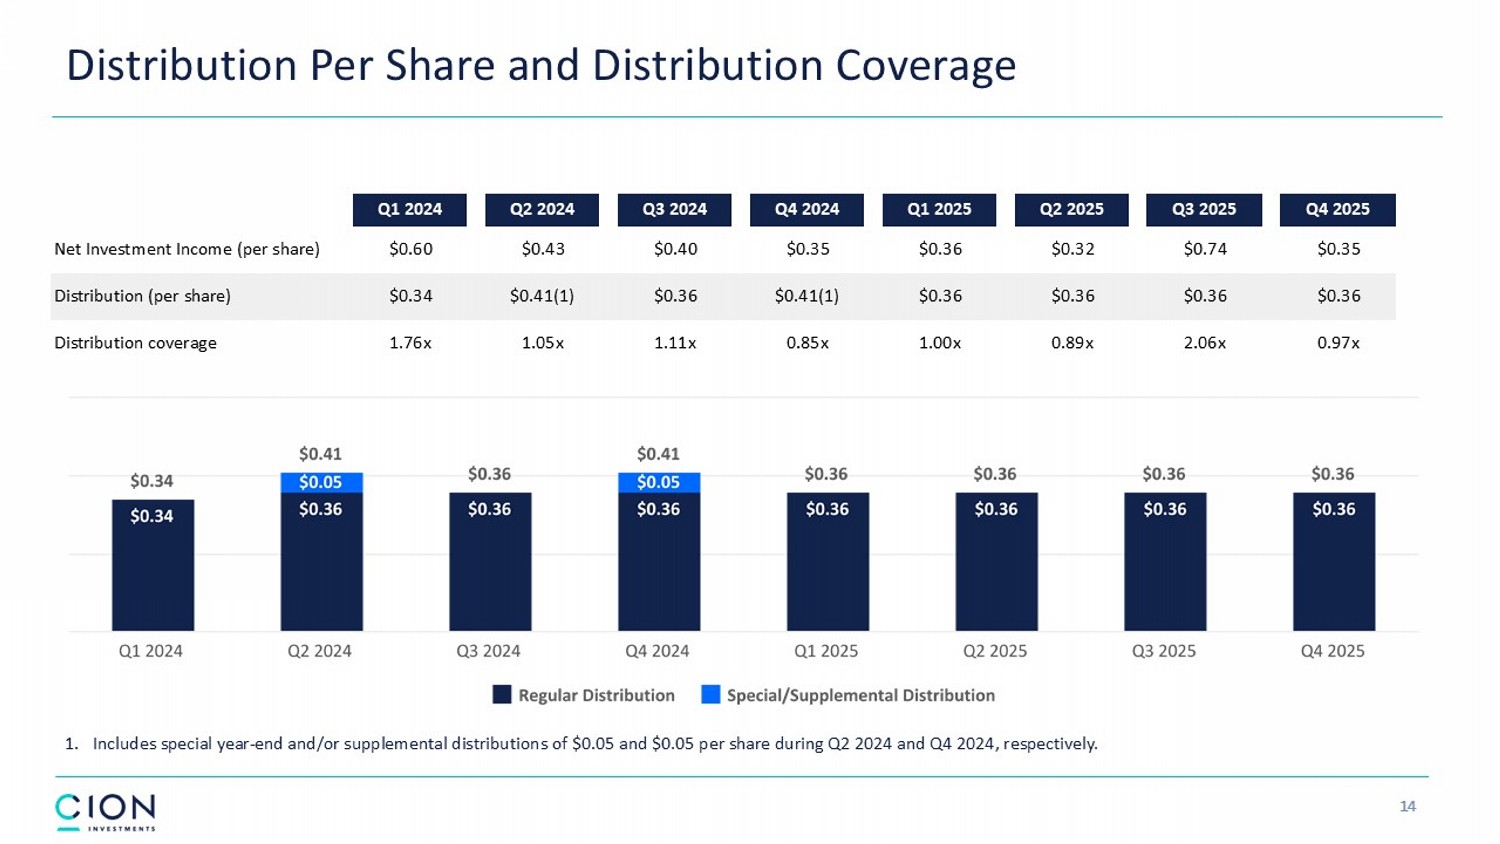
14 Distribution Per Share and Distribution Coverage 1 1. Includes special year - end and/or supplemental distributions of $0.05 and $0.05 per share during Q2 2024 and Q4 2024, respectivel y. Q4 2025 Q3 2025 Q2 2025 Q1 2025 Q4 2024 Q3 2024 Q2 2024 Q1 2024 $0.35 $0.74 $0.32 $0.36 $0.35 $0.40 $0.43 $0.60 Net Investment Income (per share) $0.36 $0.36 $0.36 $0.36 $0.41(1) $0.36 $0.41(1) $0.34 Distribution (per share) 0.97x 2.06x 0.89x 1.00x 0.85x 1.11x 1.05x 1.76x Distribution coverage