Shareholder Report
Dec. 31, 2025
USD ($)
Holding
WHAT WERE THE FUND COSTS FOR THE LAST YEAR?
(Based on a hypothetical $10,000 investment)
| Fund | Costs of a $10,000 investment | Costs paid as a percentage of a $10,000 investment |
| First Trust/Dow Jones Dividend & Income Allocation Portfolio - Class I | $121 | 1.18% |
HOW DID THE FUND PERFORM LAST YEAR? WHAT AFFECTED THE FUND’S PERFORMANCE?
The Fund's Class I returned 5.30% for the 12 months ended December 31, 2025. The Fund's Class I underperformed its benchmark, which is a blended benchmark consisting of a 50/50 blend of the Russell 3000® Index and the Bloomberg U.S. Corporate Investment-Grade Index, which returned 12.52% for the same Period.
This underperformance was mainly due to the equity holdings in the Fund. The Fund’s equity allocation underperformed the Russell 3000® Index. For the third straight year, equity markets were dominated by large-cap growth stocks, creating a headwind for more value-oriented, dividend-focused strategies. The Fund’s underperformance was largely attributable to its underweight to the outperforming technology industry and overweights to the underperforming industrials and financials industries. Technology was the best-performing industry in 2025, led in part by strong gains in semiconductor stocks. The Fund lacked exposure to several mega-cap semiconductor companies included in the benchmark, such as NVIDIA Corp. (NVDA), Broadcom Inc. (AVGO), and Advanced Micro Devices Inc. (AMD), which returned 38.92%, 50.65%, and 77.30% respectively, during the Period. The Fund also lacked exposure to other mega-cap technology benchmark holdings, including Alphabet Inc. (GOOGL) and Palantir Technologies Inc. Class A (PLTR), both of which returned more than 60% during the Period. The Fund’s stock selection within the industrials and financials sectors also contributed to relative underperformance over the Period.
The Fund’s fixed income allocation underperformed the Bloomberg U.S. Corporate Investment-Grade Index. The Fund’s allocation to U.S. Treasuries detracted from relative performance, as Treasury securities underperformed corporate bonds during the Period. Relative to the Bloomberg U.S. Corporate Investment-Grade Index, the primary contributors to the Fund’s performance were its underweight allocation to the Media & Entertainment sector and its overweight allocations to the Healthcare and Aerospace & Defense sectors. Conversely, the Fund’s security selection within the Technology and Banking sectors were the primary detractors from relative performance. On average, the Fund maintained a duration that was 0.19 years longer than the Bloomberg U.S. Corporate Investment-Grade Index, which modestly detracted from relative performance due to the weaker performance of longer-maturity bonds.
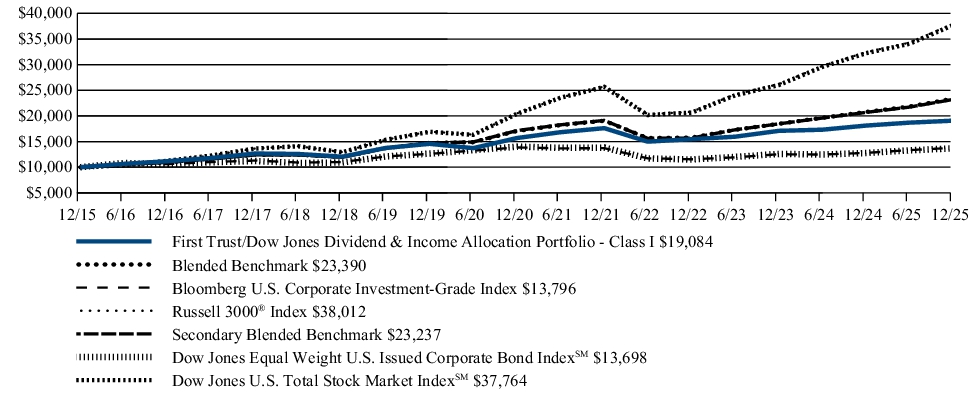
FUND PERFORMANCE (December 31, 2015 to December 31, 2025)
The performance line graph below shows the performance of a hypothetical $10,000 initial investment in the Fund over a ten-year period (or for the life of the Fund, if shorter). The subsequent account value as of the end of the Period is listed next to the name of the Fund or index, as applicable. The performance table below shows the average annual total returns of the Fund for the past one-, five-, and ten-year periods, as applicable (or for the life of the Fund, if shorter), as of the end of the Period. Both the line graph and performance table compare the Fund’s performance to an appropriate broad-based index and may compare to additional indices reflecting the market segment(s) in which the Fund invests over the same periods.
INVESTMENT PERFORMANCE OF $10,000
| Average Annual Total Returns (as of December 31, 2025) | 1 Year | 5 Year | 10 Year |
| First Trust/Dow Jones Dividend & Income Allocation Portfolio - Class I | 5.30% | 3.98% | 6.68% |
| Blended Benchmark(1) | 12.52% | 6.51% | 8.87% |
| Bloomberg U.S. Corporate Investment-Grade Index | 7.77% | -0.09% | 3.27% |
| Russell 3000® Index | 17.15% | 13.15% | 14.29% |
| Secondary Blended Benchmark(2) | 12.21% | 6.27% | 8.80% |
| Dow Jones Equal Weight U.S. Issued Corporate Bond IndexSM | 7.25% | -0.46% | 3.20% |
| Dow Jones U.S. Total Stock Market IndexSM | 17.05% | 13.07% | 14.21% |
|
(1)
|
The Blended Benchmark returns are a 50/50 split between the Russell 3000® Index and the Bloomberg U.S. Corporate Investment-Grade Index returns.
|
|
(2)
|
The Secondary Blended Benchmark return is a 50/50 split between the Dow Jones U.S. Total Stock Market IndexSM and the Dow Jones Equal Weight U.S. Issued Corporate Bond IndexSM returns.
|
Visit www.ftportfolios.com/VA/FTDJDI for more recent performance information.
KEY FUND STATISTICS (As of December 31, 2025)
| Fund net assets | $752,774,328 |
| Total number of portfolio holdings | 464 |
| Total advisory fee paid | $4,905,736 |
| Portfolio turnover rate | 67% |
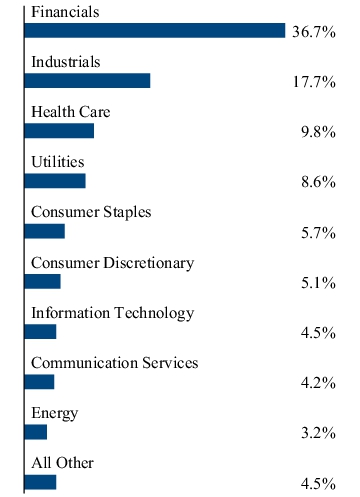
WHAT DID THE FUND INVEST IN? (As of December 31, 2025)
The tables below show the investment makeup of the Fund, representing the percentage of net assets and total investments, respectively, of the Fund.
Fund Allocation
| Common Stocks | 51.1% |
| Corporate Bonds and Notes | 43.3% |
| Foreign Corporate Bonds and Notes | 4.2% |
| Money Market Funds | 0.6% |
| U.S. Government Bonds and Notes | 0.3% |
| Net Other Assets and Liabilities | 0.5% |
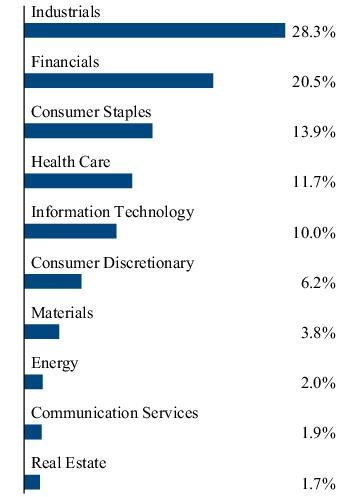
Sector Allocation
WHAT WERE THE FUND COSTS FOR THE LAST YEAR?
(Based on a hypothetical $10,000 investment)
| Fund | Costs of a $10,000 investment | Costs paid as a percentage of a $10,000 investment |
| First Trust Multi Income Allocation Portfolio - Class I | $87(1) | 0.84%(1) (2) |
| (1) |
Excludes any Acquired Fund Fees and Expenses of underlying investment companies in which the Fund invests.
|
| (2) |
Includes extraordinary expenses. If these extraordinary expenses were not included, the expense ratio would have been 0.83%.
|
HOW DID THE FUND PERFORM LAST YEAR? WHAT AFFECTED THE FUND’S PERFORMANCE?
The Fund's Class I returned 7.71% for the 12 months ended December 31, 2025. The Fund's Class I underperformed its benchmark, a blended benchmark consisting of a 60/40% blend of the Bloomberg U.S. Aggregate Bond Index and the Russell 3000® Index, respectively, which returned 11.32% for the same Period.
The Fund allocates across nine asset classes: dividend-paying stocks, preferred stocks, energy infrastructure companies and master limited partnerships (“MLPs”), real estate investment trusts ("REITs"), high yield or “junk” bonds, floating-rate loans, corporate bonds, mortgage-backed securities and Treasury Inflation Protected Securities.
It was another strong year for risk assets in 2025. Once again technology and technology-related stocks led equities higher as massive artificial intelligence (“AI”)-related capital expenditure spending continued. Stocks were further supported by a resilient economy and easing monetary policy from the Federal Reserve. The dividend-paying stock sleeve led Fund returns for the Period, followed by MLPs. REITs, on the other hand, lagged and were the worst-performing sleeve.
Fixed income delivered its best results since 2020 during the Period, as the Federal Reserve cut interest rates by a cumulative 75 basis points across three meetings. High-yield bonds and mortgage-backed securities led performance during the Period, as tight credit spreads held firm on strong fundamentals and robust demand for income. Preferred stocks generated positive performance during the Period but lagged the broader market, as their longer duration limited gains while long-end yields remained range-bound.
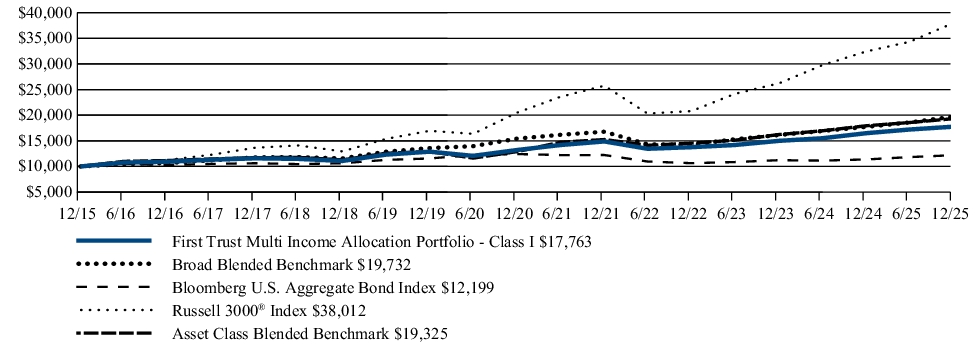
FUND PERFORMANCE (December 31, 2015 to December 31, 2025)
The performance line graph below shows the performance of a hypothetical $10,000 initial investment in the Fund over a ten-year period (or for the life of the Fund, if shorter). The subsequent account value as of the end of the Period is listed next to the name of the Fund or index, as applicable. The performance table below shows the average annual total returns of the Fund for the past one-, five-, and ten-year periods, as applicable (or for the life of the Fund, if shorter), as of the end of the Period. Both the line graph and performance table compare the Fund’s performance to an appropriate broad-based index and may compare to additional indices reflecting the market segment(s) in which the Fund invests over the same periods.
INVESTMENT PERFORMANCE OF $10,000
| Average Annual Total Returns (as of December 31, 2025) | 1 Year | 5 Year | 10 Year |
| First Trust Multi Income Allocation Portfolio - Class I | 7.71% | 6.11% | 5.91% |
| Broad Blended Benchmark(1) | 11.32% | 5.04% | 7.03% |
| Bloomberg U.S. Aggregate Bond Index | 7.30% | -0.36% | 2.01% |
| Russell 3000® Index | 17.15% | 13.15% | 14.29% |
| Asset Class Blended Benchmark(2) | 7.71% | 8.42% | 6.81% |
|
(1)
|
The Broad Blended Benchmark returns are split between the Bloomberg U.S. Aggregate Bond Index (60%) and the Russell 3000® Index (40%).
|
|
(2)
|
The Asset Class Blended Benchmark is weighted to include nine indexes: Dow Jones U.S. Select Dividend TM Index (15%), ICE BofA Fixed Rate Preferred Securities Index (8%), Alerian MLP Index (15%), S&P U.S. REIT Index (15%), ICE BofA U.S. High Yield Constrained Index (8%), Morningstar® LSTA® U.S. Leveraged Loan Index (15%), Bloomberg U.S. Corporate Investment-Grade Index (8%), ICE BofA U.S. MBS Index (8%), and ICE BofA U.S. Inflation-Linked Treasury Index (8%).
|
Visit www.ftportfolios.com/VA/FTMII for more recent performance information.
KEY FUND STATISTICS (As of December 31, 2025)
| Fund net assets | $15,428,620 |
| Total number of portfolio holdings | 176 |
| Total advisory fee paid | $0 |
| Portfolio turnover rate | 75% |
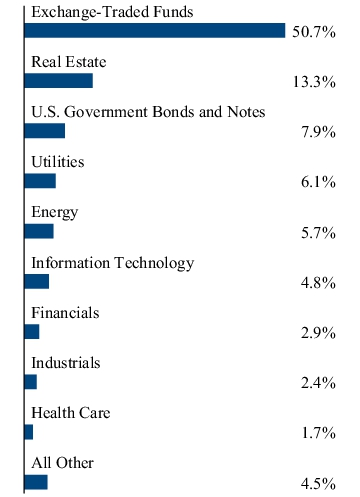
WHAT DID THE FUND INVEST IN? (As of December 31, 2025)
The tables below show the investment makeup of the Fund, representing the percentage of total investments of the Fund.
Top Ten Holdings
| First Trust Senior Loan ETF | 11.9% |
| First Trust Preferred Securities and Income ETF | 9.0% |
| First Trust Tactical High Yield ETF | 8.9% |
| iShares iBoxx $ Investment Grade Corporate Bond ETF | 7.0% |
| First Trust Intermediate Government Opportunities ETF | 4.1% |
| iShares 7-10 Year Treasury Bond ETF | 2.8% |
| iShares MBS ETF | 2.4% |
| First Trust Limited Duration Investment Grade Corporate ETF | 2.0% |
| Morgan Stanley Institutional Liquidity Funds - Treasury Portfolio - Institutional Class - 3.64% | 1.6% |
| Enterprise Products Partners, L.P. | 1.1% |
Sector Allocation
Top Ten Holdings
| First Trust Senior Loan ETF | 11.9% |
| First Trust Preferred Securities and Income ETF | 9.0% |
| First Trust Tactical High Yield ETF | 8.9% |
| iShares iBoxx $ Investment Grade Corporate Bond ETF | 7.0% |
| First Trust Intermediate Government Opportunities ETF | 4.1% |
| iShares 7-10 Year Treasury Bond ETF | 2.8% |
| iShares MBS ETF | 2.4% |
| First Trust Limited Duration Investment Grade Corporate ETF | 2.0% |
| Morgan Stanley Institutional Liquidity Funds - Treasury Portfolio - Institutional Class - 3.64% | 1.6% |
| Enterprise Products Partners, L.P. | 1.1% |
WHAT WERE THE FUND COSTS FOR THE LAST YEAR?
(Based on a hypothetical $10,000 investment)
| Fund | Costs of a $10,000 investment | Costs paid as a percentage of a $10,000 investment |
| First Trust Dorsey Wright Tactical Core Portfolio - Class I | $81(1) | 0.77%(1) (2) |
| (1) |
Excludes any Acquired Fund Fees and Expenses of underlying investment companies in which the Fund invests.
|
| (2) |
Includes extraordinary expenses. If these extraordinary expenses were not included, the expense ratio would have been 0.76%.
|
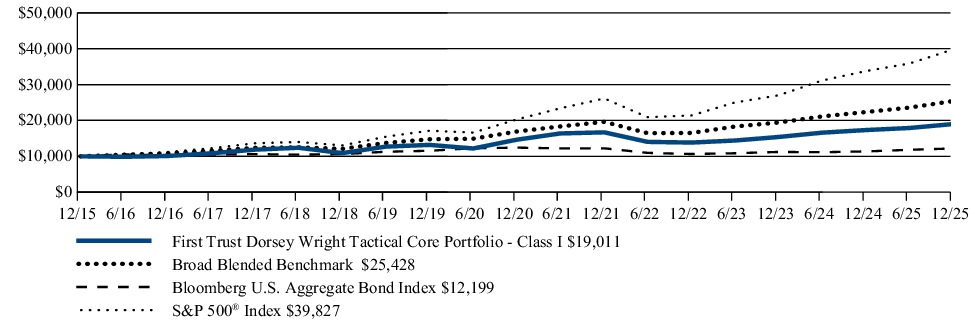
HOW DID THE FUND PERFORM LAST YEAR? WHAT AFFECTED THE FUND’S PERFORMANCE?
The Fund's Class I returned 9.69% for the 12 months ended December 31, 2025. The Fund's Class I underperformed its benchmark, a blended benchmark consisting of a 60/40 blend of the S&P 500® Index and the Bloomberg U.S. Aggregate Bond Index, which returned 13.70% for the same Period.
This underperformance was driven by negative security selection within the Fund’s equity holdings. The largest detractors among the equity positions were the First Trust NASDAQ-100-Technology Sector Index Fund and the First Trust Consumer Discretionary AlphaDEX® Fund.
Despite these headwinds, the Fund benefited from an overall overweight allocation to equities relative to the blended benchmark.
FUND PERFORMANCE (December 31, 2015 to December 31, 2025)
The performance line graph below shows the performance of a hypothetical $10,000 initial investment in the Fund over a ten-year period (or for the life of the Fund, if shorter). The subsequent account value as of the end of the Period is listed next to the name of the Fund or index, as applicable. The performance table below shows the average annual total returns of the Fund for the past one-, five-, and ten-year periods, as applicable (or for the life of the Fund, if shorter), as of the end of the Period. Both the line graph and performance table compare the Fund’s performance to an appropriate broad-based index and may compare to additional indices reflecting the market segment(s) in which the Fund invests over the same periods.
INVESTMENT PERFORMANCE OF $10,000
| Average Annual Total Returns (as of December 31, 2025) | 1 Year | 5 Year | 10 Year |
| First Trust Dorsey Wright Tactical Core Portfolio - Class I | 9.69% | 5.34% | 6.63% |
| Broad Blended Benchmark(1) | 13.70% | 8.47% | 9.78% |
| Bloomberg U.S. Aggregate Bond Index | 7.30% | -0.36% | 2.01% |
| S&P 500® Index | 17.88% | 14.42% | 14.82% |
|
(1)
|
The Broad Blended Benchmark return is split between the Bloomberg U.S. Aggregate Bond Index (40%) and the S&P 500® Index (60%).
|
Visit www.ftportfolios.com/VA/FTDWTCI for more recent performance information.
KEY FUND STATISTICS (As of December 31, 2025)
| Fund net assets | $54,108,469 |
| Total number of portfolio holdings | 21 |
| Total advisory fee paid | $0 |
| Portfolio turnover rate | 78% |
WHAT DID THE FUND INVEST IN? (As of December 31, 2025)
The table below shows the investment makeup of the Fund, representing the percentage of total investments of the Fund.
Top Ten Holdings
| First Trust Large Cap Growth AlphaDEX® Fund | 10.8% |
| First Trust Large Cap Core AlphaDEX® Fund | 10.3% |
| First Trust Mid Cap Growth AlphaDEX® Fund | 9.9% |
| First Trust Dow Jones Internet Index Fund | 9.9% |
| First Trust Indxx Aerospace & Defense ETF | 8.8% |
| First Trust Utilities AlphaDEX® Fund | 8.8% |
| First Trust Financials AlphaDEX® Fund | 8.5% |
| First Trust Nasdaq Semiconductor ETF | 7.9% |
| iShares Core U.S. Aggregate Bond ETF | 5.6% |
| State Street SPDR Bloomberg High Yield Bond ETF | 3.2% |
WHAT WERE THE FUND COSTS FOR THE LAST YEAR?
(Based on a hypothetical $10,000 investment)
| Fund | Costs of a $10,000 investment | Costs paid as a percentage of a $10,000 investment |
| First Trust Capital Strength® Portfolio - Class I | $114 | 1.11%(1) |
| (1) |
Includes extraordinary expenses. If these extraordinary expenses were not included, the expense ratio would have been 1.10%. |
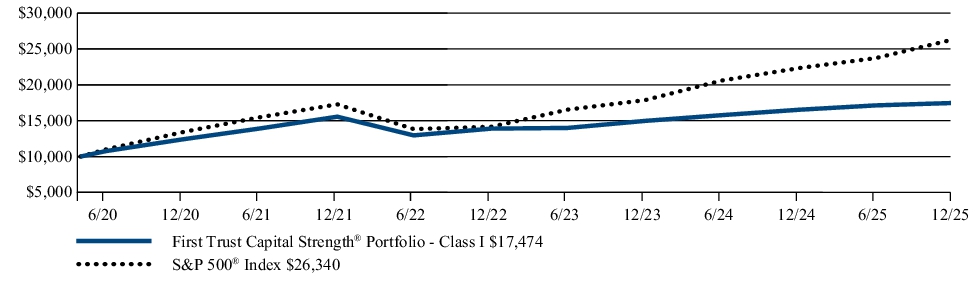
HOW DID THE FUND PERFORM LAST YEAR? WHAT AFFECTED THE FUND’S PERFORMANCE?
The Fund's Class I returned 5.70% for the 12 months ended December 31, 2025. The Fund's Class I underperformed its benchmark, the S&P 500® Index, which returned 17.88% for the same Period.
This underperformance was largely driven by broad factor weakness during the Period. During the Period, both the small size and low volatility factors were among the weakest-performing market factors, which detracted from performance relative to the benchmark. However, value outperformed which slightly mitigated the relative underperformance. The Fund was also hurt by an underweight and poor selection within the information technology sector, particularly being overweight information technology services and underweight semiconductors & semiconductor equipment. This proved to be costly as the prevalence of artificial intelligence increased the demand for chips, while introducing a new risk to technology services.
FUND PERFORMANCE (May 1, 2020 to December 31, 2025)
The performance line graph below shows the performance of a hypothetical $10,000 initial investment in the Fund over a ten-year period (or for the life of the Fund, if shorter). The subsequent account value as of the end of the Period is listed next to the name of the Fund or index, as applicable. The performance table below shows the average annual total returns of the Fund for the past one-, five-, and ten-year periods, as applicable (or for the life of the Fund, if shorter), as of the end of the Period. Both the line graph and performance table compare the Fund’s performance to an appropriate broad-based index and may compare to additional indices reflecting the market segment(s) in which the Fund invests over the same periods.
INVESTMENT PERFORMANCE OF $10,000
| Average Annual Total Returns (as of December 31, 2025) | 1 Year | 5 Year | Since Inception (5/01/20) |
| First Trust Capital Strength® Portfolio - Class I | 5.70% | 7.07% | 10.35% |
| S&P 500® Index | 17.88% | 14.42% | 18.63% |
Visit www.ftportfolios.com/VA/FTACSI for more recent performance information.
KEY FUND STATISTICS (As of December 31, 2025)
| Fund net assets | $189,426,984 |
| Total number of portfolio holdings | 51 |
| Total advisory fee paid | $868,589 |
| Portfolio turnover rate | 116% |
WHAT DID THE FUND INVEST IN? (As of December 31, 2025)
The tables below show the investment makeup of the Fund, representing the percentage of total investments of the Fund.
Top Ten Holdings
| Cognizant Technology Solutions Corp., Class A | 2.5% |
| Expeditors International of Washington, Inc. | 2.4% |
| Cummins, Inc. | 2.4% |
| Dover Corp. | 2.3% |
| Ross Stores, Inc. | 2.3% |
| Cisco Systems, Inc. | 2.2% |
| Monster Beverage Corp. | 2.1% |
| Moody's Corp. | 2.1% |
| Johnson & Johnson | 2.1% |
| TJX (The) Cos., Inc. | 2.1% |
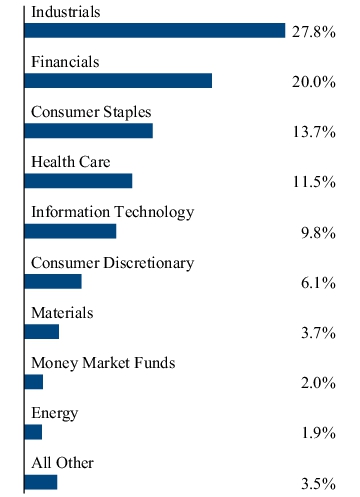
Sector Allocation
Top Ten Holdings
| Cognizant Technology Solutions Corp., Class A | 2.5% |
| Expeditors International of Washington, Inc. | 2.4% |
| Cummins, Inc. | 2.4% |
| Dover Corp. | 2.3% |
| Ross Stores, Inc. | 2.3% |
| Cisco Systems, Inc. | 2.2% |
| Monster Beverage Corp. | 2.1% |
| Moody's Corp. | 2.1% |
| Johnson & Johnson | 2.1% |
| TJX (The) Cos., Inc. | 2.1% |
WHAT WERE THE FUND COSTS FOR THE LAST YEAR?
(Based on a hypothetical $10,000 investment)
| Fund | Costs of a $10,000 investment | Costs paid as a percentage of a $10,000 investment |
| First Trust International Developed Capital Strength® Portfolio - Class I | $133 | 1.21%(1) |
| (1) |
Includes extraordinary expenses. If these extraordinary expenses were not included, the expense ratio would have been 1.20%. |
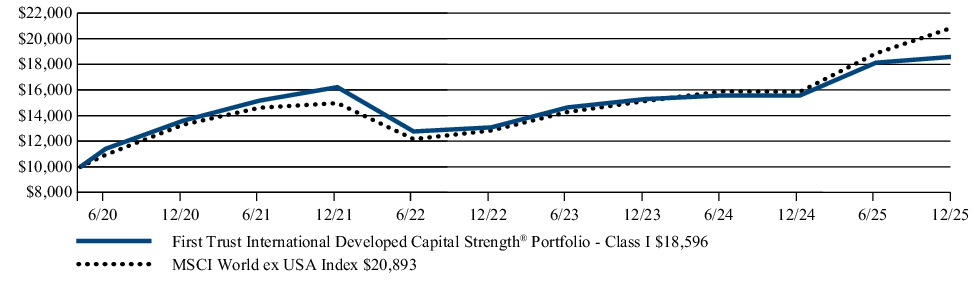
HOW DID THE FUND PERFORM LAST YEAR? WHAT AFFECTED THE FUND’S PERFORMANCE?
The Fund's Class I returned 19.53% for the 12 months ended December 31, 2025. The Fund's Class I underperformed its benchmark, the MSCI World ex USA Index, which returned 31.85% for the same Period.
This underperformance was largely driven by broad factor weakness during the Period. During the Period, both the small size and low volatility factors were among the weakest-performing market factors, which detracted from performance relative to the benchmark. However, quality outperformed which slightly mitigated the relative underperformance. The Fund was also hurt by poor selection of financials securities, which was the strongest performing sector in the benchmark during the Period. The Fund was also underweight banks, which performed particularly well during the Period.
FUND PERFORMANCE (May 1, 2020 to December 31, 2025)
The performance line graph below shows the performance of a hypothetical $10,000 initial investment in the Fund over a ten-year period (or for the life of the Fund, if shorter). The subsequent account value as of the end of the Period is listed next to the name of the Fund or index, as applicable. The performance table below shows the average annual total returns of the Fund for the past one-, five-, and ten-year periods, as applicable (or for the life of the Fund, if shorter), as of the end of the Period. Both the line graph and performance table compare the Fund’s performance to an appropriate broad-based index and may compare to additional indices reflecting the market segment(s) in which the Fund invests over the same periods.
INVESTMENT PERFORMANCE OF $10,000
| Average Annual Total Returns (as of December 31, 2025) | 1 Year | 5 Year | Since Inception (5/01/20) |
| First Trust International Developed Capital Strength® Portfolio - Class I | 19.53% | 6.45% | 11.57% |
| MSCI World ex USA Index | 31.85% | 9.46% | 13.88% |
Visit www.ftportfolios.com/VA/FTAIDCSI for more recent performance information.
KEY FUND STATISTICS (As of December 31, 2025)
| Fund net assets | $40,727,720 |
| Total number of portfolio holdings | 52 |
| Total advisory fee paid | $71,391 |
| Portfolio turnover rate | 68% |
WHAT DID THE FUND INVEST IN? (As of December 31, 2025)
The tables below show the investment makeup of the Fund, representing the percentage of total investments of the Fund.
Top Ten Holdings
| Great-West Lifeco, Inc. | 2.3% |
| Rio Tinto PLC | 2.3% |
| Toronto-Dominion Bank (The) | 2.3% |
| Industria de Diseno Textil S.A. | 2.2% |
| Royal Bank of Canada | 2.2% |
| Prudential PLC | 2.2% |
| Roche Holding AG | 2.2% |
| ITOCHU Corp. | 2.2% |
| Allianz SE | 2.1% |
| GSK PLC | 2.1% |
Sector Allocation
Top Ten Holdings
| Great-West Lifeco, Inc. | 2.3% |
| Rio Tinto PLC | 2.3% |
| Toronto-Dominion Bank (The) | 2.3% |
| Industria de Diseno Textil S.A. | 2.2% |
| Royal Bank of Canada | 2.2% |
| Prudential PLC | 2.2% |
| Roche Holding AG | 2.2% |
| ITOCHU Corp. | 2.2% |
| Allianz SE | 2.1% |
| GSK PLC | 2.1% |
WHAT WERE THE FUND COSTS FOR THE LAST YEAR?
(Based on a hypothetical $10,000 investment)
| Fund | Costs of a $10,000 investment | Costs paid as a percentage of a $10,000 investment |
| First Trust Growth StrengthTM Portfolio - Class I | $128 | 1.21%(1) |
| (1) |
Includes extraordinary expenses. If these extraordinary expenses were not included, the expense ratio would have been 1.20%. |
HOW DID THE FUND PERFORM LAST YEAR? WHAT AFFECTED THE FUND’S PERFORMANCE?
The Fund's Class I returned 11.75% for the 12 months ended December 31, 2025. The Fund's Class I underperformed its benchmark, the S&P 500® Index, which returned 17.88% for the same Period.
This underperformance was partially due to exposure to the quality, growth, and small size factors. Quality outperformed the benchmark during the Period while growth and small size lagged, which detracted slightly from the Fund’s relative performance. Security selection within the Communication Services sector contributed to relative underperformance, as the Fund was significantly underweight both share classes of Alphabet, Inc. In addition, within the Consumer Discretionary sector, the Fund held an overweight position in the Household Durables industry, which performed poorly during the Period.
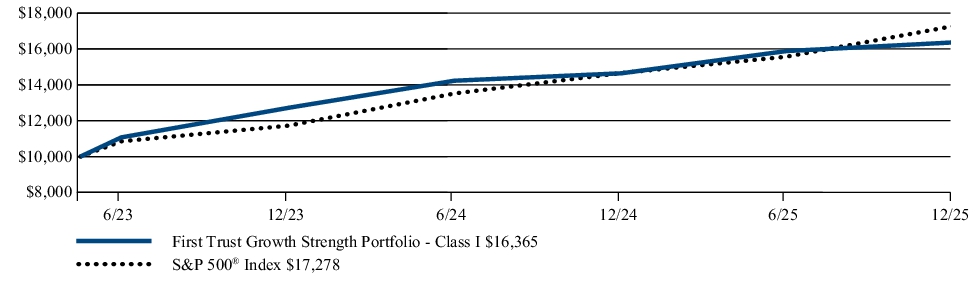
FUND PERFORMANCE (May 16, 2023 to December 31, 2025)
The performance line graph below shows the performance of a hypothetical $10,000 initial investment in the Fund over a ten-year period (or for the life of the Fund, if shorter). The subsequent account value as of the end of the Period is listed next to the name of the Fund or index, as applicable. The performance table below shows the average annual total returns of the Fund for the past one-, five-, and ten-year periods, as applicable (or for the life of the Fund, if shorter), as of the end of the Period. Both the line graph and performance table compare the Fund’s performance to an appropriate broad-based index and may compare to additional indices reflecting the market segment(s) in which the Fund invests over the same periods.
INVESTMENT PERFORMANCE OF $10,000
| Average Annual Total Returns (as of December 31, 2025) | 1 Year | Since Inception (5/16/23) |
| First Trust Growth StrengthTM Portfolio - Class I | 11.75% | 20.62% |
| S&P 500® Index | 17.88% | 23.14% |
Visit www.ftportfolios.com/VA/FTGSTI for more recent performance information.
KEY FUND STATISTICS (As of December 31, 2025)
| Fund net assets | $36,707,978 |
| Total number of portfolio holdings | 51 |
| Total advisory fee paid | $71,294 |
| Portfolio turnover rate | 113% |
WHAT DID THE FUND INVEST IN? (As of December 31, 2025)
The tables below show the investment makeup of the Fund, representing the percentage of total investments of the Fund.
Top Ten Holdings
| Eli Lilly & Co. | 2.7% |
| Apollo Global Management, Inc. | 2.4% |
| Schlumberger N.V. | 2.4% |
| Incyte Corp. | 2.3% |
| United Therapeutics Corp. | 2.2% |
| AppLovin Corp., Class A | 2.2% |
| Newmont Corp. | 2.2% |
| Monster Beverage Corp. | 2.2% |
| Caterpillar, Inc. | 2.2% |
| Moody's Corp. | 2.2% |
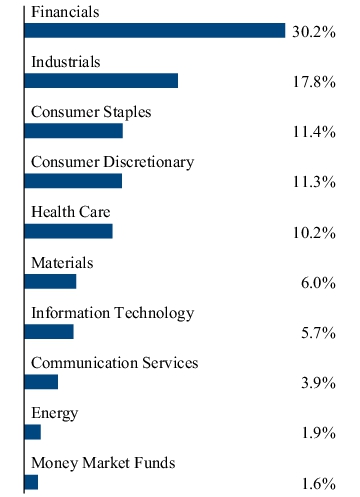
Sector Allocation
Top Ten Holdings
| Eli Lilly & Co. | 2.7% |
| Apollo Global Management, Inc. | 2.4% |
| Schlumberger N.V. | 2.4% |
| Incyte Corp. | 2.3% |
| United Therapeutics Corp. | 2.2% |
| AppLovin Corp., Class A | 2.2% |
| Newmont Corp. | 2.2% |
| Monster Beverage Corp. | 2.2% |
| Caterpillar, Inc. | 2.2% |
| Moody's Corp. | 2.2% |
WHAT WERE THE FUND COSTS FOR THE LAST YEAR?
(Based on a hypothetical $10,000 investment)
| Fund | Costs of a $10,000 investment | Costs paid as a percentage of a $10,000 investment |
| First Trust Capital Strength® Hedged Equity Portfolio - Class I | $125 | 1.26%(1) |
| (1) |
Includes extraordinary expenses. If these extraordinary expenses were not included, the expense ratio would have been 1.25%. |
HOW DID THE FUND PERFORM LAST YEAR? WHAT AFFECTED THE FUND’S PERFORMANCE?
The Fund's Class I returned -2.26% for the 12 months ended December 31, 2025. The Fund's Class I underperformed its benchmark, the S&P 500® Index, which returned 17.88% for the same Period.
This underperformance was largely driven by broad factor weakness during the Period. During the Period, both the small size and low volatility factors were among the weakest-performing market factors, which detracted from performance relative to the benchmark. However, value outperformed which slightly mitigated the relative underperformance. The Fund was also hurt by an underweight and poor selection within the information technology sector, particularly being overweight information technology services and underweight semiconductors & semiconductor equipment. This proved to be costly as the prevalence of artificial intelligence increased the demand for chips, while introducing a new risk to technology services. The Fund was also negatively impacted by its put spread and short call options strategy. Given the benchmark’s strong positive returns in 2025, this options strategy detracted from the Fund’s performance.
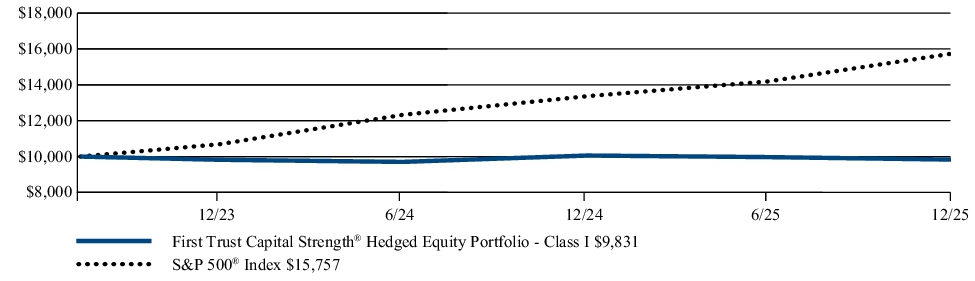
FUND PERFORMANCE (August 14, 2023 to December 31, 2025)
The performance line graph below shows the performance of a hypothetical $10,000 initial investment in the Fund over a ten-year period (or for the life of the Fund, if shorter). The subsequent account value as of the end of the Period is listed next to the name of the Fund or index, as applicable. The performance table below shows the average annual total returns of the Fund for the past one-, five-, and ten-year periods, as applicable (or for the life of the Fund, if shorter), as of the end of the Period. Both the line graph and performance table compare the Fund’s performance to an appropriate broad-based index and may compare to additional indices reflecting the market segment(s) in which the Fund invests over the same periods.
INVESTMENT PERFORMANCE OF $10,000
| Average Annual Total Returns (as of December 31, 2025) | 1 Year | Since Inception (8/14/23) |
| First Trust Capital Strength® Hedged Equity Portfolio - Class I | -2.26% | -0.71% |
| S&P 500® Index | 17.88% | 21.05% |
Visit www.ftportfolios.com/VA/FTCSHI for more recent performance information.
KEY FUND STATISTICS (As of December 31, 2025)
| Fund net assets | $15,261,252 |
| Total number of portfolio holdings | 56 |
| Total advisory fee paid | $0 |
| Portfolio turnover rate | 136% |
WHAT DID THE FUND INVEST IN? (As of December 31, 2025)
The tables below show the investment makeup of the Fund, representing the percentage of net assets and total investments, respectively, of the Fund.
Fund Allocation
| Common Stocks | 99.6% |
| Put Options Purchased | 0.1% |
| Call Options Written | (0.3)% |
| Put Options Written | (0.0)% |
| Net Other Assets and Liabilities | 0.6% |
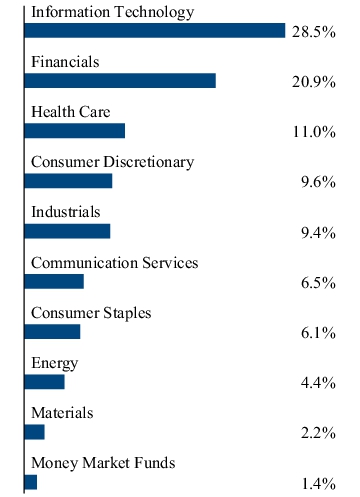
Sector Allocation
Any amount shown as 0.0% represents less than 0.1%.
| [1] | Excludes any Acquired Fund Fees and Expenses of underlying investment companies in which the Fund invests. |
| [2] | Includes extraordinary expenses. If these extraordinary expenses were not included, the expense ratio would have been 0.83%. |
| [3] | Excludes any Acquired Fund Fees and Expenses of underlying investment companies in which the Fund invests. |
| [4] | Includes extraordinary expenses. If these extraordinary expenses were not included, the expense ratio would have been 0.76%. |
| [5] | Includes extraordinary expenses. If these extraordinary expenses were not included, the expense ratio would have been 1.10%. |
| [6] | Includes extraordinary expenses. If these extraordinary expenses were not included, the expense ratio would have been 1.20%. |
| [7] | Includes extraordinary expenses. If these extraordinary expenses were not included, the expense ratio would have been 1.20%. |
| [8] | Includes extraordinary expenses. If these extraordinary expenses were not included, the expense ratio would have been 1.25%. |