Pay vs Performance Disclosure - USD ($)
Jun. 09, 2021
Dec. 26, 2025
Dec. 27, 2024
Dec. 29, 2023
Dec. 30, 2022
Dec. 31, 2021
Pay Versus Performance
Pay Versus Performance Table
As required by Section 953(a) of the Dodd-Frank Wall Street Reform and Consumer Protection Act and Item 402(v) of Regulation
S-K,
the table below discloses, for the last five fiscal years: (i) the total compensation paid (as reported in the Summary Compensation Table (“SCT”)) and the compensation actually paid (“CAP”) to the individuals who served as the Company’s CEOs; (ii) the average of the total compensation paid (as reported in the SCT) and the average CAP to the individuals who served as non-CEO
NEOs; (iii) the cumulative total shareholder return of the Company and peer group cumulative total shareholder return; (iv) net income; and (v) net sales. Year |
Summary Compensation Table Total for Current CEO (1) ($) |
Compensation Actually Paid to Current CEO (1)(4) ($) |
Summary Compensation Table Total for Former CEO (2) ($) |
Compensation Actually Paid to Former CEO (2) ($) |
Average Summary Compensation Table Total for Non-CEO NEOs (3) ($) |
Average Compensation Actually Paid to Non-CEO NEOs (3)(4) ($) |
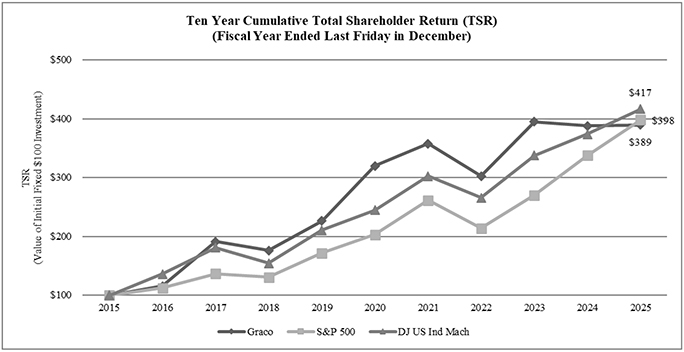
Value of Initial Fixed $100 Investment (5) Based On: |
Net Income (in thousands) ($) |
Net Sales (7) (in thousands) ($) |
|||||||||||||||||||||||||||||||
Total Shareholder Return ($) |
Peer Group Total Shareholder Return (6) ($) |
|||||||||||||||||||||||||||||||||||||||
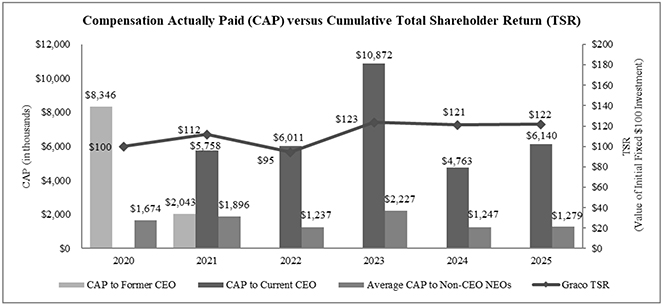
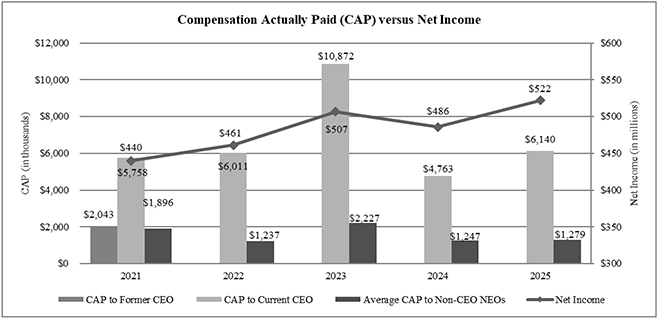
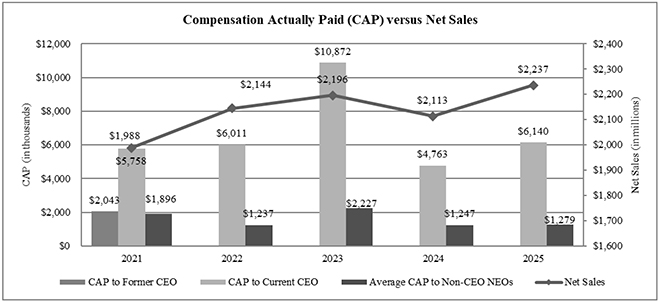
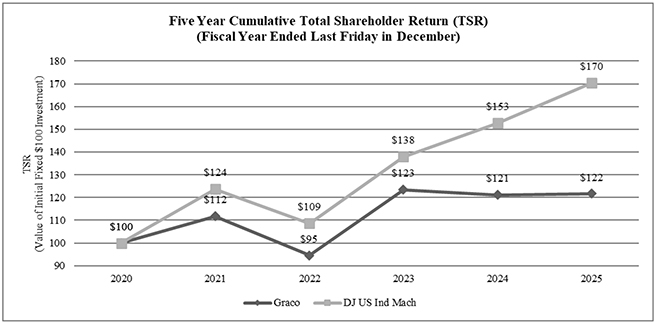
| 2025 | 9,491,330 | 6,140,949 | — | — | 1,584,626 | 1,279,874 | 122 | 170 | 521,839 | 2,236,604 | ||||||||||||||||||||||||||||||
| 2024 | 8,361,979 | 4,763,001 | — | — | 1,216,886 | 1,247,444 | 171 | 177 | 486,084 | 2,133,316 | ||||||||||||||||||||||||||||||
| 2023 | 9,236,066 | 10,871,942 | — | — | 1,948,817 | 2,226,741 | 175 | 160 | 506,511 | 2,195,606 | ||||||||||||||||||||||||||||||
| 2022 | 6,417,072 | 6,011,113 | — | — | 1,324,147 | 1,237,294 | 134 | 126 | 460,645 | 2,143,521 | ||||||||||||||||||||||||||||||
| 2021 | 5,422,139 | 5,758,222 | 1,686,160 | 2,042,742 | 1,901,127 | 1,896,267 | 158 | 144 | 439,866 | 1,987,608 | ||||||||||||||||||||||||||||||
| (1) | Mark W. Sheahan became President and Chief Executive Officer effective June 10, 2021. |
| (2) | Patrick J. McHale served as President and Chief Executive Officer from June 2007 through June 9, 2021. |
| (3) | The non-CEO NEOs were as follows: David M. Lowe, Angela F. Wordell, Peter O’Shea and Ronita Banerjee (2025); David M. Lowe, Dale D. Johnson, Peter O’Shea and Ronita Banerjee (2024); David M. Lowe, Dale D. Johnson, Christian E. Rothe and Caroline M. Chambers (2023); and David M. Lowe, Dale D. Johnson, Christian E. Rothe and Jeffrey P. Johnson (2022 and 2021). |
| (4) | The table below sets forth the amounts deducted from and added to SCT total compensation to calculate CAP to Mr. Sheahan and average CAP to the non-CEO NEOs for 2025. |
Adjustments |
Current CEO ($) |
Average of Non-CEO NEOs ($) | ||||||||
| Total Compensation from SCT | 9,491,330 | 1,584,626 | ||||||||
Adjustments for defined benefit and actuarial pension plans: |
||||||||||
| Subtract aggregate change in the actuarial present value of accumulated benefits under all defined benefit and pension plans reported in the SCT | 1,364,000 | 106,218 | ||||||||
| Add service cost | 300,000 | 36,500 | ||||||||
| Add prior service cost | 0 | 0 | ||||||||
Adjustments for stock and option awards: |
||||||||||
| Subtract SCT amounts of stock and option awards | 5,749,775 | 630,999 | ||||||||
| Add fair value at 2025 fiscal year-end of awards granted during fiscal year 2025 that are outstanding and unvested at year-end |
4,951,645 | 543,410 | ||||||||
| +/- The difference between fair value of awards from the end of fiscal year 2024 to the end of fiscal year 2025 for awards granted in any prior fiscal year that are outstanding and unvested at year-end |
(1,670,177 | ) | (167,744 | ) | ||||||
| Add the fair value as of the vesting date for awards granted and vesting during fiscal year 2025 | 0 | 0 | ||||||||
| +/- The change in fair value from the end of fiscal year 2024 to the vesting date for awards granted in any prior fiscal year for which all applicable vesting conditions were satisfied during fiscal year 2025 | 181,925 | 20,299 | ||||||||
| Subtract fair value at end of fiscal year 2024 for awards granted in any prior fiscal year that fail to meet the applicable vesting conditions during fiscal year 2025 | 0 | 0 | ||||||||
| Add dividends or other earnings paid on stock or option awards in 2024 prior to vesting if not otherwise included in total compensation for fiscal year 2025 | 0 | 0 | ||||||||
Compensation Actually Paid (as calculated) |
6,140,949 | 1,279,874 | ||||||||
| (5) | Total shareholder return is calculated based on a fixed investment of one hundred dollars measured from the market close on the last trading day of fiscal 2020 through and including the end of each fiscal year reported in the table. |
| (6) | The peer group used in this Pay Versus Performance table is the Dow Jones U.S. Industrial Machinery Index, which is the same peer group the Company uses for purposes of the stock performance graph in our Annual Report on Form 10-K. |
| (7) | Our Company-selected measure, which is the measure we believe represents the most important financial performance not otherwise presented in the table above that we use to link CAP to our NEOs for fiscal 2025 to our Company’s performance, is Net Sales, as reported in our Annual Report on Form 10-K. |
| (3) | The non-CEO NEOs were as follows: David M. Lowe, Angela F. Wordell, Peter O’Shea and Ronita Banerjee (2025); David M. Lowe, Dale D. Johnson, Peter O’Shea and Ronita Banerjee (2024); David M. Lowe, Dale D. Johnson, Christian E. Rothe and Caroline M. Chambers (2023); and David M. Lowe, Dale D. Johnson, Christian E. Rothe and Jeffrey P. Johnson (2022 and 2021). |
| (6) | The peer group used in this Pay Versus Performance table is the Dow Jones U.S. Industrial Machinery Index, which is the same peer group the Company uses for purposes of the stock performance graph in our Annual Report on Form 10-K. |
| (4) | The table below sets forth the amounts deducted from and added to SCT total compensation to calculate CAP to Mr. Sheahan and average CAP to the non-CEO NEOs for 2025. |
Adjustments |
Current CEO ($) |
Average of Non-CEO NEOs ($) | ||||||||
| Total Compensation from SCT | 9,491,330 | 1,584,626 | ||||||||
Adjustments for defined benefit and actuarial pension plans: |
||||||||||
| Subtract aggregate change in the actuarial present value of accumulated benefits under all defined benefit and pension plans reported in the SCT | 1,364,000 | 106,218 | ||||||||
| Add service cost | 300,000 | 36,500 | ||||||||
| Add prior service cost | 0 | 0 | ||||||||
Adjustments for stock and option awards: |
||||||||||
| Subtract SCT amounts of stock and option awards | 5,749,775 | 630,999 | ||||||||
| Add fair value at 2025 fiscal year-end of awards granted during fiscal year 2025 that are outstanding and unvested at year-end |
4,951,645 | 543,410 | ||||||||
| +/- The difference between fair value of awards from the end of fiscal year 2024 to the end of fiscal year 2025 for awards granted in any prior fiscal year that are outstanding and unvested at year-end |
(1,670,177 | ) | (167,744 | ) | ||||||
| Add the fair value as of the vesting date for awards granted and vesting during fiscal year 2025 | 0 | 0 | ||||||||
| +/- The change in fair value from the end of fiscal year 2024 to the vesting date for awards granted in any prior fiscal year for which all applicable vesting conditions were satisfied during fiscal year 2025 | 181,925 | 20,299 | ||||||||
| Subtract fair value at end of fiscal year 2024 for awards granted in any prior fiscal year that fail to meet the applicable vesting conditions during fiscal year 2025 | 0 | 0 | ||||||||
| Add dividends or other earnings paid on stock or option awards in 2024 prior to vesting if not otherwise included in total compensation for fiscal year 2025 | 0 | 0 | ||||||||
Compensation Actually Paid (as calculated) |
6,140,949 | 1,279,874 | ||||||||
Most Important Financial Measures
The table below lists the most important financial performance measures used by the Company to link CAP to the Company’s NEOs to Company performance.
Most Important Financial Performance Measures |
Net Sales |
Incentive Earnings Per Share |
Divisional Net Sales |
Divisional Incentive Earnings Per Share |