Pay vs Performance Disclosure - USD ($)
Dec. 31, 2025
Dec. 31, 2024
Dec. 31, 2023
Pay Versus Performance
As required by Section 953(a) of the Dodd-Frank Wall Street Reform and Consumer Protection Act and Item 402(v) of Regulation S-K, we are providing the following disclosure regarding executive compensation for our principal executive officer (“PEO”) and our other named executive officers (“Non-PEO NEOs”), and company performance for the fiscal years listed below. For further information concerning our pay-for-performance philosophy and how we structure our executive compensation to drive and reward performance, refer to the section entitled “Executive Compensation”. The amounts shown for “Compensation Actually Paid” have been calculated in accordance with Item 402(v) of Regulation S-K and do not reflect compensation actually earned, realized, or received by our named executive officers for any of the periods listed. These amounts reflect Summary Compensation Table total compensation with certain adjustments as described in the following table and footnotes.
(1) | (2) | (3) | (4) | (5) | (6) | (7) | ||||||||||||
Year | Summary Compensation Table Total for PEO ($) | Compensation Actually Paid to PEO ($) | Average Summary Compensation Table Total for Non-PEO Named Executive Officers ($) | Average Compensation Actually Paid to Non-PEO Named Executive Officers ($) | Value of Initial Fixed $100 Investment Based on Total Shareholder Return ($) | Net Income ($) | ||||||||||||
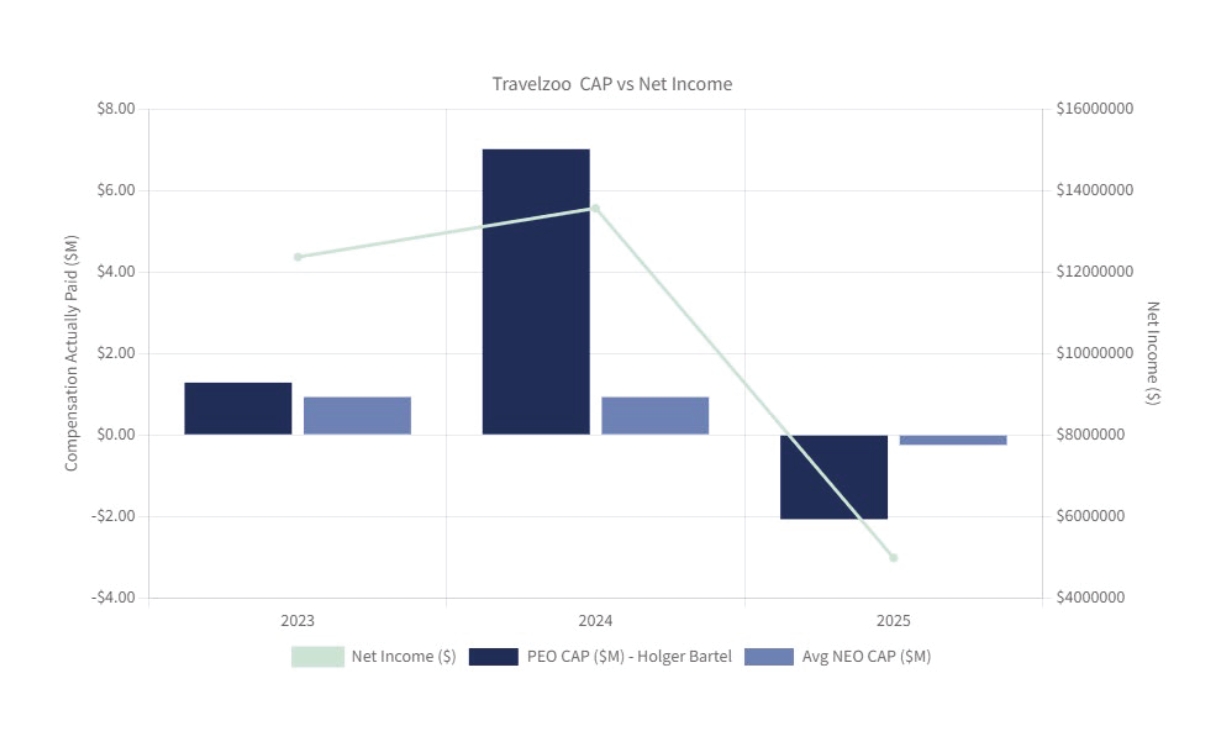
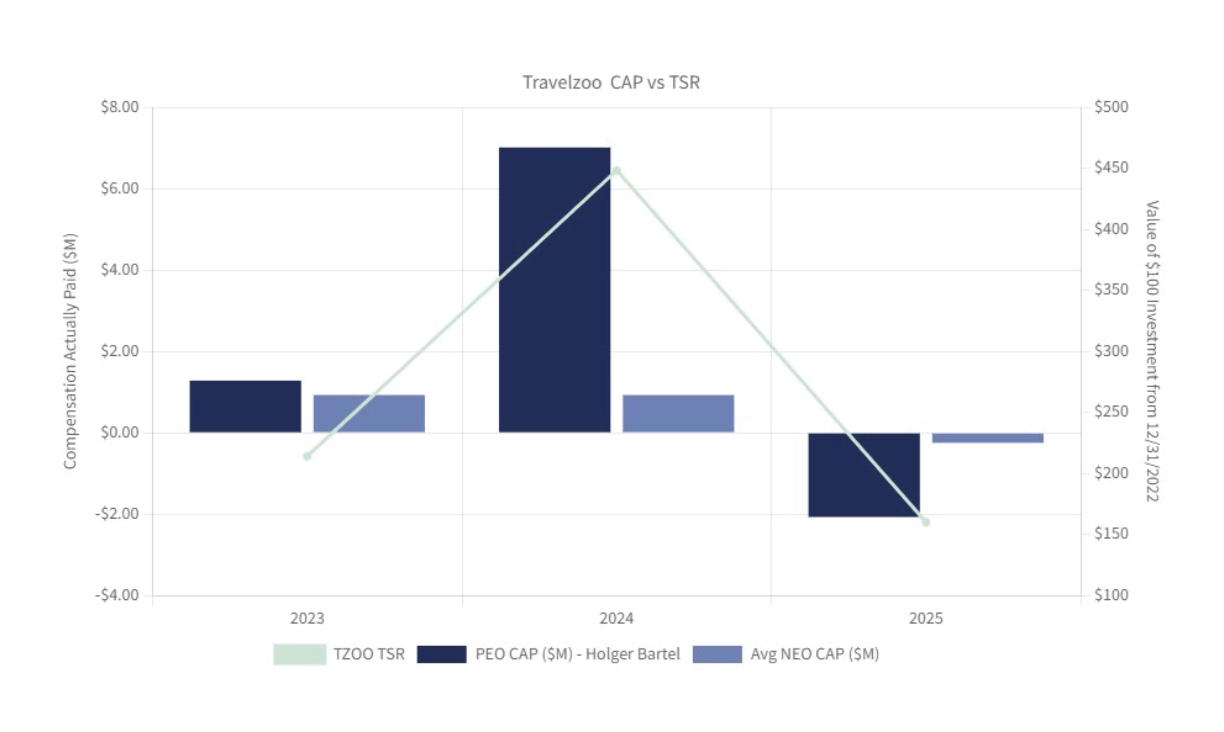
2025 | 586,550 | (2,069,455) | 304,479 | (247,667) | 160.00 | 4,980,000 | ||||||||||||
2024 | 3,014,050 | 7,013,715 | 358,889 | 929,845 | 211.78 | 13,564,000 | ||||||||||||
2023 | 561,250 | 1,282,190 | 524,227 | 931,369 | 100.95 | 12,366,000 | ||||||||||||
(1) | Holger Bartel served as our PEO for the entirety of fiscal years 2023, 2024 and 2025. Our Non-PEO NEOs for 2023 were Christina Sindoni Ciocca and Wayne Lee (Chief Financial Officer). Our Non-PEO NEOs for 2024 and 2025 were Christina Sindoni Ciocca and Lijun Qi. |
(2) | Amounts reported in this column represent the total compensation reported in the Summary Compensation Table for the applicable year for our PEO. |
(3) | Amounts reported in this column represent the compensation actually paid to the PEO, based on his total compensation reported in the Summary Compensation Table for the indicated fiscal years and adjusted as shown in the table below: |
PEO | 2023 ($) | 2024 ($) | 2025 ($) | |||||||||
Summary Compensation Table – Total Compensation | (a) | 561,250 | 3,014,050 | 586,550 | ||||||||
Minus Grant Date Fair Value of Stock Awards and Option Awards Granted in Fiscal Year | (b) | 0 | (2,437,800) | 0 | ||||||||
Plus Fair Value at Fiscal Year End of Outstanding and Unvested Stock Awards and Option Awards Granted in Fiscal Year | (c) | 0 | 3,975,581 | 0 | ||||||||
Plus Change in Fair Value of Outstanding and Unvested Stock Awards and Option Awards Granted in Prior Fiscal Year | (d) | 0 | 0 | 0 | ||||||||
Plus Fair Value at Vesting of Stock Awards and Option Awards Granted in Fiscal Year That Vested During Fiscal Year | (e) | 0 | 2,461,884 | 0 | ||||||||
Plus Change in Fair Value as of Vesting Date of Stock Awards and Option Awards Granted in Prior Fiscal Years For Which Applicable Vesting Conditions Were Satisfied During Fiscal Year | (f) | 720,940 | 0 | (2,656,005) | ||||||||
Minus Fair Value as of Prior Fiscal Year End of Stock Awards and Option Awards Granted in Prior Fiscal Years That Failed to Meet Applicable Vesting Conditions During Fiscal Year | (g) | 0 | 0 | 0 | ||||||||
equals | ||||||||||||
Compensation Actually Paid | 1,282,190 | 7,013,715 | (2,069,455) | |||||||||
(a) | Represents Total Compensation reported in the Summary Compensation Table for the indicated fiscal year. |
(b) | Represents the aggregate grant date fair value of the stock awards and option awards granted to the PEO during the indicated fiscal year, computed in accordance with FASB ASC 718. |
(c) | Represents the aggregate fair value as of the indicated fiscal year-end of the PEO’s outstanding and unvested stock awards and option awards granted during such fiscal year, computed in accordance with FASB ASC 718. |
(d) | Represents the aggregate change in fair value during the indicated fiscal year of the outstanding and unvested stock awards and option awards held by the PEO as of the last day of the indicated fiscal year, computed in accordance with FASB ASC 718. |
(e) | Represents the aggregate fair value at vesting of the stock awards and option awards that were granted to the PEO and vested during the indicated fiscal year, computed in accordance with FASB ASC 718. |
(f) | Represents the aggregate change in fair value, measured from the prior fiscal year-end to the vesting date, of each stock award and option award held by the PEO that was granted in a prior fiscal year and which vested during the indicated fiscal year, computed in accordance with FASB ASC 718. |
(g) | Represents the aggregate fair value as of the last day of the prior fiscal year of the PEO’s stock awards and option awards that were granted in a prior fiscal year and which failed to meet the applicable vesting conditions in the indicated fiscal year, computed in accordance with FASB ASC 718. |
There were no dividends or other earnings paid on the stock awards or option awards in the covered fiscal years.
(4) | Amounts reported in this column represent the average of the total compensation reported in the Summary Compensation Table for the applicable year for our Non-PEO NEOs. |
(5) | Amounts reported in this column represent the compensation actually paid to our Non-PEO NEOs in the indicated fiscal year, based on the average total compensation for such Non-PEO NEOs reported in the Summary Compensation Table for the indicated fiscal years and adjusted as shown in the table below: |
NEO Average | 2023 ($) | 2024 ($) | 2025 ($) | |||||||||
Summary Compensation Table – Total Compensation | (a) | 524,227 | 358,889 | 304,479 | ||||||||
Minus Grant Date Fair Value of Stock Awards and Option Awards Granted in Fiscal Year | (b) | (278,000) | 0 | 0 | ||||||||
Plus Fair Value at Fiscal Year End of Outstanding and Unvested Stock Awards and Option Awards Granted in Fiscal Year | (c) | 542,910 | 0 | 0 | ||||||||
Plus Change in Fair Value of Outstanding and Unvested Stock Awards and Option Awards Granted in Prior Fiscal Year | (d) | 53,866 | 470,515 | (308,942) | ||||||||
Plus Fair Value at Vesting of Stock Awards and Option Awards Granted in Fiscal Year That Vested During Fiscal Year | (e) | 77,562 | 0 | 0 | ||||||||
Plus Change in Fair Value as of Vesting Date of Stock Awards and Option Awards Granted in Prior Fiscal Years For Which Applicable Vesting Conditions Were Satisfied During Fiscal Year | (f) | 10,804 | 100,441 | (243,205) | ||||||||
Minus Fair Value as of Prior Fiscal Year End of Stock Awards and Option Awards Granted in Prior Fiscal Years That Failed to Meet Applicable Vesting Conditions During Fiscal Year | (g) | 0 | 0 | 0 | ||||||||
equals | ||||||||||||
Compensation Actually Paid | 931,369 | 929,845 | (247,667) | |||||||||
(a) | See footnote 1 for the NEOs included in the average for each indicated fiscal year. Represents the average Total Compensation as reported in the Summary Compensation Table for the reported NEOs in the indicated fiscal year. |
(b) | Represents the aggregate grant date fair value of the stock awards and option awards granted to the Non-PEO NEOs during the indicated fiscal year, computed in accordance with FASB ASC 718. |
(c) | Represents the aggregate fair value as of the indicated fiscal year-end of the Non-PEO NEO’s outstanding and unvested stock awards and option awards granted during such fiscal year, computed in accordance with FASB ASC 718. |
(d) | Represents the aggregate change in fair value during the indicated fiscal year of the outstanding and unvested stock awards and option awards held by the Non-PEO NEO as of the last day of the indicated fiscal year, computed in accordance with FASB ASC 718. |
(e) | Represents the aggregate fair value at vesting of the stock awards and option awards that were granted to the Non-PEO NEO and vested during the indicated fiscal year, computed in accordance with FASB ASC 718. |
(f) | Represents the aggregate change in fair value, measured from the prior fiscal year-end to the vesting date, of each stock award and option award held by the Non-PEO NEO that was granted in a prior fiscal year and which vested during the indicated fiscal year, computed in accordance with FASB ASC 718. |
(g) | Represents the aggregate fair value as of the last day of the prior fiscal year of the Non-PEO NEO’s stock awards and option awards that were granted in a prior fiscal year and which failed to meet the applicable vesting conditions in the indicated fiscal year, computed in accordance with FASB ASC 718. |
There were no dividends or other earnings paid on the stock awards or option awards in the covered fiscal years.
(6) | Assumes $100 invested as of December 31, 2022 through the end of the applicable year. |
(7) | The dollar amounts represent the amount of net income attributable to Travelzoo reflected in our audited financial statements for the applicable fiscal year. |
(1) | Holger Bartel served as our PEO for the entirety of fiscal years 2023, 2024 and 2025. Our Non-PEO NEOs for 2023 were Christina Sindoni Ciocca and Wayne Lee (Chief Financial Officer). Our Non-PEO NEOs for 2024 and 2025 were Christina Sindoni Ciocca and Lijun Qi. |
(3) | Amounts reported in this column represent the compensation actually paid to the PEO, based on his total compensation reported in the Summary Compensation Table for the indicated fiscal years and adjusted as shown in the table below: |
PEO | 2023 ($) | 2024 ($) | 2025 ($) | |||||||||
Summary Compensation Table – Total Compensation | (a) | 561,250 | 3,014,050 | 586,550 | ||||||||
Minus Grant Date Fair Value of Stock Awards and Option Awards Granted in Fiscal Year | (b) | 0 | (2,437,800) | 0 | ||||||||
Plus Fair Value at Fiscal Year End of Outstanding and Unvested Stock Awards and Option Awards Granted in Fiscal Year | (c) | 0 | 3,975,581 | 0 | ||||||||
Plus Change in Fair Value of Outstanding and Unvested Stock Awards and Option Awards Granted in Prior Fiscal Year | (d) | 0 | 0 | 0 | ||||||||
Plus Fair Value at Vesting of Stock Awards and Option Awards Granted in Fiscal Year That Vested During Fiscal Year | (e) | 0 | 2,461,884 | 0 | ||||||||
Plus Change in Fair Value as of Vesting Date of Stock Awards and Option Awards Granted in Prior Fiscal Years For Which Applicable Vesting Conditions Were Satisfied During Fiscal Year | (f) | 720,940 | 0 | (2,656,005) | ||||||||
Minus Fair Value as of Prior Fiscal Year End of Stock Awards and Option Awards Granted in Prior Fiscal Years That Failed to Meet Applicable Vesting Conditions During Fiscal Year | (g) | 0 | 0 | 0 | ||||||||
equals | ||||||||||||
Compensation Actually Paid | 1,282,190 | 7,013,715 | (2,069,455) | |||||||||
(a) | Represents Total Compensation reported in the Summary Compensation Table for the indicated fiscal year. |
(b) | Represents the aggregate grant date fair value of the stock awards and option awards granted to the PEO during the indicated fiscal year, computed in accordance with FASB ASC 718. |
(c) | Represents the aggregate fair value as of the indicated fiscal year-end of the PEO’s outstanding and unvested stock awards and option awards granted during such fiscal year, computed in accordance with FASB ASC 718. |
(d) | Represents the aggregate change in fair value during the indicated fiscal year of the outstanding and unvested stock awards and option awards held by the PEO as of the last day of the indicated fiscal year, computed in accordance with FASB ASC 718. |
(e) | Represents the aggregate fair value at vesting of the stock awards and option awards that were granted to the PEO and vested during the indicated fiscal year, computed in accordance with FASB ASC 718. |
(f) | Represents the aggregate change in fair value, measured from the prior fiscal year-end to the vesting date, of each stock award and option award held by the PEO that was granted in a prior fiscal year and which vested during the indicated fiscal year, computed in accordance with FASB ASC 718. |
(g) | Represents the aggregate fair value as of the last day of the prior fiscal year of the PEO’s stock awards and option awards that were granted in a prior fiscal year and which failed to meet the applicable vesting conditions in the indicated fiscal year, computed in accordance with FASB ASC 718. |
There were no dividends or other earnings paid on the stock awards or option awards in the covered fiscal years.
(5) | Amounts reported in this column represent the compensation actually paid to our Non-PEO NEOs in the indicated fiscal year, based on the average total compensation for such Non-PEO NEOs reported in the Summary Compensation Table for the indicated fiscal years and adjusted as shown in the table below: |
NEO Average | 2023 ($) | 2024 ($) | 2025 ($) | |||||||||
Summary Compensation Table – Total Compensation | (a) | 524,227 | 358,889 | 304,479 | ||||||||
Minus Grant Date Fair Value of Stock Awards and Option Awards Granted in Fiscal Year | (b) | (278,000) | 0 | 0 | ||||||||
Plus Fair Value at Fiscal Year End of Outstanding and Unvested Stock Awards and Option Awards Granted in Fiscal Year | (c) | 542,910 | 0 | 0 | ||||||||
Plus Change in Fair Value of Outstanding and Unvested Stock Awards and Option Awards Granted in Prior Fiscal Year | (d) | 53,866 | 470,515 | (308,942) | ||||||||
Plus Fair Value at Vesting of Stock Awards and Option Awards Granted in Fiscal Year That Vested During Fiscal Year | (e) | 77,562 | 0 | 0 | ||||||||
Plus Change in Fair Value as of Vesting Date of Stock Awards and Option Awards Granted in Prior Fiscal Years For Which Applicable Vesting Conditions Were Satisfied During Fiscal Year | (f) | 10,804 | 100,441 | (243,205) | ||||||||
Minus Fair Value as of Prior Fiscal Year End of Stock Awards and Option Awards Granted in Prior Fiscal Years That Failed to Meet Applicable Vesting Conditions During Fiscal Year | (g) | 0 | 0 | 0 | ||||||||
equals | ||||||||||||
Compensation Actually Paid | 931,369 | 929,845 | (247,667) | |||||||||
(a) | See footnote 1 for the NEOs included in the average for each indicated fiscal year. Represents the average Total Compensation as reported in the Summary Compensation Table for the reported NEOs in the indicated fiscal year. |
(b) | Represents the aggregate grant date fair value of the stock awards and option awards granted to the Non-PEO NEOs during the indicated fiscal year, computed in accordance with FASB ASC 718. |
(c) | Represents the aggregate fair value as of the indicated fiscal year-end of the Non-PEO NEO’s outstanding and unvested stock awards and option awards granted during such fiscal year, computed in accordance with FASB ASC 718. |
(d) | Represents the aggregate change in fair value during the indicated fiscal year of the outstanding and unvested stock awards and option awards held by the Non-PEO NEO as of the last day of the indicated fiscal year, computed in accordance with FASB ASC 718. |
(e) | Represents the aggregate fair value at vesting of the stock awards and option awards that were granted to the Non-PEO NEO and vested during the indicated fiscal year, computed in accordance with FASB ASC 718. |
(f) | Represents the aggregate change in fair value, measured from the prior fiscal year-end to the vesting date, of each stock award and option award held by the Non-PEO NEO that was granted in a prior fiscal year and which vested during the indicated fiscal year, computed in accordance with FASB ASC 718. |
(g) | Represents the aggregate fair value as of the last day of the prior fiscal year of the Non-PEO NEO’s stock awards and option awards that were granted in a prior fiscal year and which failed to meet the applicable vesting conditions in the indicated fiscal year, computed in accordance with FASB ASC 718. |
There were no dividends or other earnings paid on the stock awards or option awards in the covered fiscal years.
Relationship Between Compensation Actually Paid and TSR
Relationship Between Compensation and Net Income