Pay vs Performance Disclosure - USD ($)
Dec. 31, 2025
Dec. 31, 2024
Dec. 31, 2023
Dec. 31, 2022
Dec. 31, 2021
Value of Initial Fixed $100 Investment Based On: | ||||||||
Summary Compensation Table Total for PEO | Compensation Actually Paid to PEO (1) | Average Summary Compensation Table Total for Non-PEO NEOs (2) | Average Compensation Actually Paid to Non-PEO NEOs (1) (2) | Company Total Shareholder Return | Peer Group Total Shareholder Return (3) | Net Income (millions) | Revenue (millions) | |
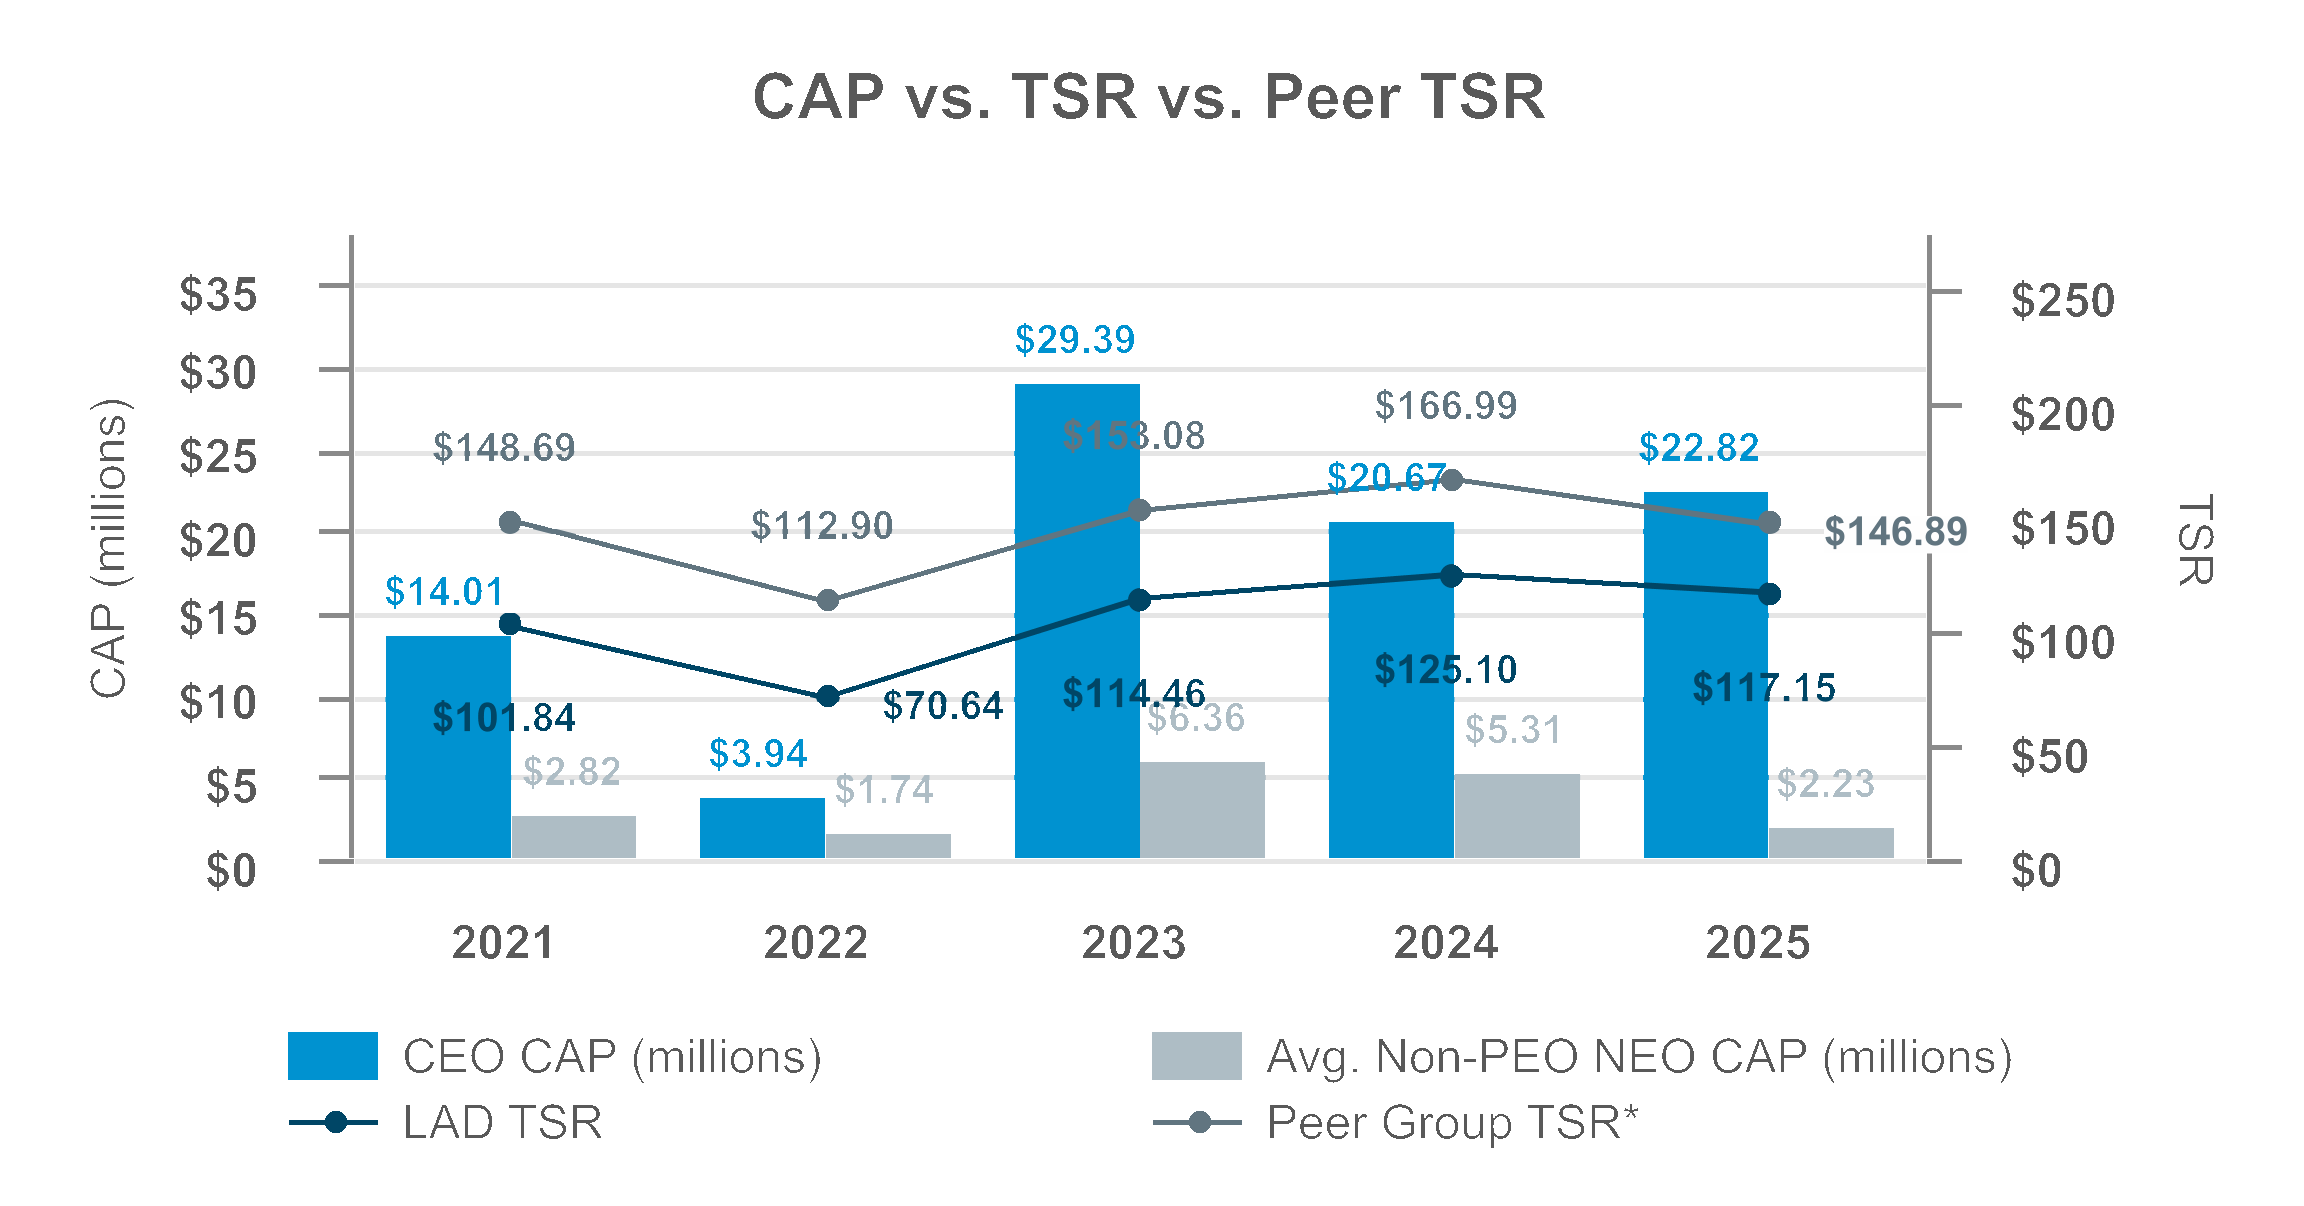
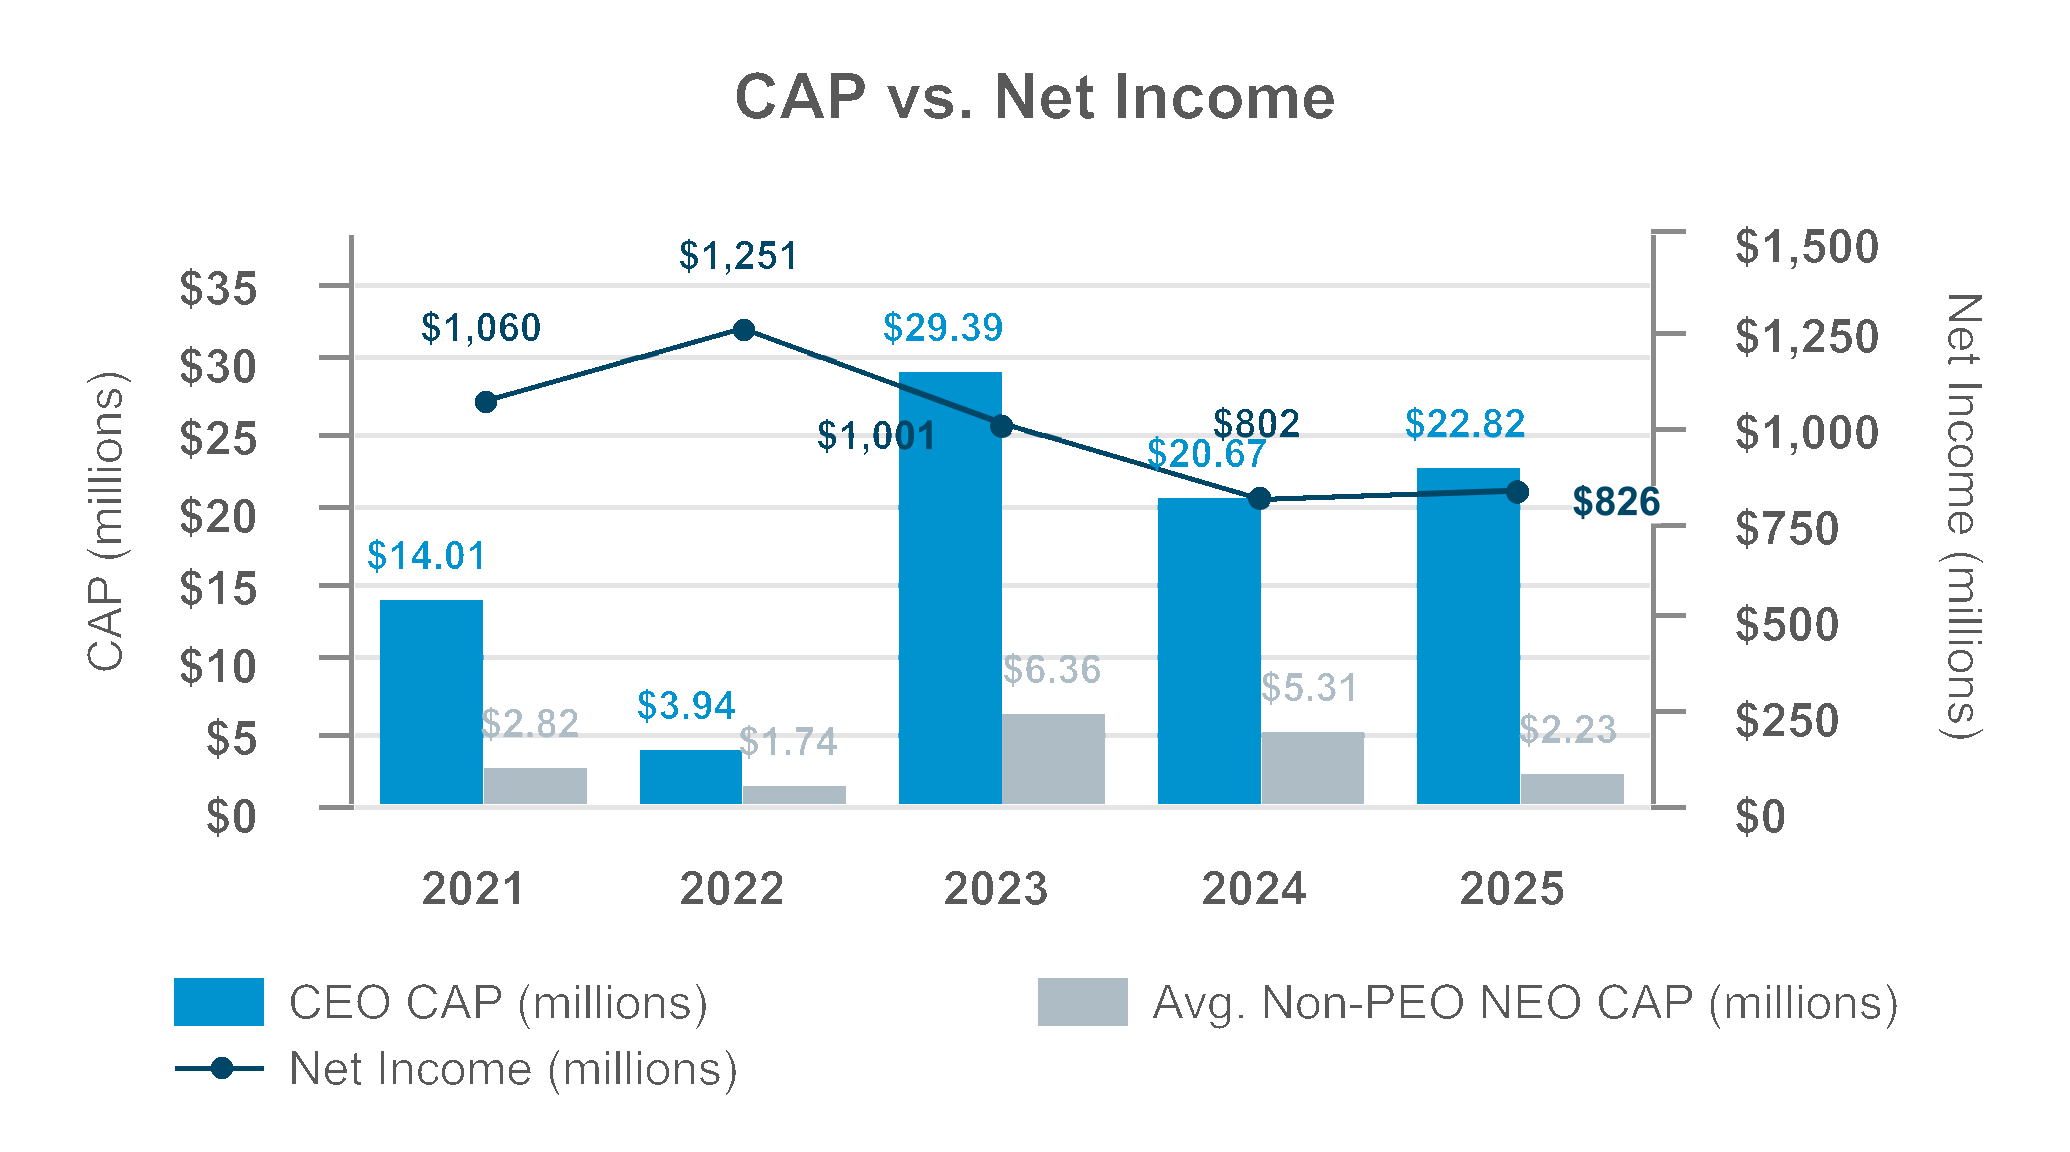
2025 | $15,895,468 | $22,817,359 | $2,612,837 | $2,227,492 | $117.15 | $146.89 | $825.9 | $37,634.9 |
2024 | $16,795,702 | $20,673,914 | $4,550,369 | $5,310,903 | $125.10 | $166.99 | $802.0 | $36,188.2 |
2023 | $19,235,990 | $29,392,849 | $4,715,979 | $6,355,137 | $114.46 | $153.08 | $1,000.8 | $31,042.3 |
2022 | $11,125,717 | $3,939,506 | $2,805,572 | $1,740,328 | $70.64 | $112.90 | $1,251.0 | $28,187.8 |
2021 | $10,532,359 | $14,008,918 | $2,323,172 | $2,821,850 | $101.84 | $148.69 | $1,060.1 | $22,831.7 |
(1) In accordance with the requirements of Item 402(v) of Regulation S-K, 2025 “compensation actually paid” (CAP) to our PEO and average CAP
for our non-PEO NEOs was calculated by making the following adjustments to the total compensation reported in the Summary Compensation
Table, above. The equity award related adjustments described below reflect the fair value (or change in fair value) for performance- and time-
vesting RSUs, computed in accordance with FASB ASC Topic 718 on the relevant dates.
year, is as follows:
Year | NEOs: |
2025 | Tina H. Miller, David G. Stork, Gary M. Glandon, George N. Hines, Adam A. Chamberlain. |
2024 | Tina H. Miller, Adam A. Chamberlain, Christopher S. Holzshu, George N. Hines |
2021 - 2023 | Tina H. Miller, Christopher S. Holzshu, Scott A. Hillier, George N. Hines |
the same peer group used for calculating peer group TSR in our last-filed pay versus performance table. For each year indicated, those Auto
Peers consisted of Penske Automotive Group, AutoNation, Sonic Automotive, Group 1 Automotive, Asbury Automotive Group, and CarMax.
officers.
PEO | NEO Avg. | |
Summary Compensation Table (SCT) Total | $15,895,468 | $2,612,837 |
Amounts reported under the “Change in Pension Value and Nonqualified Deferred Compensation Earnings” Column of the SCT | ($6,256) | ($343) |
Amounts Reported under the “Stock Awards” Column of the SCT | ($10,736,203) | ($1,308,622) |
Amounts Reported under the “Option Awards” Column of the SCT | $0 | $0 |
Total Deductions from SCT | ($10,742,459) | ($1,308,965) |
“Service Cost” for Pension Plans | $0 | $0 |
“Prior Service Cost” for Pension Plans | $0 | $0 |
Fair Value at Fiscal Year End of Outstanding and Unvested Equity Awards Granted in the Fiscal Year | $9,637,626 | $885,557 |
Change in Fair Value of Outstanding and Unvested Equity Awards Granted in Prior Fiscal Years | $8,026,573 | $567,813 |
Fair Value at Vesting of Equity Awards Granted and Vested in the Fiscal Year | $0 | $0 |
Change in Fair Value as of the Vesting Date of Equity Awards Granted in Prior Fiscal Years that Vested in the Fiscal Year | $151 | $9 |
Fair Value as of the Prior Fiscal Year End of Equity Awards Granted in Prior Fiscal Years that Failed to Meet Vesting Conditions in the Fiscal Year | $0 | ($529,759) |
Value of Dividends or Other Earnings Paid on Equity Awards Not Otherwise Reflected in Total Compensation | $0 | $0 |
All Other Adjustments | $17,664,350 | $923,620 |
Compensation Actually Paid SCT Total less Total Deduction from SCT plus (minus) All Other Adjustments | $22,817,359 | $2,227,492 |
NEO compensation actually paid (CAP) and our TSR, net income, and revenue, respectively. For the purpose of the below charts, all
data is calculated as described in the footnotes of the above Pay Versus Performance table.
NEO compensation actually paid (CAP) and our TSR, net income, and revenue, respectively. For the purpose of the below charts, all
data is calculated as described in the footnotes of the above Pay Versus Performance table.
NEO compensation actually paid (CAP) and our TSR, net income, and revenue, respectively. For the purpose of the below charts, all
data is calculated as described in the footnotes of the above Pay Versus Performance table.
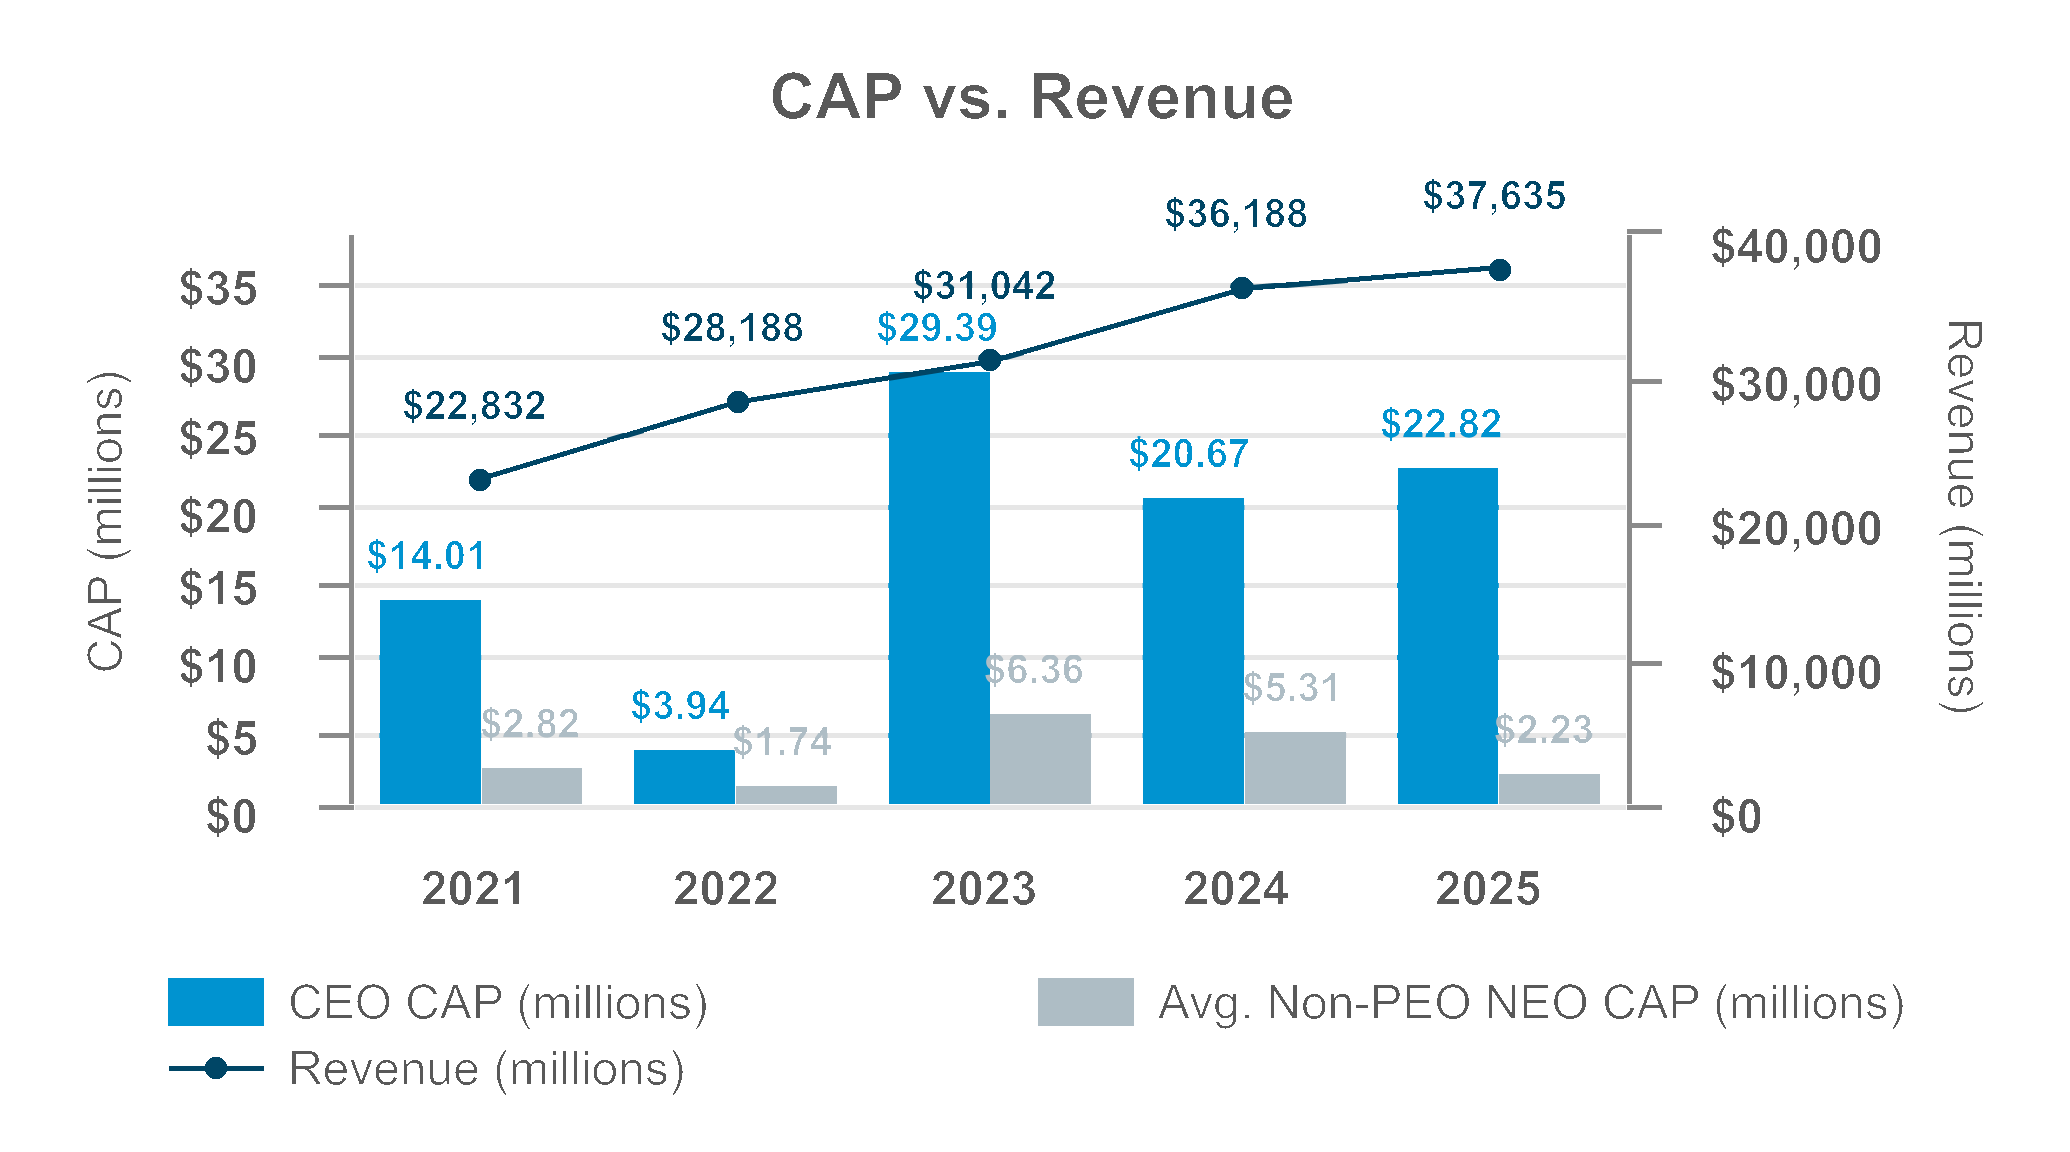
NEO compensation actually paid (CAP) and our TSR, net income, and revenue, respectively. For the purpose of the below charts, all
data is calculated as described in the footnotes of the above Pay Versus Performance table.
Performance Measures | Table of Performance Measures This table presents the performance measures the Compensation Committee considers to have been the most important in its executive compensation program linking pay to performance for 2025, with revenue serving as the single most important financial metric. The role of each of these performance measures on our NEOs’ compensation is discussed in the Compensation Discussion and Analysis section. | |
Revenue (financial) | ||
Earnings Per Share (financial) | ||
Total Shareholder Return (financial) | ||
Net Income (financial) | ||
Corporate Responsibility and Strategic (non-financial) | ||