As required by Item 402(v) of Regulation S-K, the Corporation is providing the following information about the relationship between executive compensation as reported in the Summary Compensation Table, “Compensation Actually Paid” ("CAP") as defined by the SEC, and certain financial performance of the Company. CAP is calculated in accordance with SEC rules and does not reflect the actual amount of compensation earned or paid during the applicable year. For information concerning the Corporation’s pay for performance philosophy and how the Corporation aligns executive compensation with the Corporation’s performance, refer to the Compensation Discussion and Analysis beginning on page 20.
The following table reports the total compensation for the NEOs for the past five (5) fiscal years as shown in the Summary Compensation Table ("SCT"), the CAP to the PEO and, on average, to the other NEOs in accordance with SEC rules. The table also provides information on the Corporation's Total Shareholder Return ("TSR") and the TSR of the selected peer group over the five-year period, the Corporation's Net Income, and the Corporation's ROAE which represents our Company Selected Measure ("CSM") per SEC rules.
|
Year-end value of $100 invested on 12/31/2020 |
||||||||||||||||||||||||||||||||
|
Year |
SCT Total for PEO (1) |
CAP for PEO (2) |
Average SCT Total for Non-PEO NEOs (1) |
Average CAP for Non-PEO NEOs (2) |
FCBC TSR (3) |
Peer Group TSR (4) |
FCBC Net Income |
FCBC ROAE (%) |
||||||||||||||||||||||||
|
2025 |
$ | 1,122,498 | $ | 1,029,477 | $ | 896,664 | $ | 866,465 | $ | 195.35 | $ | 167.37 | $ | 48.79 | (5) | 9.64 | ||||||||||||||||
|
2024 |
855,786 | 888,650 | 704,183 | 728,682 | 161.84 | 120.02 | 51.60 | 10.03 | ||||||||||||||||||||||||
|
2023 |
1,200,030 | 956,254 | 777,519 | 765,683 | 141.73 | 128.73 | 48.02 | 10.02 | ||||||||||||||||||||||||
|
2022 |
970,489 | 942,517 | 756,509 | 761,575 | 122.88 | 99.82 | 46.66 | 11.04 | ||||||||||||||||||||||||
|
2021 |
690,995 | 702,132 | 525,400 | 567,119 | 116.90 | 107.19 | 51.17 | 11.96 | ||||||||||||||||||||||||
|
(1) |
Mr. William Stafford served as the PEO for all five (5) years covered in the table. Messrs. Gary Mills, David Brown, Jason Belcher, and Ms. Sarah Harmon served as the Non-PEO NEOs for all five (5) years covered in the table. The dollar amounts reported are total compensation in the Summary Compensation Table for the PEO and the average for Non-PEO NEOs for each reported fiscal year. |
|
(2) |
The dollar amounts reported represent "Compensation Actually Paid," as calculated in accordance with SEC rules for the PEO and the average for Non-PEO NEOs for each reported year. These dollar amounts do not reflect actual amounts of compensation paid during the covered year, but reflect adjustments for (i) the year-end fair values of unvested equity awards granted in the current year, (ii) the year-over-year difference of year-end fair values for unvested awards granted in prior years, (iii) the fair values at vest date for awards granted and vested in the current year, and (iv) the difference between prior year-end fair values and vest date fair values for awards granted in prior years. In addition, adjustments were made for the difference in pension values reported in the Summary Compensation Table and the current year service cost obtained from the Corporation's pension actuary. The Corporation does not pay or accrue dividends or dividend equivalents on unvested equity grants; and, as such, reports no adjustments. |
|
(3) |
Reflects the cumulative total shareholder return of First Community Bankshares, Inc. over the five-year period. The reporting is based on a theoretical $100 invested on the last day of 2020 and valued as of the last trading day of 2021, 2022, 2023, 2024 and 2025. These calculated values were obtained from the S&P Cap IQ database. |
|
(4) |
Reflects the cumulative total shareholder return of the Corporation’s Asset & Regional Peer Group, weighted according to the member companies’ market capitalization for each period for which the return is indicated. This is the peer group used by FCBC for purposes of Item 201(e) of Regulation S-K in our Annual Report on Form 10K for the year ended December 31, 2025. Calculated values in the table were obtained from the S&P Cap IQ database. |
|
(5) |
Net income in 2025 was negatively impacted by $2.33 million of after-tax merger related expenses. |
Calculation of Compensation Actually Paid ("CAP")
To calculate the amounts in the CAP for the Corporation's PEO and Non-PEO NEOs in the table above according to SEC reporting rules, the following adjustments were made to Total Compensation as reported in the Summary Compensation Table for each covered year.
|
2025 |
2024 |
2023 |
2022 |
2021 |
||||||||||||||||||||||||||||||||||||
|
PEO |
Average Non-PEO NEOs |
PEO |
Average Non-PEO NEOs |
PEO |
Average Non-PEO NEOs |
PEO |
Average Non-PEO NEOs |
PEO |
Average Non-PEO NEOs |
|||||||||||||||||||||||||||||||
|
Total Compensation from Summary Compensation Table |
$ | 1,122,498 | $ | 896,664 | $ | 855,786 | $ | 704,183 | $ | 1,200,030 | $ | 777,519 | $ | 970,489 | $ | 756,509 | $ | 690,995 | $ | 525,400 | ||||||||||||||||||||
|
Adjustments for Pension |
||||||||||||||||||||||||||||||||||||||||
|
Adjustment Summary Compensation Table Pension |
(76,203 | ) | (16,916 | ) | - | - | (301,283 | ) | (54,654 | ) | (46,618 | ) | (9,027 | ) | (43,270 | ) | (20,210 | ) | ||||||||||||||||||||||
|
Amount added for current year service cost |
- | - | - | - | - | - | - | - | - | 31,734 | ||||||||||||||||||||||||||||||
|
Amount added for prior service cost impacting current year |
- | - | - | - | - | - | - | - | - | - | ||||||||||||||||||||||||||||||
|
Total Adjustments for Pension |
(76,203 | ) | (16,916 | ) | - | - | (301,283 | ) | (54,654 | ) | (46,618 | ) | (9,027 | ) | (43,270 | ) | 11,524 | |||||||||||||||||||||||
|
Adjustments for Equity Awards |
||||||||||||||||||||||||||||||||||||||||
|
Adjustment for grant date values in the Summary Compensation Table |
(146,038 | ) | (115,342 | ) | (146,021 | ) | (108,853 | ) | (146,026 | ) | (108,835 | ) | (135,011 | ) | (100,643 | ) | (108,049 | ) | (82,640 | ) | ||||||||||||||||||||
|
Year-end fair value of unvested awards granted in the current year |
129,220 | 102,059 | 178,885 | 133,352 | 205,757 | 153,353 | 163,635 | 121,981 | 97,254 | 74,372 | ||||||||||||||||||||||||||||||
|
Year-over-year difference of year-end fair values for unvested awards granted in prior years |
- | - | - | - | (2,224 | ) | (1,700 | ) | 9,774 | 7,456 | 41,511 | 24,698 | ||||||||||||||||||||||||||||
|
Fair values at vest date for awards granted and vested in current year |
- | - | - | - | - | - | - | - | - | - | ||||||||||||||||||||||||||||||
|
Difference in fair values between prior year-end fair values and vest date fair values for awards granted in prior years |
- | - | - | - | - | - | (19,752 | ) | (14,701 | ) | 23,691 | 13,765 | ||||||||||||||||||||||||||||
|
Forfeitures during current year equal to prior year-end fair value |
- | - | - | - | - | - | - | - | - | - | ||||||||||||||||||||||||||||||
|
Dividends or dividend equivalents not otherwise included in total compensation |
- | - | - | - | - | - | - | - | - | - | ||||||||||||||||||||||||||||||
|
Total Adjustments for Equity Awards |
(16,818 | ) | (13,283 | ) | 32,864 | 24,499 | 57,507 | 42,818 | 18,646 | 14,093 | 54,407 | 30,195 | ||||||||||||||||||||||||||||
|
Compensation Actually Paid (as calculated) |
$ | 1,029,477 | $ | 866,465 | $ | 888,650 | $ | 728,682 | $ | 956,254 | $ | 765,683 | $ | 942,517 | $ | 761,575 | $ | 702,132 | $ | 567,119 | ||||||||||||||||||||
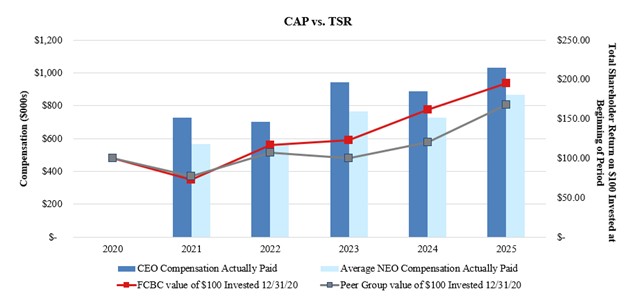
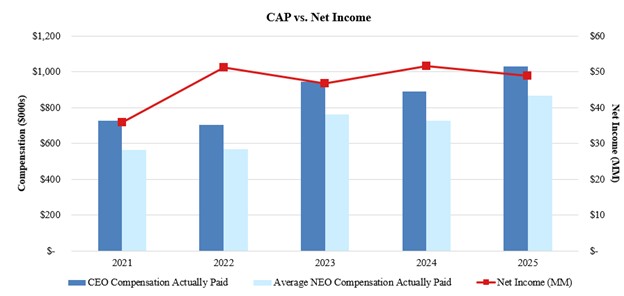
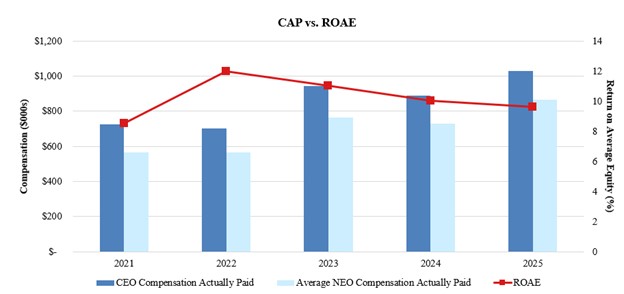
In accordance with SEC reporting rules, the Corporation has prepared the following graphs which overlay the following performance results with CAP:
|
● |
Corporation and peer group TSR versus Compensation Actually Paid to the PEO and average for other NEOs for each covered year. |
|
● |
Corporation Net Income versus Compensation Actually Paid to the PEO and average for other NEOs for each covered year. |
|
● |
Corporation Return on Average Equity (ROAE) versus Compensation Actually Paid to the PEO and average for other NEOs for each covered year. |
As required by SEC rules, the following table identifies the three most important financial measures used by the CRC for making compensation decisions related to the 2025 NEOs. The Company-Selected Measure is denoted with an asterisk.
|
Financial Performance Measures |
|
Return on Average Equity (ROAE) * |
|
Return on Average Assets (ROAA) |
|
Efficiency Ratio |