Pay versus Performance Table
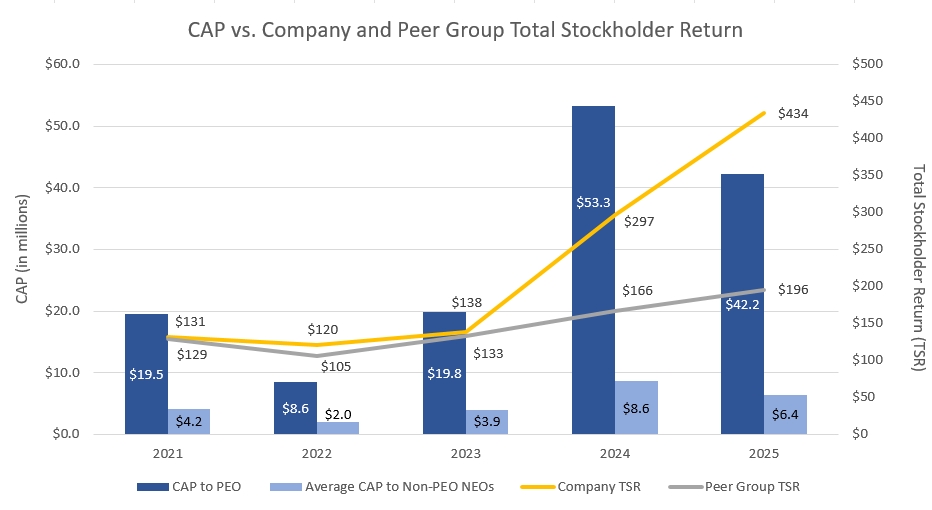
The table below presents the compensation paid to our principal executive officer (“PEO”) and the aggregate compensation paid to our other named executive officers (“NEOs”), our Total Stockholder Return (“TSR”) and the TSR of our peer group, and our performance with respect to two other performance metrics for 2025 and each of the four previous fiscal years. The compensation amounts reflected in the table below are calculated in accordance with SEC rules and do not represent amounts actually earned or realized by our PEO or our other NEOs.
|
|
Summary |
|
Compensation |
|
Average Summary |
|
Average |
|
Value of Initial Fixed $100 |
|
|
|
Adjusted |
||
Fiscal Year |
|
Compensation |
|
Actually |
|
Table Total |
|
Actually Paid |
|
IBKR Total |
|
S&P 500 Total |
|
Net Income |
|
Pre- |
2025 |
|
$19,669,486 |
|
$42,156,235 |
|
$3,294,867 |
|
$6,411,957 |
|
$434 |
|
$196 |
|
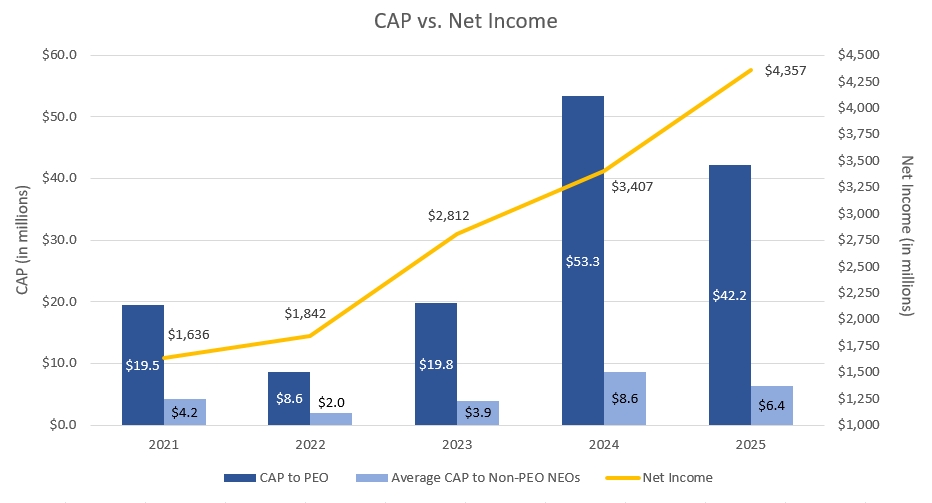
$4,357 |
|
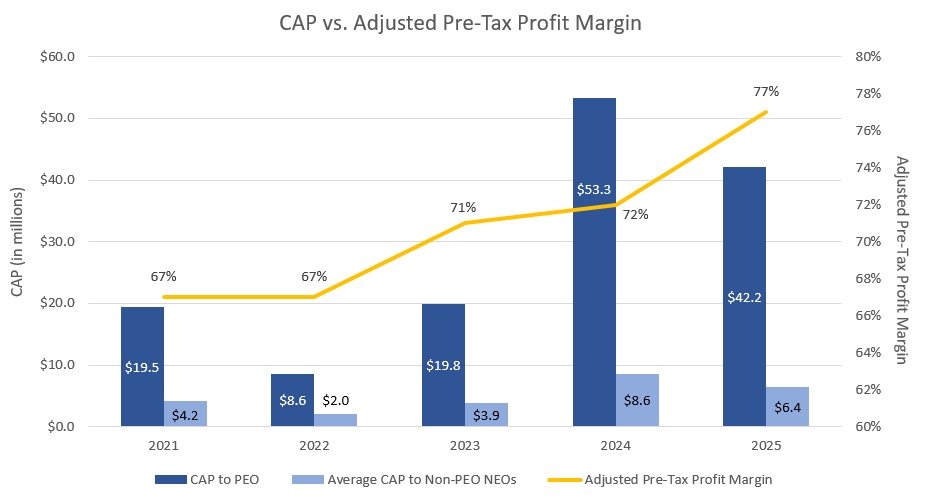
77% |
2024 |
|
$17,333,150 |
|
$53,300,542 |
|
$3,255,746 |
|
$8,612,750 |
|
$297 |
|
$166 |
|
$3,407 |
|
72% |
2023 |
|
$15,379,511 |
|
$19,849,625 |
|
$3,189,070 |
|
$3,902,730 |
|
$138 |
|
$133 |
|
$2,812 |
|
71% |
2022 |
|
$14,041,987 |
|
$8,571,380 |
|
$3,008,361 |
|
$2,028,489 |
|
$120 |
|
$105 |
|
$1,842 |
|
67% |
2021 |
|
$12,289,397 |
|
$19,472,820 |
|
$2,828,285 |
|
$4,188,291 |
|
$131 |
|
$129 |
|
$1,636 |
|
67% |
|
|
|
|
Adjustments |
|
|
||||||||
Year |
|
Summary |
|
Amounts |
|
Fair Value |
|
Change in Fair |
|
Fair Value |
|
Change in Fair |
|
Compensation |
PEO |
|
|
|
|
|
|
|
|
|
|
|
|
|
|
2025 |
|
$19,669,486 |
|
$(14,550,000) |
|
$14,447,242 |
|
$21,301,419 |
|
$50,033 |
|
$1,238,055 |
|
$42,156,235 |
2024 |
|
$17,333,150 |
|
$(12,525,000) |
|
$12,244,114 |
|
$31,292,831 |
|
$25,087 |
|
$4,930,360 |
|
$53,300,542 |
2023 |
|
$15,379,511 |
|
$(11,025,000) |
|
$11,231,126 |
|
$3,527,139 |
|
$25,036 |
|
$711,813 |
|
$19,849,625 |
2022 |
|
$14,041,987 |
|
$(10,037,500) |
|
$9,846,473 |
|
$(2,293,784) |
|
$27,033 |
|
$(3,012,829) |
|
$8,571,380 |
2021 |
|
$12,289,397 |
|
$(8,525,000) |
|
$8,753,434 |
|
$6,042,859 |
|
$25,017 |
|
$887,113 |
|
$19,472,820 |
Average for non-PEO NEOs |
||||||||||||||
2025 |
|
$3,294,867 |
|
$(1,487,500) |
|
$1,457,200 |
|
$2,936,132 |
|
$25,017 |
|
$186,242 |
|
$6,411,957 |
2024 |
|
$3,255,746 |
|
$(1,482,500) |
|
$1,439,949 |
|
$4,608,538 |
|
$12,544 |
|
$778,474 |
|
$8,612,750 |
2023 |
|
$3,189,070 |
|
$(1,412,500) |
|
$1,429,445 |
|
$563,278 |
|
$12,518 |
|
$120,920 |
|
$3,902,730 |
2022 |
|
$3,008,361 |
|
$(1,334,375) |
|
$1,299,225 |
|
$(402,096) |
|
$14,016 |
|
$(556,643) |
|
$2,028,489 |
2021 |
|
$2,828,285 |
|
$(1,237,500) |
|
$1,261,547 |
|
$1,142,546 |
|
$12,509 |
|
$180,904 |
|
$4,188,291 |
|
|
|
|
Adjustments |
|
|
||||||||
Year |
|
Summary |
|
Amounts |
|
Fair Value |
|
Change in Fair |
|
Fair Value |
|
Change in Fair |
|
Compensation |
PEO |
|
|
|
|
|
|
|
|
|
|
|
|
|
|
2025 |
|
$19,669,486 |
|
$(14,550,000) |
|
$14,447,242 |
|
$21,301,419 |
|
$50,033 |
|
$1,238,055 |
|
$42,156,235 |
2024 |
|
$17,333,150 |
|
$(12,525,000) |
|
$12,244,114 |
|
$31,292,831 |
|
$25,087 |
|
$4,930,360 |
|
$53,300,542 |
2023 |
|
$15,379,511 |
|
$(11,025,000) |
|
$11,231,126 |
|
$3,527,139 |
|
$25,036 |
|
$711,813 |
|
$19,849,625 |
2022 |
|
$14,041,987 |
|
$(10,037,500) |
|
$9,846,473 |
|
$(2,293,784) |
|
$27,033 |
|
$(3,012,829) |
|
$8,571,380 |
2021 |
|
$12,289,397 |
|
$(8,525,000) |
|
$8,753,434 |
|
$6,042,859 |
|
$25,017 |
|
$887,113 |
|
$19,472,820 |
Average for non-PEO NEOs |
||||||||||||||
2025 |
|
$3,294,867 |
|
$(1,487,500) |
|
$1,457,200 |
|
$2,936,132 |
|
$25,017 |
|
$186,242 |
|
$6,411,957 |
2024 |
|
$3,255,746 |
|
$(1,482,500) |
|
$1,439,949 |
|
$4,608,538 |
|
$12,544 |
|
$778,474 |
|
$8,612,750 |
2023 |
|
$3,189,070 |
|
$(1,412,500) |
|
$1,429,445 |
|
$563,278 |
|
$12,518 |
|
$120,920 |
|
$3,902,730 |
2022 |
|
$3,008,361 |
|
$(1,334,375) |
|
$1,299,225 |
|
$(402,096) |
|
$14,016 |
|
$(556,643) |
|
$2,028,489 |
2021 |
|
$2,828,285 |
|
$(1,237,500) |
|
$1,261,547 |
|
$1,142,546 |
|
$12,509 |
|
$180,904 |
|
$4,188,291 |
As described above, our executive compensation program seeks to align named executive officers’ long-term interests with those of our stockholders to incentivize a long-term increase in stockholder value, and therefore does not specifically align the Company’s performance measures with CAP (as defined by SEC rules) for a particular year. In accordance with Item 402(v) of Regulation S-K, we are providing the following graphic descriptions of the relationships between information presented in the Pay versus Performance table above, for each of the five years ended December 31, 2025.
As described above, our executive compensation program seeks to align named executive officers’ long-term interests with those of our stockholders to incentivize a long-term increase in stockholder value, and therefore does not specifically align the Company’s performance measures with CAP (as defined by SEC rules) for a particular year. In accordance with Item 402(v) of Regulation S-K, we are providing the following graphic descriptions of the relationships between information presented in the Pay versus Performance table above, for each of the five years ended December 31, 2025.
Financial Performance Measures
As described in the Compensation Philosophy and Objectives section contained in this Proxy Statement, our executive compensation program is designed to directly link a significant portion of the compensation of our named executive officers to individual performance and our overall performance, with the goals of aligning our executives’ long-term interests with those of our stockholders and attracting, retaining and motivating key executives who are essential to the implementation of our strategic growth and development strategy.
Our Compensation Committee evaluates individual and company performance in a qualitative fashion and does not utilize specific financial or operating performance goals or targets in setting executive compensation, but it considers the following financial measures to be the most important financial measures used by the Company to link CAP for the Company’s named executive officers for the most recently completed fiscal year, to Company performance:
For additional information regarding non-GAAP financial measures, refer to “Non-GAAP Financial Measures” in Part II, Item 7 of our Annual Report on Form 10-K for the year ended December 31, 2025.