SUMMARY COMPENSATION | COMPENSATION ACTUALLY | AVERAGE | | VALUE OF INITIAL FIXED $100 | ||||||||||||||||||||||||||
TABLE TOTAL FOR PEO (B) | PAID TO PEO (C) | SUMMARY | AVERAGE | INVESTMENT BASED ON: | ||||||||||||||||||||||||||
COMPENSATION | COMPENSATION | PEER GROUP | NET | ADJUSTED | ||||||||||||||||||||||||||
TABLE | ACTUALLY | TOTAL | TOTAL | INCOME | PRETAX | |||||||||||||||||||||||||
TOTAL FOR | PAID TO | SHAREHOLDER | SHAREHOLDER | (IN | INCOME (IN | |||||||||||||||||||||||||
YEAR | | PEO 1 | | PEO 2 | | PEO 1 | | PEO 2 | | NON-PEO NEOS | | NON-PEO NEOS | | RETURN | | RETURN | | THOUSANDS) | | THOUSANDS) | ||||||||||
(a) | | | | | | (d) | | (e) | | (f) | | (g) | | (h) | | (i) | ||||||||||||||
2025 |
| $ | 5,472,539 | $ | — | $ | 11,621,084 | $ | — | $ | 1,351,593 | $ | 2,457,249 | $ | 237 | $ | 130 | $ | 119,301 | $ | 122,596 | |||||||||
2024 |
|
| 5,505,066 | 4,835,199 | (33,689) | 2,437,520 | 1,443,875 | 770,494 | 178 | 122 | 170,700 | 147,941 | ||||||||||||||||||
2023 |
|
| 6,826,492 |
| — |
| 14,853,950 |
| — |
| 2,726,190 |
| 4,017,469 |
| 251 |
| 162 |
| 132,529 |
| 147,976 | |||||||||
2022 |
|
| 6,709,493 |
| — |
| 6,928,966 |
| — |
| 2,480,012 |
| 2,465,395 |
| 150 |
| 195 |
| 166,979 |
| 175,491 | |||||||||
2021 |
|
| 5,766,899 |
| — |
| 11,692,450 |
| — |
| 1,991,571 |
| 2,971,502 |
| 163 |
| 171 |
| 135,866 |
| 132,371 | |||||||||
Column (b). Reflects compensation amounts reported in the Summary Compensation Table for our Principal Executive Officers for the respective years shown. “PEO 1” refers to our CEO during the applicable year, except that for 2024, “PEO 1” refers to Patrick E. Bowe, who served as CEO through September 30, 2024, and “PEO 2” refers to William E. Krueger, who served as CEO beginning October 1, 2024.
Columns (c) and (e). Compensation actually paid (“CAP”) to our PEOs and non-CEO NEOs in 2025 reflects the respective amounts set forth in columns (b) and (d) of the table above, adjusted as set forth in the table below, as determined in accordance with SEC rules. For information regarding the decisions made by our Compensation Committee in regards to executive compensation, please see the Compensation Discussion & Analysis section of the proxy statements reporting pay for the fiscal years covered in the table above. Prior year proxy statements include the following reconciliation tables for all prior periods presented above.
| 2025 | |||||
| AVERAGE FOR | |||||
| PEO | | NON-CEO NEOs | |||
Summary Compensation Table (“SCT”) Total Compensation |
| $ | 5,472,539 | $ | 1,351,593 | |
Grant Date Fair Value of Stock Awards from SCT |
| (3,063,337) |
| (342,109) | ||
Fair Value of Equity Awards Granted in the Year and Unvested as of Year End |
| 6,324,842 |
| 528,949 | ||
Change in Fair Value of Outstanding and Unvested Equity Awards, Year Over Year |
| 2,853,593 |
| 903,672 | ||
Change in Fair Value of Equity Awards Vested, Granted in a Previous Year |
| 33,447 |
| 15,144 | ||
Compensation Actually Paid |
| $ | 11,621,084 | $ | 2,457,249 | |
Column (d). The Company’s non-CEO NEOs were as follows:
| ● | 2025: Brian A. Valentine, Weston S. Heide, Mark D. Simmons, Sarah J. Zibbel, Patrick E. Bowe and Christine M. Castellano |
| ● | 2024: Mr. Valentine, Ms. Castellano, Joseph E. McNeely and Ms. Zibbel |
| ● | 2023, 2022 and 2021: Mr. Valentine, William E. Krueger, Ms. Castellano and Mr. McNeely |
Column (f). The Company’s TSR was determined based on the value of an initial fixed investment of $100, as of December 31, 2020, including the reinvestment of any dividends.
Column (g). For the relevant fiscal year, represents the cumulative TSR of the Peer Group Index disclosed in Item 5 of the Company’s Annual Report on Form 10-K for the measurement periods ending December 31, 2025, 2024, 2023, 2022 and 2021, respectively. The Peer Group Index, weighted for market capitalization, consists of the following companies: Archer-Daniels-Midland Co., Alto Ingredients, Inc., Bunge Global SA, Darling Ingredients, Green Plains, Inc., The Mosaic Company, Nutrien Ltd., and Rex American Resources.
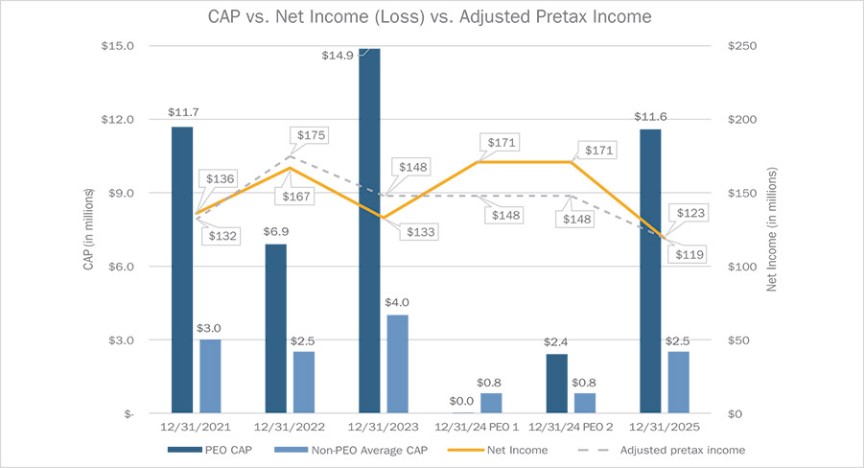
Column (h). “Net Income” is reported in the Consolidated Statements of Operations in the Company’s Annual Report on Form 10-K for each of the years ended December 31, 2025, 2024, 2023, 2022 and 2021.
Column (i). “Adjusted Pretax Income” is a non-GAAP measure that reflects “Income (loss) before income taxes” from the Company’s Consolidated Statements of Operations filed in Form 10-K, adjusted for certain items. For a reconciliation of this number to the nearest GAAP measure, see Appendix A.
| ● | 2025: Brian A. Valentine, Weston S. Heide, Mark D. Simmons, Sarah J. Zibbel, Patrick E. Bowe and Christine M. Castellano |
| ● | 2024: Mr. Valentine, Ms. Castellano, Joseph E. McNeely and Ms. Zibbel |
| ● | 2023, 2022 and 2021: Mr. Valentine, William E. Krueger, Ms. Castellano and Mr. McNeely |
| 2025 | |||||
| AVERAGE FOR | |||||
| PEO | | NON-CEO NEOs | |||
Summary Compensation Table (“SCT”) Total Compensation |
| $ | 5,472,539 | $ | 1,351,593 | |
Grant Date Fair Value of Stock Awards from SCT |
| (3,063,337) |
| (342,109) | ||
Fair Value of Equity Awards Granted in the Year and Unvested as of Year End |
| 6,324,842 |
| 528,949 | ||
Change in Fair Value of Outstanding and Unvested Equity Awards, Year Over Year |
| 2,853,593 |
| 903,672 | ||
Change in Fair Value of Equity Awards Vested, Granted in a Previous Year |
| 33,447 |
| 15,144 | ||
Compensation Actually Paid |
| $ | 11,621,084 | $ | 2,457,249 | |
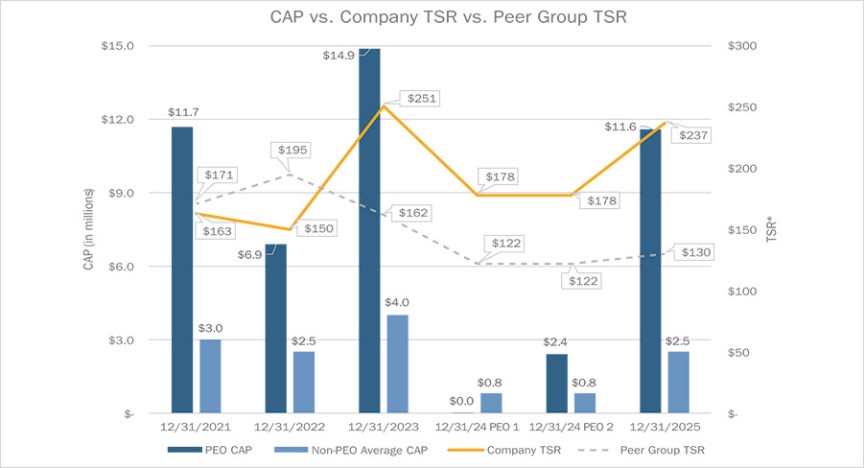
* TSR valuations are based upon a fixed value initial investment of $100 as of December 31, 2020, for determination of both peer group and Company TSR.
* TSR valuations are based upon a fixed value initial investment of $100 as of December 31, 2020, for determination of both peer group and Company TSR.
Tabular List of Performance Measures
The most important financial performance measures used to link compensation actually paid to NEOs for the most recent fiscal year to Company performance are:
2025 Most Important Measures (Unranked) | |
Adjusted Pretax Income | |
Adjusted EPS | |
Return on Invested Capital (ROIC) | |
Relative TSR | |
Net Income Attributable to the Company |