Pay vs Performance Disclosure
Dec. 28, 2025
USD ($)
$ / shares
Dec. 29, 2024
USD ($)
$ / shares
Dec. 31, 2023
USD ($)
$ / shares
Jan. 01, 2023
USD ($)
$ / shares
Jan. 02, 2022
USD ($)
$ / shares
| A | B | C | D | E | F | G | H | I | J | ||||||||||||||||||||
| Value of initial fixed $100 investment based on: | |||||||||||||||||||||||||||||
| Year | Summary compensation table total for PEO | Compensation actually paid to PEO | Average summary compensation table total for non-PEO NEOs | Average compensation actually paid to non-PEO NEOs | Total shareholder return | Peer group total shareholder return (S&P Pharmaceuticals sub index) | Peer group total shareholder return (S&P Healthcare Equipment sub index) | Net income ($ millions) | Annual relative total shareholder return (% points) | ||||||||||||||||||||
| 2025 | $32,758,111 | $68,275,237 | $12,496,583 | $25,482,495 | $151.55 | $188.57 | $126.77 | $26,804 | 24.5 | % | |||||||||||||||||||
| 2024 | 24,302,360 | 16,980,925 | 11,243,745 | 8,560,550 | 102.75 | 148.25 | 117.05 | 14,066 | (19.9) | ||||||||||||||||||||
| 2023 | 28,397,240 | 13,839,320 | 12,492,559 | 7,116,002 | 107.93 | 137.01 | 105.55 | 35,153 | (18.6) | ||||||||||||||||||||
| 2022 | 13,099,487 | 18,910,984 | 8,021,796 | 11,882,576 | 118.08 | 136.60 | 96.83 | 17,941 | 5.6 | ||||||||||||||||||||
| 2021 | 26,741,959 | 39,418,762 | 12,498,029 | 16,589,484 | 111.40 | 125.90 | 119.40 | 20,878 | (2.4) | ||||||||||||||||||||
| Executive name | PEO | Non-PEO NEO | |||||||||||||||||||||||||||||||||
| 2021 | 2022 | 2023 | 2024 | 2025 | 2021 | 2022 | 2023 | 2024 | 2025 | ||||||||||||||||||||||||||
| A. Gorsky | X | ||||||||||||||||||||||||||||||||||
| J. Duato | X | X | X | X | X | ||||||||||||||||||||||||||||||
| J. Wolk | X | X | X | X | X | ||||||||||||||||||||||||||||||
| P. Stoffels | X | ||||||||||||||||||||||||||||||||||
| J. Taubert | X | X | X | X | X | ||||||||||||||||||||||||||||||
| A. McEvoy | X | X | |||||||||||||||||||||||||||||||||
| T. Mongon | X | ||||||||||||||||||||||||||||||||||
| J. Reed | X | X | X | ||||||||||||||||||||||||||||||||
| P. Fasolo | X | ||||||||||||||||||||||||||||||||||
| T. Schmid | X | X | |||||||||||||||||||||||||||||||||
Competitor composite peer group
| Innovative Medicine | MedTech | Consumer Health (Excluded after August 2023) | ||||||
| AbbVie Inc. | Alcon, Inc. | Beiersdorf AG | ||||||
| Amgen Inc. | Bausch & Lomb Inc. | Colgate-Palmolive Co | ||||||
| AstraZeneca PLC | Boston Scientific Corporation | L'Oreal S.A. | ||||||
| Bristol-Myers Squibb Company | The Cooper Companies, Inc. | The Procter & Gamble Company | ||||||
| Eli Lilly & Company | Intuitive Surgical, Inc. | Reckitt Benckiser Group plc | ||||||
| GlaxoSmithKline plc | Medtronic plc | Unilever PLC | ||||||
| Merck & Co Inc | Smith & Nephew plc | |||||||
| Novartis AG | Stryker Corporation | |||||||
| Pfizer Inc | Zimmer Biomet Holdings, Inc | |||||||
| Roche Holding Ltd | ||||||||
| Sanofi | ||||||||
The following table shows the 2025 adjustments made to total compensation to determine the compensation actually paid:
| Executive | Summary compensation table total | Minus Summary compensation table value of equity awards | Plus pay versus performance value of equity awards | Minus Summary compensation table change in the actuarial present value of pension benefits | Plus pay versus performance value of pension benefits | Equals compensation actually paid | ||||||||||||||
| PEO | $32,758,111 | $20,956,943 | $60,816,624 | $4,874,000 | $531,445 | $68,275,237 | ||||||||||||||
| Average of Non-PEO NEOs | 12,496,583 | 7,671,954 | 22,078,121 | 1,724,000 | 303,745 | 25,482,495 | ||||||||||||||
The following table shows the 2025 amounts included in the pay versus performance value of equity awards.
| Executive | Year-end fair value of equity awards granted during applicable year | Change in fair value as of year-end of any prior-year awards that remain unvested as of year-end | Change in fair value as of the vesting date of any prior-year awards that vested during applicable year | Fair value at the end of the prior year of equity awards that failed to meet vesting conditions in the year | Pay versus performance value of equity awards | ||||||||||||
| PEO | $37,820,175 | $21,951,183 | $1,045,266 | $0 | $60,816,624 | ||||||||||||
| Average of Non-PEO NEOs | 13,845,286 | 7,758,844 | 473,991 | 0 | 22,078,121 | ||||||||||||
| Executive | Service costs attributable to the applicable year | Prior-service costs introduced during the applicable year | Pay versus performance value of pension benefits | ||||||||
| PEO | $531,445 | $0 | $531,445 | ||||||||
| Average of other NEOs | 303,745 | 0 | 303,745 | ||||||||
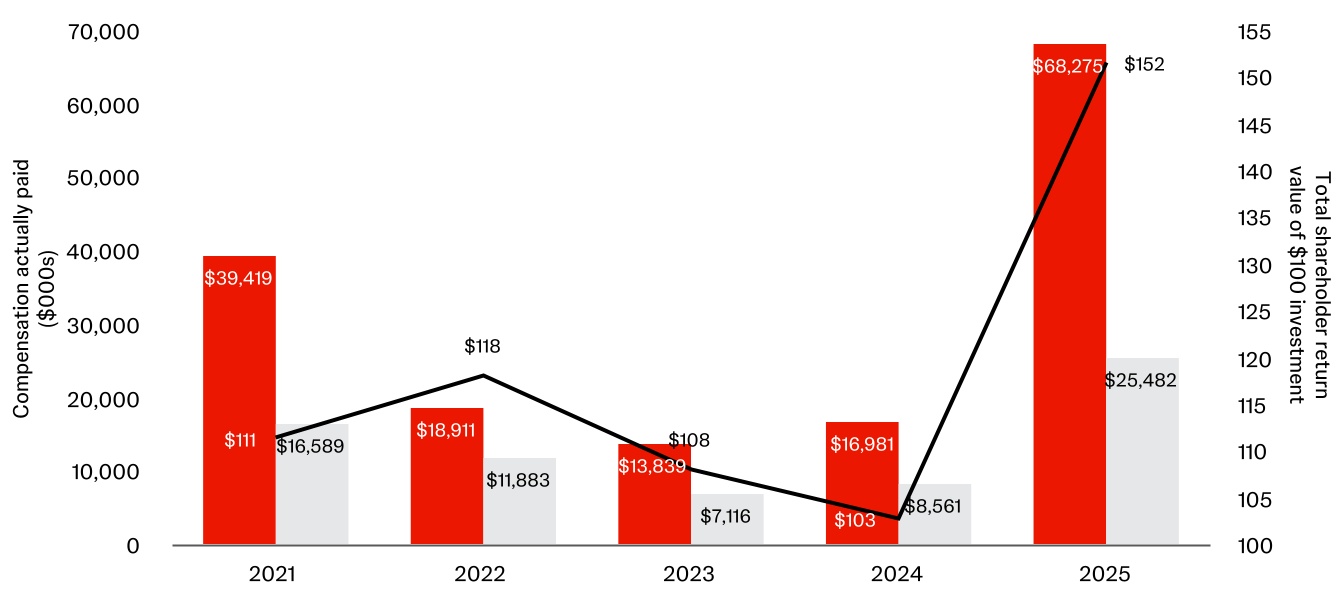
The chart below compares the compensation actually paid to our CEO and the average of our other NEOs with the Company’s cumulative TSR.
As described on page 63, our three-year TSR relative to our competitor composite peers is one of our PSU performance measures. However, the Company’s cumulative TSR without a peer comparison is not one of the performance measures we use in our annual or long-term incentive plans.
The Company’s cumulative TSR includes both our annual share price appreciation and the impact of reinvested dividends. Because most of our executives’ compensation is equity-based long-term incentives, which vary in value with the Company’s price, our CAP is aligned with the annual share price appreciation component of TSR. Dividends confound the relationship because they are included in the cumulative TSR but are not included in CAP because we do not pay dividends on unvested equity awards.
CAP vs. TSR
n | PEO CAP | n | Average for Non-PEO NEO | — | TSR | ||||||||||||
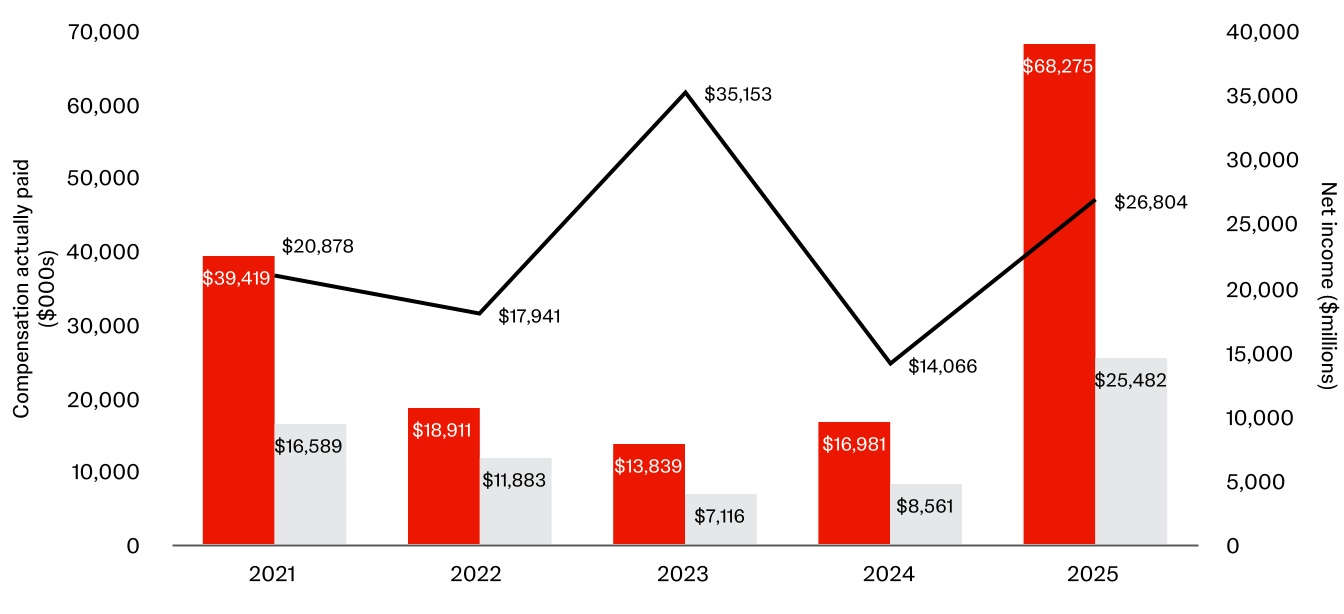
The chart on page 111 compares the compensation actually paid to our CEO and the average of our other NEOs with the Company’s net income.
As described on pages 62 and 63, adjusted operational EPS is one of our annual incentive measures and three-year cumulative adjusted operational EPS is one of our PSU performance measures. These measures are compared to goals that we set at the beginning of each year for the annual incentives and at the beginning of each three-year performance period for the PSUs.
While annual net income impacts our adjusted operational EPS and three-year cumulative adjusted operational EPS, it is not one of the performance measures we use in our annual or long-term incentive plans. Therefore, any relationship of CAP with the Company’s annual net income would be indirect at best, because it is not a performance measure in our compensation program and it is not compared to any goals.
Column I includes the Company’s net income, in millions, as reported in the Company’s audited financial statements. Net income in 2021-2023 includes the Consumer Health business, which separated from Johnson & Johnson in August 2023 as Kenvue. Net income in 2023 also includes proceeds from the sale of Kenvue. Net Income from Continuing Operations, which would have excluded this business, would have been $17.801 billion, $16.370 billion and $13.326 billion for 2021, 2022 and 2023, respectively.
CAP vs. net income
n | PEO CAP | n | Average for Non-PEO NEO | — | Net income | ||||||||||||
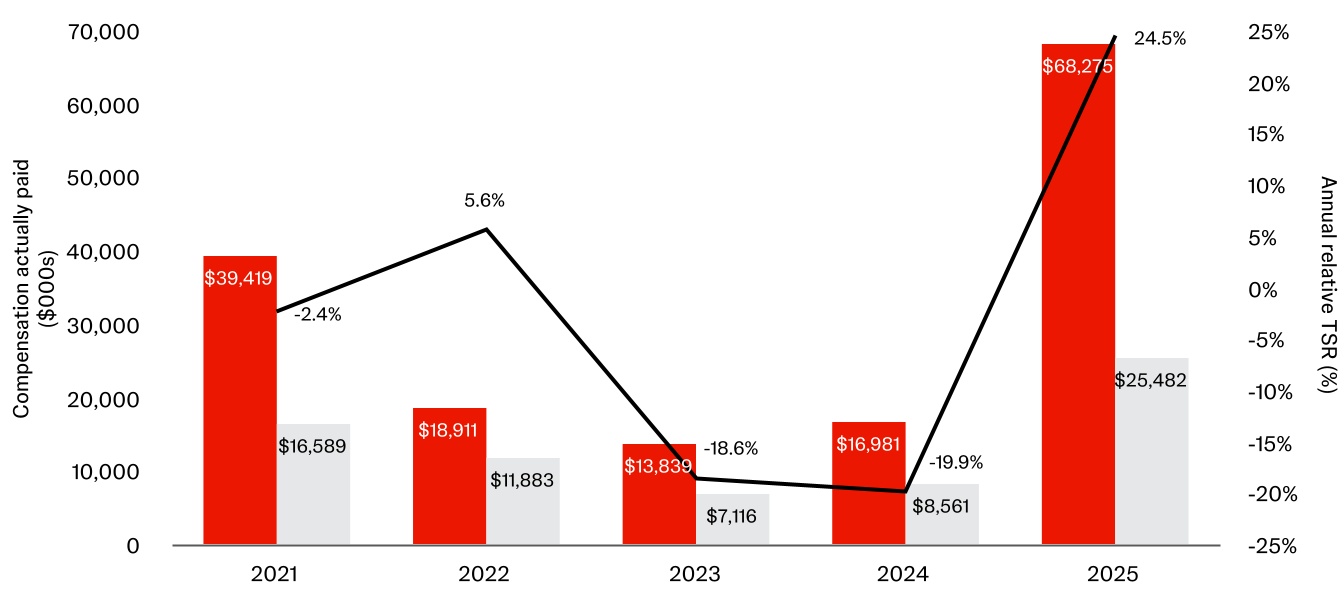
The chart on page 112 compares the compensation actually paid to our CEO and the average of our other NEOs with the Company’s annual relative TSR.
Annual relative TSR directly impacts the three overlapping PSU performance cycles that are outstanding each year. Higher annual relative TSR increases the fair value of the outstanding PSUs and, conversely, lower annual relative TSR decreases the fair value of outstanding PSUs.
Performance against our annual incentive goals, three-year cumulative adjusted operational EPS PSU goals and changes in the fair value of long-term incentive awards granted each year confound the relationship of CAP and annual relative TSR because they are independent of annual relative TSR.
Note: We use three-year relative TSR as a PSU performance measure. However, SEC guidance limits the measures to one-year periods.
CAP vs. annual relative TSR
n | PEO CAP | n | Average for Non-PEO NEO | — | Annual relative TSR | ||||||||||||
Annual relative TSR
| TSR | 2021 | 2022 | 2023 | 2024 | 2025 | ||||||||||||
| Johnson & Johnson | 12.8 | % | 8.0 | % | (8.6 | %) | (4.8 | %) | 47.5 | % | |||||||
| Competitor composite | 15.2 | 2.4 | 10.0 | 15.1 | 23.0 | ||||||||||||
| One-year relative TSR (Johnson & Johnson minus Competitor composite) | (2.4) | 5.6 | (18.6) | (19.9) | 24.5 | ||||||||||||
The TSR for each of the business groups within the competitor composite peer group is weighted based on the Company’s sales mix for the prior year as shown in the table below. Following the separation of our Consumer Health business, the Consumer Health group was removed from the Competitor composite peer group. See page 74 for additional details.
Competitor composite peer group weightings
| Business group | 2021 | 2022 | 2023 (Pre-Kenvue separation) | 2023 (Post- Kenvue separation) | 2024 | 2025 | ||||||||||||||
| Innovative Medicine | 54.7 | % | 55.1 | % | 55.4 | % | 65.7 | % | 63.8 | % | 64.1 | % | ||||||||
| MedTech | 27.8 | 28.9 | 28.9 | 34.3 | 36.2 | 35.9 | ||||||||||||||
| Consumer Health | 17.5 | 16.0 | 15.7 | 0.0 | 0.0 | 0.0 | ||||||||||||||
| Total | 100.0 | 100.0 | 100.0 | 100.0 | 100.0 | 100.0 | ||||||||||||||
Note: Sum of individual components may not reflect total weighting due to rounding.
The TSR for each business group is weighted by the beginning of year market capitalization of each company. The companies in each business group are shown in the table on page 113.
The chart below compares the Company's cumulative TSR presented in the table with the cumulative TSR of our two peer indices: the S&P Pharmaceuticals Index and the S&P Healthcare Equipment Index.
We do not use the cumulative TSR of the S&P Pharmaceuticals Index or S&P Healthcare Equipment index as incentive measures for our NEOs. However, we do measure three-year relative TSR versus our competitor composite peer group as one of our PSU metrics, as described in greater detail in Our PSU goal setting process on page 63. So, the relationship of CAP with our three-year relative TSR versus our competitor composite peer group is direct for each of the overlapping PSU performance periods shown in the table.
Cumulative TSR of the Company and peer groups
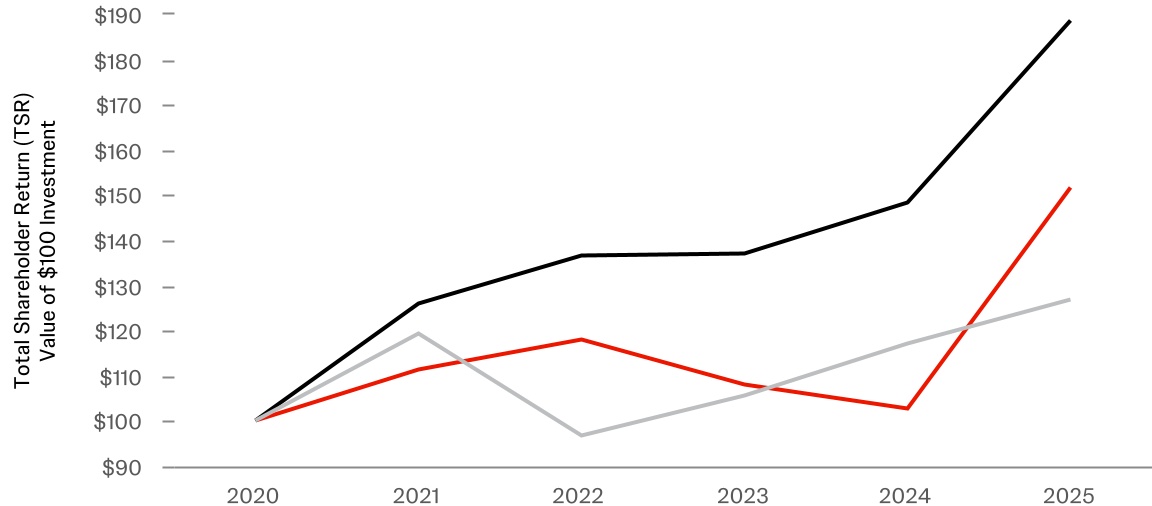
— | Company TSR | — | S&P Pharmaceuticals TSR | — | S&P Healthcare Equipment TSR | ||||||||||||
| Annual incentive financial performance measures | Long-term incentive financial performance measures | ||||
•Operational sales | •Three-year cumulative adjusted operational EPS | ||||
•Adjusted operational EPS growth | •Three-year TSR compound annual growth rate versus the competitor composite peer group | ||||
•Free cash flow | |||||
•Share price | |||||
•Share price appreciation | |||||
Total shareholder return and peer group shareholder return (columns F, G and H)
Columns F, G and H are the cumulative total shareholder return of a $100 investment from the beginning of fiscal year 2021 through the end of each of the years indicated for the Company (column F), the S&P Pharmaceuticals industry index (column G) and the S&P Healthcare Equipment industry index (column H). Total shareholder return includes share price appreciation and assumes dividend reinvestment.
Net income (column I)
Column I includes the Company’s net income, in millions, as reported in the Company’s audited financial statements. Net income in 2021-2023 includes the Consumer Health business, which separated from Johnson & Johnson in August 2023 as Kenvue. Net income in 2023 also includes proceeds from the sale of Kenvue. Net Income from Continuing Operations, which would have excluded this business, would have been $17.801 billion, $16.370 billion and $13.326 billion for 2021, 2022 and 2023, respectively.
Annual relative total shareholder return (column J)
Column J includes the percentage point difference between the Company’s and the competitor composite peer group’s TSR for each fiscal year.
We use three-year relative TSR as a PSU performance measure to link compensation actually paid to our executives to Company performance. We include one-year relative TSR in the table because it impacts the three overlapping PSU performance cycles that are outstanding each year. Furthermore, the SEC’s guidance precludes using multi-year performance measurement periods for the performance measures in the table.
Analysis of the information presented in the Pay versus performance table
We describe the relationships between compensation actually paid and the Company’s cumulative TSR, net income and annual relative TSR beginning on page 110. We also compare the Company’s cumulative TSR with the peer indices.
Changes in PEO and NEOs from 2021-2022
It is important to keep in mind that our CEO and named executive officers have changed, making year-to-year comparisons of compensation actually paid difficult. Most significant is our change in CEO. For 2021, Mr. Gorsky was our CEO (PEO in the table) and for 2022, 2023, 2024 and 2025, Mr. Duato was our CEO.
Components of compensation actually paid that vary with performance
The components of compensation actually paid that vary with performance each year are our annual incentive payouts, the fair value of long-term incentive awards granted in each year and the change in fair value of equity awards during the year.
The decisions regarding our annual incentive payouts are described in our 2022, 2023, 2024 and 2025 Proxy Statements and this Proxy Statement. The decisions regarding our long-term incentive awards are described in our 2021, 2022, 2023, 2024 and 2025 Proxy Statements.
The addition of the change in fair value of equity awards during the year is the most significant performance-related difference between CAP and the totals reported in the Summary compensation table. The change in fair value of equity awards during the year varies with our annual share price appreciation and performance against our PSU goals.
We use multiple performance measures
We use seven financial performance measures for our annual and long-term incentives. We also vary the sizes of our long-term incentive grants each year based on individual performance. Therefore, no single financial performance measure can fully describe changes in CAP, especially because most of the measures are compared to annual or three-year goals.