Shareholder Report
|
12 Months Ended |
|
Dec. 31, 2025
USD ($)
Holding
|
|---|
| Shareholder Report [Line Items] |
|
| Document Type |
N-CSR
|
| Amendment Flag |
false
|
| Registrant Name |
STATE STREET INSTITUTIONAL INVESTMENT TRUST
|
| Entity Central Index Key |
0001107414
|
| Entity Investment Company Type |
N-1A
|
| Document Period End Date |
Dec. 31, 2025
|
| Shareholder Report Annual or Semi-Annual |
Annual Shareholder Report
|
| C000136668 |
|
| Shareholder Report [Line Items] |
|
| Fund Name |
State Street Aggregate Bond Index Fund
|
| Class Name |
Class A
|
| Trading Symbol |
SSFCX
|
| Annual or Semi-Annual Statement [Text Block] |
This annual shareholder report contains important information about the State Street Aggregate Bond Index Fund (the "Fund") for the period of January 1, 2025 through December 31, 2025.
|
| Additional Information [Text Block] |
You can find additional information about the Fund, including the Prospectus, Statement of Additional Information, financial statements and other information at www.ssga.com/us/en/institutional/fund-finder?tab=documents&type=mf. You can also request this information about the Fund by contacting us at 1-800-647-7327.
|
| Additional Information Phone Number |
1-800-647-7327
|
| Additional Information Website |
www.ssga.com/us/en/institutional/fund-finder?tab=documents&type=mf
|
| Expenses [Text Block] |
What were the Fund costs for the last year? (based on a hypothetical $10,000 Investment)
Class Name |
Costs of a $10,000 investment |
Costs paid as a percentage of a $10,000 investment |
Class A |
$44 |
0.43% | The expense table reflects expenses from both the Fund and the affiliated Portfolio, in which the Fund invests. |
| Expenses Paid, Amount |
$ 44
|
| Expense Ratio, Percent |
0.43%
|
| Expenses Represent Both Master and Feeder [Text] |
The expense table reflects expenses from both the Fund and the affiliated Portfolio, in which the Fund invests.
|
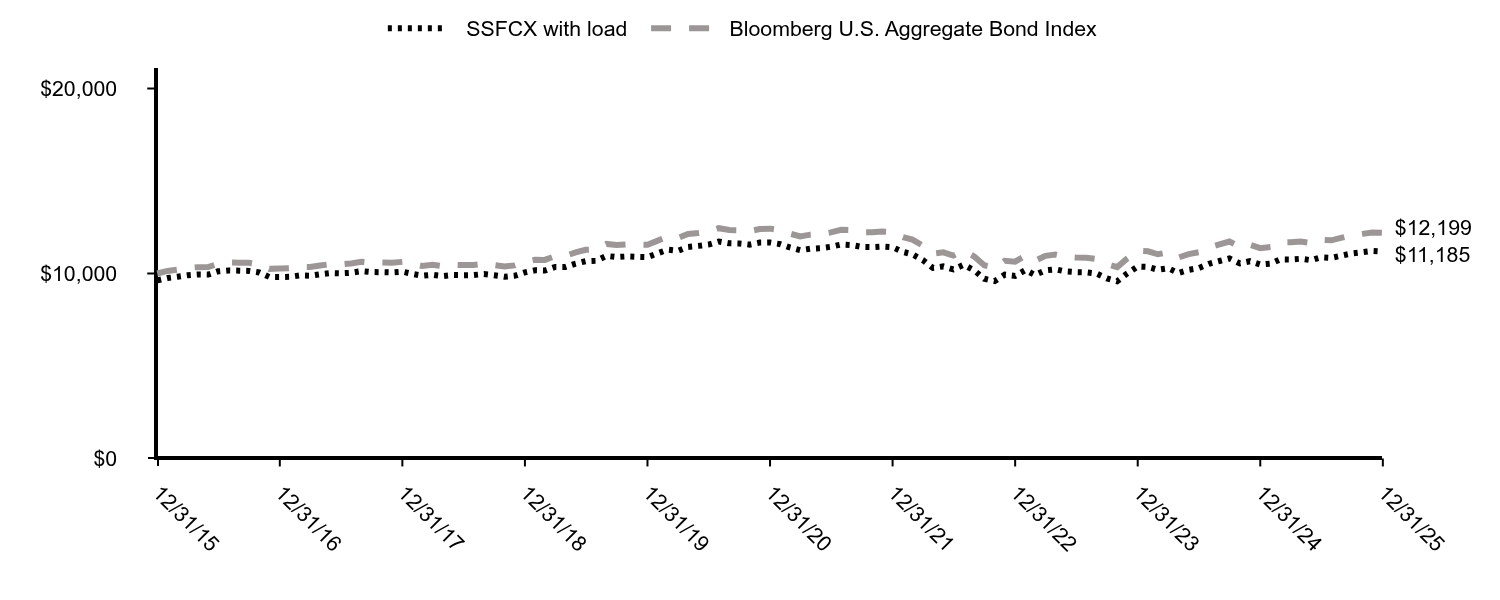
| Factors Affecting Performance [Text Block] |
How did the Fund perform last year and what affected its performance?The primary factors that affected the markets also influenced the Fund’s performance. Investors entered 2025 cautiously, as inflation concerns and policy uncertainty lingered from the prior year. During 2025, they digested tariff announcements, fiscal policy debates, and a record-breaking government shutdown, which distorted economic data. However, persistent weakness in labor market conditions eventually persuaded the U.S. Federal Reserve to deliver three rate cuts totaling 75 bps. Treasuries across the curve were volatile but tilted lower over the year, particularly the 10-year Treasury yield which declined by 40 bps. Corporate spreads remained tight due to improved corporate sentiment, supported by investor confidence that recession risk had receded and an overall emphasis on growth. |
| Performance Past Does Not Indicate Future [Text] |
The Fund’s past performance is not necessarily an indication of how the Fund will perform in the future. The returns do not reflect the deduction of taxes that a shareholder would pay on Fund distributions or on the redemption or sale of Fund shares.
|
| Line Graph [Table Text Block] |
|
SSFCX with load |
Bloomberg U.S. Aggregate Bond Index |
12/31/15 |
$9,625 |
$10,000 |
01/31/16 |
$9,753 |
$10,138 |
02/29/16 |
$9,823 |
$10,210 |
03/31/16 |
$9,906 |
$10,303 |
04/30/16 |
$9,945 |
$10,343 |
05/31/16 |
$9,940 |
$10,345 |
06/30/16 |
$10,118 |
$10,531 |
07/31/16 |
$10,165 |
$10,598 |
08/31/16 |
$10,153 |
$10,586 |
09/30/16 |
$10,139 |
$10,580 |
10/31/16 |
$10,054 |
$10,499 |
11/30/16 |
$9,810 |
$10,250 |
12/31/16 |
$9,809 |
$10,265 |
01/31/17 |
$9,819 |
$10,285 |
02/28/17 |
$9,893 |
$10,354 |
03/31/17 |
$9,877 |
$10,349 |
04/30/17 |
$9,954 |
$10,428 |
05/31/17 |
$10,020 |
$10,509 |
06/30/17 |
$10,009 |
$10,498 |
07/31/17 |
$10,038 |
$10,543 |
08/31/17 |
$10,129 |
$10,638 |
09/30/17 |
$10,077 |
$10,587 |
10/31/17 |
$10,072 |
$10,593 |
11/30/17 |
$10,061 |
$10,580 |
12/31/17 |
$10,097 |
$10,628 |
01/31/18 |
$9,973 |
$10,506 |
02/28/18 |
$9,880 |
$10,406 |
03/31/18 |
$9,929 |
$10,473 |
04/30/18 |
$9,856 |
$10,395 |
05/31/18 |
$9,918 |
$10,469 |
06/30/18 |
$9,907 |
$10,456 |
07/31/18 |
$9,916 |
$10,459 |
08/31/18 |
$9,969 |
$10,526 |
09/30/18 |
$9,906 |
$10,458 |
10/31/18 |
$9,821 |
$10,376 |
11/30/18 |
$9,876 |
$10,438 |
12/31/18 |
$10,058 |
$10,630 |
01/31/19 |
$10,173 |
$10,742 |
02/28/19 |
$10,158 |
$10,736 |
03/31/19 |
$10,354 |
$10,942 |
04/30/19 |
$10,349 |
$10,945 |
05/31/19 |
$10,535 |
$11,139 |
06/30/19 |
$10,664 |
$11,279 |
07/31/19 |
$10,683 |
$11,304 |
08/31/19 |
$10,950 |
$11,597 |
09/30/19 |
$10,887 |
$11,535 |
10/31/19 |
$10,920 |
$11,570 |
11/30/19 |
$10,898 |
$11,564 |
12/31/19 |
$10,889 |
$11,556 |
01/31/20 |
$11,094 |
$11,778 |
02/29/20 |
$11,288 |
$11,990 |
03/31/20 |
$11,222 |
$11,920 |
04/30/20 |
$11,437 |
$12,132 |
05/31/20 |
$11,492 |
$12,188 |
06/30/20 |
$11,563 |
$12,265 |
07/31/20 |
$11,730 |
$12,448 |
08/31/20 |
$11,631 |
$12,348 |
09/30/20 |
$11,619 |
$12,341 |
10/31/20 |
$11,562 |
$12,286 |
11/30/20 |
$11,669 |
$12,406 |
12/31/20 |
$11,678 |
$12,424 |
01/31/21 |
$11,585 |
$12,334 |
02/28/21 |
$11,408 |
$12,156 |
03/31/21 |
$11,256 |
$12,005 |
04/30/21 |
$11,340 |
$12,099 |
05/31/21 |
$11,372 |
$12,139 |
06/30/21 |
$11,445 |
$12,224 |
07/31/21 |
$11,569 |
$12,361 |
08/31/21 |
$11,541 |
$12,337 |
09/30/21 |
$11,435 |
$12,231 |
10/31/21 |
$11,425 |
$12,227 |
11/30/21 |
$11,454 |
$12,263 |
12/31/21 |
$11,420 |
$12,232 |
01/31/22 |
$11,167 |
$11,968 |
02/28/22 |
$11,037 |
$11,835 |
03/31/22 |
$10,725 |
$11,506 |
04/30/22 |
$10,308 |
$11,069 |
05/31/22 |
$10,382 |
$11,141 |
06/30/22 |
$10,220 |
$10,966 |
07/31/22 |
$10,471 |
$11,234 |
08/31/22 |
$10,167 |
$10,917 |
09/30/22 |
$9,719 |
$10,445 |
10/31/22 |
$9,588 |
$10,310 |
11/30/22 |
$9,939 |
$10,689 |
12/31/22 |
$9,870 |
$10,641 |
01/31/23 |
$10,185 |
$10,968 |
02/28/23 |
$9,917 |
$10,684 |
03/31/23 |
$10,169 |
$10,956 |
04/30/23 |
$10,226 |
$11,022 |
05/31/23 |
$10,110 |
$10,902 |
06/30/23 |
$10,072 |
$10,863 |
07/31/23 |
$10,062 |
$10,856 |
08/31/23 |
$9,992 |
$10,786 |
09/30/23 |
$9,736 |
$10,512 |
10/31/23 |
$9,579 |
$10,346 |
11/30/23 |
$10,006 |
$10,815 |
12/31/23 |
$10,377 |
$11,229 |
01/31/24 |
$10,352 |
$11,198 |
02/29/24 |
$10,202 |
$11,040 |
03/31/24 |
$10,285 |
$11,142 |
04/30/24 |
$10,027 |
$10,860 |
05/31/24 |
$10,194 |
$11,044 |
06/30/24 |
$10,289 |
$11,149 |
07/31/24 |
$10,527 |
$11,409 |
08/31/24 |
$10,676 |
$11,573 |
09/30/24 |
$10,817 |
$11,728 |
10/31/24 |
$10,546 |
$11,437 |
11/30/24 |
$10,663 |
$11,558 |
12/31/24 |
$10,481 |
$11,369 |
01/31/25 |
$10,532 |
$11,430 |
02/28/25 |
$10,761 |
$11,681 |
03/31/25 |
$10,758 |
$11,685 |
04/30/25 |
$10,797 |
$11,731 |
05/31/25 |
$10,719 |
$11,647 |
06/30/25 |
$10,879 |
$11,826 |
07/31/25 |
$10,847 |
$11,795 |
08/31/25 |
$10,971 |
$11,936 |
09/30/25 |
$11,088 |
$12,067 |
10/31/25 |
$11,152 |
$12,142 |
11/30/25 |
$11,218 |
$12,217 |
12/31/25 |
$11,185 |
$12,199 |
|
| Average Annual Return [Table Text Block] |
Name |
1 Year |
5 Years |
10 Years |
SSFCX |
6.72% |
(0.86%) |
1.51% |
SSFCX (Adjusted for the 3.75% Maximum Sales Charge) |
2.72% |
(1.61%) |
1.13% |
Bloomberg U.S. Aggregate Bond Index |
7.30% |
(0.36%) |
2.01% | |
| Updated Performance Information Location [Text Block] |
Updated performance information is available by calling 1-800-647-7327 or visiting our website at www.ssga.com.
|
| AssetsNet |
$ 2,981,300,464
|
| Holdings Count | Holding |
6,450
|
| Advisory Fees Paid, Amount |
$ 0
|
| InvestmentCompanyPortfolioTurnover |
17.00%
|
| Additional Fund Statistics [Text Block] |
Key Fund Statistics as of 12/31/2025- Total Net Assets$2,981,300,464
- Number of Portfolio Holdings6,450
- Portfolio Turnover Rate17%
- Total Advisory Fees Paid$0
Portfolio holdings and portfolio turnover rate are from the corresponding Portfolio, in which the Fund invests. |
| Holdings [Text Block] |
Assets |
% |
U.S. Treasury Obligations |
45.5% |
U.S. Government Agency Obligations |
25.3% |
Corporate Bonds & Notes |
23.7% |
Short-Term Investments |
4.7% |
Foreign Government Obligations |
3.1% |
Mortgage-Backed Securities |
0.4% |
Asset-Backed Securities |
0.4% |
Municipal Bonds & Notes |
0.3% |
Commercial Mortgage Backed Securities |
0.3% | |
| Largest Holdings [Text Block] |
Holdings |
% |
U.S. Treasury Notes, 4.25%, due 08/15/35 |
0.5% |
U.S. Treasury Bonds, 5.00%, due 05/15/45 |
0.4% |
U.S. Treasury Notes, 3.75%, due 06/30/27 |
0.4% |
U.S. Treasury Bonds, 4.75%, due 05/15/55 |
0.4% |
U.S. Treasury Notes, 3.88%, due 08/15/34 |
0.4% |
U.S. Treasury Notes, 4.63%, due 02/15/35 |
0.4% |
U.S. Treasury Notes, 4.00%, due 02/15/34 |
0.4% |
U.S. Treasury Notes, 4.25%, due 05/15/35 |
0.4% |
Federal Home Loan Mortgage Corp., 2.50%, due 04/01/52 |
0.4% |
U.S. Treasury Notes, 0.63%, due 08/15/30 |
0.4% | |
| Material Fund Change [Text Block] |
|
| C000136670 |
|
| Shareholder Report [Line Items] |
|
| Fund Name |
State Street Aggregate Bond Index Fund
|
| Class Name |
Class I
|
| Trading Symbol |
SSFDX
|
| Annual or Semi-Annual Statement [Text Block] |
This annual shareholder report contains important information about the State Street Aggregate Bond Index Fund (the "Fund") for the period of January 1, 2025 through December 31, 2025.
|
| Additional Information [Text Block] |
You can find additional information about the Fund, including the Prospectus, Statement of Additional Information, financial statements and other information at www.ssga.com/us/en/institutional/fund-finder?tab=documents&type=mf. You can also request this information about the Fund by contacting us at 1-800-647-7327.
|
| Additional Information Phone Number |
1-800-647-7327
|
| Additional Information Website |
www.ssga.com/us/en/institutional/fund-finder?tab=documents&type=mf
|
| Expenses [Text Block] |
What were the Fund costs for the last year? (based on a hypothetical $10,000 Investment)
Class Name |
Costs of a $10,000 investment |
Costs paid as a percentage of a $10,000 investment |
Class I |
$1 |
0.01% | The expense table reflects expenses from both the Fund and the affiliated Portfolio, in which the Fund invests. |
| Expenses Paid, Amount |
$ 1
|
| Expense Ratio, Percent |
0.01%
|
| Expenses Represent Both Master and Feeder [Text] |
The expense table reflects expenses from both the Fund and the affiliated Portfolio, in which the Fund invests.
|
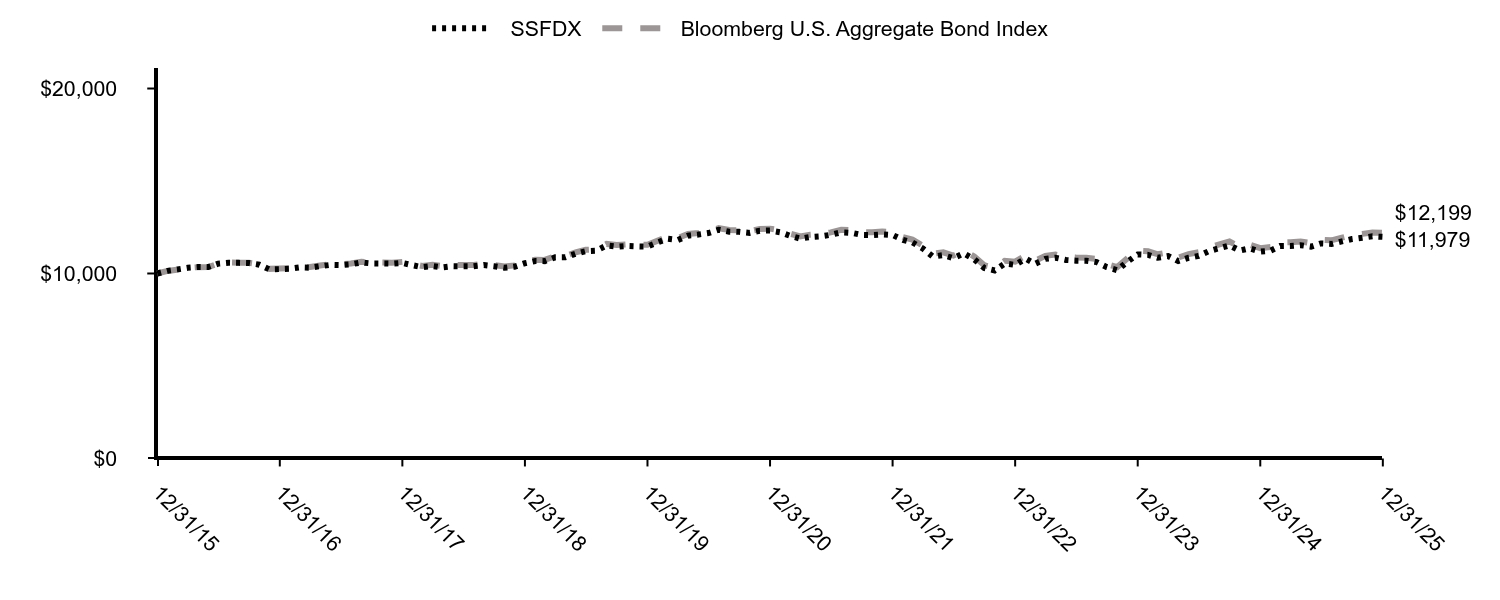
| Factors Affecting Performance [Text Block] |
How did the Fund perform last year and what affected its performance?The primary factors that affected the markets also influenced the Fund’s performance. Investors entered 2025 cautiously, as inflation concerns and policy uncertainty lingered from the prior year. During 2025, they digested tariff announcements, fiscal policy debates, and a record-breaking government shutdown, which distorted economic data. However, persistent weakness in labor market conditions eventually persuaded the U.S. Federal Reserve to deliver three rate cuts totaling 75 bps. Treasuries across the curve were volatile but tilted lower over the year, particularly the 10-year Treasury yield which declined by 40 bps. Corporate spreads remained tight due to improved corporate sentiment, supported by investor confidence that recession risk had receded and an overall emphasis on growth. |
| Performance Past Does Not Indicate Future [Text] |
The Fund’s past performance is not necessarily an indication of how the Fund will perform in the future. The returns do not reflect the deduction of taxes that a shareholder would pay on Fund distributions or on the redemption or sale of Fund shares.
|
| Line Graph [Table Text Block] |
|
SSFDX |
Bloomberg U.S. Aggregate Bond Index |
12/31/15 |
$10,000 |
$10,000 |
01/31/16 |
$10,144 |
$10,138 |
02/29/16 |
$10,219 |
$10,210 |
03/31/16 |
$10,307 |
$10,303 |
04/30/16 |
$10,349 |
$10,343 |
05/31/16 |
$10,347 |
$10,345 |
06/30/16 |
$10,534 |
$10,531 |
07/31/16 |
$10,585 |
$10,598 |
08/31/16 |
$10,575 |
$10,586 |
09/30/16 |
$10,562 |
$10,580 |
10/31/16 |
$10,476 |
$10,499 |
11/30/16 |
$10,225 |
$10,250 |
12/31/16 |
$10,237 |
$10,265 |
01/31/17 |
$10,258 |
$10,285 |
02/28/17 |
$10,327 |
$10,354 |
03/31/17 |
$10,313 |
$10,349 |
04/30/17 |
$10,395 |
$10,428 |
05/31/17 |
$10,466 |
$10,509 |
06/30/17 |
$10,457 |
$10,498 |
07/31/17 |
$10,500 |
$10,543 |
08/31/17 |
$10,597 |
$10,638 |
09/30/17 |
$10,545 |
$10,587 |
10/31/17 |
$10,542 |
$10,593 |
11/30/17 |
$10,533 |
$10,580 |
12/31/17 |
$10,574 |
$10,628 |
01/31/18 |
$10,445 |
$10,506 |
02/28/18 |
$10,339 |
$10,406 |
03/31/18 |
$10,404 |
$10,473 |
04/30/18 |
$10,329 |
$10,395 |
05/31/18 |
$10,396 |
$10,469 |
06/30/18 |
$10,387 |
$10,456 |
07/31/18 |
$10,389 |
$10,459 |
08/31/18 |
$10,457 |
$10,526 |
09/30/18 |
$10,394 |
$10,458 |
10/31/18 |
$10,308 |
$10,376 |
11/30/18 |
$10,367 |
$10,438 |
12/31/18 |
$10,553 |
$10,630 |
01/31/19 |
$10,675 |
$10,742 |
02/28/19 |
$10,667 |
$10,736 |
03/31/19 |
$10,872 |
$10,942 |
04/30/19 |
$10,875 |
$10,945 |
05/31/19 |
$11,069 |
$11,139 |
06/30/19 |
$11,208 |
$11,279 |
07/31/19 |
$11,230 |
$11,304 |
08/31/19 |
$11,514 |
$11,597 |
09/30/19 |
$11,450 |
$11,535 |
10/31/19 |
$11,488 |
$11,570 |
11/30/19 |
$11,468 |
$11,564 |
12/31/19 |
$11,455 |
$11,556 |
01/31/20 |
$11,683 |
$11,778 |
02/29/20 |
$11,879 |
$11,990 |
03/31/20 |
$11,812 |
$11,920 |
04/30/20 |
$12,046 |
$12,132 |
05/31/20 |
$12,107 |
$12,188 |
06/30/20 |
$12,185 |
$12,265 |
07/31/20 |
$12,365 |
$12,448 |
08/31/20 |
$12,262 |
$12,348 |
09/30/20 |
$12,252 |
$12,341 |
10/31/20 |
$12,195 |
$12,286 |
11/30/20 |
$12,309 |
$12,406 |
12/31/20 |
$12,323 |
$12,424 |
01/31/21 |
$12,227 |
$12,334 |
02/28/21 |
$12,042 |
$12,156 |
03/31/21 |
$11,884 |
$12,005 |
04/30/21 |
$11,975 |
$12,099 |
05/31/21 |
$12,011 |
$12,139 |
06/30/21 |
$12,092 |
$12,224 |
07/31/21 |
$12,225 |
$12,361 |
08/31/21 |
$12,198 |
$12,337 |
09/30/21 |
$12,087 |
$12,231 |
10/31/21 |
$12,080 |
$12,227 |
11/30/21 |
$12,113 |
$12,263 |
12/31/21 |
$12,079 |
$12,232 |
01/31/22 |
$11,815 |
$11,968 |
02/28/22 |
$11,680 |
$11,835 |
03/31/22 |
$11,351 |
$11,506 |
04/30/22 |
$10,912 |
$11,069 |
05/31/22 |
$10,993 |
$11,141 |
06/30/22 |
$10,823 |
$10,966 |
07/31/22 |
$11,092 |
$11,234 |
08/31/22 |
$10,771 |
$10,917 |
09/30/22 |
$10,300 |
$10,445 |
10/31/22 |
$10,164 |
$10,310 |
11/30/22 |
$10,538 |
$10,689 |
12/31/22 |
$10,465 |
$10,641 |
01/31/23 |
$10,804 |
$10,968 |
02/28/23 |
$10,521 |
$10,684 |
03/31/23 |
$10,791 |
$10,956 |
04/30/23 |
$10,853 |
$11,022 |
05/31/23 |
$10,733 |
$10,902 |
06/30/23 |
$10,693 |
$10,863 |
07/31/23 |
$10,686 |
$10,856 |
08/31/23 |
$10,614 |
$10,786 |
09/30/23 |
$10,344 |
$10,512 |
10/31/23 |
$10,178 |
$10,346 |
11/30/23 |
$10,636 |
$10,815 |
12/31/23 |
$11,030 |
$11,229 |
01/31/24 |
$11,006 |
$11,198 |
02/29/24 |
$10,849 |
$11,040 |
03/31/24 |
$10,941 |
$11,142 |
04/30/24 |
$10,668 |
$10,860 |
05/31/24 |
$10,849 |
$11,044 |
06/30/24 |
$10,952 |
$11,149 |
07/31/24 |
$11,208 |
$11,409 |
08/31/24 |
$11,368 |
$11,573 |
09/30/24 |
$11,521 |
$11,728 |
10/31/24 |
$11,236 |
$11,437 |
11/30/24 |
$11,361 |
$11,558 |
12/31/24 |
$11,180 |
$11,369 |
01/31/25 |
$11,235 |
$11,430 |
02/28/25 |
$11,482 |
$11,681 |
03/31/25 |
$11,486 |
$11,685 |
04/30/25 |
$11,531 |
$11,731 |
05/31/25 |
$11,450 |
$11,647 |
06/30/25 |
$11,626 |
$11,826 |
07/31/25 |
$11,595 |
$11,795 |
08/31/25 |
$11,733 |
$11,936 |
09/30/25 |
$11,862 |
$12,067 |
10/31/25 |
$11,935 |
$12,142 |
11/30/25 |
$12,010 |
$12,217 |
12/31/25 |
$11,979 |
$12,199 |
|
| Average Annual Return [Table Text Block] |
Name |
1 Year |
5 Years |
10 Years |
SSFDX |
7.15% |
(0.56%) |
1.82% |
Bloomberg U.S. Aggregate Bond Index |
7.30% |
(0.36%) |
2.01% | |
| Updated Performance Information Location [Text Block] |
Updated performance information is available by calling 1-800-647-7327 or visiting our website at www.ssga.com.
|
| AssetsNet |
$ 2,981,300,464
|
| Holdings Count | Holding |
6,450
|
| Advisory Fees Paid, Amount |
$ 0
|
| InvestmentCompanyPortfolioTurnover |
17.00%
|
| Additional Fund Statistics [Text Block] |
Key Fund Statistics as of 12/31/2025- Total Net Assets$2,981,300,464
- Number of Portfolio Holdings6,450
- Portfolio Turnover Rate17%
- Total Advisory Fees Paid$0
Portfolio holdings and portfolio turnover rate are from the corresponding Portfolio, in which the Fund invests. |
| Holdings [Text Block] |
Assets |
% |
U.S. Treasury Obligations |
45.5% |
U.S. Government Agency Obligations |
25.3% |
Corporate Bonds & Notes |
23.7% |
Short-Term Investments |
4.7% |
Foreign Government Obligations |
3.1% |
Mortgage-Backed Securities |
0.4% |
Asset-Backed Securities |
0.4% |
Municipal Bonds & Notes |
0.3% |
Commercial Mortgage Backed Securities |
0.3% | |
| Largest Holdings [Text Block] |
Holdings |
% |
U.S. Treasury Notes, 4.25%, due 08/15/35 |
0.5% |
U.S. Treasury Bonds, 5.00%, due 05/15/45 |
0.4% |
U.S. Treasury Notes, 3.75%, due 06/30/27 |
0.4% |
U.S. Treasury Bonds, 4.75%, due 05/15/55 |
0.4% |
U.S. Treasury Notes, 3.88%, due 08/15/34 |
0.4% |
U.S. Treasury Notes, 4.63%, due 02/15/35 |
0.4% |
U.S. Treasury Notes, 4.00%, due 02/15/34 |
0.4% |
U.S. Treasury Notes, 4.25%, due 05/15/35 |
0.4% |
Federal Home Loan Mortgage Corp., 2.50%, due 04/01/52 |
0.4% |
U.S. Treasury Notes, 0.63%, due 08/15/30 |
0.4% | |
| Material Fund Change [Text Block] |
|
| C000136669 |
|
| Shareholder Report [Line Items] |
|
| Fund Name |
State Street Aggregate Bond Index Fund
|
| Class Name |
Class K
|
| Trading Symbol |
SSFEX
|
| Annual or Semi-Annual Statement [Text Block] |
This annual shareholder report contains important information about the State Street Aggregate Bond Index Fund (the "Fund") for the period of January 1, 2025 through December 31, 2025.
|
| Additional Information [Text Block] |
You can find additional information about the Fund, including the Prospectus, Statement of Additional Information, financial statements and other information at www.ssga.com/us/en/institutional/fund-finder?tab=documents&type=mf. You can also request this information about the Fund by contacting us at 1-800-647-7327.
|
| Additional Information Phone Number |
1-800-647-7327
|
| Additional Information Website |
www.ssga.com/us/en/institutional/fund-finder?tab=documents&type=mf
|
| Expenses [Text Block] |
What were the Fund costs for the last year? (based on a hypothetical $10,000 Investment)
Class Name |
Costs of a $10,000 investment |
Costs paid as a percentage of a $10,000 investment |
Class K |
$0 |
0.00% | The expense table reflects expenses from both the Fund and the affiliated Portfolio, in which the Fund invests. |
| Expenses Paid, Amount |
$ 0
|
| Expense Ratio, Percent |
0.00%
|
| Expenses Represent Both Master and Feeder [Text] |
The expense table reflects expenses from both the Fund and the affiliated Portfolio, in which the Fund invests.
|
| Factors Affecting Performance [Text Block] |
How did the Fund perform last year and what affected its performance?The primary factors that affected the markets also influenced the Fund’s performance. Investors entered 2025 cautiously, as inflation concerns and policy uncertainty lingered from the prior year. During 2025, they digested tariff announcements, fiscal policy debates, and a record-breaking government shutdown, which distorted economic data. However, persistent weakness in labor market conditions eventually persuaded the U.S. Federal Reserve to deliver three rate cuts totaling 75 bps. Treasuries across the curve were volatile but tilted lower over the year, particularly the 10-year Treasury yield which declined by 40 bps. Corporate spreads remained tight due to improved corporate sentiment, supported by investor confidence that recession risk had receded and an overall emphasis on growth. |
| Performance Past Does Not Indicate Future [Text] |
The Fund’s past performance is not necessarily an indication of how the Fund will perform in the future. The returns do not reflect the deduction of taxes that a shareholder would pay on Fund distributions or on the redemption or sale of Fund shares.
|
| Line Graph [Table Text Block] |

|
SSFEX |
Bloomberg U.S. Aggregate Bond Index |
12/31/15 |
$10,000 |
$10,000 |
01/31/16 |
$10,133 |
$10,138 |
02/29/16 |
$10,208 |
$10,210 |
03/31/16 |
$10,307 |
$10,303 |
04/30/16 |
$10,339 |
$10,343 |
05/31/16 |
$10,347 |
$10,345 |
06/30/16 |
$10,524 |
$10,531 |
07/31/16 |
$10,575 |
$10,598 |
08/31/16 |
$10,565 |
$10,586 |
09/30/16 |
$10,552 |
$10,580 |
10/31/16 |
$10,466 |
$10,499 |
11/30/16 |
$10,225 |
$10,250 |
12/31/16 |
$10,227 |
$10,265 |
01/31/17 |
$10,248 |
$10,285 |
02/28/17 |
$10,317 |
$10,354 |
03/31/17 |
$10,302 |
$10,349 |
04/30/17 |
$10,385 |
$10,428 |
05/31/17 |
$10,456 |
$10,509 |
06/30/17 |
$10,447 |
$10,498 |
07/31/17 |
$10,489 |
$10,543 |
08/31/17 |
$10,586 |
$10,638 |
09/30/17 |
$10,534 |
$10,587 |
10/31/17 |
$10,531 |
$10,593 |
11/30/17 |
$10,523 |
$10,580 |
12/31/17 |
$10,564 |
$10,628 |
01/31/18 |
$10,446 |
$10,506 |
02/28/18 |
$10,339 |
$10,406 |
03/31/18 |
$10,404 |
$10,473 |
04/30/18 |
$10,319 |
$10,395 |
05/31/18 |
$10,396 |
$10,469 |
06/30/18 |
$10,387 |
$10,456 |
07/31/18 |
$10,389 |
$10,459 |
08/31/18 |
$10,457 |
$10,526 |
09/30/18 |
$10,383 |
$10,458 |
10/31/18 |
$10,297 |
$10,376 |
11/30/18 |
$10,357 |
$10,438 |
12/31/18 |
$10,554 |
$10,630 |
01/31/19 |
$10,675 |
$10,742 |
02/28/19 |
$10,668 |
$10,736 |
03/31/19 |
$10,861 |
$10,942 |
04/30/19 |
$10,864 |
$10,945 |
05/31/19 |
$11,058 |
$11,139 |
06/30/19 |
$11,197 |
$11,279 |
07/31/19 |
$11,220 |
$11,304 |
08/31/19 |
$11,514 |
$11,597 |
09/30/19 |
$11,451 |
$11,535 |
10/31/19 |
$11,489 |
$11,570 |
11/30/19 |
$11,470 |
$11,564 |
12/31/19 |
$11,459 |
$11,556 |
01/31/20 |
$11,686 |
$11,778 |
02/29/20 |
$11,896 |
$11,990 |
03/31/20 |
$11,832 |
$11,920 |
04/30/20 |
$12,059 |
$12,132 |
05/31/20 |
$12,121 |
$12,188 |
06/30/20 |
$12,200 |
$12,265 |
07/31/20 |
$12,383 |
$12,448 |
08/31/20 |
$12,283 |
$12,348 |
09/30/20 |
$12,275 |
$12,341 |
10/31/20 |
$12,219 |
$12,286 |
11/30/20 |
$12,335 |
$12,406 |
12/31/20 |
$12,351 |
$12,424 |
01/31/21 |
$12,257 |
$12,334 |
02/28/21 |
$12,074 |
$12,156 |
03/31/21 |
$11,918 |
$12,005 |
04/30/21 |
$12,011 |
$12,099 |
05/31/21 |
$12,049 |
$12,139 |
06/30/21 |
$12,132 |
$12,224 |
07/31/21 |
$12,268 |
$12,361 |
08/31/21 |
$12,243 |
$12,337 |
09/30/21 |
$12,135 |
$12,231 |
10/31/21 |
$12,128 |
$12,227 |
11/30/21 |
$12,163 |
$12,263 |
12/31/21 |
$12,132 |
$12,232 |
01/31/22 |
$11,868 |
$11,968 |
02/28/22 |
$11,734 |
$11,835 |
03/31/22 |
$11,406 |
$11,506 |
04/30/22 |
$10,967 |
$11,069 |
05/31/22 |
$11,050 |
$11,141 |
06/30/22 |
$10,881 |
$10,966 |
07/31/22 |
$11,154 |
$11,234 |
08/31/22 |
$10,834 |
$10,917 |
09/30/22 |
$10,361 |
$10,445 |
10/31/22 |
$10,225 |
$10,310 |
11/30/22 |
$10,604 |
$10,689 |
12/31/22 |
$10,532 |
$10,641 |
01/31/23 |
$10,873 |
$10,968 |
02/28/23 |
$10,591 |
$10,684 |
03/31/23 |
$10,865 |
$10,956 |
04/30/23 |
$10,929 |
$11,022 |
05/31/23 |
$10,810 |
$10,902 |
06/30/23 |
$10,773 |
$10,863 |
07/31/23 |
$10,766 |
$10,856 |
08/31/23 |
$10,695 |
$10,786 |
09/30/23 |
$10,425 |
$10,512 |
10/31/23 |
$10,260 |
$10,346 |
11/30/23 |
$10,722 |
$10,815 |
12/31/23 |
$11,123 |
$11,229 |
01/31/24 |
$11,101 |
$11,198 |
02/29/24 |
$10,944 |
$11,040 |
03/31/24 |
$11,039 |
$11,142 |
04/30/24 |
$10,765 |
$10,860 |
05/31/24 |
$10,949 |
$11,044 |
06/30/24 |
$11,052 |
$11,149 |
07/31/24 |
$11,310 |
$11,409 |
08/31/24 |
$11,471 |
$11,573 |
09/30/24 |
$11,627 |
$11,728 |
10/31/24 |
$11,339 |
$11,437 |
11/30/24 |
$11,465 |
$11,558 |
12/31/24 |
$11,273 |
$11,369 |
01/31/25 |
$11,329 |
$11,430 |
02/28/25 |
$11,577 |
$11,681 |
03/31/25 |
$11,582 |
$11,685 |
04/30/25 |
$11,626 |
$11,731 |
05/31/25 |
$11,545 |
$11,647 |
06/30/25 |
$11,723 |
$11,826 |
07/31/25 |
$11,693 |
$11,795 |
08/31/25 |
$11,830 |
$11,936 |
09/30/25 |
$11,960 |
$12,067 |
10/31/25 |
$12,033 |
$12,142 |
11/30/25 |
$12,109 |
$12,217 |
12/31/25 |
$12,079 |
$12,199 |
|
| Average Annual Return [Table Text Block] |
Name |
1 Year |
5 Years |
10 Years |
SSFEX |
7.15% |
(0.44%) |
1.91% |
Bloomberg U.S. Aggregate Bond Index |
7.30% |
(0.36%) |
2.01% | |
| Updated Performance Information Location [Text Block] |
Updated performance information is available by calling 1-800-647-7327 or visiting our website at www.ssga.com.
|
| AssetsNet |
$ 2,981,300,464
|
| Holdings Count | Holding |
6,450
|
| Advisory Fees Paid, Amount |
$ 0
|
| InvestmentCompanyPortfolioTurnover |
17.00%
|
| Additional Fund Statistics [Text Block] |
Key Fund Statistics as of 12/31/2025- Total Net Assets$2,981,300,464
- Number of Portfolio Holdings6,450
- Portfolio Turnover Rate17%
- Total Advisory Fees Paid$0
Portfolio holdings and portfolio turnover rate are from the corresponding Portfolio, in which the Fund invests. |
| Holdings [Text Block] |
Assets |
% |
U.S. Treasury Obligations |
45.5% |
U.S. Government Agency Obligations |
25.3% |
Corporate Bonds & Notes |
23.7% |
Short-Term Investments |
4.7% |
Foreign Government Obligations |
3.1% |
Mortgage-Backed Securities |
0.4% |
Asset-Backed Securities |
0.4% |
Municipal Bonds & Notes |
0.3% |
Commercial Mortgage Backed Securities |
0.3% | |
| Largest Holdings [Text Block] |
Holdings |
% |
U.S. Treasury Notes, 4.25%, due 08/15/35 |
0.5% |
U.S. Treasury Bonds, 5.00%, due 05/15/45 |
0.4% |
U.S. Treasury Notes, 3.75%, due 06/30/27 |
0.4% |
U.S. Treasury Bonds, 4.75%, due 05/15/55 |
0.4% |
U.S. Treasury Notes, 3.88%, due 08/15/34 |
0.4% |
U.S. Treasury Notes, 4.63%, due 02/15/35 |
0.4% |
U.S. Treasury Notes, 4.00%, due 02/15/34 |
0.4% |
U.S. Treasury Notes, 4.25%, due 05/15/35 |
0.4% |
Federal Home Loan Mortgage Corp., 2.50%, due 04/01/52 |
0.4% |
U.S. Treasury Notes, 0.63%, due 08/15/30 |
0.4% | |
| Material Fund Change [Text Block] |
|
| C000143852 |
|
| Shareholder Report [Line Items] |
|
| Fund Name |
State Street Aggregate Bond Index Portfolio
|
| Trading Symbol |
SSAFX
|
| Annual or Semi-Annual Statement [Text Block] |
This annual shareholder report contains important information about the State Street Aggregate Bond Index Portfolio (the "Fund") for the period of January 1, 2025 through December 31, 2025.
|
| Additional Information [Text Block] |
You can find additional information about the Fund, including the Prospectus, Statement of Additional Information, financial statements and other information at www.ssga.com/us/en/institutional/resources/master-portfolio-fund-documents. You can also request this information about the Fund by contacting us at 1-800-647-7327.
|
| Additional Information Phone Number |
1-800-647-7327
|
| Additional Information Website |
www.ssga.com/us/en/institutional/resources/master-portfolio-fund-documents
|
| Expenses [Text Block] |
What were the Fund costs for the last year? (based on a hypothetical $10,000 Investment)
Fund Name |
Costs of a $10,000 investment |
Costs paid as a percentage of a $10,000 investment |
State Street Aggregate Bond Index Portfolio |
$2 |
0.02% | |
| Expenses Paid, Amount |
$ 2
|
| Expense Ratio, Percent |
0.02%
|
| Factors Affecting Performance [Text Block] |
How did the Fund perform last year and what affected its performance?The primary factors that affected the markets also influenced the Fund’s performance. Investors entered 2025 cautiously, as inflation concerns and policy uncertainty lingered from the prior year. During 2025, they digested tariff announcements, fiscal policy debates, and a record-breaking government shutdown, which distorted economic data. However, persistent weakness in labor market conditions eventually persuaded the U.S. Federal Reserve to deliver three rate cuts totaling 75 bps. Treasuries across the curve were volatile but tilted lower over the year, particularly the 10-year Treasury yield which declined by 40 bps. Corporate spreads remained tight due to improved corporate sentiment, supported by investor confidence that recession risk had receded and an overall emphasis on growth. |
| Performance Past Does Not Indicate Future [Text] |
The Fund’s past performance is not necessarily an indication of how the Fund will perform in the future. The returns do not reflect the deduction of taxes that a shareholder would pay on Fund distributions or on the redemption or sale of Fund shares.
|
| Line Graph [Table Text Block] |

|
SSAFX |
Bloomberg U.S. Aggregate Bond Index |
12/31/15 |
$10,000 |
$10,000 |
01/31/16 |
$10,136 |
$10,138 |
02/29/16 |
$10,213 |
$10,210 |
03/31/16 |
$10,306 |
$10,303 |
04/30/16 |
$10,345 |
$10,343 |
05/31/16 |
$10,347 |
$10,345 |
06/30/16 |
$10,531 |
$10,531 |
07/31/16 |
$10,583 |
$10,598 |
08/31/16 |
$10,571 |
$10,586 |
09/30/16 |
$10,559 |
$10,580 |
10/31/16 |
$10,477 |
$10,499 |
11/30/16 |
$10,228 |
$10,250 |
12/31/16 |
$10,239 |
$10,265 |
01/31/17 |
$10,256 |
$10,285 |
02/28/17 |
$10,325 |
$10,354 |
03/31/17 |
$10,313 |
$10,349 |
04/30/17 |
$10,395 |
$10,428 |
05/31/17 |
$10,470 |
$10,509 |
06/30/17 |
$10,460 |
$10,498 |
07/31/17 |
$10,504 |
$10,543 |
08/31/17 |
$10,600 |
$10,638 |
09/30/17 |
$10,546 |
$10,587 |
10/31/17 |
$10,549 |
$10,593 |
11/30/17 |
$10,540 |
$10,580 |
12/31/17 |
$10,585 |
$10,628 |
01/31/18 |
$10,458 |
$10,506 |
02/28/18 |
$10,354 |
$10,406 |
03/31/18 |
$10,419 |
$10,473 |
04/30/18 |
$10,335 |
$10,395 |
05/31/18 |
$10,412 |
$10,469 |
06/30/18 |
$10,405 |
$10,456 |
07/31/18 |
$10,407 |
$10,459 |
08/31/18 |
$10,475 |
$10,526 |
09/30/18 |
$10,403 |
$10,458 |
10/31/18 |
$10,319 |
$10,376 |
11/30/18 |
$10,378 |
$10,438 |
12/31/18 |
$10,573 |
$10,630 |
01/31/19 |
$10,692 |
$10,742 |
02/28/19 |
$10,686 |
$10,736 |
03/31/19 |
$10,887 |
$10,942 |
04/30/19 |
$10,891 |
$10,945 |
05/31/19 |
$11,083 |
$11,139 |
06/30/19 |
$11,220 |
$11,279 |
07/31/19 |
$11,248 |
$11,304 |
08/31/19 |
$11,540 |
$11,597 |
09/30/19 |
$11,479 |
$11,535 |
10/31/19 |
$11,517 |
$11,570 |
11/30/19 |
$11,499 |
$11,564 |
12/31/19 |
$11,491 |
$11,556 |
01/31/20 |
$11,716 |
$11,778 |
02/29/20 |
$11,924 |
$11,990 |
03/31/20 |
$11,860 |
$11,920 |
04/30/20 |
$12,093 |
$12,132 |
05/31/20 |
$12,157 |
$12,188 |
06/30/20 |
$12,236 |
$12,265 |
07/31/20 |
$12,419 |
$12,448 |
08/31/20 |
$12,319 |
$12,348 |
09/30/20 |
$12,312 |
$12,341 |
10/31/20 |
$12,256 |
$12,286 |
11/30/20 |
$12,379 |
$12,406 |
12/31/20 |
$12,394 |
$12,424 |
01/31/21 |
$12,302 |
$12,334 |
02/28/21 |
$12,116 |
$12,156 |
03/31/21 |
$11,964 |
$12,005 |
04/30/21 |
$12,057 |
$12,099 |
05/31/21 |
$12,096 |
$12,139 |
06/30/21 |
$12,180 |
$12,224 |
07/31/21 |
$12,316 |
$12,361 |
08/31/21 |
$12,292 |
$12,337 |
09/30/21 |
$12,183 |
$12,231 |
10/31/21 |
$12,177 |
$12,227 |
11/30/21 |
$12,212 |
$12,263 |
12/31/21 |
$12,181 |
$12,232 |
01/31/22 |
$11,917 |
$11,968 |
02/28/22 |
$11,782 |
$11,835 |
03/31/22 |
$11,453 |
$11,506 |
04/30/22 |
$11,011 |
$11,069 |
05/31/22 |
$11,086 |
$11,141 |
06/30/22 |
$10,907 |
$10,966 |
07/31/22 |
$11,181 |
$11,234 |
08/31/22 |
$10,860 |
$10,917 |
09/30/22 |
$10,386 |
$10,445 |
10/31/22 |
$10,251 |
$10,310 |
11/30/22 |
$10,629 |
$10,689 |
12/31/22 |
$10,560 |
$10,641 |
01/31/23 |
$10,903 |
$10,968 |
02/28/23 |
$10,620 |
$10,684 |
03/31/23 |
$10,894 |
$10,956 |
04/30/23 |
$10,958 |
$11,022 |
05/31/23 |
$10,839 |
$10,902 |
06/30/23 |
$10,801 |
$10,863 |
07/31/23 |
$10,795 |
$10,856 |
08/31/23 |
$10,724 |
$10,786 |
09/30/23 |
$10,453 |
$10,512 |
10/31/23 |
$10,288 |
$10,346 |
11/30/23 |
$10,751 |
$10,815 |
12/31/23 |
$11,153 |
$11,229 |
01/31/24 |
$11,130 |
$11,198 |
02/29/24 |
$10,973 |
$11,040 |
03/31/24 |
$11,067 |
$11,142 |
04/30/24 |
$10,794 |
$10,860 |
05/31/24 |
$10,978 |
$11,044 |
06/30/24 |
$11,082 |
$11,149 |
07/31/24 |
$11,340 |
$11,409 |
08/31/24 |
$11,502 |
$11,573 |
09/30/24 |
$11,658 |
$11,728 |
10/31/24 |
$11,368 |
$11,437 |
11/30/24 |
$11,496 |
$11,558 |
12/31/24 |
$11,302 |
$11,369 |
01/31/25 |
$11,359 |
$11,430 |
02/28/25 |
$11,608 |
$11,681 |
03/31/25 |
$11,612 |
$11,685 |
04/30/25 |
$11,658 |
$11,731 |
05/31/25 |
$11,576 |
$11,647 |
06/30/25 |
$11,754 |
$11,826 |
07/31/25 |
$11,723 |
$11,795 |
08/31/25 |
$11,862 |
$11,936 |
09/30/25 |
$11,992 |
$12,067 |
10/31/25 |
$12,066 |
$12,142 |
11/30/25 |
$12,142 |
$12,217 |
12/31/25 |
$12,112 |
$12,199 |
|
| Average Annual Return [Table Text Block] |
Name |
1 Year |
5 Years |
10 Years |
SSAFX |
7.17% |
(0.46%) |
1.93% |
Bloomberg U.S. Aggregate Bond Index |
7.30% |
(0.36%) |
2.01% | |
| Updated Performance Information Location [Text Block] |
Updated performance information is available by calling 1-800-647-7327 or visiting our website at www.ssga.com.
|
| AssetsNet |
$ 5,875,808,804
|
| Holdings Count | Holding |
6,450
|
| Advisory Fees Paid, Amount |
$ 0
|
| InvestmentCompanyPortfolioTurnover |
17.00%
|
| Additional Fund Statistics [Text Block] |
Key Fund Statistics as of 12/31/2025- Total Net Assets$5,875,808,804
- Number of Portfolio Holdings6,450
- Portfolio Turnover Rate17%
- Total Advisory Fees Paid$0
|
| Holdings [Text Block] |
Assets |
% |
U.S. Treasury Obligations |
45.5% |
U.S. Government Agency Obligations |
25.3% |
Corporate Bonds & Notes |
23.7% |
Short-Term Investments |
4.7% |
Foreign Government Obligations |
3.1% |
Mortgage-Backed Securities |
0.4% |
Asset-Backed Securities |
0.4% |
Municipal Bonds & Notes |
0.3% |
Commercial Mortgage Backed Securities |
0.3% | |
| Largest Holdings [Text Block] |
Holdings |
% |
U.S. Treasury Notes, 4.25%, due 08/15/35 |
0.5% |
U.S. Treasury Bonds, 5.00%, due 05/15/45 |
0.4% |
U.S. Treasury Notes, 3.75%, due 06/30/27 |
0.4% |
U.S. Treasury Bonds, 4.75%, due 05/15/55 |
0.4% |
U.S. Treasury Notes, 3.88%, due 08/15/34 |
0.4% |
U.S. Treasury Notes, 4.63%, due 02/15/35 |
0.4% |
U.S. Treasury Notes, 4.00%, due 02/15/34 |
0.4% |
U.S. Treasury Notes, 4.25%, due 05/15/35 |
0.4% |
Federal Home Loan Mortgage Corp., 2.50%, due 04/01/52 |
0.4% |
U.S. Treasury Notes, 0.63%, due 08/15/30 |
0.4% | |
| Material Fund Change [Text Block] |
|
| C000246124 |
|
| Shareholder Report [Line Items] |
|
| Fund Name |
State Street Balanced Index Fund
|
| Class Name |
Class K
|
| Trading Symbol |
SSBIX
|
| Annual or Semi-Annual Statement [Text Block] |
This annual shareholder report contains important information about the State Street Balanced Index Fund (the "Fund") for the period of January 1, 2025 through December 31, 2025.
|
| Additional Information [Text Block] |
You can find additional information about the Fund, including the Prospectus, Statement of Additional Information, financial statements and other information at www.ssga.com/us/en/institutional/fund-finder?tab=documents&type=mf. You can also request this information about the Fund by contacting us at 1-800-647-7327.
|
| Additional Information Phone Number |
1-800-647-7327
|
| Additional Information Website |
www.ssga.com/us/en/institutional/fund-finder?tab=documents&type=mf
|
| Expenses [Text Block] |
What were the Fund costs for the last year? (based on a hypothetical $10,000 Investment)
Class Name |
Costs of a $10,000 investment |
Costs paid as a percentage of a $10,000 investment |
Class K |
$4 |
0.04% | |
| Expenses Paid, Amount |
$ 4
|
| Expense Ratio, Percent |
0.04%
|
| Factors Affecting Performance [Text Block] |
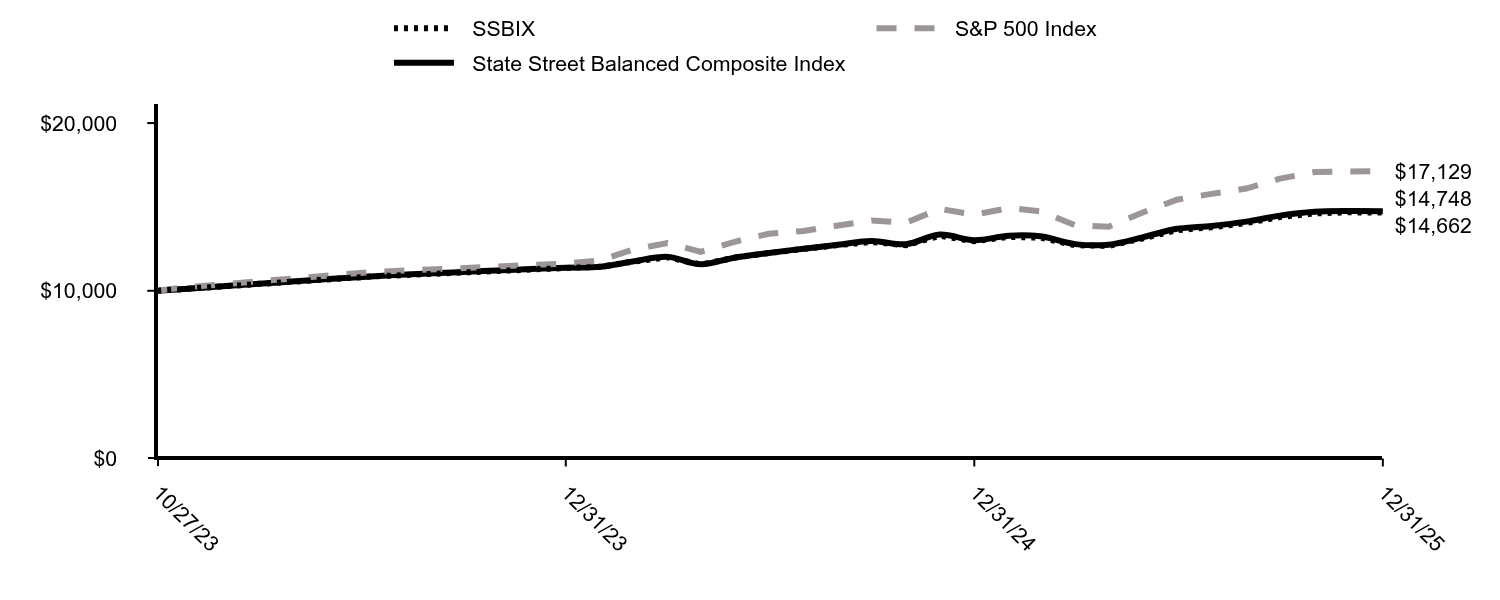
How did the Fund perform last year and what affected its performance?The drivers of the Fund’s absolute performance were its positions in the Dow Jones U.S. Total Stock Market Index and the Bloomberg U.S. Aggregate Bond Index, both posted positive returns for the year. The main driver of the Fund’s absolute performance was its position in the Dow Jones U.S. Total Stock Market Index which returned 17.05% for the reporting period. The Fund used equity futures in order to actively manage equity exposure and during the reporting period. The Fund’s use of these derivatives contributed to Fund liquidity versus utilizing cash instruments only. |
| Performance Past Does Not Indicate Future [Text] |
The Fund’s past performance is not necessarily an indication of how the Fund will perform in the future. The returns do not reflect the deduction of taxes that a shareholder would pay on Fund distributions or on the redemption or sale of Fund shares.
|
| Line Graph [Table Text Block] |
|
SSBIX |
S&P 500 Index |
State Street Balanced Composite Index |
10/27/23 |
$10,000 |
$10,000 |
$10,000 |
10/31/23 |
$10,100 |
$10,187 |
$10,099 |
11/30/23 |
$10,850 |
$11,118 |
$10,853 |
12/31/23 |
$11,359 |
$11,623 |
$11,371 |
01/31/24 |
$11,430 |
$11,818 |
$11,433 |
02/29/24 |
$11,731 |
$12,449 |
$11,744 |
03/31/24 |
$12,002 |
$12,850 |
$12,021 |
04/30/24 |
$11,570 |
$12,325 |
$11,581 |
05/31/24 |
$11,982 |
$12,936 |
$11,988 |
06/30/24 |
$12,254 |
$13,400 |
$12,257 |
07/31/24 |
$12,495 |
$13,563 |
$12,507 |
08/31/24 |
$12,726 |
$13,892 |
$12,740 |
09/30/24 |
$12,907 |
$14,189 |
$12,965 |
10/31/24 |
$12,716 |
$14,060 |
$12,781 |
11/30/24 |
$13,279 |
$14,885 |
$13,349 |
12/31/24 |
$12,949 |
$14,531 |
$13,017 |
01/31/25 |
$13,211 |
$14,935 |
$13,284 |
02/28/25 |
$13,171 |
$14,740 |
$13,247 |
03/31/25 |
$12,716 |
$13,910 |
$12,782 |
04/30/25 |
$12,676 |
$13,816 |
$12,749 |
05/31/25 |
$13,131 |
$14,685 |
$13,200 |
06/30/25 |
$13,616 |
$15,432 |
$13,694 |
07/31/25 |
$13,788 |
$15,778 |
$13,867 |
08/31/25 |
$14,040 |
$16,098 |
$14,123 |
09/30/25 |
$14,394 |
$16,686 |
$14,480 |
10/31/25 |
$14,617 |
$17,076 |
$14,707 |
11/30/25 |
$14,677 |
$17,118 |
$14,757 |
12/31/25 |
$14,662 |
$17,129 |
$14,748 |
|
| Average Annual Return [Table Text Block] |
Name |
1 Year |
Since Inception 10/27/23 |
SSBIX |
13.23% |
19.21% |
S&P 500 Index |
17.88% |
28.03% |
State Street Balanced Composite Index |
13.30% |
19.53% | |
| Performance Inception Date |
Oct. 27, 2023
|
| Updated Performance Information Location [Text Block] |
Updated performance information is available by calling 1-800-647-7327 or visiting our website at www.ssga.com.
|
| AssetsNet |
$ 606,709,920
|
| Holdings Count | Holding |
2,493
|
| Advisory Fees Paid, Amount |
$ 0
|
| InvestmentCompanyPortfolioTurnover |
12.00%
|
| Additional Fund Statistics [Text Block] |
Key Fund Statistics as of 12/31/2025- Total Net Assets$606,709,920
- Number of Portfolio Holdings2,493
- Portfolio Turnover Rate12%
- Total Advisory Fees Paid$0
|
| Holdings [Text Block] |
Assets |
% |
Common Stocks |
59.9% |
Mutual Funds and Exchange Traded Products |
39.6% |
Short-Term Investments |
0.8% | |
| Largest Holdings [Text Block] |
Holdings |
% |
State Street Aggregate Bond Index Portfolio |
39.6% |
NVIDIA Corp. |
4.1% |
Apple, Inc. |
3.6% |
Microsoft Corp. |
3.3% |
Amazon.com, Inc. |
2.0% |
Alphabet, Inc., Class A |
1.6% |
Broadcom, Inc. |
1.5% |
Alphabet, Inc., Class C |
1.3% |
Meta Platforms, Inc., Class A |
1.3% |
Tesla, Inc. |
1.1% | |
| Material Fund Change [Text Block] |
|
| C000159454 |
|
| Shareholder Report [Line Items] |
|
| Fund Name |
State Street Emerging Markets Equity Index Fund
|
| Class Name |
Class K
|
| Trading Symbol |
SSKEX
|
| Annual or Semi-Annual Statement [Text Block] |
This annual shareholder report contains important information about the State Street Emerging Markets Equity Index Fund (the "Fund") for the period of January 1, 2025 through December 31, 2025.
|
| Additional Information [Text Block] |
You can find additional information about the Fund, including the Prospectus, Statement of Additional Information, financial statements and other information at www.ssga.com/us/en/institutional/fund-finder?tab=documents&type=mf. You can also request this information about the Fund by contacting us at 1-800-647-7327.
|
| Additional Information Phone Number |
1-800-647-7327
|
| Additional Information Website |
www.ssga.com/us/en/institutional/fund-finder?tab=documents&type=mf
|
| Expenses [Text Block] |
What were the Fund costs for the last year? (based on a hypothetical $10,000 Investment)
Class Name |
Costs of a $10,000 investment |
Costs paid as a percentage of a $10,000 investment |
Class K |
$8 |
0.07% | |
| Expenses Paid, Amount |
$ 8
|
| Expense Ratio, Percent |
0.07%
|
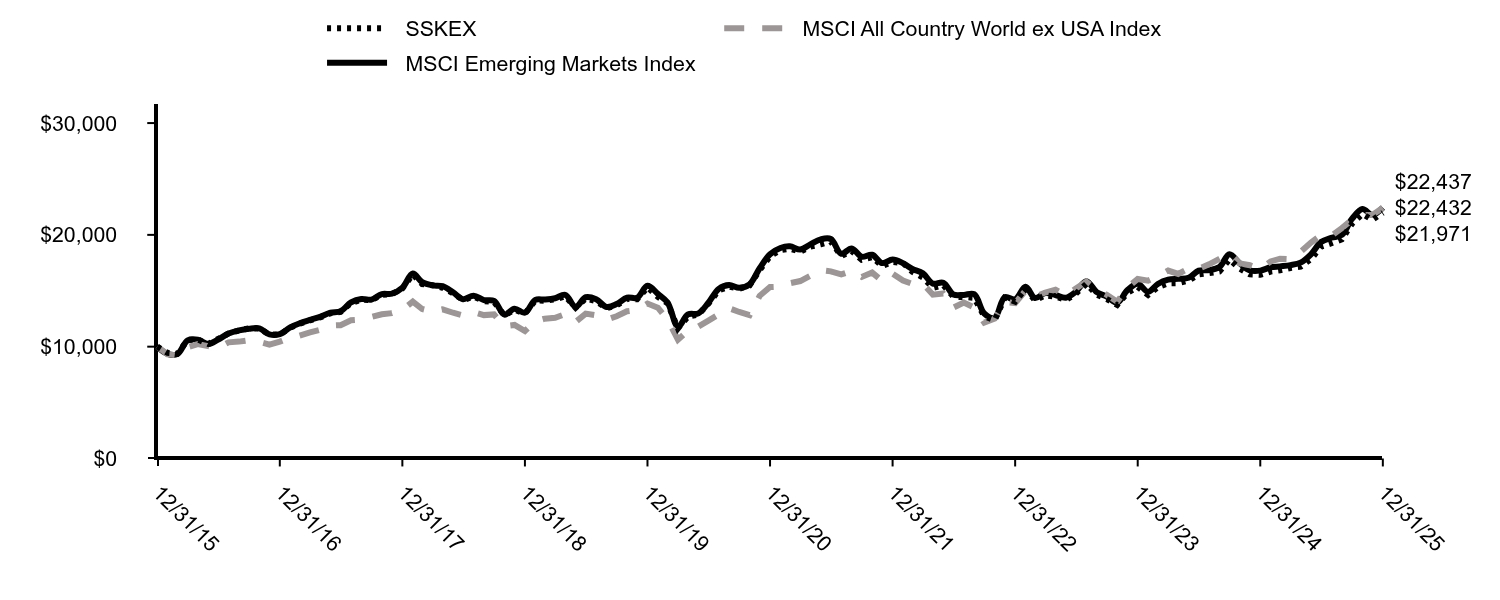
| Factors Affecting Performance [Text Block] |
How did the Fund perform last year and what affected its performance?Emerging markets ("EM") delivered strong outperformance throughout 2025, finishing the year with MSCI EM up 33.6%, supported by resilient macro fundamentals, a weaker U.S. Dollar and powerful demand for technology hardware. EM Asia and Latin America benefited from stable monetary policy, easing inflation, and recovering trade conditions. Monetary easing across global central banks, including Federal Reserve's cuts, boosted EM asset flows by lowering global funding costs. Commodity‑linked markets saw mixed outcomes as energy prices fell but industrial metals rallied on clean‑energy and Artificial Intelligence‑related demand. China, Korea, and Taiwan were the strongest contributors to the Fund's performance. Saudi Arabia, Indonesia, and Turkey were the weakest contributors. Information technology, financials, and communications services were the strongest contributors to the Fund's performance. Real estate, utilities and health care were the weakest contributing sectors. |
| Performance Past Does Not Indicate Future [Text] |
The Fund’s past performance is not necessarily an indication of how the Fund will perform in the future. The returns do not reflect the deduction of taxes that a shareholder would pay on Fund distributions or on the redemption or sale of Fund shares.
|
| Line Graph [Table Text Block] |
|
SSKEX |
MSCI All Country World ex USA Index |
MSCI Emerging Markets Index |
12/31/15 |
$10,000 |
$10,000 |
$10,000 |
01/31/16 |
$9,439 |
$9,320 |
$9,351 |
02/29/16 |
$9,369 |
$9,213 |
$9,336 |
03/31/16 |
$10,601 |
$9,962 |
$10,571 |
04/30/16 |
$10,641 |
$10,225 |
$10,629 |
05/31/16 |
$10,240 |
$10,052 |
$10,232 |
06/30/16 |
$10,691 |
$9,898 |
$10,641 |
07/31/16 |
$11,181 |
$10,388 |
$11,177 |
08/31/16 |
$11,451 |
$10,453 |
$11,455 |
09/30/16 |
$11,642 |
$10,582 |
$11,602 |
10/31/16 |
$11,622 |
$10,430 |
$11,630 |
11/30/16 |
$11,081 |
$10,189 |
$11,094 |
12/31/16 |
$11,081 |
$10,450 |
$11,119 |
01/31/17 |
$11,706 |
$10,820 |
$11,727 |
02/28/17 |
$12,044 |
$10,992 |
$12,086 |
03/31/17 |
$12,351 |
$11,271 |
$12,391 |
04/30/17 |
$12,617 |
$11,512 |
$12,663 |
05/31/17 |
$12,986 |
$11,886 |
$13,037 |
06/30/17 |
$13,119 |
$11,923 |
$13,168 |
07/31/17 |
$13,897 |
$12,362 |
$13,953 |
08/31/17 |
$14,215 |
$12,427 |
$14,264 |
09/30/17 |
$14,153 |
$12,657 |
$14,208 |
10/31/17 |
$14,635 |
$12,896 |
$14,706 |
11/30/17 |
$14,696 |
$13,000 |
$14,735 |
12/31/17 |
$15,202 |
$13,291 |
$15,264 |
01/31/18 |
$16,463 |
$14,031 |
$16,536 |
02/28/18 |
$15,601 |
$13,370 |
$15,774 |
03/31/18 |
$15,496 |
$13,134 |
$15,480 |
04/30/18 |
$15,265 |
$13,343 |
$15,412 |
05/31/18 |
$14,781 |
$13,035 |
$14,866 |
06/30/18 |
$14,161 |
$12,790 |
$14,248 |
07/31/18 |
$14,487 |
$13,096 |
$14,561 |
08/31/18 |
$14,077 |
$12,822 |
$14,167 |
09/30/18 |
$14,003 |
$12,881 |
$14,092 |
10/31/18 |
$12,794 |
$11,833 |
$12,865 |
11/30/18 |
$13,309 |
$11,945 |
$13,395 |
12/31/18 |
$12,956 |
$11,404 |
$13,040 |
01/31/19 |
$14,126 |
$12,266 |
$14,182 |
02/28/19 |
$14,115 |
$12,506 |
$14,214 |
03/31/19 |
$14,223 |
$12,580 |
$14,333 |
04/30/19 |
$14,516 |
$12,912 |
$14,635 |
05/31/19 |
$13,476 |
$12,219 |
$13,573 |
06/30/19 |
$14,310 |
$12,955 |
$14,420 |
07/31/19 |
$14,061 |
$12,798 |
$14,244 |
08/31/19 |
$13,443 |
$12,403 |
$13,549 |
09/30/19 |
$13,693 |
$12,722 |
$13,808 |
10/31/19 |
$14,278 |
$13,166 |
$14,390 |
11/30/19 |
$14,245 |
$13,282 |
$14,370 |
12/31/19 |
$15,305 |
$13,857 |
$15,443 |
01/31/20 |
$14,448 |
$13,485 |
$14,723 |
02/29/20 |
$13,879 |
$12,419 |
$13,946 |
03/31/20 |
$11,629 |
$10,621 |
$11,798 |
04/30/20 |
$12,694 |
$11,426 |
$12,879 |
05/31/20 |
$12,868 |
$11,800 |
$12,978 |
06/30/20 |
$13,851 |
$12,333 |
$13,932 |
07/31/20 |
$15,038 |
$12,883 |
$15,177 |
08/31/20 |
$15,368 |
$13,434 |
$15,512 |
09/30/20 |
$15,183 |
$13,104 |
$15,263 |
10/31/20 |
$15,466 |
$12,822 |
$15,578 |
11/30/20 |
$16,854 |
$14,547 |
$17,018 |
12/31/20 |
$18,087 |
$15,334 |
$18,270 |
01/31/21 |
$18,630 |
$15,367 |
$18,830 |
02/28/21 |
$18,768 |
$15,671 |
$18,974 |
03/31/21 |
$18,487 |
$15,869 |
$18,687 |
04/30/21 |
$18,950 |
$16,336 |
$19,152 |
05/31/21 |
$19,158 |
$16,847 |
$19,597 |
06/30/21 |
$19,408 |
$16,738 |
$19,630 |
07/31/21 |
$18,103 |
$16,462 |
$18,309 |
08/31/21 |
$18,562 |
$16,775 |
$18,788 |
09/30/21 |
$17,772 |
$16,238 |
$18,042 |
10/31/21 |
$17,992 |
$16,626 |
$18,220 |
11/30/21 |
$17,220 |
$15,877 |
$17,477 |
12/31/21 |
$17,580 |
$16,533 |
$17,805 |
01/31/22 |
$17,483 |
$15,924 |
$17,468 |
02/28/22 |
$16,692 |
$15,609 |
$16,946 |
03/31/22 |
$16,192 |
$15,634 |
$16,563 |
04/30/22 |
$15,262 |
$14,652 |
$15,642 |
05/31/22 |
$15,507 |
$14,757 |
$15,711 |
06/30/22 |
$14,466 |
$13,488 |
$14,667 |
07/31/22 |
$14,440 |
$13,949 |
$14,631 |
08/31/22 |
$14,371 |
$13,501 |
$14,692 |
09/30/22 |
$12,700 |
$12,151 |
$12,969 |
10/31/22 |
$12,378 |
$12,514 |
$12,567 |
11/30/22 |
$14,364 |
$13,992 |
$14,431 |
12/31/22 |
$14,020 |
$13,887 |
$14,228 |
01/31/23 |
$15,195 |
$15,013 |
$15,351 |
02/28/23 |
$14,135 |
$14,486 |
$14,356 |
03/31/23 |
$14,599 |
$14,841 |
$14,791 |
04/30/23 |
$14,479 |
$15,098 |
$14,623 |
05/31/23 |
$14,169 |
$14,549 |
$14,377 |
06/30/23 |
$14,741 |
$15,202 |
$14,923 |
07/31/23 |
$15,616 |
$15,820 |
$15,852 |
08/31/23 |
$14,652 |
$15,106 |
$14,876 |
09/30/23 |
$14,258 |
$14,629 |
$14,487 |
10/31/23 |
$13,726 |
$14,025 |
$13,924 |
11/30/23 |
$14,799 |
$15,288 |
$15,038 |
12/31/23 |
$15,348 |
$16,056 |
$15,626 |
01/31/24 |
$14,630 |
$15,896 |
$14,901 |
02/29/24 |
$15,330 |
$16,299 |
$15,609 |
03/31/24 |
$15,668 |
$16,808 |
$15,996 |
04/30/24 |
$15,678 |
$16,506 |
$16,068 |
05/31/24 |
$15,914 |
$16,985 |
$16,159 |
06/30/24 |
$16,456 |
$16,969 |
$16,796 |
07/31/24 |
$16,580 |
$17,362 |
$16,846 |
08/31/24 |
$16,717 |
$17,857 |
$17,118 |
09/30/24 |
$17,795 |
$18,337 |
$18,261 |
10/31/24 |
$16,970 |
$17,438 |
$17,449 |
11/30/24 |
$16,468 |
$17,280 |
$16,822 |
12/31/24 |
$16,424 |
$16,944 |
$16,799 |
01/31/25 |
$16,716 |
$17,627 |
$17,099 |
02/28/25 |
$16,828 |
$17,872 |
$17,182 |
03/31/25 |
$17,033 |
$17,831 |
$17,290 |
04/30/25 |
$17,153 |
$18,475 |
$17,518 |
05/31/25 |
$17,832 |
$19,321 |
$18,265 |
06/30/25 |
$18,939 |
$19,977 |
$19,363 |
07/31/25 |
$19,253 |
$19,919 |
$19,741 |
08/31/25 |
$19,598 |
$20,611 |
$19,994 |
09/30/25 |
$20,994 |
$21,353 |
$21,424 |
10/31/25 |
$21,868 |
$21,785 |
$22,319 |
11/30/25 |
$21,341 |
$21,779 |
$21,786 |
12/31/25 |
$21,971 |
$22,432 |
$22,437 |
|
| Average Annual Return [Table Text Block] |
Name |
1 Year |
5 Years |
10 Years |
SSKEX |
33.77% |
3.97% |
8.19% |
MSCI All Country World ex USA Index |
32.39% |
7.91% |
8.41% |
MSCI Emerging Markets Index |
33.57% |
4.20% |
8.42% | |
| Updated Performance Information Location [Text Block] |
Updated performance information is available by calling 1-800-647-7327 or visiting our website at www.ssga.com.
|
| AssetsNet |
$ 617,986,689
|
| Holdings Count | Holding |
1,174
|
| Advisory Fees Paid, Amount |
$ 0
|
| InvestmentCompanyPortfolioTurnover |
7.00%
|
| Additional Fund Statistics [Text Block] |
Key Fund Statistics as of 12/31/2025- Total Net Assets$617,986,689
- Number of Portfolio Holdings1,174
- Portfolio Turnover Rate7%
- Total Advisory Fees Paid$0
|
| Holdings [Text Block] |
Countries |
% |
China |
23.7% |
Taiwan |
20.4% |
India |
15.4% |
South Korea |
13.2% |
Brazil |
4.2% |
Switzerland |
3.4% |
South Africa |
3.3% |
Saudi Arabia |
2.8% |
Mexico |
2.0% |
United Arab Emirates |
1.4% | |
| Largest Holdings [Text Block] |
Holdings |
% |
Taiwan Semiconductor Manufacturing Co. Ltd. |
11.8% |
Tencent Holdings Ltd. |
4.8% |
Samsung Electronics Co. Ltd. |
3.8% |
Alibaba Group Holding Ltd. |
3.1% |
SK Hynix, Inc. |
2.4% |
MSCI CHINA A INCLUSION Net Return USD Index, due 08/31/27 |
1.4% |
HDFC Bank Ltd. |
1.2% |
UBS AG, due 06/04/27 |
1.1% |
Reliance Industries Ltd. |
1.0% |
China Construction Bank Corp., Class H |
0.9% | |
| Material Fund Change [Text Block] |
|
| C000029581 |
|
| Shareholder Report [Line Items] |
|
| Fund Name |
State Street Equity 500 Index Fund
|
| Class Name |
Administrative Shares
|
| Trading Symbol |
STFAX
|
| Annual or Semi-Annual Statement [Text Block] |
This annual shareholder report contains important information about the State Street Equity 500 Index Fund (the "Fund") for the period of January 1, 2025 through December 31, 2025.
|
| Additional Information [Text Block] |
You can find additional information about the Fund, including the Prospectus, Statement of Additional Information, financial statements and other information at www.ssga.com/us/en/institutional/fund-finder?tab=documents&type=mf. You can also request this information about the Fund by contacting us at 1-800-647-7327.
|
| Additional Information Phone Number |
1-800-647-7327
|
| Additional Information Website |
www.ssga.com/us/en/institutional/fund-finder?tab=documents&type=mf
|
| Expenses [Text Block] |
What were the Fund costs for the last year? (based on a hypothetical $10,000 Investment)
Class Name |
Costs of a $10,000 investment |
Costs paid as a percentage of a $10,000 investment |
Administrative Shares |
$17 |
0.16% | The expense table reflects expenses from both the Fund and the affiliated Portfolio, in which the Fund invests. |
| Expenses Paid, Amount |
$ 17
|
| Expense Ratio, Percent |
0.16%
|
| Expenses Represent Both Master and Feeder [Text] |
The expense table reflects expenses from both the Fund and the affiliated Portfolio, in which the Fund invests.
|
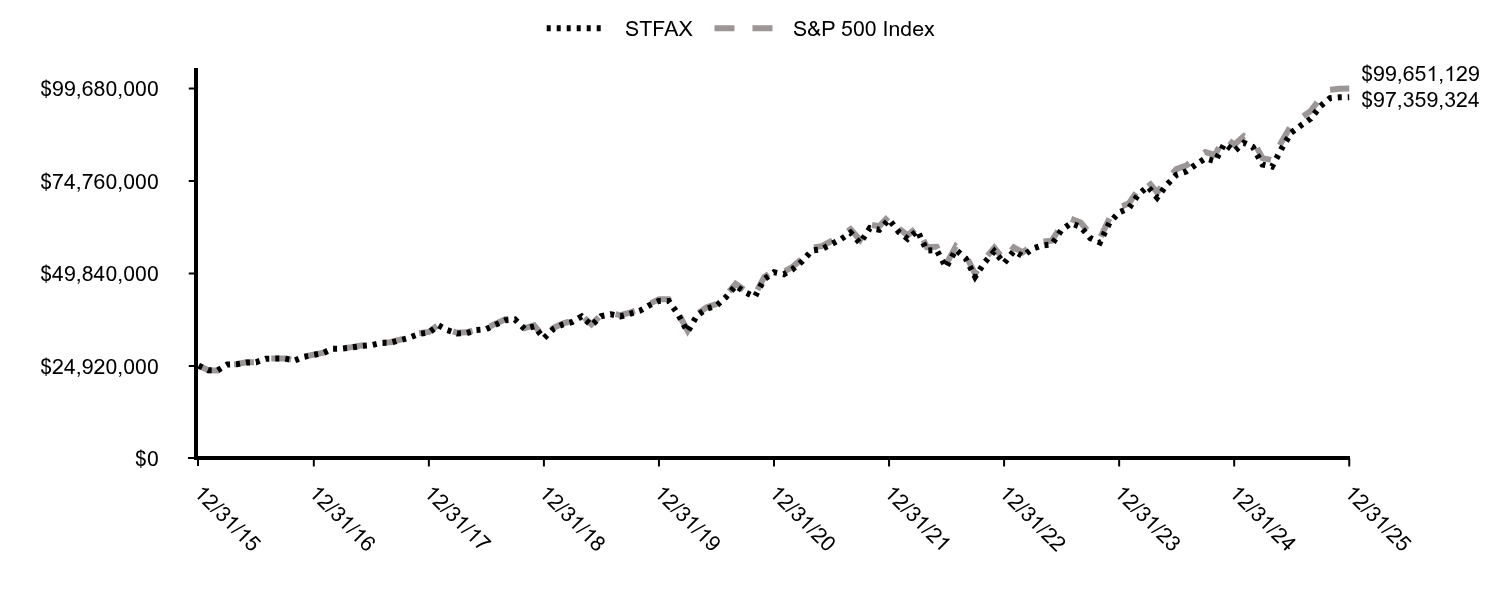
| Factors Affecting Performance [Text Block] |
How did the Fund perform last year and what affected its performance?In 2025, the S&P 500 delivered another year of strong performance, rising almost 18% and marking its third consecutive year of double‑digit gains. The Index reached multiple record highs despite notable volatility. Early in the year, markets were shaken by the April 2 “Liberation Day” tariff shock, which triggered a sharp pullback, but equities rebounded swiftly as investors grew confident that corporate adaptability, easing trade tensions, and emerging policy clarity would offset early disruptions. Momentum strengthened through the second half of the year as the U.S. Federal Reserve implemented three interest‑rate cuts. Technology remained the primary engine of market gains, driven by ongoing investment in Artificial Intelligence ("A.I.") and robust earnings across mega‑cap names, while other sectors experienced more uneven results. Overall, 2025 underscored the durability of the bull market, with resilient corporate earnings, increased productivity expectations, and optimism around A.I. deployment contributing to a strong finish. |
| Performance Past Does Not Indicate Future [Text] |
The Fund’s past performance is not necessarily an indication of how the Fund will perform in the future. The returns do not reflect the deduction of taxes that a shareholder would pay on Fund distributions or on the redemption or sale of Fund shares.
|
| Line Graph [Table Text Block] |
|
STFAX |
S&P 500 Index |
12/31/15 |
$25,000,000 |
$25,000,000 |
01/31/16 |
$23,747,816 |
$23,760,000 |
02/29/16 |
$23,733,256 |
$23,729,112 |
03/31/16 |
$25,320,326 |
$25,337,946 |
04/30/16 |
$25,407,688 |
$25,436,764 |
05/31/16 |
$25,859,056 |
$25,894,626 |
06/30/16 |
$25,931,858 |
$25,961,952 |
07/31/16 |
$26,878,276 |
$26,919,948 |
08/31/16 |
$26,921,957 |
$26,957,635 |
09/30/16 |
$26,907,397 |
$26,963,027 |
10/31/16 |
$26,397,787 |
$26,472,300 |
11/30/16 |
$27,387,886 |
$27,451,775 |
12/31/16 |
$27,937,685 |
$27,995,320 |
01/31/17 |
$28,442,136 |
$28,527,231 |
02/28/17 |
$29,584,569 |
$29,659,762 |
03/31/17 |
$29,599,406 |
$29,695,354 |
04/30/17 |
$29,896,142 |
$30,001,216 |
05/31/17 |
$30,311,572 |
$30,424,233 |
06/30/17 |
$30,474,777 |
$30,612,864 |
07/31/17 |
$31,112,759 |
$31,243,489 |
08/31/17 |
$31,172,106 |
$31,340,343 |
09/30/17 |
$31,839,762 |
$31,985,954 |
10/31/17 |
$32,566,765 |
$32,731,227 |
11/30/17 |
$33,560,830 |
$33,736,076 |
12/31/17 |
$33,924,547 |
$34,110,546 |
01/31/18 |
$35,870,266 |
$36,065,081 |
02/28/18 |
$34,567,890 |
$34,734,279 |
03/31/18 |
$33,673,487 |
$33,852,028 |
04/30/18 |
$33,767,635 |
$33,980,666 |
05/31/18 |
$34,599,272 |
$34,799,600 |
06/30/18 |
$34,803,259 |
$35,015,358 |
07/31/18 |
$36,058,561 |
$36,317,929 |
08/31/18 |
$37,251,099 |
$37,501,894 |
09/30/18 |
$37,455,085 |
$37,715,654 |
10/31/18 |
$34,881,715 |
$35,135,904 |
11/30/18 |
$35,603,514 |
$35,852,676 |
12/31/18 |
$32,376,258 |
$32,615,179 |
01/31/19 |
$34,947,896 |
$35,227,655 |
02/28/19 |
$36,068,866 |
$36,358,463 |
03/31/19 |
$36,777,715 |
$37,063,817 |
04/30/19 |
$38,261,352 |
$38,564,902 |
05/31/19 |
$35,838,078 |
$36,116,030 |
06/30/19 |
$38,327,291 |
$38,662,211 |
07/31/19 |
$38,871,291 |
$39,218,946 |
08/31/19 |
$38,261,352 |
$38,599,287 |
09/30/19 |
$38,970,201 |
$39,321,094 |
10/31/19 |
$39,794,443 |
$40,174,362 |
11/30/19 |
$41,245,111 |
$41,632,691 |
12/31/19 |
$42,457,258 |
$42,889,998 |
01/31/20 |
$42,457,258 |
$42,872,842 |
02/29/20 |
$38,967,855 |
$39,344,407 |
03/31/20 |
$34,137,698 |
$34,485,373 |
04/30/20 |
$38,507,186 |
$38,906,398 |
05/31/20 |
$40,329,238 |
$40,758,342 |
06/30/20 |
$41,118,221 |
$41,569,433 |
07/31/20 |
$43,437,040 |
$43,913,949 |
08/31/20 |
$46,541,405 |
$47,071,362 |
09/30/20 |
$44,764,045 |
$45,282,650 |
10/31/20 |
$43,567,678 |
$44,078,132 |
11/30/20 |
$48,310,171 |
$48,904,687 |
12/31/20 |
$50,159,708 |
$50,782,627 |
01/31/21 |
$49,635,135 |
$50,269,723 |
02/28/21 |
$50,962,306 |
$51,657,167 |
03/31/21 |
$53,191,743 |
$53,919,751 |
04/30/21 |
$56,013,947 |
$56,799,066 |
05/31/21 |
$56,402,132 |
$57,196,659 |
06/30/21 |
$57,704,822 |
$58,529,342 |
07/31/21 |
$59,061,719 |
$59,922,340 |
08/31/21 |
$60,848,766 |
$61,743,979 |
09/30/21 |
$58,014,321 |
$58,872,884 |
10/31/21 |
$62,065,776 |
$62,999,873 |
11/30/21 |
$61,628,631 |
$62,565,174 |
12/31/21 |
$64,363,347 |
$65,368,094 |
01/31/22 |
$61,021,218 |
$61,988,563 |
02/28/22 |
$59,186,007 |
$60,135,105 |
03/31/22 |
$61,378,214 |
$62,366,118 |
04/30/22 |
$56,016,097 |
$56,927,792 |
05/31/22 |
$56,130,910 |
$57,030,262 |
06/30/22 |
$51,482,784 |
$52,325,266 |
07/31/22 |
$56,211,637 |
$57,149,655 |
08/31/22 |
$53,917,175 |
$54,817,949 |
09/30/22 |
$48,949,727 |
$49,769,216 |
10/31/22 |
$52,898,211 |
$53,800,523 |
11/30/22 |
$55,843,877 |
$56,807,972 |
12/31/22 |
$52,600,629 |
$53,535,833 |
01/31/23 |
$55,900,178 |
$56,897,883 |
02/28/23 |
$54,527,654 |
$55,509,575 |
03/31/23 |
$56,515,069 |
$57,546,776 |
04/30/23 |
$57,389,825 |
$58,444,506 |
05/31/23 |
$57,636,879 |
$58,695,817 |
06/30/23 |
$61,436,027 |
$62,575,611 |
07/31/23 |
$63,397,822 |
$64,584,288 |
08/31/23 |
$62,389,474 |
$63,557,397 |
09/30/23 |
$59,412,011 |
$60,525,710 |
10/31/23 |
$58,158,439 |
$59,254,670 |
11/30/23 |
$63,456,383 |
$64,664,621 |
12/31/23 |
$66,318,532 |
$67,600,395 |
01/31/24 |
$67,421,423 |
$68,736,081 |
02/29/24 |
$71,014,653 |
$72,406,588 |
03/31/24 |
$73,287,390 |
$74,738,080 |
04/30/24 |
$70,291,171 |
$71,688,767 |
05/31/24 |
$73,765,371 |
$75,244,529 |
06/30/24 |
$76,398,919 |
$77,945,808 |
07/31/24 |
$77,319,544 |
$78,896,747 |
08/31/24 |
$79,186,834 |
$80,813,938 |
09/30/24 |
$80,856,979 |
$82,543,356 |
10/31/24 |
$80,113,039 |
$81,792,212 |
11/30/24 |
$84,801,721 |
$86,593,414 |
12/31/24 |
$82,767,609 |
$84,532,491 |
01/31/25 |
$85,065,399 |
$86,882,494 |
02/28/25 |
$83,946,688 |
$85,753,022 |
03/31/25 |
$79,190,753 |
$80,925,127 |
04/30/25 |
$78,638,000 |
$80,374,836 |
05/31/25 |
$83,569,383 |
$85,430,413 |
06/30/25 |
$87,804,636 |
$89,778,821 |
07/31/25 |
$89,757,192 |
$91,789,867 |
08/31/25 |
$91,562,598 |
$93,653,201 |
09/30/25 |
$94,892,319 |
$97,071,543 |
10/31/25 |
$97,097,669 |
$99,343,017 |
11/30/25 |
$97,312,733 |
$99,591,375 |
12/31/25 |
$97,359,324 |
$99,651,129 |
|
| Average Annual Return [Table Text Block] |
Name |
1 Year |
5 Years |
10 Years |
STFAX |
17.63% |
14.18% |
14.56% |
S&P 500 Index |
17.88% |
14.42% |
14.82% | |
| Updated Performance Information Location [Text Block] |
Updated performance information is available by calling 1-800-647-7327 or visiting our website at www.ssga.com.
|
| AssetsNet |
$ 13,629,954,117
|
| Holdings Count | Holding |
506
|
| Advisory Fees Paid, Amount |
$ 0
|
| InvestmentCompanyPortfolioTurnover |
2.00%
|
| Additional Fund Statistics [Text Block] |
Key Fund Statistics as of 12/31/2025- Total Net Assets$13,629,954,117
- Number of Portfolio Holdings506
- Portfolio Turnover Rate2%
- Total Advisory Fees Paid$0
Portfolio holdings and portfolio turnover rate are from the corresponding Portfolio, in which the Fund invests. |
| Holdings [Text Block] |
Sectors |
% |
Information Technology |
33.7% |
Financials |
13.2% |
Communication Services |
10.4% |
Consumer Discretionary |
10.2% |
Health Care |
9.4% |
Industrials |
8.0% |
Consumer Staples |
4.6% |
Energy |
2.7% |
Utilities |
2.2% |
Materials |
1.8% | |
| Largest Holdings [Text Block] |
Holdings |
% |
NVIDIA Corp. |
7.6% |
Apple, Inc. |
6.7% |
Microsoft Corp. |
6.0% |
Amazon.com, Inc. |
3.8% |
Alphabet, Inc., Class A |
3.0% |
Broadcom, Inc. |
2.7% |
Alphabet, Inc., Class C |
2.4% |
Meta Platforms, Inc., Class A |
2.4% |
Tesla, Inc. |
2.1% |
Berkshire Hathaway, Inc., Class B |
1.5% | |
| Material Fund Change [Text Block] |
|
| C000136665 |
|
| Shareholder Report [Line Items] |
|
| Fund Name |
State Street Equity 500 Index Fund
|
| Class Name |
Class A
|
| Trading Symbol |
SSSVX
|
| Annual or Semi-Annual Statement [Text Block] |
This annual shareholder report contains important information about the State Street Equity 500 Index Fund (the "Fund") for the period of January 1, 2025 through December 31, 2025.
|
| Additional Information [Text Block] |
You can find additional information about the Fund, including the Prospectus, Statement of Additional Information, financial statements and other information at www.ssga.com/us/en/institutional/fund-finder?tab=documents&type=mf. You can also request this information about the Fund by contacting us at 1-800-647-7327.
|
| Additional Information Phone Number |
1-800-647-7327
|
| Additional Information Website |
www.ssga.com/us/en/institutional/fund-finder?tab=documents&type=mf
|
| Expenses [Text Block] |
What were the Fund costs for the last year? (based on a hypothetical $10,000 Investment)
Class Name |
Costs of a $10,000 investment |
Costs paid as a percentage of a $10,000 investment |
Class A |
$45 |
0.41% | The expense table reflects expenses from both the Fund and the affiliated Portfolio, in which the Fund invests. |
| Expenses Paid, Amount |
$ 45
|
| Expense Ratio, Percent |
0.41%
|
| Expenses Represent Both Master and Feeder [Text] |
The expense table reflects expenses from both the Fund and the affiliated Portfolio, in which the Fund invests.
|
| Factors Affecting Performance [Text Block] |
How did the Fund perform last year and what affected its performance?In 2025, the S&P 500 delivered another year of strong performance, rising almost 18% and marking its third consecutive year of double‑digit gains. The Index reached multiple record highs despite notable volatility. Early in the year, markets were shaken by the April 2 “Liberation Day” tariff shock, which triggered a sharp pullback, but equities rebounded swiftly as investors grew confident that corporate adaptability, easing trade tensions, and emerging policy clarity would offset early disruptions. Momentum strengthened through the second half of the year as the U.S. Federal Reserve implemented three interest‑rate cuts. Technology remained the primary engine of market gains, driven by ongoing investment in Artificial Intelligence ("A.I.") and robust earnings across mega‑cap names, while other sectors experienced more uneven results. Overall, 2025 underscored the durability of the bull market, with resilient corporate earnings, increased productivity expectations, and optimism around A.I. deployment contributing to a strong finish. |
| Performance Past Does Not Indicate Future [Text] |
The Fund’s past performance is not necessarily an indication of how the Fund will perform in the future. The returns do not reflect the deduction of taxes that a shareholder would pay on Fund distributions or on the redemption or sale of Fund shares.
|
| Line Graph [Table Text Block] |
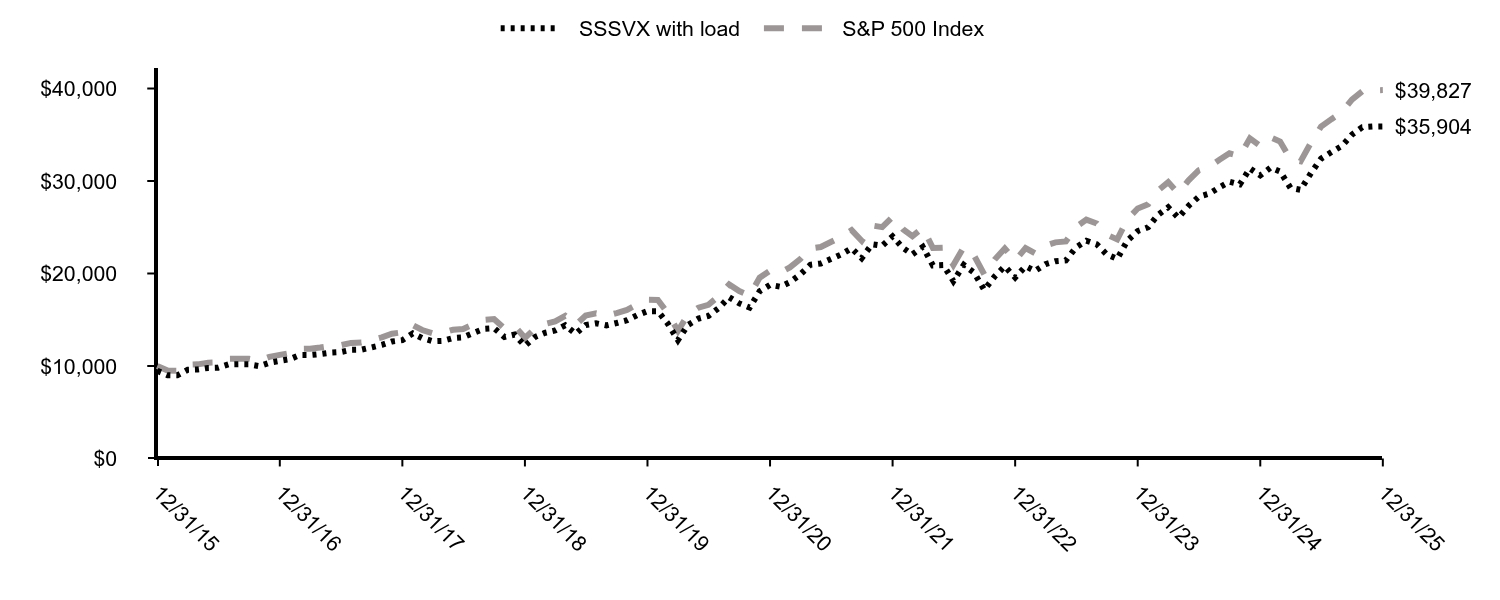
|
SSSVX with load |
S&P 500 Index |
12/31/15 |
$9,475 |
$10,000 |
01/31/16 |
$9,001 |
$9,504 |
02/29/16 |
$8,990 |
$9,491 |
03/31/16 |
$9,591 |
$10,135 |
04/30/16 |
$9,624 |
$10,174 |
05/31/16 |
$9,790 |
$10,357 |
06/30/16 |
$9,817 |
$10,384 |
07/31/16 |
$10,171 |
$10,766 |
08/31/16 |
$10,187 |
$10,782 |
09/30/16 |
$10,182 |
$10,784 |
10/31/16 |
$9,983 |
$10,587 |
11/30/16 |
$10,353 |
$10,979 |
12/31/16 |
$10,557 |
$11,196 |
01/31/17 |
$10,747 |
$11,408 |
02/28/17 |
$11,174 |
$11,861 |
03/31/17 |
$11,179 |
$11,875 |
04/30/17 |
$11,286 |
$11,997 |
05/31/17 |
$11,443 |
$12,166 |
06/30/17 |
$11,504 |
$12,242 |
07/31/17 |
$11,740 |
$12,494 |
08/31/17 |
$11,762 |
$12,532 |
09/30/17 |
$12,009 |
$12,790 |
10/31/17 |
$12,284 |
$13,089 |
11/30/17 |
$12,648 |
$13,490 |
12/31/17 |
$12,786 |
$13,640 |
01/31/18 |
$13,513 |
$14,421 |
02/28/18 |
$13,017 |
$13,890 |
03/31/18 |
$12,680 |
$13,537 |
04/30/18 |
$12,715 |
$13,589 |
05/31/18 |
$13,023 |
$13,916 |
06/30/18 |
$13,100 |
$14,002 |
07/31/18 |
$13,573 |
$14,523 |
08/31/18 |
$14,022 |
$14,996 |
09/30/18 |
$14,093 |
$15,081 |
10/31/18 |
$13,129 |
$14,050 |
11/30/18 |
$13,395 |
$14,337 |
12/31/18 |
$12,183 |
$13,042 |
01/31/19 |
$13,150 |
$14,087 |
02/28/19 |
$13,572 |
$14,540 |
03/31/19 |
$13,839 |
$14,822 |
04/30/19 |
$14,391 |
$15,422 |
05/31/19 |
$13,479 |
$14,442 |
06/30/19 |
$14,416 |
$15,460 |
07/31/19 |
$14,614 |
$15,682 |
08/31/19 |
$14,385 |
$15,434 |
09/30/19 |
$14,645 |
$15,723 |
10/31/19 |
$14,943 |
$16,063 |
11/30/19 |
$15,483 |
$16,646 |
12/31/19 |
$15,933 |
$17,149 |
01/31/20 |
$15,926 |
$17,142 |
02/29/20 |
$14,611 |
$15,731 |
03/31/20 |
$12,798 |
$13,788 |
04/30/20 |
$14,437 |
$15,555 |
05/31/20 |
$15,116 |
$16,296 |
06/30/20 |
$15,408 |
$16,620 |
07/31/20 |
$16,273 |
$17,558 |
08/31/20 |
$17,431 |
$18,820 |
09/30/20 |
$16,762 |
$18,105 |
10/31/20 |
$16,310 |
$17,623 |
11/30/20 |
$18,080 |
$19,552 |
12/31/20 |
$18,768 |
$20,304 |
01/31/21 |
$18,567 |
$20,099 |
02/28/21 |
$19,060 |
$20,653 |
03/31/21 |
$19,888 |
$21,558 |
04/30/21 |
$20,938 |
$22,708 |
05/31/21 |
$21,078 |
$22,867 |
06/30/21 |
$21,559 |
$23,401 |
07/31/21 |
$22,060 |
$23,956 |
08/31/21 |
$22,722 |
$24,685 |
09/30/21 |
$21,658 |
$23,537 |
10/31/21 |
$23,165 |
$25,186 |
11/30/21 |
$22,996 |
$25,011 |
12/31/21 |
$24,011 |
$26,132 |
01/31/22 |
$22,757 |
$24,780 |
02/28/22 |
$22,068 |
$24,038 |
03/31/22 |
$22,880 |
$24,931 |
04/30/22 |
$20,876 |
$22,757 |
05/31/22 |
$20,913 |
$22,798 |
06/30/22 |
$19,177 |
$20,916 |
07/31/22 |
$20,933 |
$22,845 |
08/31/22 |
$20,073 |
$21,913 |
09/30/22 |
$18,220 |
$19,895 |
10/31/22 |
$19,684 |
$21,506 |
11/30/22 |
$20,775 |
$22,708 |
12/31/22 |
$19,564 |
$21,399 |
01/31/23 |
$20,786 |
$22,744 |
02/28/23 |
$20,270 |
$22,189 |
03/31/23 |
$21,004 |
$23,004 |
04/30/23 |
$21,324 |
$23,363 |
05/31/23 |
$21,410 |
$23,464 |
06/30/23 |
$22,816 |
$25,015 |
07/31/23 |
$23,538 |
$25,818 |
08/31/23 |
$23,159 |
$25,407 |
09/30/23 |
$22,048 |
$24,196 |
10/31/23 |
$21,577 |
$23,687 |
11/30/23 |
$23,537 |
$25,850 |
12/31/23 |
$24,592 |
$27,025 |
01/31/24 |
$24,995 |
$27,479 |
02/29/24 |
$26,320 |
$28,946 |
03/31/24 |
$27,156 |
$29,878 |
04/30/24 |
$26,040 |
$28,657 |
05/31/24 |
$27,319 |
$30,078 |
06/30/24 |
$28,288 |
$31,157 |
07/31/24 |
$28,624 |
$31,537 |
08/31/24 |
$29,308 |
$32,302 |
09/30/24 |
$29,919 |
$32,992 |
10/31/24 |
$29,636 |
$32,692 |
11/30/24 |
$31,362 |
$34,611 |
12/31/24 |
$30,603 |
$33,786 |
01/31/25 |
$31,446 |
$34,727 |
02/28/25 |
$31,024 |
$34,274 |
03/31/25 |
$29,260 |
$32,343 |
04/30/25 |
$29,049 |
$32,124 |
05/31/25 |
$30,863 |
$34,146 |
06/30/25 |
$32,419 |
$35,882 |
07/31/25 |
$33,132 |
$36,687 |
08/31/25 |
$33,790 |
$37,431 |
09/30/25 |
$35,012 |
$38,797 |
10/31/25 |
$35,819 |
$39,706 |
11/30/25 |
$35,892 |
$39,803 |
12/31/25 |
$35,904 |
$39,827 |
|
| Average Annual Return [Table Text Block] |
Name |
1 Year |
5 Years |
10 Years |
SSSVX |
17.32% |
13.85% |
14.25% |
SSSVX (Adjusted for the 5.25% Maximum Sales Charge) |
11.16% |
12.63% |
13.64% |
S&P 500 Index |
17.88% |
14.42% |
14.82% | |
| Updated Performance Information Location [Text Block] |
Updated performance information is available by calling 1-800-647-7327 or visiting our website at www.ssga.com.
|
| AssetsNet |
$ 13,629,954,117
|
| Holdings Count | Holding |
506
|
| Advisory Fees Paid, Amount |
$ 0
|
| InvestmentCompanyPortfolioTurnover |
2.00%
|
| Additional Fund Statistics [Text Block] |
Key Fund Statistics as of 12/31/2025- Total Net Assets$13,629,954,117
- Number of Portfolio Holdings506
- Portfolio Turnover Rate2%
- Total Advisory Fees Paid$0
Portfolio holdings and portfolio turnover rate are from the corresponding Portfolio, in which the Fund invests. |
| Holdings [Text Block] |
Sectors |
% |
Information Technology |
33.7% |
Financials |
13.2% |
Communication Services |
10.4% |
Consumer Discretionary |
10.2% |
Health Care |
9.4% |
Industrials |
8.0% |
Consumer Staples |
4.6% |
Energy |
2.7% |
Utilities |
2.2% |
Materials |
1.8% | |
| Largest Holdings [Text Block] |
Holdings |
% |
NVIDIA Corp. |
7.6% |
Apple, Inc. |
6.7% |
Microsoft Corp. |
6.0% |
Amazon.com, Inc. |
3.8% |
Alphabet, Inc., Class A |
3.0% |
Broadcom, Inc. |
2.7% |
Alphabet, Inc., Class C |
2.4% |
Meta Platforms, Inc., Class A |
2.4% |
Tesla, Inc. |
2.1% |
Berkshire Hathaway, Inc., Class B |
1.5% | |
| Material Fund Change [Text Block] |
|
| C000136667 |
|
| Shareholder Report [Line Items] |
|
| Fund Name |
State Street Equity 500 Index Fund
|
| Class Name |
Class I
|
| Trading Symbol |
SSSWX
|
| Annual or Semi-Annual Statement [Text Block] |
This annual shareholder report contains important information about the State Street Equity 500 Index Fund (the "Fund") for the period of January 1, 2025 through December 31, 2025.
|
| Additional Information [Text Block] |
You can find additional information about the Fund, including the Prospectus, Statement of Additional Information, financial statements and other information at www.ssga.com/us/en/institutional/fund-finder?tab=documents&type=mf. You can also request this information about the Fund by contacting us at 1-800-647-7327.
|
| Additional Information Phone Number |
1-800-647-7327
|
| Additional Information Website |
www.ssga.com/us/en/institutional/fund-finder?tab=documents&type=mf
|
| Expenses [Text Block] |
What were the Fund costs for the last year? (based on a hypothetical $10,000 Investment)
Class Name |
Costs of a $10,000 investment |
Costs paid as a percentage of a $10,000 investment |
Class I |
$14 |
0.13% | The expense table reflects expenses from both the Fund and the affiliated Portfolio, in which the Fund invests. |
| Expenses Paid, Amount |
$ 14
|
| Expense Ratio, Percent |
0.13%
|
| Expenses Represent Both Master and Feeder [Text] |
The expense table reflects expenses from both the Fund and the affiliated Portfolio, in which the Fund invests.
|
| Factors Affecting Performance [Text Block] |
How did the Fund perform last year and what affected its performance?In 2025, the S&P 500 delivered another year of strong performance, rising almost 18% and marking its third consecutive year of double‑digit gains. The Index reached multiple record highs despite notable volatility. Early in the year, markets were shaken by the April 2 “Liberation Day” tariff shock, which triggered a sharp pullback, but equities rebounded swiftly as investors grew confident that corporate adaptability, easing trade tensions, and emerging policy clarity would offset early disruptions. Momentum strengthened through the second half of the year as the U.S. Federal Reserve implemented three interest‑rate cuts. Technology remained the primary engine of market gains, driven by ongoing investment in Artificial Intelligence ("A.I.") and robust earnings across mega‑cap names, while other sectors experienced more uneven results. Overall, 2025 underscored the durability of the bull market, with resilient corporate earnings, increased productivity expectations, and optimism around A.I. deployment contributing to a strong finish. |
| Performance Past Does Not Indicate Future [Text] |
The Fund’s past performance is not necessarily an indication of how the Fund will perform in the future. The returns do not reflect the deduction of taxes that a shareholder would pay on Fund distributions or on the redemption or sale of Fund shares.
|
| Line Graph [Table Text Block] |

|
SSSWX |
S&P 500 Index |
12/31/15 |
$10,000 |
$10,000 |
01/31/16 |
$9,505 |
$9,504 |
02/29/16 |
$9,493 |
$9,491 |
03/31/16 |
$10,134 |
$10,135 |
04/30/16 |
$10,169 |
$10,174 |
05/31/16 |
$10,349 |
$10,357 |
06/30/16 |
$10,379 |
$10,384 |
07/31/16 |
$10,751 |
$10,766 |
08/31/16 |
$10,769 |
$10,782 |
09/30/16 |
$10,769 |
$10,784 |
10/31/16 |
$10,559 |
$10,587 |
11/30/16 |
$10,955 |
$10,979 |
12/31/16 |
$11,175 |
$11,196 |
01/31/17 |
$11,377 |
$11,408 |
02/28/17 |
$11,828 |
$11,861 |
03/31/17 |
$11,840 |
$11,875 |
04/30/17 |
$11,952 |
$11,997 |
05/31/17 |
$12,118 |
$12,166 |
06/30/17 |
$12,184 |
$12,242 |
07/31/17 |
$12,439 |
$12,494 |
08/31/17 |
$12,468 |
$12,532 |
09/30/17 |
$12,729 |
$12,790 |
10/31/17 |
$13,026 |
$13,089 |
11/30/17 |
$13,417 |
$13,490 |
12/31/17 |
$13,562 |
$13,640 |
01/31/18 |
$14,339 |
$14,421 |
02/28/18 |
$13,819 |
$13,890 |
03/31/18 |
$13,461 |
$13,537 |
04/30/18 |
$13,499 |
$13,589 |
05/31/18 |
$13,831 |
$13,916 |
06/30/18 |
$13,913 |
$14,002 |
07/31/18 |
$14,421 |
$14,523 |
08/31/18 |
$14,897 |
$14,996 |
09/30/18 |
$14,979 |
$15,081 |
10/31/18 |
$13,950 |
$14,050 |
11/30/18 |
$14,245 |
$14,337 |
12/31/18 |
$12,958 |
$13,042 |
01/31/19 |
$13,986 |
$14,087 |
02/28/19 |
$14,441 |
$14,540 |
03/31/19 |
$14,725 |
$14,822 |
04/30/19 |
$15,318 |
$15,422 |
05/31/19 |
$14,349 |
$14,442 |
06/30/19 |
$15,345 |
$15,460 |
07/31/19 |
$15,562 |
$15,682 |
08/31/19 |
$15,318 |
$15,434 |
09/30/19 |
$15,602 |
$15,723 |
10/31/19 |
$15,932 |
$16,063 |
11/30/19 |
$16,505 |
$16,646 |
12/31/19 |
$16,996 |
$17,149 |
01/31/20 |
$16,989 |
$17,142 |
02/29/20 |
$15,593 |
$15,731 |
03/31/20 |
$13,660 |
$13,788 |
04/30/20 |
$15,412 |
$15,555 |
05/31/20 |
$16,140 |
$16,296 |
06/30/20 |
$16,455 |
$16,620 |
07/31/20 |
$17,382 |
$17,558 |
08/31/20 |
$18,624 |
$18,820 |
09/30/20 |
$17,912 |
$18,105 |
10/31/20 |
$17,432 |
$17,623 |
11/30/20 |
$19,329 |
$19,552 |
12/31/20 |
$20,068 |
$20,304 |
01/31/21 |
$19,857 |
$20,099 |
02/28/21 |
$20,388 |
$20,653 |
03/31/21 |
$21,278 |
$21,558 |
04/30/21 |
$22,407 |
$22,708 |
05/31/21 |
$22,561 |
$22,867 |
06/30/21 |
$23,081 |
$23,401 |
07/31/21 |
$23,623 |
$23,956 |
08/31/21 |
$24,337 |
$24,685 |
09/30/21 |
$23,202 |
$23,537 |
10/31/21 |
$24,821 |
$25,186 |
11/30/21 |
$24,646 |
$25,011 |
12/31/21 |
$25,738 |
$26,132 |
01/31/22 |
$24,400 |
$24,780 |
02/28/22 |
$23,666 |
$24,038 |
03/31/22 |
$24,541 |
$24,931 |
04/30/22 |
$22,397 |
$22,757 |
05/31/22 |
$22,442 |
$22,798 |
06/30/22 |
$20,582 |
$20,916 |
07/31/22 |
$22,472 |
$22,845 |
08/31/22 |
$21,553 |
$21,913 |
09/30/22 |
$19,567 |
$19,895 |
10/31/22 |
$21,144 |
$21,506 |
11/30/22 |
$22,321 |
$22,708 |
12/31/22 |
$21,024 |
$21,399 |
01/31/23 |
$22,342 |
$22,744 |
02/28/23 |
$21,792 |
$22,189 |
03/31/23 |
$22,586 |
$23,004 |
04/30/23 |
$22,934 |
$23,363 |
05/31/23 |
$23,032 |
$23,464 |
06/30/23 |
$24,550 |
$25,015 |
07/31/23 |
$25,332 |
$25,818 |
08/31/23 |
$24,929 |
$25,407 |
09/30/23 |
$23,738 |
$24,196 |
10/31/23 |
$23,235 |
$23,687 |
11/30/23 |
$25,351 |
$25,850 |
12/31/23 |
$26,494 |
$27,025 |
01/31/24 |
$26,933 |
$27,479 |
02/29/24 |
$28,367 |
$28,946 |
03/31/24 |
$29,274 |
$29,878 |
04/30/24 |
$28,076 |
$28,657 |
05/31/24 |
$29,463 |
$30,078 |
06/30/24 |
$30,520 |
$31,157 |
07/31/24 |
$30,891 |
$31,537 |
08/31/24 |
$31,641 |
$32,302 |
09/30/24 |
$32,313 |
$32,992 |
10/31/24 |
$32,020 |
$32,692 |
11/30/24 |
$33,897 |
$34,611 |
12/31/24 |
$33,088 |
$33,786 |
01/31/25 |
$34,011 |
$34,727 |
02/28/25 |
$33,567 |
$34,274 |
03/31/25 |
$31,664 |
$32,343 |
04/30/25 |
$31,444 |
$32,124 |
05/31/25 |
$33,416 |
$34,146 |
06/30/25 |
$35,112 |
$35,882 |
07/31/25 |
$35,893 |
$36,687 |
08/31/25 |
$36,616 |
$37,431 |
09/30/25 |
$37,949 |
$38,797 |
10/31/25 |
$38,832 |
$39,706 |
11/30/25 |
$38,919 |
$39,803 |
12/31/25 |
$38,933 |
$39,827 |
|
| Average Annual Return [Table Text Block] |
Name |
1 Year |
5 Years |
10 Years |
SSSWX |
17.66% |
14.17% |
14.56% |
S&P 500 Index |
17.88% |
14.42% |
14.82% | |
| Updated Performance Information Location [Text Block] |
Updated performance information is available by calling 1-800-647-7327 or visiting our website at www.ssga.com.
|
| AssetsNet |
$ 13,629,954,117
|
| Holdings Count | Holding |
506
|
| Advisory Fees Paid, Amount |
$ 0
|
| InvestmentCompanyPortfolioTurnover |
2.00%
|
| Additional Fund Statistics [Text Block] |
Key Fund Statistics as of 12/31/2025- Total Net Assets$13,629,954,117
- Number of Portfolio Holdings506
- Portfolio Turnover Rate2%
- Total Advisory Fees Paid$0
Portfolio holdings and portfolio turnover rate are from the corresponding Portfolio, in which the Fund invests. |
| Holdings [Text Block] |
Sectors |
% |
Information Technology |
33.7% |
Financials |
13.2% |
Communication Services |
10.4% |
Consumer Discretionary |
10.2% |
Health Care |
9.4% |
Industrials |
8.0% |
Consumer Staples |
4.6% |
Energy |
2.7% |
Utilities |
2.2% |
Materials |
1.8% | |
| Largest Holdings [Text Block] |
Holdings |
% |
NVIDIA Corp. |
7.6% |
Apple, Inc. |
6.7% |
Microsoft Corp. |
6.0% |
Amazon.com, Inc. |
3.8% |
Alphabet, Inc., Class A |
3.0% |
Broadcom, Inc. |
2.7% |
Alphabet, Inc., Class C |
2.4% |
Meta Platforms, Inc., Class A |
2.4% |
Tesla, Inc. |
2.1% |
Berkshire Hathaway, Inc., Class B |
1.5% | |
| Material Fund Change [Text Block] |
|
| C000136666 |
|
| Shareholder Report [Line Items] |
|
| Fund Name |
State Street Equity 500 Index Fund
|
| Class Name |
Class K
|
| Trading Symbol |
SSSYX
|
| Annual or Semi-Annual Statement [Text Block] |
This annual shareholder report contains important information about the State Street Equity 500 Index Fund (the "Fund") for the period of January 1, 2025 through December 31, 2025.
|
| Additional Information [Text Block] |
You can find additional information about the Fund, including the Prospectus, Statement of Additional Information, financial statements and other information at www.ssga.com/us/en/institutional/fund-finder?tab=documents&type=mf. You can also request this information about the Fund by contacting us at 1-800-647-7327.
|
| Additional Information Phone Number |
1-800-647-7327
|
| Additional Information Website |
www.ssga.com/us/en/institutional/fund-finder?tab=documents&type=mf
|
| Expenses [Text Block] |
What were the Fund costs for the last year? (based on a hypothetical $10,000 Investment)
Class Name |
Costs of a $10,000 investment |
Costs paid as a percentage of a $10,000 investment |
Class K |
$1 |
0.01% | The expense table reflects expenses from both the Fund and the affiliated Portfolio, in which the Fund invests. |
| Expenses Paid, Amount |
$ 1
|
| Expense Ratio, Percent |
0.01%
|
| Expenses Represent Both Master and Feeder [Text] |
The expense table reflects expenses from both the Fund and the affiliated Portfolio, in which the Fund invests.
|
| Factors Affecting Performance [Text Block] |
How did the Fund perform last year and what affected its performance?In 2025, the S&P 500 delivered another year of strong performance, rising almost 18% and marking its third consecutive year of double‑digit gains. The Index reached multiple record highs despite notable volatility. Early in the year, markets were shaken by the April 2 “Liberation Day” tariff shock, which triggered a sharp pullback, but equities rebounded swiftly as investors grew confident that corporate adaptability, easing trade tensions, and emerging policy clarity would offset early disruptions. Momentum strengthened through the second half of the year as the U.S. Federal Reserve implemented three interest‑rate cuts. Technology remained the primary engine of market gains, driven by ongoing investment in Artificial Intelligence ("A.I.") and robust earnings across mega‑cap names, while other sectors experienced more uneven results. Overall, 2025 underscored the durability of the bull market, with resilient corporate earnings, increased productivity expectations, and optimism around A.I. deployment contributing to a strong finish. |
| Performance Past Does Not Indicate Future [Text] |
The Fund’s past performance is not necessarily an indication of how the Fund will perform in the future. The returns do not reflect the deduction of taxes that a shareholder would pay on Fund distributions or on the redemption or sale of Fund shares.
|
| Line Graph [Table Text Block] |
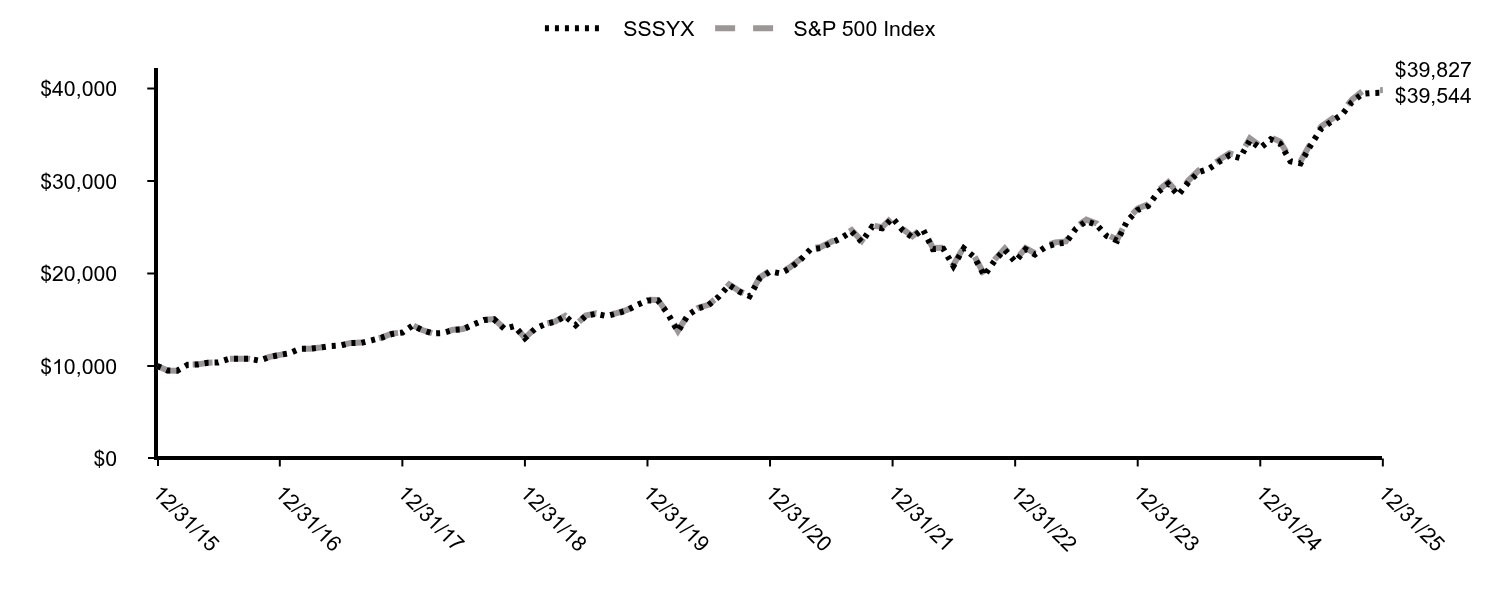
|
SSSYX |
S&P 500 Index |
12/31/15 |
$10,000 |
$10,000 |
01/31/16 |
$9,505 |
$9,504 |
02/29/16 |
$9,493 |
$9,491 |
03/31/16 |
$10,134 |
$10,135 |
04/30/16 |
$10,169 |
$10,174 |
05/31/16 |
$10,355 |
$10,357 |
06/30/16 |
$10,384 |
$10,384 |
07/31/16 |
$10,763 |
$10,766 |
08/31/16 |
$10,780 |
$10,782 |
09/30/16 |
$10,780 |
$10,784 |
10/31/16 |
$10,577 |
$10,587 |
11/30/16 |
$10,973 |
$10,979 |
12/31/16 |
$11,192 |
$11,196 |
01/31/17 |
$11,400 |
$11,408 |
02/28/17 |
$11,852 |
$11,861 |
03/31/17 |
$11,863 |
$11,875 |
04/30/17 |
$11,982 |
$11,997 |
05/31/17 |
$12,149 |
$12,166 |
06/30/17 |
$12,220 |
$12,242 |
07/31/17 |
$12,476 |
$12,494 |
08/31/17 |
$12,505 |
$12,532 |
09/30/17 |
$12,773 |
$12,790 |
10/31/17 |
$13,070 |
$13,089 |
11/30/17 |
$13,462 |
$13,490 |
12/31/17 |
$13,610 |
$13,640 |
01/31/18 |
$14,391 |
$14,421 |
02/28/18 |
$13,874 |
$13,890 |
03/31/18 |
$13,516 |
$13,537 |
04/30/18 |
$13,560 |
$13,589 |
05/31/18 |
$13,893 |
$13,916 |
06/30/18 |
$13,975 |
$14,002 |
07/31/18 |
$14,485 |
$14,523 |
08/31/18 |
$14,964 |
$14,996 |
09/30/18 |
$15,045 |
$15,081 |
10/31/18 |
$14,013 |
$14,050 |
11/30/18 |
$14,309 |
$14,337 |
12/31/18 |
$13,008 |
$13,042 |
01/31/19 |
$14,048 |
$14,087 |
02/28/19 |
$14,498 |
$14,540 |
03/31/19 |
$14,790 |
$14,822 |
04/30/19 |
$15,386 |
$15,422 |
05/31/19 |
$14,412 |
$14,442 |
06/30/19 |
$15,412 |
$15,460 |
07/31/19 |
$15,637 |
$15,682 |
08/31/19 |
$15,392 |
$15,434 |
09/30/19 |
$15,677 |
$15,723 |
10/31/19 |
$16,008 |
$16,063 |
11/30/19 |
$16,598 |
$16,646 |
12/31/19 |
$17,091 |
$17,149 |
01/31/20 |
$17,091 |
$17,142 |
02/29/20 |
$15,687 |
$15,731 |
03/31/20 |
$13,743 |
$13,788 |
04/30/20 |
$15,508 |
$15,555 |
05/31/20 |
$16,243 |
$16,296 |
06/30/20 |
$16,564 |
$16,620 |
07/31/20 |
$17,500 |
$17,558 |
08/31/20 |
$18,753 |
$18,820 |
09/30/20 |
$18,039 |
$18,105 |
10/31/20 |
$17,559 |
$17,623 |
11/30/20 |
$19,473 |
$19,552 |
12/31/20 |
$20,221 |
$20,304 |
01/31/21 |
$20,012 |
$20,099 |
02/28/21 |
$20,550 |
$20,653 |
03/31/21 |
$21,451 |
$21,558 |
04/30/21 |
$22,592 |
$22,708 |
05/31/21 |
$22,751 |
$22,867 |
06/30/21 |
$23,280 |
$23,401 |
07/31/21 |
$23,831 |
$23,956 |
08/31/21 |
$24,555 |
$24,685 |
09/30/21 |
$23,413 |
$23,537 |
10/31/21 |
$25,052 |
$25,186 |
11/30/21 |
$24,879 |
$25,011 |
12/31/21 |
$25,986 |
$26,132 |
01/31/22 |
$24,639 |
$24,780 |
02/28/22 |
$23,901 |
$24,038 |
03/31/22 |
$24,789 |
$24,931 |
04/30/22 |
$22,626 |
$22,757 |
05/31/22 |
$22,676 |
$22,798 |
06/30/22 |
$20,801 |
$20,916 |
07/31/22 |
$22,714 |
$22,845 |
08/31/22 |
$21,790 |
$21,913 |
09/30/22 |
$19,785 |
$19,895 |
10/31/22 |
$21,383 |
$21,506 |
11/30/22 |
$22,577 |
$22,708 |
12/31/22 |
$21,269 |
$21,399 |
01/31/23 |
$22,605 |
$22,744 |
02/28/23 |
$22,053 |
$22,189 |
03/31/23 |
$22,860 |
$23,004 |
04/30/23 |
$23,216 |
$23,363 |
05/31/23 |
$23,320 |
$23,464 |
06/30/23 |
$24,860 |
$25,015 |
07/31/23 |
$25,656 |
$25,818 |
08/31/23 |
$25,252 |
$25,407 |
09/30/23 |
$24,050 |
$24,196 |
10/31/23 |
$23,545 |
$23,687 |
11/30/23 |
$25,693 |
$25,850 |
12/31/23 |
$26,855 |
$27,025 |
01/31/24 |
$27,306 |
$27,479 |
02/29/24 |
$28,764 |
$28,946 |
03/31/24 |
$29,688 |
$29,878 |
04/30/24 |
$28,479 |
$28,657 |
05/31/24 |
$29,889 |
$30,078 |
06/30/24 |
$30,961 |
$31,157 |
07/31/24 |
$31,337 |
$31,537 |
08/31/24 |
$32,098 |
$32,302 |
09/30/24 |
$32,780 |
$32,992 |
10/31/24 |
$32,482 |
$32,692 |
11/30/24 |
$34,387 |
$34,611 |
12/31/24 |
$33,566 |
$33,786 |
01/31/25 |
$34,503 |
$34,727 |
02/28/25 |
$34,053 |
$34,274 |
03/31/25 |
$32,128 |
$32,343 |
04/30/25 |
$31,908 |
$32,124 |
05/31/25 |
$33,913 |
$34,146 |
06/30/25 |
$35,636 |
$35,882 |
07/31/25 |
$36,434 |
$36,687 |
08/31/25 |
$37,170 |
$37,431 |
09/30/25 |
$38,527 |
$38,797 |
10/31/25 |
$39,428 |
$39,706 |
11/30/25 |
$39,519 |
$39,803 |
12/31/25 |
$39,544 |
$39,827 |
|
| Average Annual Return [Table Text Block] |
Name |
1 Year |
5 Years |
10 Years |
SSSYX |
17.81% |
14.36% |
14.74% |
S&P 500 Index |
17.88% |
14.42% |
14.82% | |
| Updated Performance Information Location [Text Block] |
Updated performance information is available by calling 1-800-647-7327 or visiting our website at www.ssga.com.
|
| AssetsNet |
$ 13,629,954,117
|
| Holdings Count | Holding |
506
|
| Advisory Fees Paid, Amount |
$ 0
|
| InvestmentCompanyPortfolioTurnover |
2.00%
|
| Additional Fund Statistics [Text Block] |
Key Fund Statistics as of 12/31/2025- Total Net Assets$13,629,954,117
- Number of Portfolio Holdings506
- Portfolio Turnover Rate2%
- Total Advisory Fees Paid$0
Portfolio holdings and portfolio turnover rate are from the corresponding Portfolio, in which the Fund invests. |
| Holdings [Text Block] |
Sectors |
% |
Information Technology |
33.7% |
Financials |
13.2% |
Communication Services |
10.4% |
Consumer Discretionary |
10.2% |
Health Care |
9.4% |
Industrials |
8.0% |
Consumer Staples |
4.6% |
Energy |
2.7% |
Utilities |
2.2% |
Materials |
1.8% | |
| Largest Holdings [Text Block] |
Holdings |
% |
NVIDIA Corp. |
7.6% |
Apple, Inc. |
6.7% |
Microsoft Corp. |
6.0% |
Amazon.com, Inc. |
3.8% |
Alphabet, Inc., Class A |
3.0% |
Broadcom, Inc. |
2.7% |
Alphabet, Inc., Class C |
2.4% |
Meta Platforms, Inc., Class A |
2.4% |
Tesla, Inc. |
2.1% |
Berkshire Hathaway, Inc., Class B |
1.5% | |
| Material Fund Change [Text Block] |
|
| C000029583 |
|
| Shareholder Report [Line Items] |
|
| Fund Name |
State Street Equity 500 Index Fund
|
| Class Name |
Class R Shares
|
| Trading Symbol |
SSFRX
|
| Annual or Semi-Annual Statement [Text Block] |
This annual shareholder report contains important information about the State Street Equity 500 Index Fund (the "Fund") for the period of January 1, 2025 through December 31, 2025.
|
| Additional Information [Text Block] |
You can find additional information about the Fund, including the Prospectus, Statement of Additional Information, financial statements and other information at www.ssga.com/us/en/institutional/fund-finder?tab=documents&type=mf. You can also request this information about the Fund by contacting us at 1-800-647-7327.
|
| Additional Information Phone Number |
1-800-647-7327
|
| Additional Information Website |
www.ssga.com/us/en/institutional/fund-finder?tab=documents&type=mf
|
| Expenses [Text Block] |
What were the Fund costs for the last year? (based on a hypothetical $10,000 Investment)
Class Name |
Costs of a $10,000 investment |
Costs paid as a percentage of a $10,000 investment |
Class R Shares |
$66 |
0.61% | The expense table reflects expenses from both the Fund and the affiliated Portfolio, in which the Fund invests. |
| Expenses Paid, Amount |
$ 66
|
| Expense Ratio, Percent |
0.61%
|
| Expenses Represent Both Master and Feeder [Text] |
The expense table reflects expenses from both the Fund and the affiliated Portfolio, in which the Fund invests.
|
| Factors Affecting Performance [Text Block] |
How did the Fund perform last year and what affected its performance?In 2025, the S&P 500 delivered another year of strong performance, rising almost 18% and marking its third consecutive year of double‑digit gains. The Index reached multiple record highs despite notable volatility. Early in the year, markets were shaken by the April 2 “Liberation Day” tariff shock, which triggered a sharp pullback, but equities rebounded swiftly as investors grew confident that corporate adaptability, easing trade tensions, and emerging policy clarity would offset early disruptions. Momentum strengthened through the second half of the year as the U.S. Federal Reserve implemented three interest‑rate cuts. Technology remained the primary engine of market gains, driven by ongoing investment in Artificial Intelligence ("A.I.") and robust earnings across mega‑cap names, while other sectors experienced more uneven results. Overall, 2025 underscored the durability of the bull market, with resilient corporate earnings, increased productivity expectations, and optimism around A.I. deployment contributing to a strong finish. |
| Performance Past Does Not Indicate Future [Text] |
The Fund’s past performance is not necessarily an indication of how the Fund will perform in the future. The returns do not reflect the deduction of taxes that a shareholder would pay on Fund distributions or on the redemption or sale of Fund shares.
|
| Line Graph [Table Text Block] |
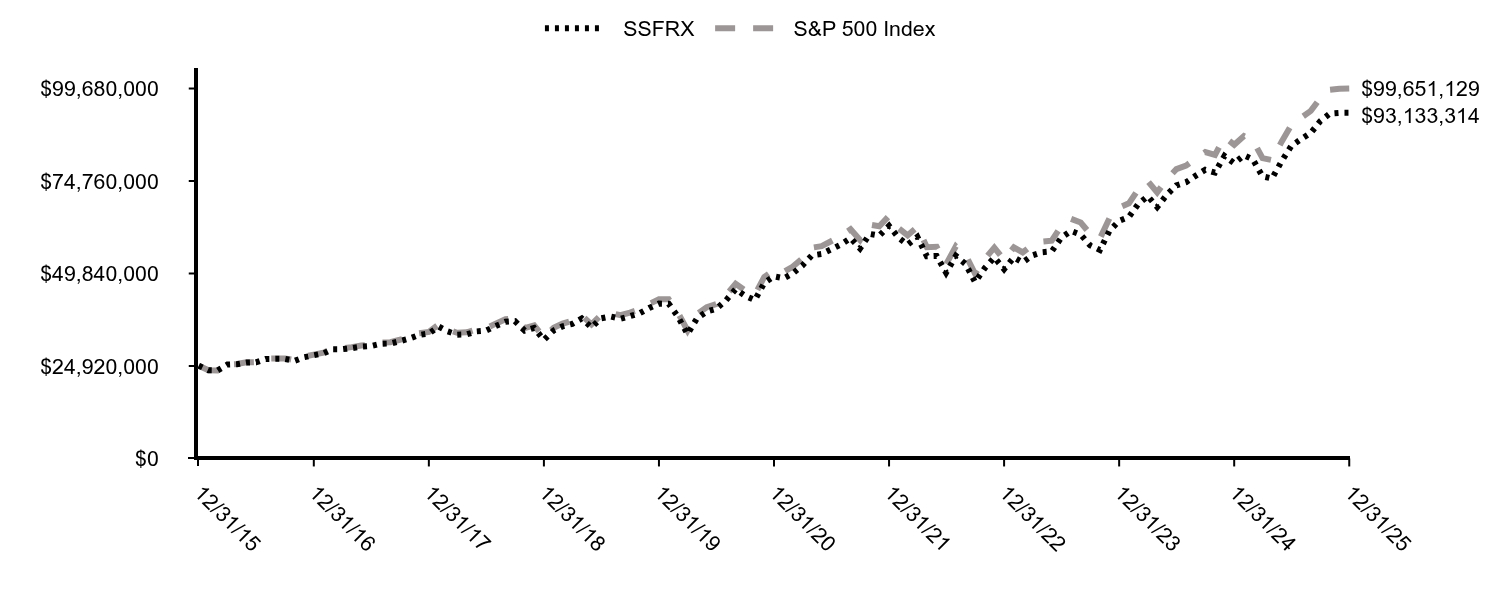
|
SSFRX |
S&P 500 Index |
12/31/15 |
$25,000,000 |
$25,000,000 |
01/31/16 |
$23,760,933 |
$23,760,000 |
02/29/16 |
$23,717,201 |
$23,729,112 |
03/31/16 |
$25,306,122 |
$25,337,946 |
04/30/16 |
$25,393,586 |
$25,436,764 |
05/31/16 |
$25,830,904 |
$25,894,626 |
06/30/16 |
$25,889,213 |
$25,961,952 |
07/31/16 |
$26,822,157 |
$26,919,948 |
08/31/16 |
$26,851,312 |
$26,957,635 |
09/30/16 |
$26,836,735 |
$26,963,027 |
10/31/16 |
$26,311,953 |
$26,472,300 |
11/30/16 |
$27,288,630 |
$27,451,775 |
12/31/16 |
$27,815,120 |
$27,995,320 |
01/31/17 |
$28,317,892 |
$28,527,231 |
02/28/17 |
$29,441,736 |
$29,659,762 |
03/31/17 |
$29,441,736 |
$29,695,354 |
04/30/17 |
$29,722,696 |
$30,001,216 |
05/31/17 |
$30,121,956 |
$30,424,233 |
06/30/17 |
$30,284,618 |
$30,612,864 |
07/31/17 |
$30,905,689 |
$31,243,489 |
08/31/17 |
$30,964,839 |
$31,340,343 |
09/30/17 |
$31,600,698 |
$31,985,954 |
10/31/17 |
$32,325,281 |
$32,731,227 |
11/30/17 |
$33,286,462 |
$33,736,076 |
12/31/17 |
$33,645,037 |
$34,110,546 |
01/31/18 |
$35,544,479 |
$36,065,081 |
02/28/18 |
$34,252,236 |
$34,734,279 |
03/31/18 |
$33,349,222 |
$33,852,028 |
04/30/18 |
$33,442,638 |
$33,980,666 |
05/31/18 |
$34,236,667 |
$34,799,600 |
06/30/18 |
$34,423,497 |
$35,015,358 |
07/31/18 |
$35,669,033 |
$36,317,929 |
08/31/18 |
$36,821,154 |
$37,501,894 |
09/30/18 |
$37,007,984 |
$37,715,654 |
10/31/18 |
$34,454,636 |
$35,135,904 |
11/30/18 |
$35,155,249 |
$35,852,676 |
12/31/18 |
$31,949,348 |
$32,615,179 |
01/31/19 |
$34,489,663 |
$35,227,655 |
02/28/19 |
$35,580,696 |
$36,358,463 |
03/31/19 |
$36,264,627 |
$37,063,817 |
04/30/19 |
$37,713,909 |
$38,564,902 |
05/31/19 |
$35,303,866 |
$36,116,030 |
06/30/19 |
$37,746,477 |
$38,662,211 |
07/31/19 |
$38,267,567 |
$39,218,946 |
08/31/19 |
$37,648,773 |
$38,599,287 |
09/30/19 |
$38,332,704 |
$39,321,094 |
10/31/19 |
$39,130,623 |
$40,174,362 |
11/30/19 |
$40,531,053 |
$41,632,691 |
12/31/19 |
$41,719,034 |
$42,889,998 |
01/31/20 |
$41,702,130 |
$42,872,842 |
02/29/20 |
$38,253,717 |
$39,344,407 |
03/31/20 |
$33,503,697 |
$34,485,373 |
04/30/20 |
$37,787,167 |
$38,906,398 |
05/31/20 |
$39,560,395 |
$40,758,342 |
06/30/20 |
$40,319,384 |
$41,569,433 |
07/31/20 |
$42,576,066 |
$43,913,949 |
08/31/20 |
$45,601,879 |
$47,071,362 |
09/30/20 |
$43,845,555 |
$45,282,650 |
10/31/20 |
$42,657,205 |
$44,078,132 |
11/30/20 |
$47,282,135 |
$48,904,687 |
12/31/20 |
$49,074,318 |
$50,782,627 |
01/31/21 |
$48,541,943 |
$50,269,723 |
02/28/21 |
$49,824,093 |
$51,657,167 |
03/31/21 |
$51,982,692 |
$53,919,751 |
04/30/21 |
$54,721,596 |
$56,799,066 |
05/31/21 |
$55,079,365 |
$57,196,659 |
06/30/21 |
$56,328,991 |
$58,529,342 |
07/31/21 |
$57,633,394 |
$59,922,340 |
08/31/21 |
$59,353,768 |
$61,743,979 |
09/30/21 |
$56,566,933 |
$58,872,884 |
10/31/21 |
$60,495,549 |
$62,999,873 |
11/30/21 |
$60,047,053 |
$62,565,174 |
12/31/21 |
$62,688,183 |
$65,368,094 |
01/31/22 |
$59,408,313 |
$61,988,563 |
02/28/22 |
$57,602,286 |
$60,135,105 |
03/31/22 |
$59,712,523 |
$62,366,118 |
04/30/22 |
$54,476,269 |
$56,927,792 |
05/31/22 |
$54,567,182 |
$57,030,262 |
06/30/22 |
$50,030,262 |
$52,325,266 |
07/31/22 |
$54,605,646 |
$57,149,655 |
08/31/22 |
$52,355,543 |
$54,817,949 |
09/30/22 |
$47,514,412 |
$49,769,216 |
10/31/22 |
$51,327,524 |
$53,800,523 |
11/30/22 |
$54,166,814 |
$56,807,972 |
12/31/22 |
$51,001,268 |
$53,535,833 |
01/31/23 |
$54,179,304 |
$56,897,883 |
02/28/23 |
$52,829,971 |
$55,509,575 |
03/31/23 |
$54,735,017 |
$57,546,776 |
04/30/23 |
$55,562,372 |
$58,444,506 |
05/31/23 |
$55,780,751 |
$58,695,817 |
06/30/23 |
$59,436,380 |
$62,575,611 |
07/31/23 |
$61,309,469 |
$64,584,288 |
08/31/23 |
$60,311,672 |
$63,557,397 |
09/30/23 |
$57,412,379 |
$60,525,710 |
10/31/23 |
$56,178,449 |
$59,254,670 |
11/30/23 |
$61,273,960 |
$64,664,621 |
12/31/23 |
$64,014,024 |
$67,600,395 |
01/31/24 |
$65,054,070 |
$68,736,081 |
02/29/24 |
$68,495,742 |
$72,406,588 |
03/31/24 |
$70,662,055 |
$74,738,080 |
04/30/24 |
$67,748,489 |
$71,688,767 |
05/31/24 |
$71,068,015 |
$75,244,529 |
06/30/24 |
$73,579,214 |
$77,945,808 |
07/31/24 |
$74,437,836 |
$78,896,747 |
08/31/24 |
$76,205,375 |
$80,813,938 |
09/30/24 |
$77,784,305 |
$82,543,356 |
10/31/24 |
$77,040,645 |
$81,792,212 |
11/30/24 |
$81,516,974 |
$86,593,414 |
12/31/24 |
$79,531,368 |
$84,532,491 |
01/31/25 |
$81,709,788 |
$86,882,494 |
02/28/25 |
$80,605,160 |
$85,753,022 |
03/31/25 |
$76,010,708 |
$80,925,127 |
04/30/25 |
$75,452,045 |
$80,374,836 |
05/31/25 |
$80,151,700 |
$85,430,413 |
06/30/25 |
$84,185,677 |
$89,778,821 |
07/31/25 |
$86,024,909 |
$91,789,867 |
08/31/25 |
$87,719,034 |
$93,653,201 |
09/30/25 |
$90,876,926 |
$97,071,543 |
10/31/25 |
$92,953,771 |
$99,343,017 |
11/30/25 |
$93,124,272 |
$99,591,375 |
12/31/25 |
$93,133,314 |
$99,651,129 |
|
| Average Annual Return [Table Text Block] |
Name |
1 Year |
5 Years |
10 Years |
SSFRX |
17.10% |
13.67% |
14.06% |
S&P 500 Index |
17.88% |
14.42% |
14.82% | |
| Updated Performance Information Location [Text Block] |
Updated performance information is available by calling 1-800-647-7327 or visiting our website at www.ssga.com.
|
| AssetsNet |
$ 13,629,954,117
|
| Holdings Count | Holding |
506
|
| Advisory Fees Paid, Amount |
$ 0
|
| InvestmentCompanyPortfolioTurnover |
2.00%
|
| Additional Fund Statistics [Text Block] |
Key Fund Statistics as of 12/31/2025- Total Net Assets$13,629,954,117
- Number of Portfolio Holdings506
- Portfolio Turnover Rate2%
- Total Advisory Fees Paid$0
Portfolio holdings and portfolio turnover rate are from the corresponding Portfolio, in which the Fund invests. |
| Holdings [Text Block] |
Sectors |
% |
Information Technology |
33.7% |
Financials |
13.2% |
Communication Services |
10.4% |
Consumer Discretionary |
10.2% |
Health Care |
9.4% |
Industrials |
8.0% |
Consumer Staples |
4.6% |
Energy |
2.7% |
Utilities |
2.2% |
Materials |
1.8% | |
| Largest Holdings [Text Block] |
Holdings |
% |
NVIDIA Corp. |
7.6% |
Apple, Inc. |
6.7% |
Microsoft Corp. |
6.0% |
Amazon.com, Inc. |
3.8% |
Alphabet, Inc., Class A |
3.0% |
Broadcom, Inc. |
2.7% |
Alphabet, Inc., Class C |
2.4% |
Meta Platforms, Inc., Class A |
2.4% |
Tesla, Inc. |
2.1% |
Berkshire Hathaway, Inc., Class B |
1.5% | |
| Material Fund Change [Text Block] |
|
| C000029582 |
|
| Shareholder Report [Line Items] |
|
| Fund Name |
State Street Equity 500 Index Fund
|
| Class Name |
Service Shares
|
| Trading Symbol |
STBIX
|
| Annual or Semi-Annual Statement [Text Block] |
This annual shareholder report contains important information about the State Street Equity 500 Index Fund (the "Fund") for the period of January 1, 2025 through December 31, 2025.
|
| Additional Information [Text Block] |
You can find additional information about the Fund, including the Prospectus, Statement of Additional Information, financial statements and other information at www.ssga.com/us/en/institutional/fund-finder?tab=documents&type=mf. You can also request this information about the Fund by contacting us at 1-800-647-7327.
|
| Additional Information Phone Number |
1-800-647-7327
|
| Additional Information Website |
www.ssga.com/us/en/institutional/fund-finder?tab=documents&type=mf
|
| Expenses [Text Block] |
What were the Fund costs for the last year? (based on a hypothetical $10,000 Investment)
Class Name |
Costs of a $10,000 investment |
Costs paid as a percentage of a $10,000 investment |
Service Shares |
$28 |
0.26% | The expense table reflects expenses from both the Fund and the affiliated Portfolio, in which the Fund invests. |
| Expenses Paid, Amount |
$ 28
|
| Expense Ratio, Percent |
0.26%
|
| Expenses Represent Both Master and Feeder [Text] |
The expense table reflects expenses from both the Fund and the affiliated Portfolio, in which the Fund invests.
|
| Factors Affecting Performance [Text Block] |
How did the Fund perform last year and what affected its performance?In 2025, the S&P 500 delivered another year of strong performance, rising almost 18% and marking its third consecutive year of double‑digit gains. The Index reached multiple record highs despite notable volatility. Early in the year, markets were shaken by the April 2 “Liberation Day” tariff shock, which triggered a sharp pullback, but equities rebounded swiftly as investors grew confident that corporate adaptability, easing trade tensions, and emerging policy clarity would offset early disruptions. Momentum strengthened through the second half of the year as the U.S. Federal Reserve implemented three interest‑rate cuts. Technology remained the primary engine of market gains, driven by ongoing investment in Artificial Intelligence ("A.I.") and robust earnings across mega‑cap names, while other sectors experienced more uneven results. Overall, 2025 underscored the durability of the bull market, with resilient corporate earnings, increased productivity expectations, and optimism around A.I. deployment contributing to a strong finish. |
| Performance Past Does Not Indicate Future [Text] |
The Fund’s past performance is not necessarily an indication of how the Fund will perform in the future. The returns do not reflect the deduction of taxes that a shareholder would pay on Fund distributions or on the redemption or sale of Fund shares.
|
| Line Graph [Table Text Block] |
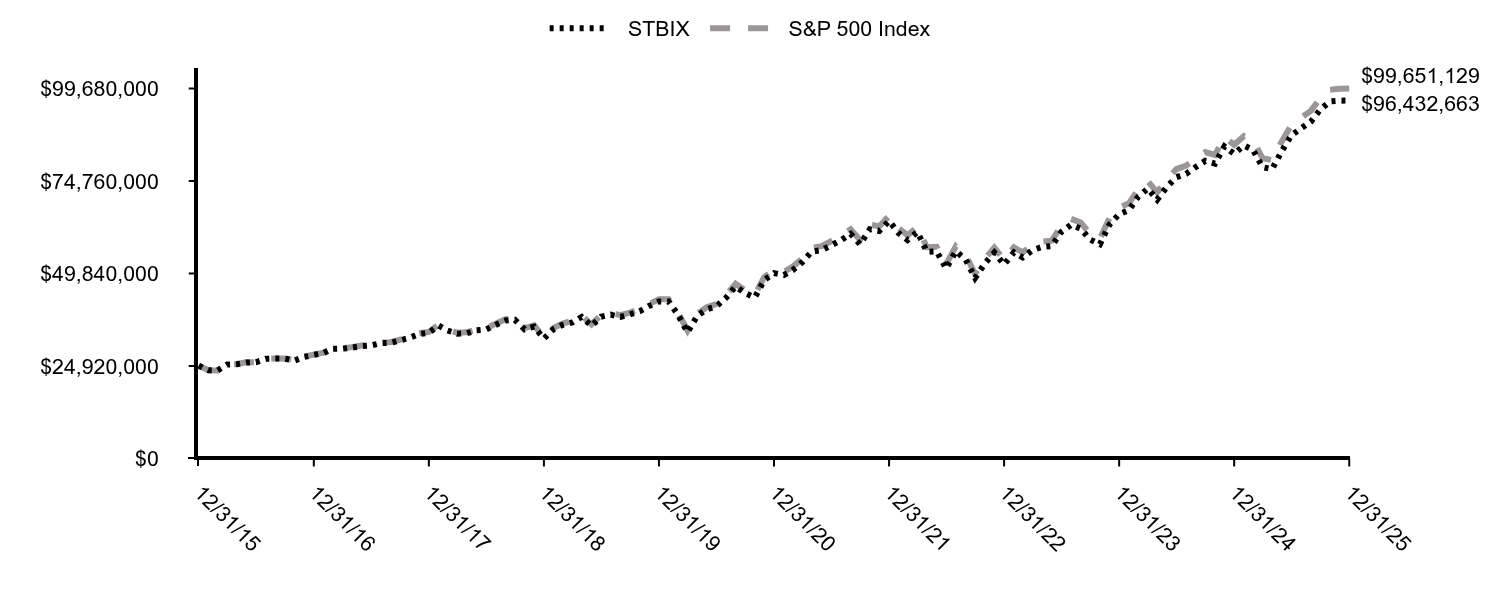
|
STBIX |
S&P 500 Index |
12/31/15 |
$25,000,000 |
$25,000,000 |
01/31/16 |
$23,760,933 |
$23,760,000 |
02/29/16 |
$23,731,778 |
$23,729,112 |
03/31/16 |
$25,320,700 |
$25,337,946 |
04/30/16 |
$25,408,163 |
$25,436,764 |
05/31/16 |
$25,860,058 |
$25,894,626 |
06/30/16 |
$25,932,945 |
$25,961,952 |
07/31/16 |
$26,865,889 |
$26,919,948 |
08/31/16 |
$26,909,621 |
$26,957,635 |
09/30/16 |
$26,895,044 |
$26,963,027 |
10/31/16 |
$26,384,840 |
$26,472,300 |
11/30/16 |
$27,376,093 |
$27,451,775 |
12/31/16 |
$27,913,122 |
$27,995,320 |
01/31/17 |
$28,417,666 |
$28,527,231 |
02/28/17 |
$29,545,469 |
$29,659,762 |
03/31/17 |
$29,575,148 |
$29,695,354 |
04/30/17 |
$29,857,098 |
$30,001,216 |
05/31/17 |
$30,272,605 |
$30,424,233 |
06/30/17 |
$30,435,839 |
$30,612,864 |
07/31/17 |
$31,073,938 |
$31,243,489 |
08/31/17 |
$31,133,296 |
$31,340,343 |
09/30/17 |
$31,801,074 |
$31,985,954 |
10/31/17 |
$32,528,211 |
$32,731,227 |
11/30/17 |
$33,507,618 |
$33,736,076 |
12/31/17 |
$33,867,223 |
$34,110,546 |
01/31/18 |
$35,795,773 |
$36,065,081 |
02/28/18 |
$34,494,393 |
$34,734,279 |
03/31/18 |
$33,616,354 |
$33,852,028 |
04/30/18 |
$33,710,430 |
$33,980,666 |
05/31/18 |
$34,525,752 |
$34,799,600 |
06/30/18 |
$34,729,582 |
$35,015,358 |
07/31/18 |
$35,983,924 |
$36,317,929 |
08/31/18 |
$37,159,869 |
$37,501,894 |
09/30/18 |
$37,363,700 |
$37,715,654 |
10/31/18 |
$34,792,299 |
$35,135,904 |
11/30/18 |
$35,513,546 |
$35,852,676 |
12/31/18 |
$32,288,072 |
$32,615,179 |
01/31/19 |
$34,855,319 |
$35,227,655 |
02/28/19 |
$35,974,376 |
$36,358,463 |
03/31/19 |
$36,665,558 |
$37,063,817 |
04/30/19 |
$38,146,662 |
$38,564,902 |
05/31/19 |
$35,727,525 |
$36,116,030 |
06/30/19 |
$38,196,032 |
$38,662,211 |
07/31/19 |
$38,739,104 |
$39,218,946 |
08/31/19 |
$38,130,205 |
$38,599,287 |
09/30/19 |
$38,837,844 |
$39,321,094 |
10/31/19 |
$39,644,223 |
$40,174,362 |
11/30/19 |
$41,092,414 |
$41,632,691 |
12/31/19 |
$42,293,060 |
$42,889,998 |
01/31/20 |
$42,293,060 |
$42,872,842 |
02/29/20 |
$38,812,926 |
$39,344,407 |
03/31/20 |
$33,995,597 |
$34,485,373 |
04/30/20 |
$38,356,909 |
$38,906,398 |
05/31/20 |
$40,168,978 |
$40,758,342 |
06/30/20 |
$40,952,437 |
$41,569,433 |
07/31/20 |
$43,256,526 |
$43,913,949 |
08/31/20 |
$46,344,074 |
$47,071,362 |
09/30/20 |
$44,571,434 |
$45,282,650 |
10/31/20 |
$43,376,531 |
$44,078,132 |
11/30/20 |
$48,092,713 |
$48,904,687 |
12/31/20 |
$49,929,960 |
$50,782,627 |
01/31/21 |
$49,403,813 |
$50,269,723 |
02/28/21 |
$50,722,665 |
$51,657,167 |
03/31/21 |
$52,935,270 |
$53,919,751 |
04/30/21 |
$55,740,226 |
$56,799,066 |
05/31/21 |
$56,121,770 |
$57,196,659 |
06/30/21 |
$57,412,746 |
$58,529,342 |
07/31/21 |
$58,759,474 |
$59,922,340 |
08/31/21 |
$60,529,558 |
$61,743,979 |
09/30/21 |
$57,705,437 |
$58,872,884 |
10/31/21 |
$61,729,939 |
$62,999,873 |
11/30/21 |
$61,289,161 |
$62,565,174 |
12/31/21 |
$64,005,322 |
$65,368,094 |
01/31/22 |
$60,675,060 |
$61,988,563 |
02/28/22 |
$58,846,541 |
$60,135,105 |
03/31/22 |
$61,021,479 |
$62,366,118 |
04/30/22 |
$55,685,916 |
$56,927,792 |
05/31/22 |
$55,794,842 |
$57,030,262 |
06/30/22 |
$51,171,759 |
$52,325,266 |
07/31/22 |
$55,866,268 |
$57,149,655 |
08/31/22 |
$53,580,619 |
$54,817,949 |
09/30/22 |
$48,641,474 |
$49,769,216 |
10/31/22 |
$52,559,219 |
$53,800,523 |
11/30/22 |
$55,482,351 |
$56,807,972 |
12/31/22 |
$52,256,811 |
$53,535,833 |
01/31/23 |
$55,528,776 |
$56,897,883 |
02/28/23 |
$54,160,302 |
$55,509,575 |
03/31/23 |
$56,131,124 |
$57,546,776 |
04/30/23 |
$56,993,699 |
$58,444,506 |
05/31/23 |
$57,235,730 |
$58,695,817 |
06/30/23 |
$61,004,495 |
$62,575,611 |
07/31/23 |
$62,946,201 |
$64,584,288 |
08/31/23 |
$61,939,862 |
$63,557,397 |
09/30/23 |
$58,979,080 |
$60,525,710 |
10/31/23 |
$57,728,891 |
$59,254,670 |
11/30/23 |
$62,982,596 |
$64,664,621 |
12/31/23 |
$65,819,373 |
$67,600,395 |
01/31/24 |
$66,907,617 |
$68,736,081 |
02/29/24 |
$70,466,120 |
$72,406,588 |
03/31/24 |
$72,716,513 |
$74,738,080 |
04/30/24 |
$69,738,160 |
$71,688,767 |
05/31/24 |
$73,178,416 |
$75,244,529 |
06/30/24 |
$75,785,398 |
$77,945,808 |
07/31/24 |
$76,690,729 |
$78,896,747 |
08/31/24 |
$78,536,494 |
$80,813,938 |
09/30/24 |
$80,186,413 |
$82,543,356 |
10/31/24 |
$79,441,825 |
$81,792,212 |
11/30/24 |
$84,084,877 |
$86,593,414 |
12/31/24 |
$82,061,214 |
$84,532,491 |
01/31/25 |
$84,332,267 |
$86,882,494 |
02/28/25 |
$83,214,527 |
$85,753,022 |
03/31/25 |
$78,494,556 |
$80,925,127 |
04/30/25 |
$77,940,367 |
$80,374,836 |
05/31/25 |
$82,821,352 |
$85,430,413 |
06/30/25 |
$87,011,473 |
$89,778,821 |
07/31/25 |
$88,939,902 |
$91,789,867 |
08/31/25 |
$90,718,550 |
$93,653,201 |
09/30/25 |
$94,011,858 |
$97,071,543 |
10/31/25 |
$96,189,298 |
$99,343,017 |
11/30/25 |
$96,393,374 |
$99,591,375 |
12/31/25 |
$96,432,663 |
$99,651,129 |
|
| Average Annual Return [Table Text Block] |
Name |
1 Year |
5 Years |
10 Years |
STBIX |
17.51% |
14.07% |
14.45% |
S&P 500 Index |
17.88% |
14.42% |
14.82% | |
| Updated Performance Information Location [Text Block] |
Updated performance information is available by calling 1-800-647-7327 or visiting our website at www.ssga.com.
|
| AssetsNet |
$ 13,629,954,117
|
| Holdings Count | Holding |
506
|
| Advisory Fees Paid, Amount |
$ 0
|
| InvestmentCompanyPortfolioTurnover |
2.00%
|
| Additional Fund Statistics [Text Block] |
Key Fund Statistics as of 12/31/2025- Total Net Assets$13,629,954,117
- Number of Portfolio Holdings506
- Portfolio Turnover Rate2%
- Total Advisory Fees Paid$0
Portfolio holdings and portfolio turnover rate are from the corresponding Portfolio, in which the Fund invests. |
| Holdings [Text Block] |
Sectors |
% |
Information Technology |
33.7% |
Financials |
13.2% |
Communication Services |
10.4% |
Consumer Discretionary |
10.2% |
Health Care |
9.4% |
Industrials |
8.0% |
Consumer Staples |
4.6% |
Energy |
2.7% |
Utilities |
2.2% |
Materials |
1.8% | |
| Largest Holdings [Text Block] |
Holdings |
% |
NVIDIA Corp. |
7.6% |
Apple, Inc. |
6.7% |
Microsoft Corp. |
6.0% |
Amazon.com, Inc. |
3.8% |
Alphabet, Inc., Class A |
3.0% |
Broadcom, Inc. |
2.7% |
Alphabet, Inc., Class C |
2.4% |
Meta Platforms, Inc., Class A |
2.4% |
Tesla, Inc. |
2.1% |
Berkshire Hathaway, Inc., Class B |
1.5% | |
| Material Fund Change [Text Block] |
|
| C000143850 |
|
| Shareholder Report [Line Items] |
|
| Fund Name |
State Street Equity 500 Index II Portfolio
|
| Trading Symbol |
SSEYX
|
| Annual or Semi-Annual Statement [Text Block] |
This annual shareholder report contains important information about the State Street Equity 500 Index II Portfolio (the "Fund") for the period of January 1, 2025 through December 31, 2025.
|
| Additional Information [Text Block] |
You can find additional information about the Fund, including the Prospectus, Statement of Additional Information, financial statements and other information at www.ssga.com/us/en/institutional/resources/master-portfolio-fund-documents. You can also request this information about the Fund by contacting us at 1-800-647-7327.
|
| Additional Information Phone Number |
1-800-647-7327
|
| Additional Information Website |
www.ssga.com/us/en/institutional/resources/master-portfolio-fund-documents
|
| Expenses [Text Block] |
What were the Fund costs for the last year? (based on a hypothetical $10,000 Investment)
Fund Name |
Costs of a $10,000 investment |
Costs paid as a percentage of a $10,000 investment |
State Street Equity 500 Index II Portfolio |
$1 |
0.01% | |
| Expenses Paid, Amount |
$ 1
|
| Expense Ratio, Percent |
0.01%
|
| Factors Affecting Performance [Text Block] |
How did the Fund perform last year and what affected its performance?In 2025, the S&P 500 delivered another year of strong performance, rising almost 18% and marking its third consecutive year of double‑digit gains. The Index reached multiple record highs despite notable volatility. Early in the year, markets were shaken by the April 2 “Liberation Day” tariff shock, which triggered a sharp pullback, but equities rebounded swiftly as investors grew confident that corporate adaptability, easing trade tensions, and emerging policy clarity would offset early disruptions. Momentum strengthened through the second half of the year as the U.S. Federal Reserve implemented three interest‑rate cuts. Technology remained the primary engine of market gains, driven by ongoing investment in Artificial Intelligence ("A.I.") and robust earnings across mega‑cap names, while other sectors experienced more uneven results. Overall, 2025 underscored the durability of the bull market, with resilient corporate earnings, increased productivity expectations, and optimism around A.I. deployment contributing to a strong finish. |
| Performance Past Does Not Indicate Future [Text] |
The Fund’s past performance is not necessarily an indication of how the Fund will perform in the future. The returns do not reflect the deduction of taxes that a shareholder would pay on Fund distributions or on the redemption or sale of Fund shares.
|
| Line Graph [Table Text Block] |
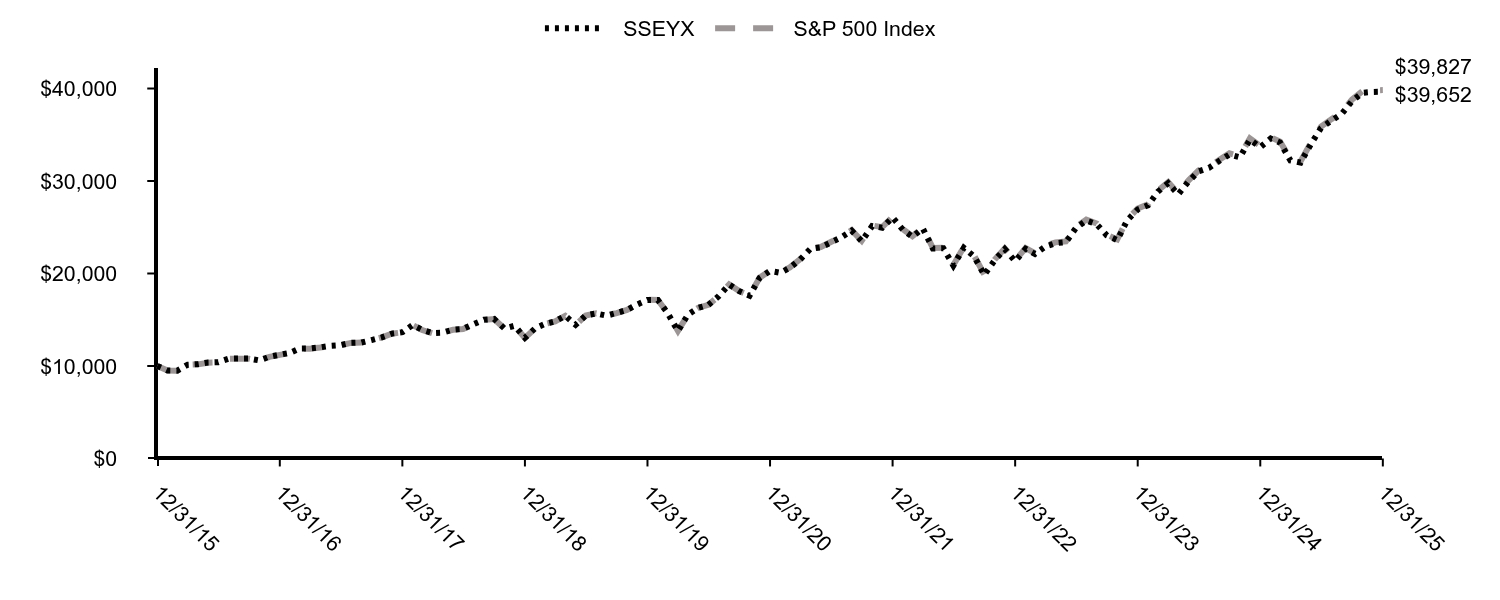
|
SSEYX |
S&P 500 Index |
12/31/15 |
$10,000 |
$10,000 |
01/31/16 |
$9,506 |
$9,504 |
02/29/16 |
$9,496 |
$9,491 |
03/31/16 |
$10,136 |
$10,135 |
04/30/16 |
$10,194 |
$10,174 |
05/31/16 |
$10,378 |
$10,357 |
06/30/16 |
$10,407 |
$10,384 |
07/31/16 |
$10,785 |
$10,766 |
08/31/16 |
$10,804 |
$10,782 |
09/30/16 |
$10,804 |
$10,784 |
10/31/16 |
$10,601 |
$10,587 |
11/30/16 |
$10,998 |
$10,979 |
12/31/16 |
$11,218 |
$11,196 |
01/31/17 |
$11,426 |
$11,408 |
02/28/17 |
$11,882 |
$11,861 |
03/31/17 |
$11,892 |
$11,875 |
04/30/17 |
$12,011 |
$11,997 |
05/31/17 |
$12,179 |
$12,166 |
06/30/17 |
$12,249 |
$12,242 |
07/31/17 |
$12,507 |
$12,494 |
08/31/17 |
$12,536 |
$12,532 |
09/30/17 |
$12,804 |
$12,790 |
10/31/17 |
$13,101 |
$13,089 |
11/30/17 |
$13,498 |
$13,490 |
12/31/17 |
$13,648 |
$13,640 |
01/31/18 |
$14,431 |
$14,421 |
02/28/18 |
$13,909 |
$13,890 |
03/31/18 |
$13,554 |
$13,537 |
04/30/18 |
$13,596 |
$13,589 |
05/31/18 |
$13,930 |
$13,916 |
06/30/18 |
$14,013 |
$14,002 |
07/31/18 |
$14,525 |
$14,523 |
08/31/18 |
$15,005 |
$14,996 |
09/30/18 |
$15,089 |
$15,081 |
10/31/18 |
$14,055 |
$14,050 |
11/30/18 |
$14,347 |
$14,337 |
12/31/18 |
$13,045 |
$13,042 |
01/31/19 |
$14,087 |
$14,087 |
02/28/19 |
$14,541 |
$14,540 |
03/31/19 |
$14,829 |
$14,822 |
04/30/19 |
$15,428 |
$15,422 |
05/31/19 |
$14,452 |
$14,442 |
06/30/19 |
$15,461 |
$15,460 |
07/31/19 |
$15,683 |
$15,682 |
08/31/19 |
$15,439 |
$15,434 |
09/30/19 |
$15,727 |
$15,723 |
10/31/19 |
$16,059 |
$16,063 |
11/30/19 |
$16,647 |
$16,646 |
12/31/19 |
$17,142 |
$17,149 |
01/31/20 |
$17,142 |
$17,142 |
02/29/20 |
$15,735 |
$15,731 |
03/31/20 |
$13,784 |
$13,788 |
04/30/20 |
$15,551 |
$15,555 |
05/31/20 |
$16,288 |
$16,296 |
06/30/20 |
$16,611 |
$16,620 |
07/31/20 |
$17,548 |
$17,558 |
08/31/20 |
$18,806 |
$18,820 |
09/30/20 |
$18,090 |
$18,105 |
10/31/20 |
$17,609 |
$17,623 |
11/30/20 |
$19,528 |
$19,552 |
12/31/20 |
$20,279 |
$20,304 |
01/31/21 |
$20,072 |
$20,099 |
02/28/21 |
$20,619 |
$20,653 |
03/31/21 |
$21,524 |
$21,558 |
04/30/21 |
$22,665 |
$22,708 |
05/31/21 |
$22,824 |
$22,867 |
06/30/21 |
$23,353 |
$23,401 |
07/31/21 |
$23,906 |
$23,956 |
08/31/21 |
$24,629 |
$24,685 |
09/30/21 |
$23,484 |
$23,537 |
10/31/21 |
$25,127 |
$25,186 |
11/30/21 |
$24,952 |
$25,011 |
12/31/21 |
$26,063 |
$26,132 |
01/31/22 |
$24,713 |
$24,780 |
02/28/22 |
$23,973 |
$24,038 |
03/31/22 |
$24,864 |
$24,931 |
04/30/22 |
$22,696 |
$22,757 |
05/31/22 |
$22,734 |
$22,798 |
06/30/22 |
$20,854 |
$20,916 |
07/31/22 |
$22,773 |
$22,845 |
08/31/22 |
$21,845 |
$21,913 |
09/30/22 |
$19,835 |
$19,895 |
10/31/22 |
$21,439 |
$21,506 |
11/30/22 |
$22,635 |
$22,708 |
12/31/22 |
$21,324 |
$21,399 |
01/31/23 |
$22,664 |
$22,744 |
02/28/23 |
$22,110 |
$22,189 |
03/31/23 |
$22,920 |
$23,004 |
04/30/23 |
$23,278 |
$23,363 |
05/31/23 |
$23,381 |
$23,464 |
06/30/23 |
$24,926 |
$25,015 |
07/31/23 |
$25,725 |
$25,818 |
08/31/23 |
$25,318 |
$25,407 |
09/30/23 |
$24,113 |
$24,196 |
10/31/23 |
$23,607 |
$23,687 |
11/30/23 |
$25,762 |
$25,850 |
12/31/23 |
$26,927 |
$27,025 |
01/31/24 |
$27,379 |
$27,479 |
02/29/24 |
$28,841 |
$28,946 |
03/31/24 |
$29,768 |
$29,878 |
04/30/24 |
$28,555 |
$28,657 |
05/31/24 |
$29,969 |
$30,078 |
06/30/24 |
$31,043 |
$31,157 |
07/31/24 |
$31,421 |
$31,537 |
08/31/24 |
$32,184 |
$32,302 |
09/30/24 |
$32,867 |
$32,992 |
10/31/24 |
$32,569 |
$32,692 |
11/30/24 |
$34,480 |
$34,611 |
12/31/24 |
$33,656 |
$33,786 |
01/31/25 |
$34,596 |
$34,727 |
02/28/25 |
$34,144 |
$34,274 |
03/31/25 |
$32,214 |
$32,343 |
04/30/25 |
$31,994 |
$32,124 |
05/31/25 |
$34,004 |
$34,146 |
06/30/25 |
$35,733 |
$35,882 |
07/31/25 |
$36,532 |
$36,687 |
08/31/25 |
$37,271 |
$37,431 |
09/30/25 |
$38,632 |
$38,797 |
10/31/25 |
$39,535 |
$39,706 |
11/30/25 |
$39,628 |
$39,803 |
12/31/25 |
$39,652 |
$39,827 |
|
| Average Annual Return [Table Text Block] |
Name |
1 Year |
5 Years |
10 Years |
SSEYX |
17.81% |
14.35% |
14.77% |
S&P 500 Index |
17.88% |
14.42% |
14.82% | |
| Updated Performance Information Location [Text Block] |
Updated performance information is available by calling 1-800-647-7327 or visiting our website at www.ssga.com.
|
| AssetsNet |
$ 21,274,821,397
|
| Holdings Count | Holding |
506
|
| Advisory Fees Paid, Amount |
$ 0
|
| InvestmentCompanyPortfolioTurnover |
2.00%
|
| Additional Fund Statistics [Text Block] |
Key Fund Statistics as of 12/31/2025- Total Net Assets$21,274,821,397
- Number of Portfolio Holdings506
- Portfolio Turnover Rate2%
- Total Advisory Fees Paid$0
|
| Holdings [Text Block] |
Sectors |
% |
Information Technology |
33.7% |
Financials |
13.2% |
Communication Services |
10.4% |
Consumer Discretionary |
10.2% |
Health Care |
9.4% |
Industrials |
8.0% |
Consumer Staples |
4.6% |
Energy |
2.7% |
Utilities |
2.2% |
Materials |
1.8% | |
| Largest Holdings [Text Block] |
Holdings |
% |
NVIDIA Corp. |
7.6% |
Apple, Inc. |
6.7% |
Microsoft Corp. |
6.0% |
Amazon.com, Inc. |
3.8% |
Alphabet, Inc., Class A |
3.0% |
Broadcom, Inc. |
2.7% |
Alphabet, Inc., Class C |
2.4% |
Meta Platforms, Inc., Class A |
2.4% |
Tesla, Inc. |
2.1% |
Berkshire Hathaway, Inc., Class B |
1.5% | |
| Material Fund Change [Text Block] |
|
| C000251886 |
|
| Shareholder Report [Line Items] |
|
| Fund Name |
State Street Federal Government Money Market Fund
|
| Class Name |
Advantage Class
|
| Trading Symbol |
AGFXX
|
| Annual or Semi-Annual Statement [Text Block] |
This annual shareholder report contains important information about the State Street Federal Government Money Market Fund (the "Fund") for the period of January 6, 2025 (commencement of operations) through December 31, 2025.
|
| Additional Information [Text Block] |
You can find additional information about the Fund, including the Prospectus, Statement of Additional Information, financial statements and other information at www.ssga.com/us/en/institutional/fund-finder?tab=documents&type=cash. You can also request this information about the Fund by contacting us at 1-866-392-0869.
|
| Additional Information Phone Number |
1-866-392-0869
|
| Additional Information Website |
www.ssga.com/us/en/institutional/fund-finder?tab=documents&type=cash
|
| Expenses [Text Block] |
What were the Fund costs for the last year? (based on a hypothetical $10,000 Investment)
Class Name |
Costs of a $10,000 investment |
Costs paid as a percentage of a $10,000 investment |
Advantage Class |
$39 |
0.39% | The expense table reflects the proportionate share of expenses allocated to the Fund by the affiliated Portfolio, in which the Fund invests. The dollar amount above reflects expenses paid since the commencement of operations. Expenses for the full reporting period would be higher. |
| Expenses Paid, Amount |
$ 39
|
| Expense Ratio, Percent |
0.39%
|
| Expenses Represent Both Master and Feeder [Text] |
The expense table reflects the proportionate share of expenses allocated to the Fund by the affiliated Portfolio, in which the Fund invests.
|
| Expenses Short Period Footnote [Text Block] |
The dollar amount above reflects expenses paid since the commencement of operations. Expenses for the full reporting period would be higher.
|
| Performance Inception Date |
Jan. 06, 2025
|
| AssetsNet |
$ 163,039,782
|
| Holdings Count | Holding |
248
|
| Advisory Fees Paid, Amount |
$ 0
|
| Additional Fund Statistics [Text Block] |
Key Fund Statistics as of 12/31/2025- Total Net Assets$163,039,782
- Number of Portfolio Holdings248
- Total Advisory Fees Paid$0
Reflects holdings of the Portfolio, in which the Fund invests. Advisory fees are paid by the Portfolio, in which the Fund invests. |
| Holdings [Text Block] |
Assets |
% |
Treasury Debt |
49.1% |
Treasury Repurchase Agreements |
22.7% |
Government Agency Debt |
12.9% |
Government Agency Repurchase Agreements |
9.6% | |
| Largest Holdings [Text Block] |
Holdings |
% |
FICCBA TRI PARTY REPO A, 3.83%, due 01/02/26 |
4.1% |
U.S. Treasury Bills, 4.10%, due 01/02/26 |
3.6% |
FICCJP TRI PARTY REPO A, 3.82%, due 01/02/26 |
3.3% |
FICCUB BI PARTY REPO, 3.85%, due 01/02/26 |
2.7% |
FICCMS TRI PARTY REPO A, 3.85%, due 01/02/26 |
2.5% |
JP MORGAN SEC LLC TPR A, 3.82%, due 01/02/26 |
2.2% |
U.S. Treasury Bills, 4.13%, due 01/15/26 |
1.7% |
JP MORGAN SEC LLC TPR A, 3.86%, due 04/10/26 |
1.6% |
U.S. Treasury Bills, 3.95%, due 02/19/26 |
1.5% |
U.S. Treasury Bills, 3.72%, due 03/19/26 |
1.5% | |
| C000251884 |
|
| Shareholder Report [Line Items] |
|
| Fund Name |
State Street Federal Treasury Money Market Fund
|
| Class Name |
Advantage Class
|
| Trading Symbol |
AFTXX
|
| Annual or Semi-Annual Statement [Text Block] |
This annual shareholder report contains important information about the State Street Federal Treasury Money Market Fund (the "Fund") for the period of January 6, 2025 (commencement of operations) through December 31, 2025.
|
| Additional Information [Text Block] |
You can find additional information about the Fund, including the Prospectus, Statement of Additional Information, financial statements and other information at www.ssga.com/us/en/institutional/fund-finder?tab=documents&type=cash. You can also request this information about the Fund by contacting us at 1-866-392-0869.
|
| Additional Information Phone Number |
1-866-392-0869
|
| Additional Information Website |
www.ssga.com/us/en/institutional/fund-finder?tab=documents&type=cash
|
| Expenses [Text Block] |
What were the Fund costs for the last year? (based on a hypothetical $10,000 Investment)
Class Name |
Costs of a $10,000 investment |
Costs paid as a percentage of a $10,000 investment |
Advantage Class |
$39 |
0.39% | The expense table reflects the proportionate share of expenses allocated to the Fund by the affiliated Portfolio, in which the Fund invests. The dollar amount above reflects expenses paid since the commencement of operations. Expenses for the full reporting period would be higher. |
| Expenses Paid, Amount |
$ 39
|
| Expense Ratio, Percent |
0.39%
|
| Expenses Represent Both Master and Feeder [Text] |
The expense table reflects the proportionate share of expenses allocated to the Fund by the affiliated Portfolio, in which the Fund invests.
|
| Expenses Short Period Footnote [Text Block] |
The dollar amount above reflects expenses paid since the commencement of operations. Expenses for the full reporting period would be higher.
|
| Performance Inception Date |
Jan. 06, 2025
|
| AssetsNet |
$ 130,051,961
|
| Holdings Count | Holding |
76
|
| Advisory Fees Paid, Amount |
$ 0
|
| Additional Fund Statistics [Text Block] |
Key Fund Statistics as of 12/31/2025- Total Net Assets$130,051,961
- Number of Portfolio Holdings76
- Total Advisory Fees Paid$0
Reflects holdings of the Portfolio, in which the Fund invests. Advisory fees are paid by the Portfolio, in which the Fund invests. |
| Holdings [Text Block] |
Assets |
% |
Treasury Debt |
107.3% | |
| Largest Holdings [Text Block] |
Holdings |
% |
U.S. Treasury Bills, 3.85%, due 01/13/26 |
9.2% |
U.S. Treasury Bills, 4.12%, due 01/22/26 |
7.1% |
U.S. Treasury Bills, 3.85%, due 01/08/26 |
5.2% |
U.S. Treasury Bills, 3.86%, due 01/02/26 |
4.9% |
U.S. Treasury Bills, 4.13%, due 01/15/26 |
4.6% |
U.S. Treasury Bills, 3.84%, due 01/06/26 |
4.4% |
U.S. Treasury Bills, 3.82%, due 01/20/26 |
4.3% |
U.S. Treasury Floating Rate Notes, 3.78%, due 07/31/26 |
3.9% |
U.S. Treasury Bills, 3.79%, due 02/03/26 |
3.4% |
U.S. Treasury Bills, 3.80%, due 02/17/26 |
3.0% | |
| C000251885 |
|
| Shareholder Report [Line Items] |
|
| Fund Name |
State Street Federal Treasury Plus Money Market Fund
|
| Class Name |
Advantage Class
|
| Trading Symbol |
ATPXX
|
| Annual or Semi-Annual Statement [Text Block] |
This annual shareholder report contains important information about the State Street Federal Treasury Plus Money Market Fund (the "Fund") for the period of January 6, 2025 (commencement of operations) through December 31, 2025.
|
| Additional Information [Text Block] |
You can find additional information about the Fund, including the Prospectus, Statement of Additional Information, financial statements and other information at www.ssga.com/us/en/institutional/fund-finder?tab=documents&type=cash. You can also request this information about the Fund by contacting us at 1-866-392-0869.
|
| Additional Information Phone Number |
1-866-392-0869
|
| Additional Information Website |
www.ssga.com/us/en/institutional/fund-finder?tab=documents&type=cash
|
| Expenses [Text Block] |
What were the Fund costs for the last year? (based on a hypothetical $10,000 Investment)
Class Name |
Costs of a $10,000 investment |
Costs paid as a percentage of a $10,000 investment |
Advantage Class |
$39 |
0.39% | The expense table reflects the proportionate share of expenses allocated to the Fund by the affiliated Portfolio, in which the Fund invests. The dollar amount above reflects expenses paid since the commencement of operations. Expenses for the full reporting period would be higher. |
| Expenses Paid, Amount |
$ 39
|
| Expense Ratio, Percent |
0.39%
|
| Expenses Represent Both Master and Feeder [Text] |
The expense table reflects the proportionate share of expenses allocated to the Fund by the affiliated Portfolio, in which the Fund invests.
|
| Expenses Short Period Footnote [Text Block] |
The dollar amount above reflects expenses paid since the commencement of operations. Expenses for the full reporting period would be higher.
|
| Performance Inception Date |
Jan. 06, 2025
|
| AssetsNet |
$ 66,344,632
|
| Holdings Count | Holding |
105
|
| Advisory Fees Paid, Amount |
$ 0
|
| Additional Fund Statistics [Text Block] |
Key Fund Statistics as of 12/31/2025- Total Net Assets$66,344,632
- Number of Portfolio Holdings105
- Total Advisory Fees Paid$0
Reflects holdings of the Portfolio, in which the Fund invests. Advisory fees are paid by the Portfolio, in which the Fund invests. |
| Holdings [Text Block] |
Assets |
% |
Treasury Debt |
56.0% |
Treasury Repurchase Agreements |
37.6% | |
| Largest Holdings [Text Block] |
Holdings |
% |
FICCBA TRI PARTY REPO A, 3.83%, due 01/02/26 |
7.1% |
JP MORGAN SEC LLC TPR A, 3.82%, due 01/02/26 |
6.3% |
FICCMS TRI PARTY REPO A, 3.85%, due 01/02/26 |
4.1% |
FICCJP TRI PARTY REPO A, 3.82%, due 01/02/26 |
3.9% |
U.S. Treasury Bills, 4.10%, due 01/02/26 |
3.7% |
FICCUB BI PARTY REPO, 3.85%, due 01/02/26 |
2.9% |
U.S. Treasury Floating Rate Notes, 3.70%, due 01/31/27 |
2.8% |
U.S. Treasury Floating Rate Notes, 3.81%, due 10/31/26 |
2.6% |
U.S. Treasury Floating Rate Notes, 3.78%, due 07/31/26 |
2.3% |
U.S. Treasury Bills, 4.15%, due 01/08/26 |
2.2% | |
| C000136662 |
|
| Shareholder Report [Line Items] |
|
| Fund Name |
State Street Global All Cap Equity ex-U.S. Index Fund
|
| Class Name |
Class A
|
| Trading Symbol |
SSGHX
|
| Annual or Semi-Annual Statement [Text Block] |
This annual shareholder report contains important information about the State Street Global All Cap Equity ex-U.S. Index Fund (the "Fund") for the period of January 1, 2025 through December 31, 2025.
|
| Additional Information [Text Block] |
You can find additional information about the Fund, including the Prospectus, Statement of Additional Information, financial statements and other information at www.ssga.com/us/en/institutional/fund-finder?tab=documents&type=mf. You can also request this information about the Fund by contacting us at 1-800-647-7327.
|
| Additional Information Phone Number |
1-800-647-7327
|
| Additional Information Website |
www.ssga.com/us/en/institutional/fund-finder?tab=documents&type=mf
|
| Expenses [Text Block] |
What were the Fund costs for the last year? (based on a hypothetical $10,000 Investment)
Class Name |
Costs of a $10,000 investment |
Costs paid as a percentage of a $10,000 investment |
Class A |
$53 |
0.46% | The expense table reflects expenses from both the Fund and the affiliated Portfolio, in which the Fund invests. |
| Expenses Paid, Amount |
$ 53
|
| Expense Ratio, Percent |
0.46%
|
| Expenses Represent Both Master and Feeder [Text] |
The expense table reflects expenses from both the Fund and the affiliated Portfolio, in which the Fund invests.
|
| Factors Affecting Performance [Text Block] |
How did the Fund perform last year and what affected its performance?Global markets delivered broad but volatile gains in 2025, shaped by shifting tariff dynamics, monetary easing, and strong technology‑led earnings. Early in the year, trade tensions and reciprocal tariffs weighed on sentiment, leading to sharp pullbacks across the U.S. and parts of Asia, while Europe and emerging markets outperformed on valuation support and fiscal stimulus. 2025 delivered strong global performance as falling rates, resilient earnings, and AI enthusiasm lifted developed markets. Japan and Europe gained on supportive monetary stances. Financials, industrials and information technology were the strongest contributors to the Fund's performance, while real estate, energy and utilities were the weakest contributing sectors. Japan, United Kingdom, and Canada were the strongest contributors. Denmark, Saudi Arabia and India were the weakest contributors to the Fund's performance. |
| Performance Past Does Not Indicate Future [Text] |
The Fund’s past performance is not necessarily an indication of how the Fund will perform in the future. The returns do not reflect the deduction of taxes that a shareholder would pay on Fund distributions or on the redemption or sale of Fund shares.
|
| Line Graph [Table Text Block] |
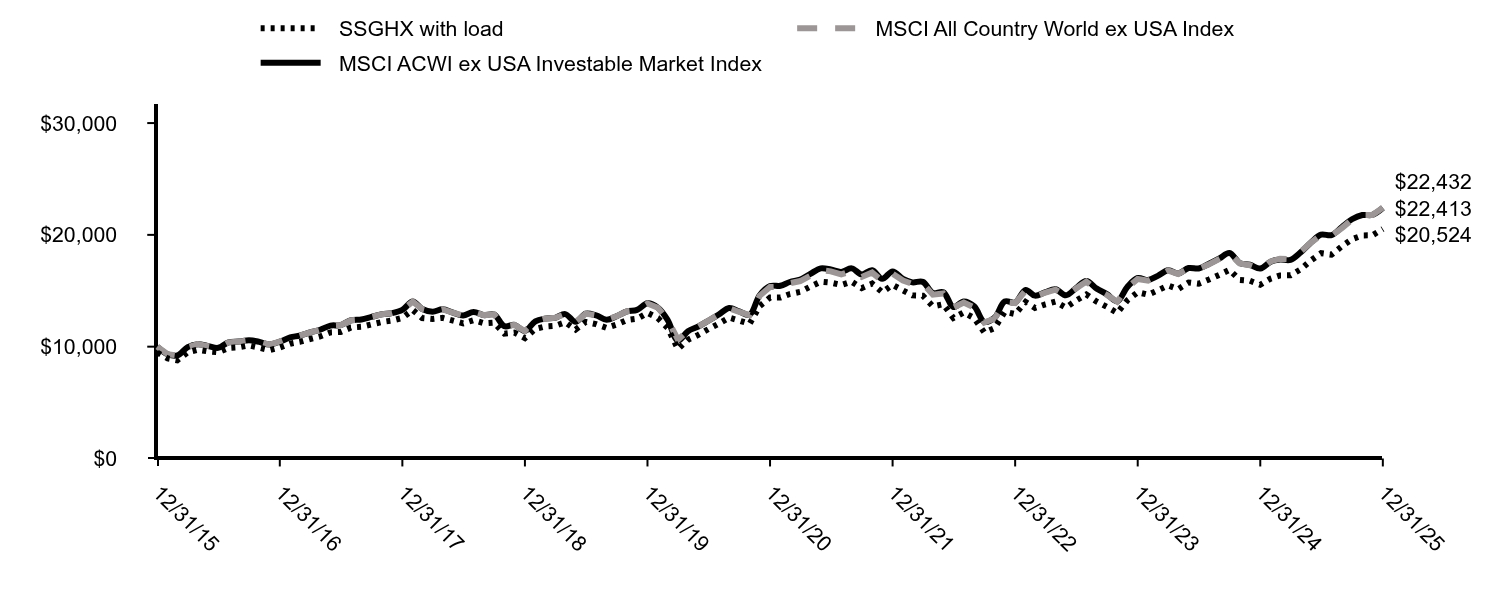
|
SSGHX with load |
MSCI All Country World ex USA Index |
MSCI ACWI ex USA Investable Market Index |
12/31/15 |
$9,475 |
$10,000 |
$10,000 |
01/31/16 |
$8,948 |
$9,320 |
$9,320 |
02/29/16 |
$8,780 |
$9,213 |
$9,213 |
03/31/16 |
$9,498 |
$9,962 |
$9,962 |
04/30/16 |
$9,733 |
$10,225 |
$10,225 |
05/31/16 |
$9,576 |
$10,052 |
$10,052 |
06/30/16 |
$9,498 |
$9,898 |
$9,898 |
07/31/16 |
$9,890 |
$10,388 |
$10,388 |
08/31/16 |
$9,946 |
$10,453 |
$10,453 |
09/30/16 |
$10,114 |
$10,582 |
$10,582 |
10/31/16 |
$9,913 |
$10,430 |
$10,430 |
11/30/16 |
$9,688 |
$10,189 |
$10,189 |
12/31/16 |
$9,925 |
$10,450 |
$10,450 |
01/31/17 |
$10,266 |
$10,820 |
$10,820 |
02/28/17 |
$10,425 |
$10,992 |
$10,992 |
03/31/17 |
$10,686 |
$11,271 |
$11,271 |
04/30/17 |
$10,913 |
$11,512 |
$11,512 |
05/31/17 |
$11,277 |
$11,886 |
$11,886 |
06/30/17 |
$11,311 |
$11,923 |
$11,923 |
07/31/17 |
$11,708 |
$12,362 |
$12,362 |
08/31/17 |
$11,777 |
$12,427 |
$12,427 |
09/30/17 |
$11,992 |
$12,657 |
$12,657 |
10/31/17 |
$12,208 |
$12,896 |
$12,896 |
11/30/17 |
$12,333 |
$13,000 |
$13,000 |
12/31/17 |
$12,574 |
$13,291 |
$13,291 |
01/31/18 |
$13,281 |
$14,031 |
$14,031 |
02/28/18 |
$12,562 |
$13,370 |
$13,370 |
03/31/18 |
$12,479 |
$13,134 |
$13,134 |
04/30/18 |
$12,574 |
$13,343 |
$13,343 |
05/31/18 |
$12,326 |
$13,035 |
$13,035 |
06/30/18 |
$12,079 |
$12,790 |
$12,790 |
07/31/18 |
$12,373 |
$13,096 |
$13,096 |
08/31/18 |
$12,090 |
$12,822 |
$12,822 |
09/30/18 |
$12,149 |
$12,881 |
$12,881 |
10/31/18 |
$11,159 |
$11,833 |
$11,833 |
11/30/18 |
$11,265 |
$11,945 |
$11,945 |
12/31/18 |
$10,765 |
$11,404 |
$11,404 |
01/31/19 |
$11,592 |
$12,266 |
$12,266 |
02/28/19 |
$11,796 |
$12,506 |
$12,506 |
03/31/19 |
$11,859 |
$12,580 |
$12,580 |
04/30/19 |
$12,177 |
$12,912 |
$12,912 |
05/31/19 |
$11,528 |
$12,219 |
$12,219 |
06/30/19 |
$12,216 |
$12,955 |
$12,955 |
07/31/19 |
$12,012 |
$12,798 |
$12,798 |
08/31/19 |
$11,681 |
$12,403 |
$12,403 |
09/30/19 |
$11,974 |
$12,722 |
$12,722 |
10/31/19 |
$12,381 |
$13,166 |
$13,160 |
11/30/19 |
$12,496 |
$13,282 |
$13,290 |
12/31/19 |
$13,027 |
$13,857 |
$13,876 |
01/31/20 |
$12,562 |
$13,485 |
$13,496 |
02/29/20 |
$11,686 |
$12,419 |
$12,406 |
03/31/20 |
$9,787 |
$10,621 |
$10,531 |
04/30/20 |
$10,618 |
$11,426 |
$11,389 |
05/31/20 |
$11,058 |
$11,800 |
$11,803 |
06/30/20 |
$11,570 |
$12,333 |
$12,317 |
07/31/20 |
$12,058 |
$12,883 |
$12,875 |
08/31/20 |
$12,597 |
$13,434 |
$13,464 |
09/30/20 |
$12,332 |
$13,104 |
$13,154 |
10/31/20 |
$12,047 |
$12,822 |
$12,862 |
11/30/20 |
$13,633 |
$14,547 |
$14,599 |
12/31/20 |
$14,391 |
$15,334 |
$15,419 |
01/31/21 |
$14,389 |
$15,367 |
$15,445 |
02/28/21 |
$14,706 |
$15,671 |
$15,785 |
03/31/21 |
$14,906 |
$15,869 |
$16,001 |
04/30/21 |
$15,369 |
$16,336 |
$16,508 |
05/31/21 |
$15,815 |
$16,847 |
$17,006 |
06/30/21 |
$15,729 |
$16,738 |
$16,896 |
07/31/21 |
$15,516 |
$16,462 |
$16,677 |
08/31/21 |
$15,811 |
$16,775 |
$17,004 |
09/30/21 |
$15,234 |
$16,238 |
$16,464 |
10/31/21 |
$15,640 |
$16,626 |
$16,837 |
11/30/21 |
$14,880 |
$15,877 |
$16,068 |
12/31/21 |
$15,524 |
$16,533 |
$16,734 |
01/31/22 |
$15,028 |
$15,924 |
$16,055 |
02/28/22 |
$14,587 |
$15,609 |
$15,753 |
03/31/22 |
$14,563 |
$15,634 |
$15,797 |
04/30/22 |
$13,603 |
$14,652 |
$14,801 |
05/31/22 |
$13,796 |
$14,757 |
$14,873 |
06/30/22 |
$12,566 |
$13,488 |
$13,541 |
07/31/22 |
$13,066 |
$13,949 |
$14,049 |
08/31/22 |
$12,552 |
$13,501 |
$13,610 |
09/30/22 |
$11,274 |
$12,151 |
$12,229 |
10/31/22 |
$11,668 |
$12,514 |
$12,599 |
11/30/22 |
$13,126 |
$13,992 |
$14,046 |
12/31/22 |
$12,912 |
$13,887 |
$13,959 |
01/31/23 |
$13,999 |
$15,013 |
$15,073 |
02/28/23 |
$13,465 |
$14,486 |
$14,564 |
03/31/23 |
$13,786 |
$14,841 |
$14,875 |
04/30/23 |
$14,026 |
$15,098 |
$15,128 |
05/31/23 |
$13,495 |
$14,549 |
$14,596 |
06/30/23 |
$14,115 |
$15,202 |
$15,230 |
07/31/23 |
$14,665 |
$15,820 |
$15,870 |
08/31/23 |
$14,025 |
$15,106 |
$15,191 |
09/30/23 |
$13,561 |
$14,629 |
$14,698 |
10/31/23 |
$13,018 |
$14,025 |
$14,062 |
11/30/23 |
$14,145 |
$15,288 |
$15,341 |
12/31/23 |
$14,868 |
$16,056 |
$16,140 |
01/31/24 |
$14,642 |
$15,896 |
$15,963 |
02/29/24 |
$15,035 |
$16,299 |
$16,334 |
03/31/24 |
$15,476 |
$16,808 |
$16,838 |
04/30/24 |
$15,145 |
$16,506 |
$16,544 |
05/31/24 |
$15,738 |
$16,985 |
$17,032 |
06/30/24 |
$15,625 |
$16,969 |
$16,992 |
07/31/24 |
$16,012 |
$17,362 |
$17,421 |
08/31/24 |
$16,430 |
$17,857 |
$17,893 |
09/30/24 |
$16,865 |
$18,337 |
$18,382 |
10/31/24 |
$15,971 |
$17,438 |
$17,472 |
11/30/24 |
$15,898 |
$17,280 |
$17,325 |
12/31/24 |
$15,541 |
$16,944 |
$16,984 |
01/31/25 |
$16,089 |
$17,627 |
$17,604 |
02/28/25 |
$16,373 |
$17,872 |
$17,789 |
03/31/25 |
$16,383 |
$17,831 |
$17,764 |
04/30/25 |
$16,912 |
$18,475 |
$18,432 |
05/31/25 |
$17,718 |
$19,321 |
$19,325 |
06/30/25 |
$18,360 |
$19,977 |
$20,021 |
07/31/25 |
$18,229 |
$19,919 |
$19,977 |
08/31/25 |
$18,977 |
$20,611 |
$20,693 |
09/30/25 |
$19,612 |
$21,353 |
$21,395 |
10/31/25 |
$19,951 |
$21,785 |
$21,773 |
11/30/25 |
$19,958 |
$21,779 |
$21,791 |
12/31/25 |
$20,524 |
$22,432 |
$22,413 |
|
| Average Annual Return [Table Text Block] |
Name |
1 Year |
5 Years |
10 Years |
SSGHX |
32.06% |
7.36% |
8.04% |
SSGHX (Adjusted for the 5.25% Maximum Sales Charge) |
25.13% |
6.21% |
7.45% |
MSCI All Country World ex USA Index |
32.39% |
7.91% |
8.41% |
MSCI ACWI ex USA Investable Market IndexFootnote Reference(1)Footnote Reference(2) |
31.96% |
7.77% |
8.41% | |
| Updated Performance Information Location [Text Block] |
Updated performance information is available by calling 1-800-647-7327 or visiting our website at www.ssga.com.
|
| AssetsNet |
$ 3,968,412,489
|
| Holdings Count | Holding |
5,797
|
| Advisory Fees Paid, Amount |
$ 0
|
| InvestmentCompanyPortfolioTurnover |
6.00%
|
| Additional Fund Statistics [Text Block] |
Key Fund Statistics as of 12/31/2025- Total Net Assets$3,968,412,489
- Number of Portfolio Holdings5,797
- Portfolio Turnover Rate6%
- Total Advisory Fees Paid$0
Portfolio holdings and portfolio turnover rate are from the corresponding Portfolio, in which the Fund invests. |
| Holdings [Text Block] |
Countries |
% |
Japan |
14.8% |
China |
8.0% |
Canada |
8.0% |
United Kingdom |
7.0% |
Taiwan |
6.2% |
Germany |
5.5% |
United States |
5.2% |
France |
5.1% |
India |
5.0% |
Australia |
4.8% | |
| Largest Holdings [Text Block] |
Holdings |
% |
Taiwan Semiconductor Manufacturing Co. Ltd. |
3.1% |
Tencent Holdings Ltd. |
1.3% |
ASML Holding NV |
1.1% |
Samsung Electronics Co. Ltd. |
1.0% |
Alibaba Group Holding Ltd. |
0.8% |
Roche Holding AG |
0.8% |
AstraZeneca PLC |
0.7% |
HSBC Holdings PLC |
0.7% |
Novartis AG |
0.7% |
Nestle SA |
0.7% | |
| Material Fund Change [Text Block] |
|
| C000136664 |
|
| Shareholder Report [Line Items] |
|
| Fund Name |
State Street Global All Cap Equity ex-U.S. Index Fund
|
| Class Name |
Class I
|
| Trading Symbol |
SSGJX
|
| Annual or Semi-Annual Statement [Text Block] |
This annual shareholder report contains important information about the State Street Global All Cap Equity ex-U.S. Index Fund (the "Fund") for the period of January 1, 2025 through December 31, 2025.
|
| Additional Information [Text Block] |
You can find additional information about the Fund, including the Prospectus, Statement of Additional Information, financial statements and other information at www.ssga.com/us/en/institutional/fund-finder?tab=documents&type=mf. You can also request this information about the Fund by contacting us at 1-800-647-7327.
|
| Additional Information Phone Number |
1-800-647-7327
|
| Additional Information Website |
www.ssga.com/us/en/institutional/fund-finder?tab=documents&type=mf
|
| Expenses [Text Block] |
What were the Fund costs for the last year? (based on a hypothetical $10,000 Investment)
Class Name |
Costs of a $10,000 investment |
Costs paid as a percentage of a $10,000 investment |
Class I |
$15 |
0.13% | The expense table reflects expenses from both the Fund and the affiliated Portfolio, in which the Fund invests. |
| Expenses Paid, Amount |
$ 15
|
| Expense Ratio, Percent |
0.13%
|
| Expenses Represent Both Master and Feeder [Text] |
The expense table reflects expenses from both the Fund and the affiliated Portfolio, in which the Fund invests.
|
| Factors Affecting Performance [Text Block] |
How did the Fund perform last year and what affected its performance?Global markets delivered broad but volatile gains in 2025, shaped by shifting tariff dynamics, monetary easing, and strong technology‑led earnings. Early in the year, trade tensions and reciprocal tariffs weighed on sentiment, leading to sharp pullbacks across the U.S. and parts of Asia, while Europe and emerging markets outperformed on valuation support and fiscal stimulus. 2025 delivered strong global performance as falling rates, resilient earnings, and AI enthusiasm lifted developed markets. Japan and Europe gained on supportive monetary stances. Financials, industrials and information technology were the strongest contributors to the Fund's performance, while real estate, energy and utilities were the weakest contributing sectors. Japan, United Kingdom, and Canada were the strongest contributors. Denmark, Saudi Arabia and India were the weakest contributors to the Fund's performance. |
| Performance Past Does Not Indicate Future [Text] |
The Fund’s past performance is not necessarily an indication of how the Fund will perform in the future. The returns do not reflect the deduction of taxes that a shareholder would pay on Fund distributions or on the redemption or sale of Fund shares.
|
| Line Graph [Table Text Block] |
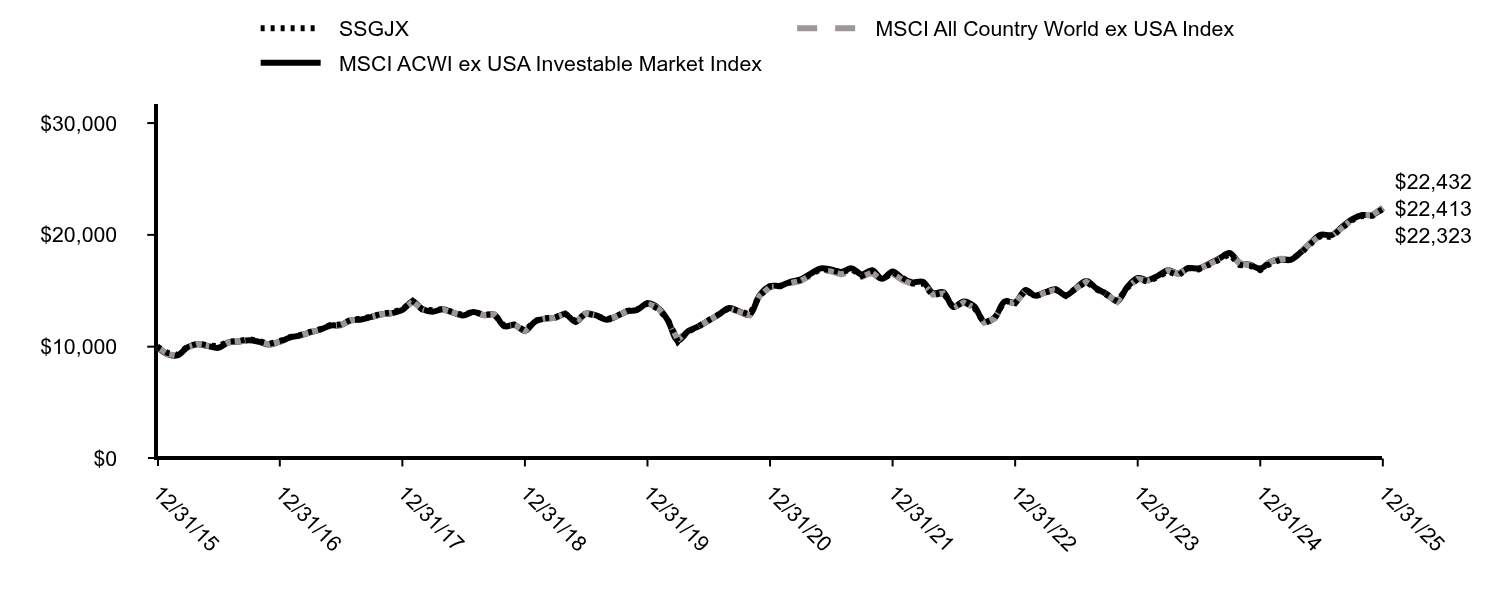
|
SSGJX |
MSCI All Country World ex USA Index |
MSCI ACWI ex USA Investable Market Index |
12/31/15 |
$10,000 |
$10,000 |
$10,000 |
01/31/16 |
$9,444 |
$9,320 |
$9,320 |
02/29/16 |
$9,266 |
$9,213 |
$9,213 |
03/31/16 |
$10,024 |
$9,962 |
$9,962 |
04/30/16 |
$10,284 |
$10,225 |
$10,225 |
05/31/16 |
$10,118 |
$10,052 |
$10,052 |
06/30/16 |
$10,036 |
$9,898 |
$9,898 |
07/31/16 |
$10,450 |
$10,388 |
$10,388 |
08/31/16 |
$10,509 |
$10,453 |
$10,453 |
09/30/16 |
$10,686 |
$10,582 |
$10,582 |
10/31/16 |
$10,485 |
$10,430 |
$10,430 |
11/30/16 |
$10,249 |
$10,189 |
$10,189 |
12/31/16 |
$10,502 |
$10,450 |
$10,450 |
01/31/17 |
$10,862 |
$10,820 |
$10,820 |
02/28/17 |
$11,030 |
$10,992 |
$10,992 |
03/31/17 |
$11,319 |
$11,271 |
$11,271 |
04/30/17 |
$11,559 |
$11,512 |
$11,512 |
05/31/17 |
$11,944 |
$11,886 |
$11,886 |
06/30/17 |
$11,980 |
$11,923 |
$11,923 |
07/31/17 |
$12,412 |
$12,362 |
$12,362 |
08/31/17 |
$12,484 |
$12,427 |
$12,427 |
09/30/17 |
$12,713 |
$12,657 |
$12,657 |
10/31/17 |
$12,953 |
$12,896 |
$12,896 |
11/30/17 |
$13,085 |
$13,000 |
$13,000 |
12/31/17 |
$13,337 |
$13,291 |
$13,291 |
01/31/18 |
$14,087 |
$14,031 |
$14,031 |
02/28/18 |
$13,337 |
$13,370 |
$13,370 |
03/31/18 |
$13,249 |
$13,134 |
$13,134 |
04/30/18 |
$13,362 |
$13,343 |
$13,343 |
05/31/18 |
$13,087 |
$13,035 |
$13,035 |
06/30/18 |
$12,824 |
$12,790 |
$12,790 |
07/31/18 |
$13,137 |
$13,096 |
$13,096 |
08/31/18 |
$12,837 |
$12,822 |
$12,822 |
09/30/18 |
$12,899 |
$12,881 |
$12,881 |
10/31/18 |
$11,849 |
$11,833 |
$11,833 |
11/30/18 |
$11,974 |
$11,945 |
$11,945 |
12/31/18 |
$11,446 |
$11,404 |
$11,404 |
01/31/19 |
$12,325 |
$12,266 |
$12,266 |
02/28/19 |
$12,541 |
$12,506 |
$12,506 |
03/31/19 |
$12,622 |
$12,580 |
$12,580 |
04/30/19 |
$12,960 |
$12,912 |
$12,912 |
05/31/19 |
$12,257 |
$12,219 |
$12,219 |
06/30/19 |
$12,987 |
$12,955 |
$12,955 |
07/31/19 |
$12,771 |
$12,798 |
$12,798 |
08/31/19 |
$12,433 |
$12,403 |
$12,403 |
09/30/19 |
$12,743 |
$12,722 |
$12,722 |
10/31/19 |
$13,189 |
$13,166 |
$13,160 |
11/30/19 |
$13,311 |
$13,282 |
$13,290 |
12/31/19 |
$13,877 |
$13,857 |
$13,876 |
01/31/20 |
$13,396 |
$13,485 |
$13,496 |
02/29/20 |
$12,463 |
$12,419 |
$12,406 |
03/31/20 |
$10,454 |
$10,621 |
$10,531 |
04/30/20 |
$11,334 |
$11,426 |
$11,389 |
05/31/20 |
$11,805 |
$11,800 |
$11,803 |
06/30/20 |
$12,355 |
$12,333 |
$12,317 |
07/31/20 |
$12,879 |
$12,883 |
$12,875 |
08/31/20 |
$13,459 |
$13,434 |
$13,464 |
09/30/20 |
$13,180 |
$13,104 |
$13,154 |
10/31/20 |
$12,879 |
$12,822 |
$12,862 |
11/30/20 |
$14,576 |
$14,547 |
$14,599 |
12/31/20 |
$15,391 |
$15,334 |
$15,419 |
01/31/21 |
$15,394 |
$15,367 |
$15,445 |
02/28/21 |
$15,736 |
$15,671 |
$15,785 |
03/31/21 |
$15,955 |
$15,869 |
$16,001 |
04/30/21 |
$16,456 |
$16,336 |
$16,508 |
05/31/21 |
$16,939 |
$16,847 |
$17,006 |
06/30/21 |
$16,850 |
$16,738 |
$16,896 |
07/31/21 |
$16,627 |
$16,462 |
$16,677 |
08/31/21 |
$16,945 |
$16,775 |
$17,004 |
09/30/21 |
$16,331 |
$16,238 |
$16,464 |
10/31/21 |
$16,771 |
$16,626 |
$16,837 |
11/30/21 |
$15,960 |
$15,877 |
$16,068 |
12/31/21 |
$16,654 |
$16,533 |
$16,734 |
01/31/22 |
$16,127 |
$15,924 |
$16,055 |
02/28/22 |
$15,657 |
$15,609 |
$15,753 |
03/31/22 |
$15,636 |
$15,634 |
$15,797 |
04/30/22 |
$14,606 |
$14,652 |
$14,801 |
05/31/22 |
$14,820 |
$14,757 |
$14,873 |
06/30/22 |
$13,502 |
$13,488 |
$13,541 |
07/31/22 |
$14,043 |
$13,949 |
$14,049 |
08/31/22 |
$13,493 |
$13,501 |
$13,610 |
09/30/22 |
$12,123 |
$12,151 |
$12,229 |
10/31/22 |
$12,551 |
$12,514 |
$12,599 |
11/30/22 |
$14,124 |
$13,992 |
$14,046 |
12/31/22 |
$13,893 |
$13,887 |
$13,959 |
01/31/23 |
$15,067 |
$15,013 |
$15,073 |
02/28/23 |
$14,495 |
$14,486 |
$14,564 |
03/31/23 |
$14,845 |
$14,841 |
$14,875 |
04/30/23 |
$15,110 |
$15,098 |
$15,128 |
05/31/23 |
$14,543 |
$14,549 |
$14,596 |
06/30/23 |
$15,213 |
$15,202 |
$15,230 |
07/31/23 |
$15,810 |
$15,820 |
$15,870 |
08/31/23 |
$15,125 |
$15,106 |
$15,191 |
09/30/23 |
$14,630 |
$14,629 |
$14,698 |
10/31/23 |
$14,051 |
$14,025 |
$14,062 |
11/30/23 |
$15,272 |
$15,288 |
$15,341 |
12/31/23 |
$16,058 |
$16,056 |
$16,140 |
01/31/24 |
$15,821 |
$15,896 |
$15,963 |
02/29/24 |
$16,249 |
$16,299 |
$16,334 |
03/31/24 |
$16,733 |
$16,808 |
$16,838 |
04/30/24 |
$16,379 |
$16,506 |
$16,544 |
05/31/24 |
$17,028 |
$16,985 |
$17,032 |
06/30/24 |
$16,910 |
$16,969 |
$16,992 |
07/31/24 |
$17,331 |
$17,362 |
$17,421 |
08/31/24 |
$17,790 |
$17,857 |
$17,893 |
09/30/24 |
$18,268 |
$18,337 |
$18,382 |
10/31/24 |
$17,304 |
$17,438 |
$17,472 |
11/30/24 |
$17,230 |
$17,280 |
$17,325 |
12/31/24 |
$16,848 |
$16,944 |
$16,984 |
01/31/25 |
$17,445 |
$17,627 |
$17,604 |
02/28/25 |
$17,759 |
$17,872 |
$17,789 |
03/31/25 |
$17,776 |
$17,831 |
$17,764 |
04/30/25 |
$18,352 |
$18,475 |
$18,432 |
05/31/25 |
$19,236 |
$19,321 |
$19,325 |
06/30/25 |
$19,939 |
$19,977 |
$20,021 |
07/31/25 |
$19,801 |
$19,919 |
$19,977 |
08/31/25 |
$20,620 |
$20,611 |
$20,693 |
09/30/25 |
$21,318 |
$21,353 |
$21,395 |
10/31/25 |
$21,692 |
$21,785 |
$21,773 |
11/30/25 |
$21,706 |
$21,779 |
$21,791 |
12/31/25 |
$22,323 |
$22,432 |
$22,413 |
|
| Average Annual Return [Table Text Block] |
Name |
1 Year |
5 Years |
10 Years |
SSGJX |
32.50% |
7.72% |
8.36% |
MSCI All Country World ex USA Index |
32.39% |
7.91% |
8.41% |
MSCI ACWI ex USA Investable Market IndexFootnote Reference(1)Footnote Reference(2) |
31.96% |
7.77% |
8.41% | |
| Updated Performance Information Location [Text Block] |
Updated performance information is available by calling 1-800-647-7327 or visiting our website at www.ssga.com.
|
| AssetsNet |
$ 3,968,412,489
|
| Holdings Count | Holding |
5,797
|
| Advisory Fees Paid, Amount |
$ 0
|
| InvestmentCompanyPortfolioTurnover |
6.00%
|
| Additional Fund Statistics [Text Block] |
Key Fund Statistics as of 12/31/2025- Total Net Assets$3,968,412,489
- Number of Portfolio Holdings5,797
- Portfolio Turnover Rate6%
- Total Advisory Fees Paid$0
Portfolio holdings and portfolio turnover rate are from the corresponding Portfolio, in which the Fund invests. |
| Holdings [Text Block] |
Countries |
% |
Japan |
14.8% |
China |
8.0% |
Canada |
8.0% |
United Kingdom |
7.0% |
Taiwan |
6.2% |
Germany |
5.5% |
United States |
5.2% |
France |
5.1% |
India |
5.0% |
Australia |
4.8% | |
| Largest Holdings [Text Block] |
Holdings |
% |
Taiwan Semiconductor Manufacturing Co. Ltd. |
3.1% |
Tencent Holdings Ltd. |
1.3% |
ASML Holding NV |
1.1% |
Samsung Electronics Co. Ltd. |
1.0% |
Alibaba Group Holding Ltd. |
0.8% |
Roche Holding AG |
0.8% |
AstraZeneca PLC |
0.7% |
HSBC Holdings PLC |
0.7% |
Novartis AG |
0.7% |
Nestle SA |
0.7% | |
| Material Fund Change [Text Block] |
|
| C000136663 |
|
| Shareholder Report [Line Items] |
|
| Fund Name |
State Street Global All Cap Equity ex-U.S. Index Fund
|
| Class Name |
Class K
|
| Trading Symbol |
SSGLX
|
| Annual or Semi-Annual Statement [Text Block] |
This annual shareholder report contains important information about the State Street Global All Cap Equity ex-U.S. Index Fund (the "Fund") for the period of January 1, 2025 through December 31, 2025.
|
| Additional Information [Text Block] |
You can find additional information about the Fund, including the Prospectus, Statement of Additional Information, financial statements and other information at www.ssga.com/us/en/institutional/fund-finder?tab=documents&type=mf. You can also request this information about the Fund by contacting us at 1-800-647-7327.
|
| Additional Information Phone Number |
1-800-647-7327
|
| Additional Information Website |
www.ssga.com/us/en/institutional/fund-finder?tab=documents&type=mf
|
| Expenses [Text Block] |
What were the Fund costs for the last year? (based on a hypothetical $10,000 Investment)
Class Name |
Costs of a $10,000 investment |
Costs paid as a percentage of a $10,000 investment |
Class K |
$2 |
0.02% | The expense table reflects expenses from both the Fund and the affiliated Portfolio, in which the Fund invests. |
| Expenses Paid, Amount |
$ 2
|
| Expense Ratio, Percent |
0.02%
|
| Expenses Represent Both Master and Feeder [Text] |
The expense table reflects expenses from both the Fund and the affiliated Portfolio, in which the Fund invests.
|
| Factors Affecting Performance [Text Block] |
How did the Fund perform last year and what affected its performance?Global markets delivered broad but volatile gains in 2025, shaped by shifting tariff dynamics, monetary easing, and strong technology‑led earnings. Early in the year, trade tensions and reciprocal tariffs weighed on sentiment, leading to sharp pullbacks across the U.S. and parts of Asia, while Europe and emerging markets outperformed on valuation support and fiscal stimulus. 2025 delivered strong global performance as falling rates, resilient earnings, and AI enthusiasm lifted developed markets. Japan and Europe gained on supportive monetary stances. Financials, industrials and information technology were the strongest contributors to the Fund's performance, while real estate, energy and utilities were the weakest contributing sectors. Japan, United Kingdom, and Canada were the strongest contributors. Denmark, Saudi Arabia and India were the weakest contributors to the Fund's performance. |
| Performance Past Does Not Indicate Future [Text] |
The Fund’s past performance is not necessarily an indication of how the Fund will perform in the future. The returns do not reflect the deduction of taxes that a shareholder would pay on Fund distributions or on the redemption or sale of Fund shares.
|
| Line Graph [Table Text Block] |

|
SSGLX |
MSCI All Country World ex USA Index |
MSCI ACWI ex USA Investable Market Index |
12/31/15 |
$10,000 |
$10,000 |
$10,000 |
01/31/16 |
$9,444 |
$9,320 |
$9,320 |
02/29/16 |
$9,266 |
$9,213 |
$9,213 |
03/31/16 |
$10,024 |
$9,962 |
$9,962 |
04/30/16 |
$10,284 |
$10,225 |
$10,225 |
05/31/16 |
$10,118 |
$10,052 |
$10,052 |
06/30/16 |
$10,036 |
$9,898 |
$9,898 |
07/31/16 |
$10,450 |
$10,388 |
$10,388 |
08/31/16 |
$10,509 |
$10,453 |
$10,453 |
09/30/16 |
$10,686 |
$10,582 |
$10,582 |
10/31/16 |
$10,485 |
$10,430 |
$10,430 |
11/30/16 |
$10,249 |
$10,189 |
$10,189 |
12/31/16 |
$10,502 |
$10,450 |
$10,450 |
01/31/17 |
$10,862 |
$10,820 |
$10,820 |
02/28/17 |
$11,030 |
$10,992 |
$10,992 |
03/31/17 |
$11,319 |
$11,271 |
$11,271 |
04/30/17 |
$11,559 |
$11,512 |
$11,512 |
05/31/17 |
$11,944 |
$11,886 |
$11,886 |
06/30/17 |
$11,980 |
$11,923 |
$11,923 |
07/31/17 |
$12,424 |
$12,362 |
$12,362 |
08/31/17 |
$12,496 |
$12,427 |
$12,427 |
09/30/17 |
$12,725 |
$12,657 |
$12,657 |
10/31/17 |
$12,965 |
$12,896 |
$12,896 |
11/30/17 |
$13,097 |
$13,000 |
$13,000 |
12/31/17 |
$13,349 |
$13,291 |
$13,291 |
01/31/18 |
$14,099 |
$14,031 |
$14,031 |
02/28/18 |
$13,349 |
$13,370 |
$13,370 |
03/31/18 |
$13,261 |
$13,134 |
$13,134 |
04/30/18 |
$13,374 |
$13,343 |
$13,343 |
05/31/18 |
$13,111 |
$13,035 |
$13,035 |
06/30/18 |
$12,861 |
$12,790 |
$12,790 |
07/31/18 |
$13,186 |
$13,096 |
$13,096 |
08/31/18 |
$12,899 |
$12,822 |
$12,822 |
09/30/18 |
$12,961 |
$12,881 |
$12,881 |
10/31/18 |
$11,911 |
$11,833 |
$11,833 |
11/30/18 |
$12,024 |
$11,945 |
$11,945 |
12/31/18 |
$11,475 |
$11,404 |
$11,404 |
01/31/19 |
$12,370 |
$12,266 |
$12,266 |
02/28/19 |
$12,586 |
$12,506 |
$12,506 |
03/31/19 |
$12,654 |
$12,580 |
$12,580 |
04/30/19 |
$13,006 |
$12,912 |
$12,912 |
05/31/19 |
$12,315 |
$12,219 |
$12,219 |
06/30/19 |
$13,047 |
$12,955 |
$12,955 |
07/31/19 |
$12,830 |
$12,798 |
$12,798 |
08/31/19 |
$12,491 |
$12,403 |
$12,403 |
09/30/19 |
$12,803 |
$12,722 |
$12,722 |
10/31/19 |
$13,250 |
$13,166 |
$13,160 |
11/30/19 |
$13,372 |
$13,282 |
$13,290 |
12/31/19 |
$13,941 |
$13,857 |
$13,876 |
01/31/20 |
$13,458 |
$13,485 |
$13,496 |
02/29/20 |
$12,536 |
$12,419 |
$12,406 |
03/31/20 |
$10,505 |
$10,621 |
$10,531 |
04/30/20 |
$11,391 |
$11,426 |
$11,389 |
05/31/20 |
$11,867 |
$11,800 |
$11,803 |
06/30/20 |
$12,422 |
$12,333 |
$12,317 |
07/31/20 |
$12,950 |
$12,883 |
$12,875 |
08/31/20 |
$13,535 |
$13,434 |
$13,464 |
09/30/20 |
$13,255 |
$13,104 |
$13,154 |
10/31/20 |
$12,954 |
$12,822 |
$12,862 |
11/30/20 |
$14,664 |
$14,547 |
$14,599 |
12/31/20 |
$15,486 |
$15,334 |
$15,419 |
01/31/21 |
$15,491 |
$15,367 |
$15,445 |
02/28/21 |
$15,836 |
$15,671 |
$15,785 |
03/31/21 |
$16,057 |
$15,869 |
$16,001 |
04/30/21 |
$16,564 |
$16,336 |
$16,508 |
05/31/21 |
$17,050 |
$16,847 |
$17,006 |
06/30/21 |
$16,962 |
$16,738 |
$16,896 |
07/31/21 |
$16,740 |
$16,462 |
$16,677 |
08/31/21 |
$17,065 |
$16,775 |
$17,004 |
09/30/21 |
$16,448 |
$16,238 |
$16,464 |
10/31/21 |
$16,894 |
$16,626 |
$16,837 |
11/30/21 |
$16,078 |
$15,877 |
$16,068 |
12/31/21 |
$16,780 |
$16,533 |
$16,734 |
01/31/22 |
$16,251 |
$15,924 |
$16,055 |
02/28/22 |
$15,778 |
$15,609 |
$15,753 |
03/31/22 |
$15,760 |
$15,634 |
$15,797 |
04/30/22 |
$14,725 |
$14,652 |
$14,801 |
05/31/22 |
$14,940 |
$14,757 |
$14,873 |
06/30/22 |
$13,614 |
$13,488 |
$13,541 |
07/31/22 |
$14,160 |
$13,949 |
$14,049 |
08/31/22 |
$13,608 |
$13,501 |
$13,610 |
09/30/22 |
$12,228 |
$12,151 |
$12,229 |
10/31/22 |
$12,660 |
$12,514 |
$12,599 |
11/30/22 |
$14,248 |
$13,992 |
$14,046 |
12/31/22 |
$14,019 |
$13,887 |
$13,959 |
01/31/23 |
$15,207 |
$15,013 |
$15,073 |
02/28/23 |
$14,629 |
$14,486 |
$14,564 |
03/31/23 |
$14,985 |
$14,841 |
$14,875 |
04/30/23 |
$15,253 |
$15,098 |
$15,128 |
05/31/23 |
$14,680 |
$14,549 |
$14,596 |
06/30/23 |
$15,360 |
$15,202 |
$15,230 |
07/31/23 |
$15,965 |
$15,820 |
$15,870 |
08/31/23 |
$15,273 |
$15,106 |
$15,191 |
09/30/23 |
$14,773 |
$14,629 |
$14,698 |
10/31/23 |
$14,188 |
$14,025 |
$14,062 |
11/30/23 |
$15,422 |
$15,288 |
$15,341 |
12/31/23 |
$16,216 |
$16,056 |
$16,140 |
01/31/24 |
$15,977 |
$15,896 |
$15,963 |
02/29/24 |
$16,410 |
$16,299 |
$16,334 |
03/31/24 |
$16,898 |
$16,808 |
$16,838 |
04/30/24 |
$16,543 |
$16,506 |
$16,544 |
05/31/24 |
$17,196 |
$16,985 |
$17,032 |
06/30/24 |
$17,080 |
$16,969 |
$16,992 |
07/31/24 |
$17,506 |
$17,362 |
$17,421 |
08/31/24 |
$17,968 |
$17,857 |
$17,893 |
09/30/24 |
$18,451 |
$18,337 |
$18,382 |
10/31/24 |
$17,482 |
$17,438 |
$17,472 |
11/30/24 |
$17,407 |
$17,280 |
$17,325 |
12/31/24 |
$17,023 |
$16,944 |
$16,984 |
01/31/25 |
$17,629 |
$17,627 |
$17,604 |
02/28/25 |
$17,947 |
$17,872 |
$17,789 |
03/31/25 |
$17,965 |
$17,831 |
$17,764 |
04/30/25 |
$18,552 |
$18,475 |
$18,432 |
05/31/25 |
$19,444 |
$19,321 |
$19,325 |
06/30/25 |
$20,153 |
$19,977 |
$20,021 |
07/31/25 |
$20,017 |
$19,919 |
$19,977 |
08/31/25 |
$20,846 |
$20,611 |
$20,693 |
09/30/25 |
$21,552 |
$21,353 |
$21,395 |
10/31/25 |
$21,932 |
$21,785 |
$21,773 |
11/30/25 |
$21,949 |
$21,779 |
$21,791 |
12/31/25 |
$22,578 |
$22,432 |
$22,413 |
|
| Average Annual Return [Table Text Block] |
Name |
1 Year |
5 Years |
10 Years |
SSGLX |
32.63% |
7.83% |
8.48% |
MSCI All Country World ex USA Index |
32.39% |
7.91% |
8.41% |
MSCI ACWI ex USA Investable Market IndexFootnote Reference(1)Footnote Reference(2) |
31.96% |
7.77% |
8.41% | |
| Updated Performance Information Location [Text Block] |
Updated performance information is available by calling 1-800-647-7327 or visiting our website at www.ssga.com.
|
| AssetsNet |
$ 3,968,412,489
|
| Holdings Count | Holding |
5,797
|
| Advisory Fees Paid, Amount |
$ 0
|
| InvestmentCompanyPortfolioTurnover |
6.00%
|
| Additional Fund Statistics [Text Block] |
Key Fund Statistics as of 12/31/2025- Total Net Assets$3,968,412,489
- Number of Portfolio Holdings5,797
- Portfolio Turnover Rate6%
- Total Advisory Fees Paid$0
Portfolio holdings and portfolio turnover rate are from the corresponding Portfolio, in which the Fund invests. |
| Holdings [Text Block] |
Countries |
% |
Japan |
14.8% |
China |
8.0% |
Canada |
8.0% |
United Kingdom |
7.0% |
Taiwan |
6.2% |
Germany |
5.5% |
United States |
5.2% |
France |
5.1% |
India |
5.0% |
Australia |
4.8% | |
| Largest Holdings [Text Block] |
Holdings |
% |
Taiwan Semiconductor Manufacturing Co. Ltd. |
3.1% |
Tencent Holdings Ltd. |
1.3% |
ASML Holding NV |
1.1% |
Samsung Electronics Co. Ltd. |
1.0% |
Alibaba Group Holding Ltd. |
0.8% |
Roche Holding AG |
0.8% |
AstraZeneca PLC |
0.7% |
HSBC Holdings PLC |
0.7% |
Novartis AG |
0.7% |
Nestle SA |
0.7% | |
| Material Fund Change [Text Block] |
|
| C000143853 |
|
| Shareholder Report [Line Items] |
|
| Fund Name |
State Street Global All Cap Equity ex-U.S. Index Portfolio
|
| Trading Symbol |
SSGVX
|
| Annual or Semi-Annual Statement [Text Block] |
This annual shareholder report contains important information about the State Street Global All Cap Equity ex-U.S. Index Portfolio (the "Fund") for the period of January 1, 2025 through December 31, 2025.
|
| Additional Information [Text Block] |
You can find additional information about the Fund, including the Prospectus, Statement of Additional Information, financial statements and other information at www.ssga.com/us/en/institutional/resources/master-portfolio-fund-documents. You can also request this information about the Fund by contacting us at 1-800-647-7327.
|
| Additional Information Phone Number |
1-800-647-7327
|
| Additional Information Website |
www.ssga.com/us/en/institutional/resources/master-portfolio-fund-documents
|
| Expenses [Text Block] |
What were the Fund costs for the last year? (based on a hypothetical $10,000 Investment)
Fund Name |
Costs of a $10,000 investment |
Costs paid as a percentage of a $10,000 investment |
State Street Global All Cap Equity ex-U.S. Index Portfolio |
$5 |
0.04% | |
| Expenses Paid, Amount |
$ 5
|
| Expense Ratio, Percent |
0.04%
|
| Factors Affecting Performance [Text Block] |
How did the Fund perform last year and what affected its performance?Global markets delivered broad but volatile gains in 2025, shaped by shifting tariff dynamics, monetary easing, and strong technology‑led earnings. Early in the year, trade tensions and reciprocal tariffs weighed on sentiment, leading to sharp pullbacks across the U.S. and parts of Asia, while Europe and emerging markets outperformed on valuation support and fiscal stimulus. 2025 delivered strong global performance as falling rates, resilient earnings, and AI enthusiasm lifted developed markets. Japan and Europe gained on supportive monetary stances. Financials, industrials and information technology were the strongest contributors to the Fund's performance, while real estate, energy and utilities were the weakest contributing sectors. Japan, United Kingdom, and Canada were the strongest contributors. Denmark, Saudi Arabia and India were the weakest contributors to the Fund's performance. |
| Performance Past Does Not Indicate Future [Text] |
The Fund’s past performance is not necessarily an indication of how the Fund will perform in the future. The returns do not reflect the deduction of taxes that a shareholder would pay on Fund distributions or on the redemption or sale of Fund shares.
|
| Line Graph [Table Text Block] |

|
SSGVX |
MSCI All Country World ex USA Index |
MSCI ACWI ex USA Investable Market Index |
12/31/15 |
$10,000 |
$10,000 |
$10,000 |
01/31/16 |
$9,444 |
$9,320 |
$9,320 |
02/29/16 |
$9,266 |
$9,213 |
$9,213 |
03/31/16 |
$10,024 |
$9,962 |
$9,962 |
04/30/16 |
$10,284 |
$10,225 |
$10,225 |
05/31/16 |
$10,118 |
$10,052 |
$10,052 |
06/30/16 |
$10,036 |
$9,898 |
$9,898 |
07/31/16 |
$10,450 |
$10,388 |
$10,388 |
08/31/16 |
$10,509 |
$10,453 |
$10,453 |
09/30/16 |
$10,686 |
$10,582 |
$10,582 |
10/31/16 |
$10,485 |
$10,430 |
$10,430 |
11/30/16 |
$10,249 |
$10,189 |
$10,189 |
12/31/16 |
$10,506 |
$10,450 |
$10,450 |
01/31/17 |
$10,867 |
$10,820 |
$10,820 |
02/28/17 |
$11,035 |
$10,992 |
$10,992 |
03/31/17 |
$11,324 |
$11,271 |
$11,271 |
04/30/17 |
$11,564 |
$11,512 |
$11,512 |
05/31/17 |
$11,949 |
$11,886 |
$11,886 |
06/30/17 |
$11,985 |
$11,923 |
$11,923 |
07/31/17 |
$12,430 |
$12,362 |
$12,362 |
08/31/17 |
$12,502 |
$12,427 |
$12,427 |
09/30/17 |
$12,730 |
$12,657 |
$12,657 |
10/31/17 |
$12,971 |
$12,896 |
$12,896 |
11/30/17 |
$13,103 |
$13,000 |
$13,000 |
12/31/17 |
$13,364 |
$13,291 |
$13,291 |
01/31/18 |
$14,118 |
$14,031 |
$14,031 |
02/28/18 |
$13,364 |
$13,370 |
$13,370 |
03/31/18 |
$13,277 |
$13,134 |
$13,134 |
04/30/18 |
$13,389 |
$13,343 |
$13,343 |
05/31/18 |
$13,129 |
$13,035 |
$13,035 |
06/30/18 |
$12,882 |
$12,790 |
$12,790 |
07/31/18 |
$13,203 |
$13,096 |
$13,096 |
08/31/18 |
$12,919 |
$12,822 |
$12,822 |
09/30/18 |
$12,981 |
$12,881 |
$12,881 |
10/31/18 |
$11,930 |
$11,833 |
$11,833 |
11/30/18 |
$12,041 |
$11,945 |
$11,945 |
12/31/18 |
$11,494 |
$11,404 |
$11,404 |
01/31/19 |
$12,386 |
$12,266 |
$12,266 |
02/28/19 |
$12,603 |
$12,506 |
$12,506 |
03/31/19 |
$12,680 |
$12,580 |
$12,580 |
04/30/19 |
$13,024 |
$12,912 |
$12,912 |
05/31/19 |
$12,348 |
$12,219 |
$12,219 |
06/30/19 |
$13,087 |
$12,955 |
$12,955 |
07/31/19 |
$12,871 |
$12,798 |
$12,798 |
08/31/19 |
$12,527 |
$12,403 |
$12,403 |
09/30/19 |
$12,845 |
$12,722 |
$12,722 |
10/31/19 |
$13,291 |
$13,166 |
$13,160 |
11/30/19 |
$13,419 |
$13,282 |
$13,290 |
12/31/19 |
$13,989 |
$13,857 |
$13,876 |
01/31/20 |
$13,504 |
$13,485 |
$13,496 |
02/29/20 |
$12,572 |
$12,419 |
$12,406 |
03/31/20 |
$10,538 |
$10,621 |
$10,531 |
04/30/20 |
$11,430 |
$11,426 |
$11,389 |
05/31/20 |
$11,906 |
$11,800 |
$11,803 |
06/30/20 |
$12,463 |
$12,333 |
$12,317 |
07/31/20 |
$12,993 |
$12,883 |
$12,875 |
08/31/20 |
$13,580 |
$13,434 |
$13,464 |
09/30/20 |
$13,300 |
$13,104 |
$13,154 |
10/31/20 |
$12,997 |
$12,822 |
$12,862 |
11/30/20 |
$14,712 |
$14,547 |
$14,599 |
12/31/20 |
$15,537 |
$15,334 |
$15,419 |
01/31/21 |
$15,543 |
$15,367 |
$15,445 |
02/28/21 |
$15,888 |
$15,671 |
$15,785 |
03/31/21 |
$16,111 |
$15,869 |
$16,001 |
04/30/21 |
$16,618 |
$16,336 |
$16,508 |
05/31/21 |
$17,107 |
$16,847 |
$17,006 |
06/30/21 |
$17,020 |
$16,738 |
$16,896 |
07/31/21 |
$16,797 |
$16,462 |
$16,677 |
08/31/21 |
$17,123 |
$16,775 |
$17,004 |
09/30/21 |
$16,505 |
$16,238 |
$16,464 |
10/31/21 |
$16,952 |
$16,626 |
$16,837 |
11/30/21 |
$16,134 |
$15,877 |
$16,068 |
12/31/21 |
$16,838 |
$16,533 |
$16,734 |
01/31/22 |
$16,307 |
$15,924 |
$16,055 |
02/28/22 |
$15,834 |
$15,609 |
$15,753 |
03/31/22 |
$15,815 |
$15,634 |
$15,797 |
04/30/22 |
$14,778 |
$14,652 |
$14,801 |
05/31/22 |
$14,994 |
$14,757 |
$14,873 |
06/30/22 |
$13,664 |
$13,488 |
$13,541 |
07/31/22 |
$14,212 |
$13,949 |
$14,049 |
08/31/22 |
$13,658 |
$13,501 |
$13,610 |
09/30/22 |
$12,273 |
$12,151 |
$12,229 |
10/31/22 |
$12,706 |
$12,514 |
$12,599 |
11/30/22 |
$14,300 |
$13,992 |
$14,046 |
12/31/22 |
$14,072 |
$13,887 |
$13,959 |
01/31/23 |
$15,263 |
$15,013 |
$15,073 |
02/28/23 |
$14,685 |
$14,486 |
$14,564 |
03/31/23 |
$15,042 |
$14,841 |
$14,875 |
04/30/23 |
$15,310 |
$15,098 |
$15,128 |
05/31/23 |
$14,737 |
$14,549 |
$14,596 |
06/30/23 |
$15,418 |
$15,202 |
$15,230 |
07/31/23 |
$16,026 |
$15,820 |
$15,870 |
08/31/23 |
$15,333 |
$15,106 |
$15,191 |
09/30/23 |
$14,831 |
$14,629 |
$14,698 |
10/31/23 |
$14,243 |
$14,025 |
$14,062 |
11/30/23 |
$15,483 |
$15,288 |
$15,341 |
12/31/23 |
$16,279 |
$16,056 |
$16,140 |
01/31/24 |
$16,039 |
$15,896 |
$15,963 |
02/29/24 |
$16,474 |
$16,299 |
$16,334 |
03/31/24 |
$16,965 |
$16,808 |
$16,838 |
04/30/24 |
$16,608 |
$16,506 |
$16,544 |
05/31/24 |
$17,266 |
$16,985 |
$17,032 |
06/30/24 |
$17,149 |
$16,969 |
$16,992 |
07/31/24 |
$17,576 |
$17,362 |
$17,421 |
08/31/24 |
$18,041 |
$17,857 |
$17,893 |
09/30/24 |
$18,527 |
$18,337 |
$18,382 |
10/31/24 |
$17,553 |
$17,438 |
$17,472 |
11/30/24 |
$17,478 |
$17,280 |
$17,325 |
12/31/24 |
$17,093 |
$16,944 |
$16,984 |
01/31/25 |
$17,702 |
$17,627 |
$17,604 |
02/28/25 |
$18,020 |
$17,872 |
$17,789 |
03/31/25 |
$18,040 |
$17,831 |
$17,764 |
04/30/25 |
$18,628 |
$18,475 |
$18,432 |
05/31/25 |
$19,525 |
$19,321 |
$19,325 |
06/30/25 |
$20,238 |
$19,977 |
$20,021 |
07/31/25 |
$20,101 |
$19,919 |
$19,977 |
08/31/25 |
$20,934 |
$20,611 |
$20,693 |
09/30/25 |
$21,644 |
$21,353 |
$21,395 |
10/31/25 |
$22,025 |
$21,785 |
$21,773 |
11/30/25 |
$22,042 |
$21,779 |
$21,791 |
12/31/25 |
$22,676 |
$22,432 |
$22,413 |
|
| Average Annual Return [Table Text Block] |
Name |
1 Year |
5 Years |
10 Years |
SSGVX |
32.67% |
7.85% |
8.53% |
MSCI All Country World ex USA Index |
32.39% |
7.91% |
8.41% |
MSCI ACWI ex USA Investable Market IndexFootnote Reference(1)Footnote Reference(2) |
31.96% |
7.77% |
8.41% | |
| Updated Performance Information Location [Text Block] |
Updated performance information is available by calling 1-800-647-7327 or visiting our website at www.ssga.com.
|
| AssetsNet |
$ 10,893,242,715
|
| Holdings Count | Holding |
5,797
|
| Advisory Fees Paid, Amount |
$ 0
|
| InvestmentCompanyPortfolioTurnover |
6.00%
|
| Additional Fund Statistics [Text Block] |
Key Fund Statistics as of 12/31/2025- Total Net Assets$10,893,242,715
- Number of Portfolio Holdings5,797
- Portfolio Turnover Rate6%
- Total Advisory Fees Paid$0
|
| Holdings [Text Block] |
Countries |
% |
Japan |
14.8% |
China |
8.0% |
Canada |
8.0% |
United Kingdom |
7.0% |
Taiwan |
6.2% |
Germany |
5.5% |
United States |
5.2% |
France |
5.1% |
India |
5.0% |
Australia |
4.8% | |
| Largest Holdings [Text Block] |
Holdings |
% |
Taiwan Semiconductor Manufacturing Co. Ltd. |
3.1% |
Tencent Holdings Ltd. |
1.3% |
ASML Holding NV |
1.1% |
Samsung Electronics Co. Ltd. |
1.0% |
Alibaba Group Holding Ltd. |
0.8% |
Roche Holding AG |
0.8% |
AstraZeneca PLC |
0.7% |
HSBC Holdings PLC |
0.7% |
Novartis AG |
0.7% |
Nestle SA |
0.7% | |
| Material Fund Change [Text Block] |
|
| C000155088 |
|
| Shareholder Report [Line Items] |
|
| Fund Name |
State Street Hedged International Developed Equity Index Fund
|
| Class Name |
Class K
|
| Trading Symbol |
SSHQX
|
| Annual or Semi-Annual Statement [Text Block] |
This annual shareholder report contains important information about the State Street Hedged International Developed Equity Index Fund (the "Fund") for the period of January 1, 2025 through December 31, 2025.
|
| Additional Information [Text Block] |
You can find additional information about the Fund, including the Prospectus, Statement of Additional Information, financial statements and other information at www.ssga.com/us/en/institutional/fund-finder?tab=documents&type=mf. You can also request this information about the Fund by contacting us at 1-800-647-7327.
|
| Additional Information Phone Number |
1-800-647-7327
|
| Additional Information Website |
www.ssga.com/us/en/institutional/fund-finder?tab=documents&type=mf
|
| Expenses [Text Block] |
What were the Fund costs for the last year? (based on a hypothetical $10,000 Investment)
Class Name |
Costs of a $10,000 investment |
Costs paid as a percentage of a $10,000 investment |
Class K |
$22 |
0.20% | The expense table reflects the proportionate share of expenses allocated to the Fund by the affiliated Portfolio, in which the Fund invests. |
| Expenses Paid, Amount |
$ 22
|
| Expense Ratio, Percent |
0.20%
|
| Expenses Represent Both Master and Feeder [Text] |
The expense table reflects the proportionate share of expenses allocated to the Fund by the affiliated Portfolio, in which the Fund invests.
|
| Factors Affecting Performance [Text Block] |
How did the Fund perform last year and what affected its performance?Performance of the Fund for the reporting period was driven by robust earnings growth, Artificial Intelligence-driven optimism, positive services sector and manufacturing data, accommodative monetary policy and moderating inflation and a weak U.S. dollar. During the reporting period, the Fund’s use of their current investment strategies did not cause the Fund’s performance to materially deviate from the manager’s expectations considering the uncertainty of the markets. |
| Performance Past Does Not Indicate Future [Text] |
The Fund’s past performance is not necessarily an indication of how the Fund will perform in the future. The returns do not reflect the deduction of taxes that a shareholder would pay on Fund distributions or on the redemption or sale of Fund shares.
|
| Line Graph [Table Text Block] |
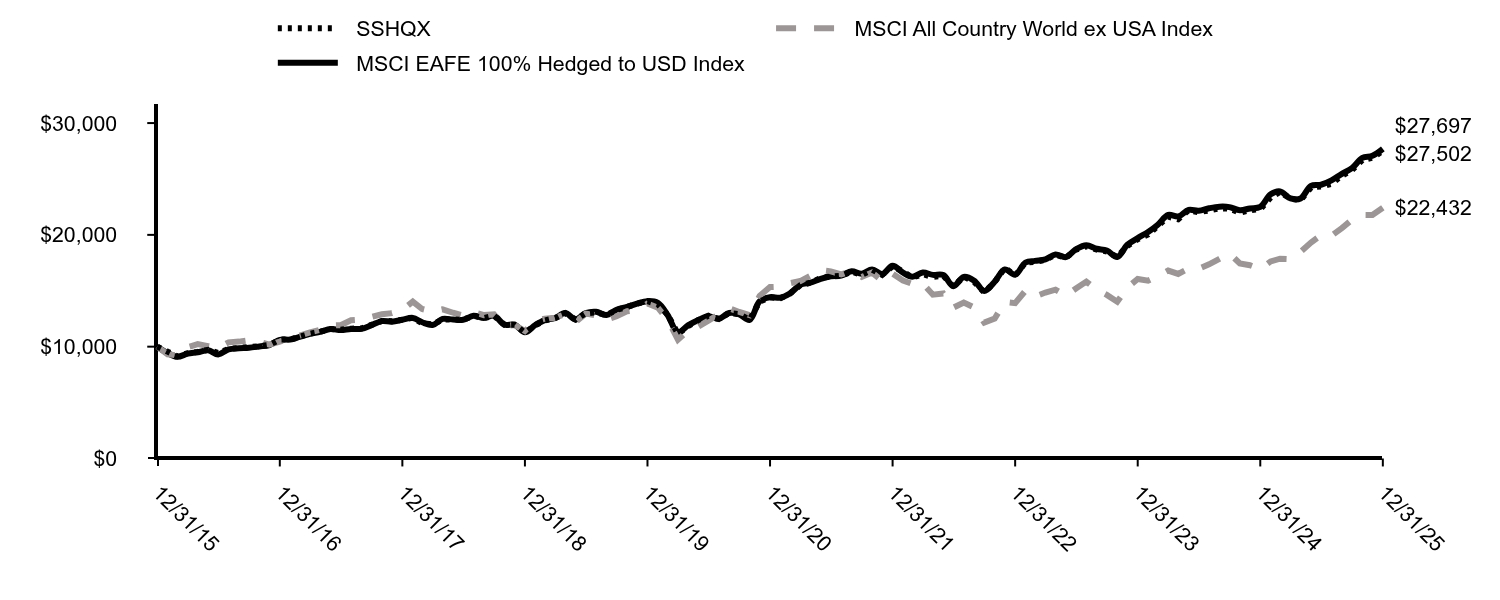
|
SSHQX |
MSCI All Country World ex USA Index |
MSCI EAFE 100% Hedged to USD Index |
12/31/15 |
$10,000 |
$10,000 |
$10,000 |
01/31/16 |
$9,556 |
$9,320 |
$9,430 |
02/29/16 |
$9,134 |
$9,213 |
$9,095 |
03/31/16 |
$9,412 |
$9,962 |
$9,375 |
04/30/16 |
$9,534 |
$10,225 |
$9,495 |
05/31/16 |
$9,723 |
$10,052 |
$9,678 |
06/30/16 |
$9,423 |
$9,898 |
$9,306 |
07/31/16 |
$9,789 |
$10,388 |
$9,756 |
08/31/16 |
$9,889 |
$10,453 |
$9,856 |
09/30/16 |
$9,967 |
$10,582 |
$9,897 |
10/31/16 |
$10,044 |
$10,430 |
$10,023 |
11/30/16 |
$10,166 |
$10,189 |
$10,146 |
12/31/16 |
$10,627 |
$10,450 |
$10,615 |
01/31/17 |
$10,650 |
$10,820 |
$10,638 |
02/28/17 |
$10,881 |
$10,992 |
$10,873 |
03/31/17 |
$11,159 |
$11,271 |
$11,148 |
04/30/17 |
$11,333 |
$11,512 |
$11,318 |
05/31/17 |
$11,588 |
$11,886 |
$11,571 |
06/30/17 |
$11,518 |
$11,923 |
$11,493 |
07/31/17 |
$11,611 |
$12,362 |
$11,585 |
08/31/17 |
$11,622 |
$12,427 |
$11,596 |
09/30/17 |
$11,946 |
$12,657 |
$11,922 |
10/31/17 |
$12,305 |
$12,896 |
$12,286 |
11/30/17 |
$12,282 |
$13,000 |
$12,235 |
12/31/17 |
$12,418 |
$13,291 |
$12,403 |
01/31/18 |
$12,585 |
$14,031 |
$12,572 |
02/28/18 |
$12,107 |
$13,370 |
$12,184 |
03/31/18 |
$11,976 |
$13,134 |
$11,936 |
04/30/18 |
$12,441 |
$13,343 |
$12,481 |
05/31/18 |
$12,429 |
$13,035 |
$12,420 |
06/30/18 |
$12,406 |
$12,790 |
$12,406 |
07/31/18 |
$12,752 |
$13,096 |
$12,756 |
08/31/18 |
$12,561 |
$12,822 |
$12,566 |
09/30/18 |
$12,764 |
$12,881 |
$12,767 |
10/31/18 |
$11,964 |
$11,833 |
$11,972 |
11/30/18 |
$11,964 |
$11,945 |
$11,969 |
12/31/18 |
$11,269 |
$11,404 |
$11,291 |
01/31/19 |
$11,922 |
$12,266 |
$11,937 |
02/28/19 |
$12,345 |
$12,506 |
$12,371 |
03/31/19 |
$12,551 |
$12,580 |
$12,563 |
04/30/19 |
$12,999 |
$12,912 |
$13,011 |
05/31/19 |
$12,422 |
$12,219 |
$12,437 |
06/30/19 |
$12,986 |
$12,955 |
$13,003 |
07/31/19 |
$13,063 |
$12,798 |
$13,119 |
08/31/19 |
$12,820 |
$12,403 |
$12,829 |
09/30/19 |
$13,294 |
$12,722 |
$13,303 |
10/31/19 |
$13,551 |
$13,166 |
$13,554 |
11/30/19 |
$13,845 |
$13,282 |
$13,857 |
12/31/19 |
$14,065 |
$13,857 |
$14,073 |
01/31/20 |
$13,796 |
$13,485 |
$13,922 |
02/29/20 |
$12,880 |
$12,419 |
$12,832 |
03/31/20 |
$11,142 |
$10,621 |
$11,271 |
04/30/20 |
$11,837 |
$11,426 |
$11,901 |
05/31/20 |
$12,383 |
$11,800 |
$12,390 |
06/30/20 |
$12,761 |
$12,333 |
$12,725 |
07/31/20 |
$12,481 |
$12,883 |
$12,495 |
08/31/20 |
$13,001 |
$13,434 |
$13,014 |
09/30/20 |
$12,908 |
$13,104 |
$12,895 |
10/31/20 |
$12,408 |
$12,822 |
$12,396 |
11/30/20 |
$14,045 |
$14,547 |
$14,062 |
12/31/20 |
$14,410 |
$15,334 |
$14,425 |
01/31/21 |
$14,342 |
$15,367 |
$14,378 |
02/28/21 |
$14,736 |
$15,671 |
$14,758 |
03/31/21 |
$15,501 |
$15,869 |
$15,525 |
04/30/21 |
$15,709 |
$16,336 |
$15,730 |
05/31/21 |
$16,155 |
$16,847 |
$16,068 |
06/30/21 |
$16,278 |
$16,738 |
$16,292 |
07/31/21 |
$16,346 |
$16,462 |
$16,364 |
08/31/21 |
$16,713 |
$16,775 |
$16,737 |
09/30/21 |
$16,425 |
$16,238 |
$16,532 |
10/31/21 |
$16,885 |
$16,626 |
$16,903 |
11/30/21 |
$16,419 |
$15,877 |
$16,494 |
12/31/21 |
$17,192 |
$16,533 |
$17,228 |
01/31/22 |
$16,718 |
$15,924 |
$16,618 |
02/28/22 |
$16,188 |
$15,609 |
$16,262 |
03/31/22 |
$16,478 |
$15,634 |
$16,624 |
04/30/22 |
$16,234 |
$14,652 |
$16,421 |
05/31/22 |
$16,357 |
$14,757 |
$16,402 |
06/30/22 |
$15,377 |
$13,488 |
$15,414 |
07/31/22 |
$16,267 |
$13,949 |
$16,237 |
08/31/22 |
$15,789 |
$13,501 |
$15,902 |
09/30/22 |
$14,854 |
$12,151 |
$14,980 |
10/31/22 |
$15,772 |
$12,514 |
$15,809 |
11/30/22 |
$17,045 |
$13,992 |
$16,911 |
12/31/22 |
$16,371 |
$13,887 |
$16,435 |
01/31/23 |
$17,531 |
$15,013 |
$17,527 |
02/28/23 |
$17,593 |
$14,486 |
$17,671 |
03/31/23 |
$17,773 |
$14,841 |
$17,803 |
04/30/23 |
$18,218 |
$15,098 |
$18,252 |
05/31/23 |
$17,951 |
$14,549 |
$18,012 |
06/30/23 |
$18,681 |
$15,202 |
$18,700 |
07/31/23 |
$18,975 |
$15,820 |
$19,061 |
08/31/23 |
$18,678 |
$15,106 |
$18,759 |
09/30/23 |
$18,512 |
$14,629 |
$18,598 |
10/31/23 |
$18,029 |
$14,025 |
$18,022 |
11/30/23 |
$19,004 |
$15,288 |
$19,110 |
12/31/23 |
$19,601 |
$16,056 |
$19,713 |
01/31/24 |
$20,029 |
$15,896 |
$20,255 |
02/29/24 |
$20,782 |
$16,299 |
$20,906 |
03/31/24 |
$21,630 |
$16,808 |
$21,784 |
04/30/24 |
$21,397 |
$16,506 |
$21,644 |
05/31/24 |
$22,211 |
$16,985 |
$22,231 |
06/30/24 |
$22,021 |
$16,969 |
$22,155 |
07/31/24 |
$22,189 |
$17,362 |
$22,377 |
08/31/24 |
$22,381 |
$17,857 |
$22,519 |
09/30/24 |
$22,343 |
$18,337 |
$22,481 |
10/31/24 |
$21,976 |
$17,438 |
$22,199 |
11/30/24 |
$22,218 |
$17,280 |
$22,365 |
12/31/24 |
$22,285 |
$16,944 |
$22,501 |
01/31/25 |
$23,346 |
$17,627 |
$23,627 |
02/28/25 |
$23,845 |
$17,872 |
$23,892 |
03/31/25 |
$23,233 |
$17,831 |
$23,257 |
04/30/25 |
$23,104 |
$18,475 |
$23,258 |
05/31/25 |
$24,239 |
$19,321 |
$24,385 |
06/30/25 |
$24,333 |
$19,977 |
$24,484 |
07/31/25 |
$24,568 |
$19,919 |
$24,870 |
08/31/25 |
$25,292 |
$20,611 |
$25,457 |
09/30/25 |
$25,795 |
$21,353 |
$25,966 |
10/31/25 |
$26,698 |
$21,785 |
$26,881 |
11/30/25 |
$26,893 |
$21,779 |
$27,076 |
12/31/25 |
$27,502 |
$22,432 |
$27,697 |
|
| Average Annual Return [Table Text Block] |
Name |
1 Year |
5 Years |
10 Years |
SSHQX |
23.41% |
13.80% |
10.65% |
MSCI All Country World ex USA Index |
32.39% |
7.91% |
8.41% |
MSCI EAFE 100% Hedged to USD Index |
23.10% |
13.94% |
10.72% | |
| Updated Performance Information Location [Text Block] |
Updated performance information is available by calling 1-800-647-7327 or visiting our website at www.ssga.com.
|
| AssetsNet |
$ 4,283,338,328
|
| Holdings Count | Holding |
779
|
| Advisory Fees Paid, Amount |
$ 0
|
| InvestmentCompanyPortfolioTurnover |
9.00%
|
| Additional Fund Statistics [Text Block] |
Key Fund Statistics as of 12/31/2025- Total Net Assets$4,283,338,328
- Number of Portfolio Holdings779
- Portfolio Turnover Rate9%
- Total Advisory Fees Paid$0
Reflects holdings of the Portfolio, in which the Fund invests. Portfolio turnover rate is from the Portfolio, in which the Fund invests. Advisory fees are paid by the Portfolio, in which the Fund invests. |
| Holdings [Text Block] |
Countries |
% |
Japan |
20.8% |
United Kingdom |
10.7% |
Germany |
9.1% |
United States |
8.9% |
France |
8.6% |
Australia |
6.6% |
Switzerland |
4.7% |
Netherlands |
4.3% |
Spain |
3.5% |
Italy |
3.1% | |
| Largest Holdings [Text Block] |
Holdings |
% |
ASML Holding NV |
1.9% |
Roche Holding AG |
1.4% |
AstraZeneca PLC |
1.3% |
HSBC Holdings PLC |
1.2% |
Novartis AG |
1.2% |
Nestle SA |
1.2% |
SAP SE |
1.2% |
Shell PLC |
1.0% |
Siemens AG |
1.0% |
Toyota Motor Corp. |
0.9% | |
| Material Fund Change [Text Block] |
|
| C000143780 |
|
| Shareholder Report [Line Items] |
|
| Fund Name |
State Street Institutional Treasury Money Market Fund
|
| Class Name |
Administration Class
|
| Trading Symbol |
SSKXX
|
| Annual or Semi-Annual Statement [Text Block] |
This annual shareholder report contains important information about the State Street Institutional Treasury Money Market Fund (the "Fund") for the period of January 1, 2025 through December 31, 2025.
|
| Additional Information [Text Block] |
You can find additional information about the Fund, including the Prospectus, Statement of Additional Information, financial statements and other information at www.ssga.com/us/en/institutional/fund-finder?tab=documents&type=cash. You can also request this information about the Fund by contacting us at 1-866-392-0869.
|
| Additional Information Phone Number |
1-866-392-0869
|
| Additional Information Website |
www.ssga.com/us/en/institutional/fund-finder?tab=documents&type=cash
|
| Expenses [Text Block] |
What were the Fund costs for the last year? (based on a hypothetical $10,000 Investment)
Class Name |
Costs of a $10,000 investment |
Costs paid as a percentage of a $10,000 investment |
Administration Class |
$37 |
0.36% | The expense table reflects the proportionate share of expenses allocated to the Fund by the affiliated Portfolio, in which the Fund invests. |
| Expenses Paid, Amount |
$ 37
|
| Expense Ratio, Percent |
0.36%
|
| Expenses Represent Both Master and Feeder [Text] |
The expense table reflects the proportionate share of expenses allocated to the Fund by the affiliated Portfolio, in which the Fund invests.
|
| AssetsNet |
$ 15,263,754,462
|
| Holdings Count | Holding |
76
|
| Advisory Fees Paid, Amount |
$ 0
|
| Additional Fund Statistics [Text Block] |
Key Fund Statistics as of 12/31/2025- Total Net Assets$15,263,754,462
- Number of Portfolio Holdings76
- Total Advisory Fees Paid$0
Reflects holdings of the Portfolio, in which the Fund invests. Advisory fees are paid by the Portfolio, in which the Fund invests. |
| Holdings [Text Block] |
Assets |
% |
Treasury Debt |
107.3% | |
| Largest Holdings [Text Block] |
Holdings |
% |
U.S. Treasury Bills, 3.85%, due 01/13/26 |
9.2% |
U.S. Treasury Bills, 4.12%, due 01/22/26 |
7.1% |
U.S. Treasury Bills, 3.85%, due 01/08/26 |
5.2% |
U.S. Treasury Bills, 3.86%, due 01/02/26 |
4.9% |
U.S. Treasury Bills, 4.13%, due 01/15/26 |
4.6% |
U.S. Treasury Bills, 3.84%, due 01/06/26 |
4.4% |
U.S. Treasury Bills, 3.82%, due 01/20/26 |
4.3% |
U.S. Treasury Floating Rate Notes, 3.78%, due 07/31/26 |
3.9% |
U.S. Treasury Bills, 3.79%, due 02/03/26 |
3.4% |
U.S. Treasury Bills, 3.80%, due 02/17/26 |
3.0% | |
| C000230479 |
|
| Shareholder Report [Line Items] |
|
| Fund Name |
State Street Institutional Treasury Money Market Fund
|
| Class Name |
Bancroft Capital Class
|
| Trading Symbol |
VTTXX
|
| Annual or Semi-Annual Statement [Text Block] |
This annual shareholder report contains important information about the State Street Institutional Treasury Money Market Fund (the "Fund") for the period of January 1, 2025 through December 31, 2025.
|
| Additional Information [Text Block] |
You can find additional information about the Fund, including the Prospectus, Statement of Additional Information, financial statements and other information at www.ssga.com/us/en/institutional/fund-finder?tab=documents&type=cash. You can also request this information about the Fund by contacting us at 1-866-392-0869.
|
| Additional Information Phone Number |
1-866-392-0869
|
| Additional Information Website |
www.ssga.com/us/en/institutional/fund-finder?tab=documents&type=cash
|
| Expenses [Text Block] |
What were the Fund costs for the last year? (based on a hypothetical $10,000 Investment)
Class Name |
Costs of a $10,000 investment |
Costs paid as a percentage of a $10,000 investment |
Bancroft Capital Class |
$14 |
0.14% | The expense table reflects the proportionate share of expenses allocated to the Fund by the affiliated Portfolio, in which the Fund invests. |
| Expenses Paid, Amount |
$ 14
|
| Expense Ratio, Percent |
0.14%
|
| Expenses Represent Both Master and Feeder [Text] |
The expense table reflects the proportionate share of expenses allocated to the Fund by the affiliated Portfolio, in which the Fund invests.
|
| AssetsNet |
$ 15,263,754,462
|
| Holdings Count | Holding |
76
|
| Advisory Fees Paid, Amount |
$ 0
|
| Additional Fund Statistics [Text Block] |
Key Fund Statistics as of 12/31/2025- Total Net Assets$15,263,754,462
- Number of Portfolio Holdings76
- Total Advisory Fees Paid$0
Reflects holdings of the Portfolio, in which the Fund invests. Advisory fees are paid by the Portfolio, in which the Fund invests. |
| Holdings [Text Block] |
Assets |
% |
Treasury Debt |
107.3% | |
| Largest Holdings [Text Block] |
Holdings |
% |
U.S. Treasury Bills, 3.85%, due 01/13/26 |
9.2% |
U.S. Treasury Bills, 4.12%, due 01/22/26 |
7.1% |
U.S. Treasury Bills, 3.85%, due 01/08/26 |
5.2% |
U.S. Treasury Bills, 3.86%, due 01/02/26 |
4.9% |
U.S. Treasury Bills, 4.13%, due 01/15/26 |
4.6% |
U.S. Treasury Bills, 3.84%, due 01/06/26 |
4.4% |
U.S. Treasury Bills, 3.82%, due 01/20/26 |
4.3% |
U.S. Treasury Floating Rate Notes, 3.78%, due 07/31/26 |
3.9% |
U.S. Treasury Bills, 3.79%, due 02/03/26 |
3.4% |
U.S. Treasury Bills, 3.80%, due 02/17/26 |
3.0% | |
| C000231445 |
|
| Shareholder Report [Line Items] |
|
| Fund Name |
State Street Institutional Treasury Money Market Fund
|
| Class Name |
Cabrera Capital Markets Class
|
| Trading Symbol |
CSJXX
|
| Annual or Semi-Annual Statement [Text Block] |
This annual shareholder report contains important information about the State Street Institutional Treasury Money Market Fund (the "Fund") for the period of January 1, 2025 through December 31, 2025.
|
| Additional Information [Text Block] |
You can find additional information about the Fund, including the Prospectus, Statement of Additional Information, financial statements and other information at www.ssga.com/us/en/institutional/fund-finder?tab=documents&type=cash. You can also request this information about the Fund by contacting us at 1-866-392-0869.
|
| Additional Information Phone Number |
1-866-392-0869
|
| Additional Information Website |
www.ssga.com/us/en/institutional/fund-finder?tab=documents&type=cash
|
| Expenses [Text Block] |
What were the Fund costs for the last year? (based on a hypothetical $10,000 Investment)
Class Name |
Costs of a $10,000 investment |
Costs paid as a percentage of a $10,000 investment |
Cabrera Capital Markets Class |
$14 |
0.14% | The expense table reflects the proportionate share of expenses allocated to the Fund by the affiliated Portfolio, in which the Fund invests. |
| Expenses Paid, Amount |
$ 14
|
| Expense Ratio, Percent |
0.14%
|
| Expenses Represent Both Master and Feeder [Text] |
The expense table reflects the proportionate share of expenses allocated to the Fund by the affiliated Portfolio, in which the Fund invests.
|
| AssetsNet |
$ 15,263,754,462
|
| Holdings Count | Holding |
76
|
| Advisory Fees Paid, Amount |
$ 0
|
| Additional Fund Statistics [Text Block] |
Key Fund Statistics as of 12/31/2025- Total Net Assets$15,263,754,462
- Number of Portfolio Holdings76
- Total Advisory Fees Paid$0
Reflects holdings of the Portfolio, in which the Fund invests. Advisory fees are paid by the Portfolio, in which the Fund invests. |
| Holdings [Text Block] |
Assets |
% |
Treasury Debt |
107.3% | |
| Largest Holdings [Text Block] |
Holdings |
% |
U.S. Treasury Bills, 3.85%, due 01/13/26 |
9.2% |
U.S. Treasury Bills, 4.12%, due 01/22/26 |
7.1% |
U.S. Treasury Bills, 3.85%, due 01/08/26 |
5.2% |
U.S. Treasury Bills, 3.86%, due 01/02/26 |
4.9% |
U.S. Treasury Bills, 4.13%, due 01/15/26 |
4.6% |
U.S. Treasury Bills, 3.84%, due 01/06/26 |
4.4% |
U.S. Treasury Bills, 3.82%, due 01/20/26 |
4.3% |
U.S. Treasury Floating Rate Notes, 3.78%, due 07/31/26 |
3.9% |
U.S. Treasury Bills, 3.79%, due 02/03/26 |
3.4% |
U.S. Treasury Bills, 3.80%, due 02/17/26 |
3.0% | |
| C000143781 |
|
| Shareholder Report [Line Items] |
|
| Fund Name |
State Street Institutional Treasury Money Market Fund
|
| Class Name |
Institutional Class
|
| Trading Symbol |
SSJXX
|
| Annual or Semi-Annual Statement [Text Block] |
This annual shareholder report contains important information about the State Street Institutional Treasury Money Market Fund (the "Fund") for the period of January 1, 2025 through December 31, 2025.
|
| Additional Information [Text Block] |
You can find additional information about the Fund, including the Prospectus, Statement of Additional Information, financial statements and other information at www.ssga.com/us/en/institutional/fund-finder?tab=documents&type=cash. You can also request this information about the Fund by contacting us at 1-866-392-0869.
|
| Additional Information Phone Number |
1-866-392-0869
|
| Additional Information Website |
www.ssga.com/us/en/institutional/fund-finder?tab=documents&type=cash
|
| Expenses [Text Block] |
What were the Fund costs for the last year? (based on a hypothetical $10,000 Investment)
Class Name |
Costs of a $10,000 investment |
Costs paid as a percentage of a $10,000 investment |
Institutional Class |
$14 |
0.14% | The expense table reflects the proportionate share of expenses allocated to the Fund by the affiliated Portfolio, in which the Fund invests. |
| Expenses Paid, Amount |
$ 14
|
| Expense Ratio, Percent |
0.14%
|
| Expenses Represent Both Master and Feeder [Text] |
The expense table reflects the proportionate share of expenses allocated to the Fund by the affiliated Portfolio, in which the Fund invests.
|
| AssetsNet |
$ 15,263,754,462
|
| Holdings Count | Holding |
76
|
| Advisory Fees Paid, Amount |
$ 0
|
| Additional Fund Statistics [Text Block] |
Key Fund Statistics as of 12/31/2025- Total Net Assets$15,263,754,462
- Number of Portfolio Holdings76
- Total Advisory Fees Paid$0
Reflects holdings of the Portfolio, in which the Fund invests. Advisory fees are paid by the Portfolio, in which the Fund invests. |
| Holdings [Text Block] |
Assets |
% |
Treasury Debt |
107.3% | |
| Largest Holdings [Text Block] |
Holdings |
% |
U.S. Treasury Bills, 3.85%, due 01/13/26 |
9.2% |
U.S. Treasury Bills, 4.12%, due 01/22/26 |
7.1% |
U.S. Treasury Bills, 3.85%, due 01/08/26 |
5.2% |
U.S. Treasury Bills, 3.86%, due 01/02/26 |
4.9% |
U.S. Treasury Bills, 4.13%, due 01/15/26 |
4.6% |
U.S. Treasury Bills, 3.84%, due 01/06/26 |
4.4% |
U.S. Treasury Bills, 3.82%, due 01/20/26 |
4.3% |
U.S. Treasury Floating Rate Notes, 3.78%, due 07/31/26 |
3.9% |
U.S. Treasury Bills, 3.79%, due 02/03/26 |
3.4% |
U.S. Treasury Bills, 3.80%, due 02/17/26 |
3.0% | |
| C000052878 |
|
| Shareholder Report [Line Items] |
|
| Fund Name |
State Street Institutional Treasury Money Market Fund
|
| Class Name |
Investment Class
|
| Trading Symbol |
TRVXX
|
| Annual or Semi-Annual Statement [Text Block] |
This annual shareholder report contains important information about the State Street Institutional Treasury Money Market Fund (the "Fund") for the period of January 1, 2025 through December 31, 2025.
|
| Additional Information [Text Block] |
You can find additional information about the Fund, including the Prospectus, Statement of Additional Information, financial statements and other information at www.ssga.com/us/en/institutional/fund-finder?tab=documents&type=cash. You can also request this information about the Fund by contacting us at 1-866-392-0869.
|
| Additional Information Phone Number |
1-866-392-0869
|
| Additional Information Website |
www.ssga.com/us/en/institutional/fund-finder?tab=documents&type=cash
|
| Expenses [Text Block] |
What were the Fund costs for the last year? (based on a hypothetical $10,000 Investment)
Class Name |
Costs of a $10,000 investment |
Costs paid as a percentage of a $10,000 investment |
Investment Class |
$47 |
0.46% | The expense table reflects the proportionate share of expenses allocated to the Fund by the affiliated Portfolio, in which the Fund invests. |
| Expenses Paid, Amount |
$ 47
|
| Expense Ratio, Percent |
0.46%
|
| Expenses Represent Both Master and Feeder [Text] |
The expense table reflects the proportionate share of expenses allocated to the Fund by the affiliated Portfolio, in which the Fund invests.
|
| AssetsNet |
$ 15,263,754,462
|
| Holdings Count | Holding |
76
|
| Advisory Fees Paid, Amount |
$ 0
|
| Additional Fund Statistics [Text Block] |
Key Fund Statistics as of 12/31/2025- Total Net Assets$15,263,754,462
- Number of Portfolio Holdings76
- Total Advisory Fees Paid$0
Reflects holdings of the Portfolio, in which the Fund invests. Advisory fees are paid by the Portfolio, in which the Fund invests. |
| Holdings [Text Block] |
Assets |
% |
Treasury Debt |
107.3% | |
| Largest Holdings [Text Block] |
Holdings |
% |
U.S. Treasury Bills, 3.85%, due 01/13/26 |
9.2% |
U.S. Treasury Bills, 4.12%, due 01/22/26 |
7.1% |
U.S. Treasury Bills, 3.85%, due 01/08/26 |
5.2% |
U.S. Treasury Bills, 3.86%, due 01/02/26 |
4.9% |
U.S. Treasury Bills, 4.13%, due 01/15/26 |
4.6% |
U.S. Treasury Bills, 3.84%, due 01/06/26 |
4.4% |
U.S. Treasury Bills, 3.82%, due 01/20/26 |
4.3% |
U.S. Treasury Floating Rate Notes, 3.78%, due 07/31/26 |
3.9% |
U.S. Treasury Bills, 3.79%, due 02/03/26 |
3.4% |
U.S. Treasury Bills, 3.80%, due 02/17/26 |
3.0% | |
| C000143782 |
|
| Shareholder Report [Line Items] |
|
| Fund Name |
State Street Institutional Treasury Money Market Fund
|
| Class Name |
Investor Class
|
| Trading Symbol |
SSNXX
|
| Annual or Semi-Annual Statement [Text Block] |
This annual shareholder report contains important information about the State Street Institutional Treasury Money Market Fund (the "Fund") for the period of January 1, 2025 through December 31, 2025.
|
| Additional Information [Text Block] |
You can find additional information about the Fund, including the Prospectus, Statement of Additional Information, financial statements and other information at www.ssga.com/us/en/institutional/fund-finder?tab=documents&type=cash. You can also request this information about the Fund by contacting us at 1-866-392-0869.
|
| Additional Information Phone Number |
1-866-392-0869
|
| Additional Information Website |
www.ssga.com/us/en/institutional/fund-finder?tab=documents&type=cash
|
| Expenses [Text Block] |
What were the Fund costs for the last year? (based on a hypothetical $10,000 Investment)
Class Name |
Costs of a $10,000 investment |
Costs paid as a percentage of a $10,000 investment |
Investor Class |
$19 |
0.19% | The expense table reflects the proportionate share of expenses allocated to the Fund by the affiliated Portfolio, in which the Fund invests. |
| Expenses Paid, Amount |
$ 19
|
| Expense Ratio, Percent |
0.19%
|
| Expenses Represent Both Master and Feeder [Text] |
The expense table reflects the proportionate share of expenses allocated to the Fund by the affiliated Portfolio, in which the Fund invests.
|
| AssetsNet |
$ 15,263,754,462
|
| Holdings Count | Holding |
76
|
| Advisory Fees Paid, Amount |
$ 0
|
| Additional Fund Statistics [Text Block] |
Key Fund Statistics as of 12/31/2025- Total Net Assets$15,263,754,462
- Number of Portfolio Holdings76
- Total Advisory Fees Paid$0
Reflects holdings of the Portfolio, in which the Fund invests. Advisory fees are paid by the Portfolio, in which the Fund invests. |
| Holdings [Text Block] |
Assets |
% |
Treasury Debt |
107.3% | |
| Largest Holdings [Text Block] |
Holdings |
% |
U.S. Treasury Bills, 3.85%, due 01/13/26 |
9.2% |
U.S. Treasury Bills, 4.12%, due 01/22/26 |
7.1% |
U.S. Treasury Bills, 3.85%, due 01/08/26 |
5.2% |
U.S. Treasury Bills, 3.86%, due 01/02/26 |
4.9% |
U.S. Treasury Bills, 4.13%, due 01/15/26 |
4.6% |
U.S. Treasury Bills, 3.84%, due 01/06/26 |
4.4% |
U.S. Treasury Bills, 3.82%, due 01/20/26 |
4.3% |
U.S. Treasury Floating Rate Notes, 3.78%, due 07/31/26 |
3.9% |
U.S. Treasury Bills, 3.79%, due 02/03/26 |
3.4% |
U.S. Treasury Bills, 3.80%, due 02/17/26 |
3.0% | |
| C000231964 |
|
| Shareholder Report [Line Items] |
|
| Fund Name |
State Street Institutional Treasury Money Market Fund
|
| Class Name |
Opportunity Class
|
| Trading Symbol |
OPRXX
|
| Annual or Semi-Annual Statement [Text Block] |
This annual shareholder report contains important information about the State Street Institutional Treasury Money Market Fund (the "Fund") for the period of January 1, 2025 through December 31, 2025.
|
| Additional Information [Text Block] |
You can find additional information about the Fund, including the Prospectus, Statement of Additional Information, financial statements and other information at www.ssga.com/us/en/institutional/fund-finder?tab=documents&type=cash. You can also request this information about the Fund by contacting us at 1-866-392-0869.
|
| Additional Information Phone Number |
1-866-392-0869
|
| Additional Information Website |
www.ssga.com/us/en/institutional/fund-finder?tab=documents&type=cash
|
| Expenses [Text Block] |
What were the Fund costs for the last year? (based on a hypothetical $10,000 Investment)
Class Name |
Costs of a $10,000 investment |
Costs paid as a percentage of a $10,000 investment |
Opportunity Class |
$14 |
0.14% | The expense table reflects the proportionate share of expenses allocated to the Fund by the affiliated Portfolio, in which the Fund invests. |
| Expenses Paid, Amount |
$ 14
|
| Expense Ratio, Percent |
0.14%
|
| Expenses Represent Both Master and Feeder [Text] |
The expense table reflects the proportionate share of expenses allocated to the Fund by the affiliated Portfolio, in which the Fund invests.
|
| AssetsNet |
$ 15,263,754,462
|
| Holdings Count | Holding |
76
|
| Advisory Fees Paid, Amount |
$ 0
|
| Additional Fund Statistics [Text Block] |
Key Fund Statistics as of 12/31/2025- Total Net Assets$15,263,754,462
- Number of Portfolio Holdings76
- Total Advisory Fees Paid$0
Reflects holdings of the Portfolio, in which the Fund invests. Advisory fees are paid by the Portfolio, in which the Fund invests. |
| Holdings [Text Block] |
Assets |
% |
Treasury Debt |
107.3% | |
| Largest Holdings [Text Block] |
Holdings |
% |
U.S. Treasury Bills, 3.85%, due 01/13/26 |
9.2% |
U.S. Treasury Bills, 4.12%, due 01/22/26 |
7.1% |
U.S. Treasury Bills, 3.85%, due 01/08/26 |
5.2% |
U.S. Treasury Bills, 3.86%, due 01/02/26 |
4.9% |
U.S. Treasury Bills, 4.13%, due 01/15/26 |
4.6% |
U.S. Treasury Bills, 3.84%, due 01/06/26 |
4.4% |
U.S. Treasury Bills, 3.82%, due 01/20/26 |
4.3% |
U.S. Treasury Floating Rate Notes, 3.78%, due 07/31/26 |
3.9% |
U.S. Treasury Bills, 3.79%, due 02/03/26 |
3.4% |
U.S. Treasury Bills, 3.80%, due 02/17/26 |
3.0% | |
| C000052877 |
|
| Shareholder Report [Line Items] |
|
| Fund Name |
State Street Institutional Treasury Money Market Fund
|
| Class Name |
Premier Class
|
| Trading Symbol |
TRIXX
|
| Annual or Semi-Annual Statement [Text Block] |
This annual shareholder report contains important information about the State Street Institutional Treasury Money Market Fund (the "Fund") for the period of January 1, 2025 through December 31, 2025.
|
| Additional Information [Text Block] |
You can find additional information about the Fund, including the Prospectus, Statement of Additional Information, financial statements and other information at www.ssga.com/us/en/institutional/fund-finder?tab=documents&type=cash. You can also request this information about the Fund by contacting us at 1-866-392-0869.
|
| Additional Information Phone Number |
1-866-392-0869
|
| Additional Information Website |
www.ssga.com/us/en/institutional/fund-finder?tab=documents&type=cash
|
| Expenses [Text Block] |
What were the Fund costs for the last year? (based on a hypothetical $10,000 Investment)
Class Name |
Costs of a $10,000 investment |
Costs paid as a percentage of a $10,000 investment |
Premier Class |
$11 |
0.11% | The expense table reflects the proportionate share of expenses allocated to the Fund by the affiliated Portfolio, in which the Fund invests. |
| Expenses Paid, Amount |
$ 11
|
| Expense Ratio, Percent |
0.11%
|
| Expenses Represent Both Master and Feeder [Text] |
The expense table reflects the proportionate share of expenses allocated to the Fund by the affiliated Portfolio, in which the Fund invests.
|
| AssetsNet |
$ 15,263,754,462
|
| Holdings Count | Holding |
76
|
| Advisory Fees Paid, Amount |
$ 0
|
| Additional Fund Statistics [Text Block] |
Key Fund Statistics as of 12/31/2025- Total Net Assets$15,263,754,462
- Number of Portfolio Holdings76
- Total Advisory Fees Paid$0
Reflects holdings of the Portfolio, in which the Fund invests. Advisory fees are paid by the Portfolio, in which the Fund invests. |
| Holdings [Text Block] |
Assets |
% |
Treasury Debt |
107.3% | |
| Largest Holdings [Text Block] |
Holdings |
% |
U.S. Treasury Bills, 3.85%, due 01/13/26 |
9.2% |
U.S. Treasury Bills, 4.12%, due 01/22/26 |
7.1% |
U.S. Treasury Bills, 3.85%, due 01/08/26 |
5.2% |
U.S. Treasury Bills, 3.86%, due 01/02/26 |
4.9% |
U.S. Treasury Bills, 4.13%, due 01/15/26 |
4.6% |
U.S. Treasury Bills, 3.84%, due 01/06/26 |
4.4% |
U.S. Treasury Bills, 3.82%, due 01/20/26 |
4.3% |
U.S. Treasury Floating Rate Notes, 3.78%, due 07/31/26 |
3.9% |
U.S. Treasury Bills, 3.79%, due 02/03/26 |
3.4% |
U.S. Treasury Bills, 3.80%, due 02/17/26 |
3.0% | |
| C000143785 |
|
| Shareholder Report [Line Items] |
|
| Fund Name |
State Street Institutional Treasury Plus Money Market Fund
|
| Class Name |
Administration Class
|
| Trading Symbol |
SSQXX
|
| Annual or Semi-Annual Statement [Text Block] |
This annual shareholder report contains important information about the State Street Institutional Treasury Plus Money Market Fund (the "Fund") for the period of January 1, 2025 through December 31, 2025.
|
| Additional Information [Text Block] |
You can find additional information about the Fund, including the Prospectus, Statement of Additional Information, financial statements and other information at www.ssga.com/us/en/institutional/fund-finder?tab=documents&type=cash. You can also request this information about the Fund by contacting us at 1-866-392-0869.
|
| Additional Information Phone Number |
1-866-392-0869
|
| Additional Information Website |
www.ssga.com/us/en/institutional/fund-finder?tab=documents&type=cash
|
| Expenses [Text Block] |
What were the Fund costs for the last year? (based on a hypothetical $10,000 Investment)
Class Name |
Costs of a $10,000 investment |
Costs paid as a percentage of a $10,000 investment |
Administration Class |
$37 |
0.36% | The expense table reflects the proportionate share of expenses allocated to the Fund by the affiliated Portfolio, in which the Fund invests. |
| Expenses Paid, Amount |
$ 37
|
| Expense Ratio, Percent |
0.36%
|
| Expenses Represent Both Master and Feeder [Text] |
The expense table reflects the proportionate share of expenses allocated to the Fund by the affiliated Portfolio, in which the Fund invests.
|
| AssetsNet |
$ 63,605,807,227
|
| Holdings Count | Holding |
105
|
| Advisory Fees Paid, Amount |
$ 0
|
| Additional Fund Statistics [Text Block] |
Key Fund Statistics as of 12/31/2025- Total Net Assets$63,605,807,227
- Number of Portfolio Holdings105
- Total Advisory Fees Paid$0
Reflects holdings of the Portfolio, in which the Fund invests. Advisory fees are paid by the Portfolio, in which the Fund invests. |
| Holdings [Text Block] |
Assets |
% |
Treasury Debt |
56.0% |
Treasury Repurchase Agreements |
37.6% | |
| Largest Holdings [Text Block] |
Holdings |
% |
FICCBA TRI PARTY REPO A, 3.83%, due 01/02/26 |
7.1% |
JP MORGAN SEC LLC TPR A, 3.82%, due 01/02/26 |
6.3% |
FICCMS TRI PARTY REPO A, 3.85%, due 01/02/26 |
4.1% |
FICCJP TRI PARTY REPO A, 3.82%, due 01/02/26 |
3.9% |
U.S. Treasury Bills, 4.10%, due 01/02/26 |
3.7% |
FICCUB BI PARTY REPO, 3.85%, due 01/02/26 |
2.9% |
U.S. Treasury Floating Rate Notes, 3.70%, due 01/31/27 |
2.8% |
U.S. Treasury Floating Rate Notes, 3.81%, due 10/31/26 |
2.6% |
U.S. Treasury Floating Rate Notes, 3.78%, due 07/31/26 |
2.3% |
U.S. Treasury Bills, 4.15%, due 01/08/26 |
2.2% | |
| C000230480 |
|
| Shareholder Report [Line Items] |
|
| Fund Name |
State Street Institutional Treasury Plus Money Market Fund
|
| Class Name |
Bancroft Capital Class
|
| Trading Symbol |
VTLXX
|
| Annual or Semi-Annual Statement [Text Block] |
This annual shareholder report contains important information about the State Street Institutional Treasury Plus Money Market Fund (the "Fund") for the period of January 1, 2025 through December 31, 2025.
|
| Additional Information [Text Block] |
You can find additional information about the Fund, including the Prospectus, Statement of Additional Information, financial statements and other information at www.ssga.com/us/en/institutional/fund-finder?tab=documents&type=cash. You can also request this information about the Fund by contacting us at 1-866-392-0869.
|
| Additional Information Phone Number |
1-866-392-0869
|
| Additional Information Website |
www.ssga.com/us/en/institutional/fund-finder?tab=documents&type=cash
|
| Expenses [Text Block] |
What were the Fund costs for the last year? (based on a hypothetical $10,000 Investment)
Class Name |
Costs of a $10,000 investment |
Costs paid as a percentage of a $10,000 investment |
Bancroft Capital Class |
$14 |
0.14% | The expense table reflects the proportionate share of expenses allocated to the Fund by the affiliated Portfolio, in which the Fund invests. |
| Expenses Paid, Amount |
$ 14
|
| Expense Ratio, Percent |
0.14%
|
| Expenses Represent Both Master and Feeder [Text] |
The expense table reflects the proportionate share of expenses allocated to the Fund by the affiliated Portfolio, in which the Fund invests.
|
| AssetsNet |
$ 63,605,807,227
|
| Holdings Count | Holding |
105
|
| Advisory Fees Paid, Amount |
$ 0
|
| Additional Fund Statistics [Text Block] |
Key Fund Statistics as of 12/31/2025- Total Net Assets$63,605,807,227
- Number of Portfolio Holdings105
- Total Advisory Fees Paid$0
Reflects holdings of the Portfolio, in which the Fund invests. Advisory fees are paid by the Portfolio, in which the Fund invests. |
| Holdings [Text Block] |
Assets |
% |
Treasury Debt |
56.0% |
Treasury Repurchase Agreements |
37.6% | |
| Largest Holdings [Text Block] |
Holdings |
% |
FICCBA TRI PARTY REPO A, 3.83%, due 01/02/26 |
7.1% |
JP MORGAN SEC LLC TPR A, 3.82%, due 01/02/26 |
6.3% |
FICCMS TRI PARTY REPO A, 3.85%, due 01/02/26 |
4.1% |
FICCJP TRI PARTY REPO A, 3.82%, due 01/02/26 |
3.9% |
U.S. Treasury Bills, 4.10%, due 01/02/26 |
3.7% |
FICCUB BI PARTY REPO, 3.85%, due 01/02/26 |
2.9% |
U.S. Treasury Floating Rate Notes, 3.70%, due 01/31/27 |
2.8% |
U.S. Treasury Floating Rate Notes, 3.81%, due 10/31/26 |
2.6% |
U.S. Treasury Floating Rate Notes, 3.78%, due 07/31/26 |
2.3% |
U.S. Treasury Bills, 4.15%, due 01/08/26 |
2.2% | |
| C000231448 |
|
| Shareholder Report [Line Items] |
|
| Fund Name |
State Street Institutional Treasury Plus Money Market Fund
|
| Class Name |
Blaylock Van Class
|
| Trading Symbol |
BVYXX
|
| Annual or Semi-Annual Statement [Text Block] |
This annual shareholder report contains important information about the State Street Institutional Treasury Plus Money Market Fund (the "Fund") for the period of January 1, 2025 through December 31, 2025.
|
| Additional Information [Text Block] |
You can find additional information about the Fund, including the Prospectus, Statement of Additional Information, financial statements and other information at www.ssga.com/us/en/institutional/fund-finder?tab=documents&type=cash. You can also request this information about the Fund by contacting us at 1-866-392-0869.
|
| Additional Information Phone Number |
1-866-392-0869
|
| Additional Information Website |
www.ssga.com/us/en/institutional/fund-finder?tab=documents&type=cash
|
| Expenses [Text Block] |
What were the Fund costs for the last year? (based on a hypothetical $10,000 Investment)
Class Name |
Costs of a $10,000 investment |
Costs paid as a percentage of a $10,000 investment |
Blaylock Van Class |
$14 |
0.14% | The expense table reflects the proportionate share of expenses allocated to the Fund by the affiliated Portfolio, in which the Fund invests. |
| Expenses Paid, Amount |
$ 14
|
| Expense Ratio, Percent |
0.14%
|
| Expenses Represent Both Master and Feeder [Text] |
The expense table reflects the proportionate share of expenses allocated to the Fund by the affiliated Portfolio, in which the Fund invests.
|
| AssetsNet |
$ 63,605,807,227
|
| Holdings Count | Holding |
105
|
| Advisory Fees Paid, Amount |
$ 0
|
| Additional Fund Statistics [Text Block] |
Key Fund Statistics as of 12/31/2025- Total Net Assets$63,605,807,227
- Number of Portfolio Holdings105
- Total Advisory Fees Paid$0
Reflects holdings of the Portfolio, in which the Fund invests. Advisory fees are paid by the Portfolio, in which the Fund invests. |
| Holdings [Text Block] |
Assets |
% |
Treasury Debt |
56.0% |
Treasury Repurchase Agreements |
37.6% | |
| Largest Holdings [Text Block] |
Holdings |
% |
FICCBA TRI PARTY REPO A, 3.83%, due 01/02/26 |
7.1% |
JP MORGAN SEC LLC TPR A, 3.82%, due 01/02/26 |
6.3% |
FICCMS TRI PARTY REPO A, 3.85%, due 01/02/26 |
4.1% |
FICCJP TRI PARTY REPO A, 3.82%, due 01/02/26 |
3.9% |
U.S. Treasury Bills, 4.10%, due 01/02/26 |
3.7% |
FICCUB BI PARTY REPO, 3.85%, due 01/02/26 |
2.9% |
U.S. Treasury Floating Rate Notes, 3.70%, due 01/31/27 |
2.8% |
U.S. Treasury Floating Rate Notes, 3.81%, due 10/31/26 |
2.6% |
U.S. Treasury Floating Rate Notes, 3.78%, due 07/31/26 |
2.3% |
U.S. Treasury Bills, 4.15%, due 01/08/26 |
2.2% | |
| C000231447 |
|
| Shareholder Report [Line Items] |
|
| Fund Name |
State Street Institutional Treasury Plus Money Market Fund
|
| Class Name |
Cabrera Capital Markets Class
|
| Trading Symbol |
CAJXX
|
| Annual or Semi-Annual Statement [Text Block] |
This annual shareholder report contains important information about the State Street Institutional Treasury Plus Money Market Fund (the "Fund") for the period of January 1, 2025 through December 31, 2025.
|
| Additional Information [Text Block] |
You can find additional information about the Fund, including the Prospectus, Statement of Additional Information, financial statements and other information at www.ssga.com/us/en/institutional/fund-finder?tab=documents&type=cash. You can also request this information about the Fund by contacting us at 1-866-392-0869.
|
| Additional Information Phone Number |
1-866-392-0869
|
| Additional Information Website |
www.ssga.com/us/en/institutional/fund-finder?tab=documents&type=cash
|
| Expenses [Text Block] |
What were the Fund costs for the last year? (based on a hypothetical $10,000 Investment)
Class Name |
Costs of a $10,000 investment |
Costs paid as a percentage of a $10,000 investment |
Cabrera Capital Markets Class |
$14 |
0.14% | The expense table reflects the proportionate share of expenses allocated to the Fund by the affiliated Portfolio, in which the Fund invests. |
| Expenses Paid, Amount |
$ 14
|
| Expense Ratio, Percent |
0.14%
|
| Expenses Represent Both Master and Feeder [Text] |
The expense table reflects the proportionate share of expenses allocated to the Fund by the affiliated Portfolio, in which the Fund invests.
|
| AssetsNet |
$ 63,605,807,227
|
| Holdings Count | Holding |
105
|
| Advisory Fees Paid, Amount |
$ 0
|
| Additional Fund Statistics [Text Block] |
Key Fund Statistics as of 12/31/2025- Total Net Assets$63,605,807,227
- Number of Portfolio Holdings105
- Total Advisory Fees Paid$0
Reflects holdings of the Portfolio, in which the Fund invests. Advisory fees are paid by the Portfolio, in which the Fund invests. |
| Holdings [Text Block] |
Assets |
% |
Treasury Debt |
56.0% |
Treasury Repurchase Agreements |
37.6% | |
| Largest Holdings [Text Block] |
Holdings |
% |
FICCBA TRI PARTY REPO A, 3.83%, due 01/02/26 |
7.1% |
JP MORGAN SEC LLC TPR A, 3.82%, due 01/02/26 |
6.3% |
FICCMS TRI PARTY REPO A, 3.85%, due 01/02/26 |
4.1% |
FICCJP TRI PARTY REPO A, 3.82%, due 01/02/26 |
3.9% |
U.S. Treasury Bills, 4.10%, due 01/02/26 |
3.7% |
FICCUB BI PARTY REPO, 3.85%, due 01/02/26 |
2.9% |
U.S. Treasury Floating Rate Notes, 3.70%, due 01/31/27 |
2.8% |
U.S. Treasury Floating Rate Notes, 3.81%, due 10/31/26 |
2.6% |
U.S. Treasury Floating Rate Notes, 3.78%, due 07/31/26 |
2.3% |
U.S. Treasury Bills, 4.15%, due 01/08/26 |
2.2% | |
| C000143783 |
|
| Shareholder Report [Line Items] |
|
| Fund Name |
State Street Institutional Treasury Plus Money Market Fund
|
| Class Name |
Institutional Class
|
| Trading Symbol |
SAJXX
|
| Annual or Semi-Annual Statement [Text Block] |
This annual shareholder report contains important information about the State Street Institutional Treasury Plus Money Market Fund (the "Fund") for the period of January 1, 2025 through December 31, 2025.
|
| Additional Information [Text Block] |
You can find additional information about the Fund, including the Prospectus, Statement of Additional Information, financial statements and other information at www.ssga.com/us/en/institutional/fund-finder?tab=documents&type=cash. You can also request this information about the Fund by contacting us at 1-866-392-0869.
|
| Additional Information Phone Number |
1-866-392-0869
|
| Additional Information Website |
www.ssga.com/us/en/institutional/fund-finder?tab=documents&type=cash
|
| Expenses [Text Block] |
What were the Fund costs for the last year? (based on a hypothetical $10,000 Investment)
Class Name |
Costs of a $10,000 investment |
Costs paid as a percentage of a $10,000 investment |
Institutional Class |
$14 |
0.14% | The expense table reflects the proportionate share of expenses allocated to the Fund by the affiliated Portfolio, in which the Fund invests. |
| Expenses Paid, Amount |
$ 14
|
| Expense Ratio, Percent |
0.14%
|
| Expenses Represent Both Master and Feeder [Text] |
The expense table reflects the proportionate share of expenses allocated to the Fund by the affiliated Portfolio, in which the Fund invests.
|
| AssetsNet |
$ 63,605,807,227
|
| Holdings Count | Holding |
105
|
| Advisory Fees Paid, Amount |
$ 0
|
| Additional Fund Statistics [Text Block] |
Key Fund Statistics as of 12/31/2025- Total Net Assets$63,605,807,227
- Number of Portfolio Holdings105
- Total Advisory Fees Paid$0
Reflects holdings of the Portfolio, in which the Fund invests. Advisory fees are paid by the Portfolio, in which the Fund invests. |
| Holdings [Text Block] |
Assets |
% |
Treasury Debt |
56.0% |
Treasury Repurchase Agreements |
37.6% | |
| Largest Holdings [Text Block] |
Holdings |
% |
FICCBA TRI PARTY REPO A, 3.83%, due 01/02/26 |
7.1% |
JP MORGAN SEC LLC TPR A, 3.82%, due 01/02/26 |
6.3% |
FICCMS TRI PARTY REPO A, 3.85%, due 01/02/26 |
4.1% |
FICCJP TRI PARTY REPO A, 3.82%, due 01/02/26 |
3.9% |
U.S. Treasury Bills, 4.10%, due 01/02/26 |
3.7% |
FICCUB BI PARTY REPO, 3.85%, due 01/02/26 |
2.9% |
U.S. Treasury Floating Rate Notes, 3.70%, due 01/31/27 |
2.8% |
U.S. Treasury Floating Rate Notes, 3.81%, due 10/31/26 |
2.6% |
U.S. Treasury Floating Rate Notes, 3.78%, due 07/31/26 |
2.3% |
U.S. Treasury Bills, 4.15%, due 01/08/26 |
2.2% | |
| C000052879 |
|
| Shareholder Report [Line Items] |
|
| Fund Name |
State Street Institutional Treasury Plus Money Market Fund
|
| Class Name |
Investment Class
|
| Trading Symbol |
TPVXX
|
| Annual or Semi-Annual Statement [Text Block] |
This annual shareholder report contains important information about the State Street Institutional Treasury Plus Money Market Fund (the "Fund") for the period of January 1, 2025 through December 31, 2025.
|
| Additional Information [Text Block] |
You can find additional information about the Fund, including the Prospectus, Statement of Additional Information, financial statements and other information at www.ssga.com/us/en/institutional/fund-finder?tab=documents&type=cash. You can also request this information about the Fund by contacting us at 1-866-392-0869.
|
| Additional Information Phone Number |
1-866-392-0869
|
| Additional Information Website |
www.ssga.com/us/en/institutional/fund-finder?tab=documents&type=cash
|
| Expenses [Text Block] |
What were the Fund costs for the last year? (based on a hypothetical $10,000 Investment)
Class Name |
Costs of a $10,000 investment |
Costs paid as a percentage of a $10,000 investment |
Investment Class |
$47 |
0.46% | The expense table reflects the proportionate share of expenses allocated to the Fund by the affiliated Portfolio, in which the Fund invests. |
| Expenses Paid, Amount |
$ 47
|
| Expense Ratio, Percent |
0.46%
|
| Expenses Represent Both Master and Feeder [Text] |
The expense table reflects the proportionate share of expenses allocated to the Fund by the affiliated Portfolio, in which the Fund invests.
|
| AssetsNet |
$ 63,605,807,227
|
| Holdings Count | Holding |
105
|
| Advisory Fees Paid, Amount |
$ 0
|
| Additional Fund Statistics [Text Block] |
Key Fund Statistics as of 12/31/2025- Total Net Assets$63,605,807,227
- Number of Portfolio Holdings105
- Total Advisory Fees Paid$0
Reflects holdings of the Portfolio, in which the Fund invests. Advisory fees are paid by the Portfolio, in which the Fund invests. |
| Holdings [Text Block] |
Assets |
% |
Treasury Debt |
56.0% |
Treasury Repurchase Agreements |
37.6% | |
| Largest Holdings [Text Block] |
Holdings |
% |
FICCBA TRI PARTY REPO A, 3.83%, due 01/02/26 |
7.1% |
JP MORGAN SEC LLC TPR A, 3.82%, due 01/02/26 |
6.3% |
FICCMS TRI PARTY REPO A, 3.85%, due 01/02/26 |
4.1% |
FICCJP TRI PARTY REPO A, 3.82%, due 01/02/26 |
3.9% |
U.S. Treasury Bills, 4.10%, due 01/02/26 |
3.7% |
FICCUB BI PARTY REPO, 3.85%, due 01/02/26 |
2.9% |
U.S. Treasury Floating Rate Notes, 3.70%, due 01/31/27 |
2.8% |
U.S. Treasury Floating Rate Notes, 3.81%, due 10/31/26 |
2.6% |
U.S. Treasury Floating Rate Notes, 3.78%, due 07/31/26 |
2.3% |
U.S. Treasury Bills, 4.15%, due 01/08/26 |
2.2% | |
| C000143784 |
|
| Shareholder Report [Line Items] |
|
| Fund Name |
State Street Institutional Treasury Plus Money Market Fund
|
| Class Name |
Investor Class
|
| Trading Symbol |
SAEXX
|
| Annual or Semi-Annual Statement [Text Block] |
This annual shareholder report contains important information about the State Street Institutional Treasury Plus Money Market Fund (the "Fund") for the period of January 1, 2025 through December 31, 2025.
|
| Additional Information [Text Block] |
You can find additional information about the Fund, including the Prospectus, Statement of Additional Information, financial statements and other information at www.ssga.com/us/en/institutional/fund-finder?tab=documents&type=cash. You can also request this information about the Fund by contacting us at 1-866-392-0869.
|
| Additional Information Phone Number |
1-866-392-0869
|
| Additional Information Website |
www.ssga.com/us/en/institutional/fund-finder?tab=documents&type=cash
|
| Expenses [Text Block] |
What were the Fund costs for the last year? (based on a hypothetical $10,000 Investment)
Class Name |
Costs of a $10,000 investment |
Costs paid as a percentage of a $10,000 investment |
Investor Class |
$19 |
0.19% | The expense table reflects the proportionate share of expenses allocated to the Fund by the affiliated Portfolio, in which the Fund invests. |
| Expenses Paid, Amount |
$ 19
|
| Expense Ratio, Percent |
0.19%
|
| Expenses Represent Both Master and Feeder [Text] |
The expense table reflects the proportionate share of expenses allocated to the Fund by the affiliated Portfolio, in which the Fund invests.
|
| AssetsNet |
$ 63,605,807,227
|
| Holdings Count | Holding |
105
|
| Advisory Fees Paid, Amount |
$ 0
|
| Additional Fund Statistics [Text Block] |
Key Fund Statistics as of 12/31/2025- Total Net Assets$63,605,807,227
- Number of Portfolio Holdings105
- Total Advisory Fees Paid$0
Reflects holdings of the Portfolio, in which the Fund invests. Advisory fees are paid by the Portfolio, in which the Fund invests. |
| Holdings [Text Block] |
Assets |
% |
Treasury Debt |
56.0% |
Treasury Repurchase Agreements |
37.6% | |
| Largest Holdings [Text Block] |
Holdings |
% |
FICCBA TRI PARTY REPO A, 3.83%, due 01/02/26 |
7.1% |
JP MORGAN SEC LLC TPR A, 3.82%, due 01/02/26 |
6.3% |
FICCMS TRI PARTY REPO A, 3.85%, due 01/02/26 |
4.1% |
FICCJP TRI PARTY REPO A, 3.82%, due 01/02/26 |
3.9% |
U.S. Treasury Bills, 4.10%, due 01/02/26 |
3.7% |
FICCUB BI PARTY REPO, 3.85%, due 01/02/26 |
2.9% |
U.S. Treasury Floating Rate Notes, 3.70%, due 01/31/27 |
2.8% |
U.S. Treasury Floating Rate Notes, 3.81%, due 10/31/26 |
2.6% |
U.S. Treasury Floating Rate Notes, 3.78%, due 07/31/26 |
2.3% |
U.S. Treasury Bills, 4.15%, due 01/08/26 |
2.2% | |
| C000231965 |
|
| Shareholder Report [Line Items] |
|
| Fund Name |
State Street Institutional Treasury Plus Money Market Fund
|
| Class Name |
Opportunity Class
|
| Trading Symbol |
OPTXX
|
| Annual or Semi-Annual Statement [Text Block] |
This annual shareholder report contains important information about the State Street Institutional Treasury Plus Money Market Fund (the "Fund") for the period of January 1, 2025 through December 31, 2025.
|
| Additional Information [Text Block] |
You can find additional information about the Fund, including the Prospectus, Statement of Additional Information, financial statements and other information at www.ssga.com/us/en/institutional/fund-finder?tab=documents&type=cash. You can also request this information about the Fund by contacting us at 1-866-392-0869.
|
| Additional Information Phone Number |
1-866-392-0869
|
| Additional Information Website |
www.ssga.com/us/en/institutional/fund-finder?tab=documents&type=cash
|
| Expenses [Text Block] |
What were the Fund costs for the last year? (based on a hypothetical $10,000 Investment)
Class Name |
Costs of a $10,000 investment |
Costs paid as a percentage of a $10,000 investment |
Opportunity Class |
$14 |
0.14% | The expense table reflects the proportionate share of expenses allocated to the Fund by the affiliated Portfolio, in which the Fund invests. |
| Expenses Paid, Amount |
$ 14
|
| Expense Ratio, Percent |
0.14%
|
| Expenses Represent Both Master and Feeder [Text] |
The expense table reflects the proportionate share of expenses allocated to the Fund by the affiliated Portfolio, in which the Fund invests.
|
| AssetsNet |
$ 63,605,807,227
|
| Holdings Count | Holding |
105
|
| Advisory Fees Paid, Amount |
$ 0
|
| Additional Fund Statistics [Text Block] |
Key Fund Statistics as of 12/31/2025- Total Net Assets$63,605,807,227
- Number of Portfolio Holdings105
- Total Advisory Fees Paid$0
Reflects holdings of the Portfolio, in which the Fund invests. Advisory fees are paid by the Portfolio, in which the Fund invests. |
| Holdings [Text Block] |
Assets |
% |
Treasury Debt |
56.0% |
Treasury Repurchase Agreements |
37.6% | |
| Largest Holdings [Text Block] |
Holdings |
% |
FICCBA TRI PARTY REPO A, 3.83%, due 01/02/26 |
7.1% |
JP MORGAN SEC LLC TPR A, 3.82%, due 01/02/26 |
6.3% |
FICCMS TRI PARTY REPO A, 3.85%, due 01/02/26 |
4.1% |
FICCJP TRI PARTY REPO A, 3.82%, due 01/02/26 |
3.9% |
U.S. Treasury Bills, 4.10%, due 01/02/26 |
3.7% |
FICCUB BI PARTY REPO, 3.85%, due 01/02/26 |
2.9% |
U.S. Treasury Floating Rate Notes, 3.70%, due 01/31/27 |
2.8% |
U.S. Treasury Floating Rate Notes, 3.81%, due 10/31/26 |
2.6% |
U.S. Treasury Floating Rate Notes, 3.78%, due 07/31/26 |
2.3% |
U.S. Treasury Bills, 4.15%, due 01/08/26 |
2.2% | |
| C000052880 |
|
| Shareholder Report [Line Items] |
|
| Fund Name |
State Street Institutional Treasury Plus Money Market Fund
|
| Class Name |
Premier Class
|
| Trading Symbol |
TPIXX
|
| Annual or Semi-Annual Statement [Text Block] |
This annual shareholder report contains important information about the State Street Institutional Treasury Plus Money Market Fund (the "Fund") for the period of January 1, 2025 through December 31, 2025.
|
| Additional Information [Text Block] |
You can find additional information about the Fund, including the Prospectus, Statement of Additional Information, financial statements and other information at www.ssga.com/us/en/institutional/fund-finder?tab=documents&type=cash. You can also request this information about the Fund by contacting us at 1-866-392-0869.
|
| Additional Information Phone Number |
1-866-392-0869
|
| Additional Information Website |
www.ssga.com/us/en/institutional/fund-finder?tab=documents&type=cash
|
| Expenses [Text Block] |
What were the Fund costs for the last year? (based on a hypothetical $10,000 Investment)
Class Name |
Costs of a $10,000 investment |
Costs paid as a percentage of a $10,000 investment |
Premier Class |
$11 |
0.11% | The expense table reflects the proportionate share of expenses allocated to the Fund by the affiliated Portfolio, in which the Fund invests. |
| Expenses Paid, Amount |
$ 11
|
| Expense Ratio, Percent |
0.11%
|
| Expenses Represent Both Master and Feeder [Text] |
The expense table reflects the proportionate share of expenses allocated to the Fund by the affiliated Portfolio, in which the Fund invests.
|
| AssetsNet |
$ 63,605,807,227
|
| Holdings Count | Holding |
105
|
| Advisory Fees Paid, Amount |
$ 0
|
| Additional Fund Statistics [Text Block] |
Key Fund Statistics as of 12/31/2025- Total Net Assets$63,605,807,227
- Number of Portfolio Holdings105
- Total Advisory Fees Paid$0
Reflects holdings of the Portfolio, in which the Fund invests. Advisory fees are paid by the Portfolio, in which the Fund invests. |
| Holdings [Text Block] |
Assets |
% |
Treasury Debt |
56.0% |
Treasury Repurchase Agreements |
37.6% | |
| Largest Holdings [Text Block] |
Holdings |
% |
FICCBA TRI PARTY REPO A, 3.83%, due 01/02/26 |
7.1% |
JP MORGAN SEC LLC TPR A, 3.82%, due 01/02/26 |
6.3% |
FICCMS TRI PARTY REPO A, 3.85%, due 01/02/26 |
4.1% |
FICCJP TRI PARTY REPO A, 3.82%, due 01/02/26 |
3.9% |
U.S. Treasury Bills, 4.10%, due 01/02/26 |
3.7% |
FICCUB BI PARTY REPO, 3.85%, due 01/02/26 |
2.9% |
U.S. Treasury Floating Rate Notes, 3.70%, due 01/31/27 |
2.8% |
U.S. Treasury Floating Rate Notes, 3.81%, due 10/31/26 |
2.6% |
U.S. Treasury Floating Rate Notes, 3.78%, due 07/31/26 |
2.3% |
U.S. Treasury Bills, 4.15%, due 01/08/26 |
2.2% | |
| C000172254 |
|
| Shareholder Report [Line Items] |
|
| Fund Name |
State Street Institutional Treasury Plus Money Market Fund
|
| Class Name |
Trust Class
|
| Trading Symbol |
TPLXX
|
| Annual or Semi-Annual Statement [Text Block] |
This annual shareholder report contains important information about the State Street Institutional Treasury Plus Money Market Fund (the "Fund") for the period of January 1, 2025 through December 31, 2025.
|
| Additional Information [Text Block] |
You can find additional information about the Fund, including the Prospectus, Statement of Additional Information, financial statements and other information at www.ssga.com/us/en/institutional/fund-finder?tab=documents&type=cash. You can also request this information about the Fund by contacting us at 1-866-392-0869.
|
| Additional Information Phone Number |
1-866-392-0869
|
| Additional Information Website |
www.ssga.com/us/en/institutional/fund-finder?tab=documents&type=cash
|
| Expenses [Text Block] |
What were the Fund costs for the last year? (based on a hypothetical $10,000 Investment)
Class Name |
Costs of a $10,000 investment |
Costs paid as a percentage of a $10,000 investment |
Trust Class |
$17 |
0.17% | The expense table reflects the proportionate share of expenses allocated to the Fund by the affiliated Portfolio, in which the Fund invests. |
| Expenses Paid, Amount |
$ 17
|
| Expense Ratio, Percent |
0.17%
|
| Expenses Represent Both Master and Feeder [Text] |
The expense table reflects the proportionate share of expenses allocated to the Fund by the affiliated Portfolio, in which the Fund invests.
|
| AssetsNet |
$ 63,605,807,227
|
| Holdings Count | Holding |
105
|
| Advisory Fees Paid, Amount |
$ 0
|
| Additional Fund Statistics [Text Block] |
Key Fund Statistics as of 12/31/2025- Total Net Assets$63,605,807,227
- Number of Portfolio Holdings105
- Total Advisory Fees Paid$0
Reflects holdings of the Portfolio, in which the Fund invests. Advisory fees are paid by the Portfolio, in which the Fund invests. |
| Holdings [Text Block] |
Assets |
% |
Treasury Debt |
56.0% |
Treasury Repurchase Agreements |
37.6% | |
| Largest Holdings [Text Block] |
Holdings |
% |
FICCBA TRI PARTY REPO A, 3.83%, due 01/02/26 |
7.1% |
JP MORGAN SEC LLC TPR A, 3.82%, due 01/02/26 |
6.3% |
FICCMS TRI PARTY REPO A, 3.85%, due 01/02/26 |
4.1% |
FICCJP TRI PARTY REPO A, 3.82%, due 01/02/26 |
3.9% |
U.S. Treasury Bills, 4.10%, due 01/02/26 |
3.7% |
FICCUB BI PARTY REPO, 3.85%, due 01/02/26 |
2.9% |
U.S. Treasury Floating Rate Notes, 3.70%, due 01/31/27 |
2.8% |
U.S. Treasury Floating Rate Notes, 3.81%, due 10/31/26 |
2.6% |
U.S. Treasury Floating Rate Notes, 3.78%, due 07/31/26 |
2.3% |
U.S. Treasury Bills, 4.15%, due 01/08/26 |
2.2% | |
| C000143776 |
|
| Shareholder Report [Line Items] |
|
| Fund Name |
State Street Institutional U.S. Government Money Market Fund
|
| Class Name |
Administration Class
|
| Trading Symbol |
SALXX
|
| Annual or Semi-Annual Statement [Text Block] |
This annual shareholder report contains important information about the State Street Institutional U.S. Government Money Market Fund (the "Fund") for the period of January 1, 2025 through December 31, 2025.
|
| Additional Information [Text Block] |
You can find additional information about the Fund, including the Prospectus, Statement of Additional Information, financial statements and other information at www.ssga.com/us/en/institutional/fund-finder?tab=documents&type=cash. You can also request this information about the Fund by contacting us at 1-866-392-0869.
|
| Additional Information Phone Number |
1-866-392-0869
|
| Additional Information Website |
www.ssga.com/us/en/institutional/fund-finder?tab=documents&type=cash
|
| Expenses [Text Block] |
What were the Fund costs for the last year? (based on a hypothetical $10,000 Investment)
Class Name |
Costs of a $10,000 investment |
Costs paid as a percentage of a $10,000 investment |
Administration Class |
$37 |
0.36% | The expense table reflects the proportionate share of expenses allocated to the Fund by the affiliated Portfolio, in which the Fund invests. |
| Expenses Paid, Amount |
$ 37
|
| Expense Ratio, Percent |
0.36%
|
| Expenses Represent Both Master and Feeder [Text] |
The expense table reflects the proportionate share of expenses allocated to the Fund by the affiliated Portfolio, in which the Fund invests.
|
| AssetsNet |
$ 218,645,119,758
|
| Holdings Count | Holding |
248
|
| Advisory Fees Paid, Amount |
$ 0
|
| Additional Fund Statistics [Text Block] |
Key Fund Statistics as of 12/31/2025- Total Net Assets$218,645,119,758
- Number of Portfolio Holdings248
- Total Advisory Fees Paid$0
Reflects holdings of the Portfolio, in which the Fund invests. Advisory fees are paid by the Portfolio, in which the Fund invests. |
| Holdings [Text Block] |
Assets |
% |
Treasury Debt |
49.1% |
Treasury Repurchase Agreements |
22.7% |
Government Agency Debt |
12.9% |
Government Agency Repurchase Agreements |
9.6% | |
| Largest Holdings [Text Block] |
Holdings |
% |
FICCBA TRI PARTY REPO A, 3.83%, due 01/02/26 |
4.1% |
U.S. Treasury Bills, 4.10%, due 01/02/26 |
3.6% |
FICCJP TRI PARTY REPO A, 3.82%, due 01/02/26 |
3.3% |
FICCUB BI PARTY REPO, 3.85%, due 01/02/26 |
2.7% |
FICCMS TRI PARTY REPO A, 3.85%, due 01/02/26 |
2.5% |
JP MORGAN SEC LLC TPR A, 3.82%, due 01/02/26 |
2.2% |
U.S. Treasury Bills, 4.13%, due 01/15/26 |
1.7% |
JP MORGAN SEC LLC TPR A, 3.86%, due 04/10/26 |
1.6% |
U.S. Treasury Bills, 3.95%, due 02/19/26 |
1.5% |
U.S. Treasury Bills, 3.72%, due 03/19/26 |
1.5% | |
| C000230478 |
|
| Shareholder Report [Line Items] |
|
| Fund Name |
State Street Institutional U.S. Government Money Market Fund
|
| Class Name |
Bancroft Capital Class
|
| Trading Symbol |
VTGXX
|
| Annual or Semi-Annual Statement [Text Block] |
This annual shareholder report contains important information about the State Street Institutional U.S. Government Money Market Fund (the "Fund") for the period of January 1, 2025 through December 31, 2025.
|
| Additional Information [Text Block] |
You can find additional information about the Fund, including the Prospectus, Statement of Additional Information, financial statements and other information at www.ssga.com/us/en/institutional/fund-finder?tab=documents&type=cash. You can also request this information about the Fund by contacting us at 1-866-392-0869.
|
| Additional Information Phone Number |
1-866-392-0869
|
| Additional Information Website |
www.ssga.com/us/en/institutional/fund-finder?tab=documents&type=cash
|
| Expenses [Text Block] |
What were the Fund costs for the last year? (based on a hypothetical $10,000 Investment)
Class Name |
Costs of a $10,000 investment |
Costs paid as a percentage of a $10,000 investment |
Bancroft Capital Class |
$14 |
0.14% | The expense table reflects the proportionate share of expenses allocated to the Fund by the affiliated Portfolio, in which the Fund invests. |
| Expenses Paid, Amount |
$ 14
|
| Expense Ratio, Percent |
0.14%
|
| Expenses Represent Both Master and Feeder [Text] |
The expense table reflects the proportionate share of expenses allocated to the Fund by the affiliated Portfolio, in which the Fund invests.
|
| AssetsNet |
$ 218,645,119,758
|
| Holdings Count | Holding |
248
|
| Advisory Fees Paid, Amount |
$ 0
|
| Additional Fund Statistics [Text Block] |
Key Fund Statistics as of 12/31/2025- Total Net Assets$218,645,119,758
- Number of Portfolio Holdings248
- Total Advisory Fees Paid$0
Reflects holdings of the Portfolio, in which the Fund invests. Advisory fees are paid by the Portfolio, in which the Fund invests. |
| Holdings [Text Block] |
Assets |
% |
Treasury Debt |
49.1% |
Treasury Repurchase Agreements |
22.7% |
Government Agency Debt |
12.9% |
Government Agency Repurchase Agreements |
9.6% | |
| Largest Holdings [Text Block] |
Holdings |
% |
FICCBA TRI PARTY REPO A, 3.83%, due 01/02/26 |
4.1% |
U.S. Treasury Bills, 4.10%, due 01/02/26 |
3.6% |
FICCJP TRI PARTY REPO A, 3.82%, due 01/02/26 |
3.3% |
FICCUB BI PARTY REPO, 3.85%, due 01/02/26 |
2.7% |
FICCMS TRI PARTY REPO A, 3.85%, due 01/02/26 |
2.5% |
JP MORGAN SEC LLC TPR A, 3.82%, due 01/02/26 |
2.2% |
U.S. Treasury Bills, 4.13%, due 01/15/26 |
1.7% |
JP MORGAN SEC LLC TPR A, 3.86%, due 04/10/26 |
1.6% |
U.S. Treasury Bills, 3.95%, due 02/19/26 |
1.5% |
U.S. Treasury Bills, 3.72%, due 03/19/26 |
1.5% | |
| C000231443 |
|
| Shareholder Report [Line Items] |
|
| Fund Name |
State Street Institutional U.S. Government Money Market Fund
|
| Class Name |
Blaylock Van Class
|
| Trading Symbol |
BUYXX
|
| Annual or Semi-Annual Statement [Text Block] |
This annual shareholder report contains important information about the State Street Institutional U.S. Government Money Market Fund (the "Fund") for the period of January 1, 2025 through December 31, 2025.
|
| Additional Information [Text Block] |
You can find additional information about the Fund, including the Prospectus, Statement of Additional Information, financial statements and other information at www.ssga.com/us/en/institutional/fund-finder?tab=documents&type=cash. You can also request this information about the Fund by contacting us at 1-866-392-0869.
|
| Additional Information Phone Number |
1-866-392-0869
|
| Additional Information Website |
www.ssga.com/us/en/institutional/fund-finder?tab=documents&type=cash
|
| Expenses [Text Block] |
What were the Fund costs for the last year? (based on a hypothetical $10,000 Investment)
Class Name |
Costs of a $10,000 investment |
Costs paid as a percentage of a $10,000 investment |
Blaylock Van Class |
$14 |
0.14% | The expense table reflects the proportionate share of expenses allocated to the Fund by the affiliated Portfolio, in which the Fund invests. |
| Expenses Paid, Amount |
$ 14
|
| Expense Ratio, Percent |
0.14%
|
| Expenses Represent Both Master and Feeder [Text] |
The expense table reflects the proportionate share of expenses allocated to the Fund by the affiliated Portfolio, in which the Fund invests.
|
| AssetsNet |
$ 218,645,119,758
|
| Holdings Count | Holding |
248
|
| Advisory Fees Paid, Amount |
$ 0
|
| Additional Fund Statistics [Text Block] |
Key Fund Statistics as of 12/31/2025- Total Net Assets$218,645,119,758
- Number of Portfolio Holdings248
- Total Advisory Fees Paid$0
Reflects holdings of the Portfolio, in which the Fund invests. Advisory fees are paid by the Portfolio, in which the Fund invests. |
| Holdings [Text Block] |
Assets |
% |
Treasury Debt |
49.1% |
Treasury Repurchase Agreements |
22.7% |
Government Agency Debt |
12.9% |
Government Agency Repurchase Agreements |
9.6% | |
| Largest Holdings [Text Block] |
Holdings |
% |
FICCBA TRI PARTY REPO A, 3.83%, due 01/02/26 |
4.1% |
U.S. Treasury Bills, 4.10%, due 01/02/26 |
3.6% |
FICCJP TRI PARTY REPO A, 3.82%, due 01/02/26 |
3.3% |
FICCUB BI PARTY REPO, 3.85%, due 01/02/26 |
2.7% |
FICCMS TRI PARTY REPO A, 3.85%, due 01/02/26 |
2.5% |
JP MORGAN SEC LLC TPR A, 3.82%, due 01/02/26 |
2.2% |
U.S. Treasury Bills, 4.13%, due 01/15/26 |
1.7% |
JP MORGAN SEC LLC TPR A, 3.86%, due 04/10/26 |
1.6% |
U.S. Treasury Bills, 3.95%, due 02/19/26 |
1.5% |
U.S. Treasury Bills, 3.72%, due 03/19/26 |
1.5% | |
| C000231444 |
|
| Shareholder Report [Line Items] |
|
| Fund Name |
State Street Institutional U.S. Government Money Market Fund
|
| Class Name |
Cabrera Capital Markets Class
|
| Trading Symbol |
CAHXX
|
| Annual or Semi-Annual Statement [Text Block] |
This annual shareholder report contains important information about the State Street Institutional U.S. Government Money Market Fund (the "Fund") for the period of January 1, 2025 through December 31, 2025.
|
| Additional Information [Text Block] |
You can find additional information about the Fund, including the Prospectus, Statement of Additional Information, financial statements and other information at www.ssga.com/us/en/institutional/fund-finder?tab=documents&type=cash. You can also request this information about the Fund by contacting us at 1-866-392-0869.
|
| Additional Information Phone Number |
1-866-392-0869
|
| Additional Information Website |
www.ssga.com/us/en/institutional/fund-finder?tab=documents&type=cash
|
| Expenses [Text Block] |
What were the Fund costs for the last year? (based on a hypothetical $10,000 Investment)
Class Name |
Costs of a $10,000 investment |
Costs paid as a percentage of a $10,000 investment |
Cabrera Capital Markets Class |
$14 |
0.14% | The expense table reflects the proportionate share of expenses allocated to the Fund by the affiliated Portfolio, in which the Fund invests. |
| Expenses Paid, Amount |
$ 14
|
| Expense Ratio, Percent |
0.14%
|
| Expenses Represent Both Master and Feeder [Text] |
The expense table reflects the proportionate share of expenses allocated to the Fund by the affiliated Portfolio, in which the Fund invests.
|
| AssetsNet |
$ 218,645,119,758
|
| Holdings Count | Holding |
248
|
| Advisory Fees Paid, Amount |
$ 0
|
| Additional Fund Statistics [Text Block] |
Key Fund Statistics as of 12/31/2025- Total Net Assets$218,645,119,758
- Number of Portfolio Holdings248
- Total Advisory Fees Paid$0
Reflects holdings of the Portfolio, in which the Fund invests. Advisory fees are paid by the Portfolio, in which the Fund invests. |
| Holdings [Text Block] |
Assets |
% |
Treasury Debt |
49.1% |
Treasury Repurchase Agreements |
22.7% |
Government Agency Debt |
12.9% |
Government Agency Repurchase Agreements |
9.6% | |
| Largest Holdings [Text Block] |
Holdings |
% |
FICCBA TRI PARTY REPO A, 3.83%, due 01/02/26 |
4.1% |
U.S. Treasury Bills, 4.10%, due 01/02/26 |
3.6% |
FICCJP TRI PARTY REPO A, 3.82%, due 01/02/26 |
3.3% |
FICCUB BI PARTY REPO, 3.85%, due 01/02/26 |
2.7% |
FICCMS TRI PARTY REPO A, 3.85%, due 01/02/26 |
2.5% |
JP MORGAN SEC LLC TPR A, 3.82%, due 01/02/26 |
2.2% |
U.S. Treasury Bills, 4.13%, due 01/15/26 |
1.7% |
JP MORGAN SEC LLC TPR A, 3.86%, due 04/10/26 |
1.6% |
U.S. Treasury Bills, 3.95%, due 02/19/26 |
1.5% |
U.S. Treasury Bills, 3.72%, due 03/19/26 |
1.5% | |
| C000146109 |
|
| Shareholder Report [Line Items] |
|
| Fund Name |
State Street Institutional U.S. Government Money Market Fund
|
| Class Name |
Class G
|
| Trading Symbol |
SSOXX
|
| Annual or Semi-Annual Statement [Text Block] |
This annual shareholder report contains important information about the State Street Institutional U.S. Government Money Market Fund (the "Fund") for the period of January 1, 2025 through December 31, 2025.
|
| Additional Information [Text Block] |
You can request additional information about the Fund by contacting us at 1-866-392-0869.
|
| Additional Information Phone Number |
1-866-392-0869
|
| Expenses [Text Block] |
What were the Fund costs for the last year? (based on a hypothetical $10,000 Investment)
Class Name |
Costs of a $10,000 investment |
Costs paid as a percentage of a $10,000 investment |
Class G |
$7 |
0.07% | The expense table reflects the proportionate share of expenses allocated to the Fund by the affiliated Portfolio, in which the Fund invests. |
| Expenses Paid, Amount |
$ 7
|
| Expense Ratio, Percent |
0.07%
|
| Expenses Represent Both Master and Feeder [Text] |
The expense table reflects the proportionate share of expenses allocated to the Fund by the affiliated Portfolio, in which the Fund invests.
|
| AssetsNet |
$ 218,645,119,758
|
| Holdings Count | Holding |
248
|
| Advisory Fees Paid, Amount |
$ 0
|
| Additional Fund Statistics [Text Block] |
Key Fund Statistics as of 12/31/2025- Total Net Assets$218,645,119,758
- Number of Portfolio Holdings248
- Total Advisory Fees Paid$0
Reflects holdings of the Portfolio, in which the Fund invests. Advisory fees are paid by the Portfolio, in which the Fund invests. |
| Holdings [Text Block] |
Assets |
% |
Treasury Debt |
49.1% |
Treasury Repurchase Agreements |
22.7% |
Government Agency Debt |
12.9% |
Government Agency Repurchase Agreements |
9.6% | |
| Largest Holdings [Text Block] |
Holdings |
% |
FICCBA TRI PARTY REPO A, 3.83%, due 01/02/26 |
4.1% |
U.S. Treasury Bills, 4.10%, due 01/02/26 |
3.6% |
FICCJP TRI PARTY REPO A, 3.82%, due 01/02/26 |
3.3% |
FICCUB BI PARTY REPO, 3.85%, due 01/02/26 |
2.7% |
FICCMS TRI PARTY REPO A, 3.85%, due 01/02/26 |
2.5% |
JP MORGAN SEC LLC TPR A, 3.82%, due 01/02/26 |
2.2% |
U.S. Treasury Bills, 4.13%, due 01/15/26 |
1.7% |
JP MORGAN SEC LLC TPR A, 3.86%, due 04/10/26 |
1.6% |
U.S. Treasury Bills, 3.95%, due 02/19/26 |
1.5% |
U.S. Treasury Bills, 3.72%, due 03/19/26 |
1.5% | |
| C000143775 |
|
| Shareholder Report [Line Items] |
|
| Fund Name |
State Street Institutional U.S. Government Money Market Fund
|
| Class Name |
Institutional Class
|
| Trading Symbol |
SAHXX
|
| Annual or Semi-Annual Statement [Text Block] |
This annual shareholder report contains important information about the State Street Institutional U.S. Government Money Market Fund (the "Fund") for the period of January 1, 2025 through December 31, 2025.
|
| Additional Information [Text Block] |
You can find additional information about the Fund, including the Prospectus, Statement of Additional Information, financial statements and other information at www.ssga.com/us/en/institutional/fund-finder?tab=documents&type=cash. You can also request this information about the Fund by contacting us at 1-866-392-0869.
|
| Additional Information Phone Number |
1-866-392-0869
|
| Additional Information Website |
www.ssga.com/us/en/institutional/fund-finder?tab=documents&type=cash
|
| Expenses [Text Block] |
What were the Fund costs for the last year? (based on a hypothetical $10,000 Investment)
Class Name |
Costs of a $10,000 investment |
Costs paid as a percentage of a $10,000 investment |
Institutional Class |
$14 |
0.14% | The expense table reflects the proportionate share of expenses allocated to the Fund by the affiliated Portfolio, in which the Fund invests. |
| Expenses Paid, Amount |
$ 14
|
| Expense Ratio, Percent |
0.14%
|
| Expenses Represent Both Master and Feeder [Text] |
The expense table reflects the proportionate share of expenses allocated to the Fund by the affiliated Portfolio, in which the Fund invests.
|
| AssetsNet |
$ 218,645,119,758
|
| Holdings Count | Holding |
248
|
| Advisory Fees Paid, Amount |
$ 0
|
| Additional Fund Statistics [Text Block] |
Key Fund Statistics as of 12/31/2025- Total Net Assets$218,645,119,758
- Number of Portfolio Holdings248
- Total Advisory Fees Paid$0
Reflects holdings of the Portfolio, in which the Fund invests. Advisory fees are paid by the Portfolio, in which the Fund invests. |
| Holdings [Text Block] |
Assets |
% |
Treasury Debt |
49.1% |
Treasury Repurchase Agreements |
22.7% |
Government Agency Debt |
12.9% |
Government Agency Repurchase Agreements |
9.6% | |
| Largest Holdings [Text Block] |
Holdings |
% |
FICCBA TRI PARTY REPO A, 3.83%, due 01/02/26 |
4.1% |
U.S. Treasury Bills, 4.10%, due 01/02/26 |
3.6% |
FICCJP TRI PARTY REPO A, 3.82%, due 01/02/26 |
3.3% |
FICCUB BI PARTY REPO, 3.85%, due 01/02/26 |
2.7% |
FICCMS TRI PARTY REPO A, 3.85%, due 01/02/26 |
2.5% |
JP MORGAN SEC LLC TPR A, 3.82%, due 01/02/26 |
2.2% |
U.S. Treasury Bills, 4.13%, due 01/15/26 |
1.7% |
JP MORGAN SEC LLC TPR A, 3.86%, due 04/10/26 |
1.6% |
U.S. Treasury Bills, 3.95%, due 02/19/26 |
1.5% |
U.S. Treasury Bills, 3.72%, due 03/19/26 |
1.5% | |
| C000052884 |
|
| Shareholder Report [Line Items] |
|
| Fund Name |
State Street Institutional U.S. Government Money Market Fund
|
| Class Name |
Investment Class
|
| Trading Symbol |
GVVXX
|
| Annual or Semi-Annual Statement [Text Block] |
This annual shareholder report contains important information about the State Street Institutional U.S. Government Money Market Fund (the "Fund") for the period of January 1, 2025 through December 31, 2025.
|
| Additional Information [Text Block] |
You can find additional information about the Fund, including the Prospectus, Statement of Additional Information, financial statements and other information at www.ssga.com/us/en/institutional/fund-finder?tab=documents&type=cash. You can also request this information about the Fund by contacting us at 1-866-392-0869.
|
| Additional Information Phone Number |
1-866-392-0869
|
| Additional Information Website |
www.ssga.com/us/en/institutional/fund-finder?tab=documents&type=cash
|
| Expenses [Text Block] |
What were the Fund costs for the last year? (based on a hypothetical $10,000 Investment)
Class Name |
Costs of a $10,000 investment |
Costs paid as a percentage of a $10,000 investment |
Investment Class |
$47 |
0.46% | The expense table reflects the proportionate share of expenses allocated to the Fund by the affiliated Portfolio, in which the Fund invests. |
| Expenses Paid, Amount |
$ 47
|
| Expense Ratio, Percent |
0.46%
|
| Expenses Represent Both Master and Feeder [Text] |
The expense table reflects the proportionate share of expenses allocated to the Fund by the affiliated Portfolio, in which the Fund invests.
|
| AssetsNet |
$ 218,645,119,758
|
| Holdings Count | Holding |
248
|
| Advisory Fees Paid, Amount |
$ 0
|
| Additional Fund Statistics [Text Block] |
Key Fund Statistics as of 12/31/2025- Total Net Assets$218,645,119,758
- Number of Portfolio Holdings248
- Total Advisory Fees Paid$0
Reflects holdings of the Portfolio, in which the Fund invests. Advisory fees are paid by the Portfolio, in which the Fund invests. |
| Holdings [Text Block] |
Assets |
% |
Treasury Debt |
49.1% |
Treasury Repurchase Agreements |
22.7% |
Government Agency Debt |
12.9% |
Government Agency Repurchase Agreements |
9.6% | |
| Largest Holdings [Text Block] |
Holdings |
% |
FICCBA TRI PARTY REPO A, 3.83%, due 01/02/26 |
4.1% |
U.S. Treasury Bills, 4.10%, due 01/02/26 |
3.6% |
FICCJP TRI PARTY REPO A, 3.82%, due 01/02/26 |
3.3% |
FICCUB BI PARTY REPO, 3.85%, due 01/02/26 |
2.7% |
FICCMS TRI PARTY REPO A, 3.85%, due 01/02/26 |
2.5% |
JP MORGAN SEC LLC TPR A, 3.82%, due 01/02/26 |
2.2% |
U.S. Treasury Bills, 4.13%, due 01/15/26 |
1.7% |
JP MORGAN SEC LLC TPR A, 3.86%, due 04/10/26 |
1.6% |
U.S. Treasury Bills, 3.95%, due 02/19/26 |
1.5% |
U.S. Treasury Bills, 3.72%, due 03/19/26 |
1.5% | |
| C000145476 |
|
| Shareholder Report [Line Items] |
|
| Fund Name |
State Street Institutional U.S. Government Money Market Fund
|
| Class Name |
Investor Class
|
| Trading Symbol |
SAMXX
|
| Annual or Semi-Annual Statement [Text Block] |
This annual shareholder report contains important information about the State Street Institutional U.S. Government Money Market Fund (the "Fund") for the period of January 1, 2025 through December 31, 2025.
|
| Additional Information [Text Block] |
You can find additional information about the Fund, including the Prospectus, Statement of Additional Information, financial statements and other information at www.ssga.com/us/en/institutional/fund-finder?tab=documents&type=cash. You can also request this information about the Fund by contacting us at 1-866-392-0869.
|
| Additional Information Phone Number |
1-866-392-0869
|
| Additional Information Website |
www.ssga.com/us/en/institutional/fund-finder?tab=documents&type=cash
|
| Expenses [Text Block] |
What were the Fund costs for the last year? (based on a hypothetical $10,000 Investment)
Class Name |
Costs of a $10,000 investment |
Costs paid as a percentage of a $10,000 investment |
Investor Class |
$19 |
0.19% | The expense table reflects the proportionate share of expenses allocated to the Fund by the affiliated Portfolio, in which the Fund invests. |
| Expenses Paid, Amount |
$ 19
|
| Expense Ratio, Percent |
0.19%
|
| Expenses Represent Both Master and Feeder [Text] |
The expense table reflects the proportionate share of expenses allocated to the Fund by the affiliated Portfolio, in which the Fund invests.
|
| AssetsNet |
$ 218,645,119,758
|
| Holdings Count | Holding |
248
|
| Advisory Fees Paid, Amount |
$ 0
|
| Additional Fund Statistics [Text Block] |
Key Fund Statistics as of 12/31/2025- Total Net Assets$218,645,119,758
- Number of Portfolio Holdings248
- Total Advisory Fees Paid$0
Reflects holdings of the Portfolio, in which the Fund invests. Advisory fees are paid by the Portfolio, in which the Fund invests. |
| Holdings [Text Block] |
Assets |
% |
Treasury Debt |
49.1% |
Treasury Repurchase Agreements |
22.7% |
Government Agency Debt |
12.9% |
Government Agency Repurchase Agreements |
9.6% | |
| Largest Holdings [Text Block] |
Holdings |
% |
FICCBA TRI PARTY REPO A, 3.83%, due 01/02/26 |
4.1% |
U.S. Treasury Bills, 4.10%, due 01/02/26 |
3.6% |
FICCJP TRI PARTY REPO A, 3.82%, due 01/02/26 |
3.3% |
FICCUB BI PARTY REPO, 3.85%, due 01/02/26 |
2.7% |
FICCMS TRI PARTY REPO A, 3.85%, due 01/02/26 |
2.5% |
JP MORGAN SEC LLC TPR A, 3.82%, due 01/02/26 |
2.2% |
U.S. Treasury Bills, 4.13%, due 01/15/26 |
1.7% |
JP MORGAN SEC LLC TPR A, 3.86%, due 04/10/26 |
1.6% |
U.S. Treasury Bills, 3.95%, due 02/19/26 |
1.5% |
U.S. Treasury Bills, 3.72%, due 03/19/26 |
1.5% | |
| C000231963 |
|
| Shareholder Report [Line Items] |
|
| Fund Name |
State Street Institutional U.S. Government Money Market Fund
|
| Class Name |
Opportunity Class
|
| Trading Symbol |
OPGXX
|
| Annual or Semi-Annual Statement [Text Block] |
This annual shareholder report contains important information about the State Street Institutional U.S. Government Money Market Fund (the "Fund") for the period of January 1, 2025 through December 31, 2025.
|
| Additional Information [Text Block] |
You can find additional information about the Fund, including the Prospectus, Statement of Additional Information, financial statements and other information at www.ssga.com/us/en/institutional/fund-finder?tab=documents&type=cash. You can also request this information about the Fund by contacting us at 1-866-392-0869.
|
| Additional Information Phone Number |
1-866-392-0869
|
| Additional Information Website |
www.ssga.com/us/en/institutional/fund-finder?tab=documents&type=cash
|
| Expenses [Text Block] |
What were the Fund costs for the last year? (based on a hypothetical $10,000 Investment)
Class Name |
Costs of a $10,000 investment |
Costs paid as a percentage of a $10,000 investment |
Opportunity Class |
$14 |
0.14% | The expense table reflects the proportionate share of expenses allocated to the Fund by the affiliated Portfolio, in which the Fund invests. |
| Expenses Paid, Amount |
$ 14
|
| Expense Ratio, Percent |
0.14%
|
| Expenses Represent Both Master and Feeder [Text] |
The expense table reflects the proportionate share of expenses allocated to the Fund by the affiliated Portfolio, in which the Fund invests.
|
| AssetsNet |
$ 218,645,119,758
|
| Holdings Count | Holding |
248
|
| Advisory Fees Paid, Amount |
$ 0
|
| Additional Fund Statistics [Text Block] |
Key Fund Statistics as of 12/31/2025- Total Net Assets$218,645,119,758
- Number of Portfolio Holdings248
- Total Advisory Fees Paid$0
Reflects holdings of the Portfolio, in which the Fund invests. Advisory fees are paid by the Portfolio, in which the Fund invests. |
| Holdings [Text Block] |
Assets |
% |
Treasury Debt |
49.1% |
Treasury Repurchase Agreements |
22.7% |
Government Agency Debt |
12.9% |
Government Agency Repurchase Agreements |
9.6% | |
| Largest Holdings [Text Block] |
Holdings |
% |
FICCBA TRI PARTY REPO A, 3.83%, due 01/02/26 |
4.1% |
U.S. Treasury Bills, 4.10%, due 01/02/26 |
3.6% |
FICCJP TRI PARTY REPO A, 3.82%, due 01/02/26 |
3.3% |
FICCUB BI PARTY REPO, 3.85%, due 01/02/26 |
2.7% |
FICCMS TRI PARTY REPO A, 3.85%, due 01/02/26 |
2.5% |
JP MORGAN SEC LLC TPR A, 3.82%, due 01/02/26 |
2.2% |
U.S. Treasury Bills, 4.13%, due 01/15/26 |
1.7% |
JP MORGAN SEC LLC TPR A, 3.86%, due 04/10/26 |
1.6% |
U.S. Treasury Bills, 3.95%, due 02/19/26 |
1.5% |
U.S. Treasury Bills, 3.72%, due 03/19/26 |
1.5% | |
| C000052883 |
|
| Shareholder Report [Line Items] |
|
| Fund Name |
State Street Institutional U.S. Government Money Market Fund
|
| Class Name |
Premier Class
|
| Trading Symbol |
GVMXX
|
| Annual or Semi-Annual Statement [Text Block] |
This annual shareholder report contains important information about the State Street Institutional U.S. Government Money Market Fund (the "Fund") for the period of January 1, 2025 through December 31, 2025.
|
| Additional Information [Text Block] |
You can find additional information about the Fund, including the Prospectus, Statement of Additional Information, financial statements and other information at www.ssga.com/us/en/institutional/fund-finder?tab=documents&type=cash. You can also request this information about the Fund by contacting us at 1-866-392-0869.
|
| Additional Information Phone Number |
1-866-392-0869
|
| Additional Information Website |
www.ssga.com/us/en/institutional/fund-finder?tab=documents&type=cash
|
| Expenses [Text Block] |
What were the Fund costs for the last year? (based on a hypothetical $10,000 Investment)
Class Name |
Costs of a $10,000 investment |
Costs paid as a percentage of a $10,000 investment |
Premier Class |
$11 |
0.11% | The expense table reflects the proportionate share of expenses allocated to the Fund by the affiliated Portfolio, in which the Fund invests. |
| Expenses Paid, Amount |
$ 11
|
| Expense Ratio, Percent |
0.11%
|
| Expenses Represent Both Master and Feeder [Text] |
The expense table reflects the proportionate share of expenses allocated to the Fund by the affiliated Portfolio, in which the Fund invests.
|
| AssetsNet |
$ 218,645,119,758
|
| Holdings Count | Holding |
248
|
| Advisory Fees Paid, Amount |
$ 0
|
| Additional Fund Statistics [Text Block] |
Key Fund Statistics as of 12/31/2025- Total Net Assets$218,645,119,758
- Number of Portfolio Holdings248
- Total Advisory Fees Paid$0
Reflects holdings of the Portfolio, in which the Fund invests. Advisory fees are paid by the Portfolio, in which the Fund invests. |
| Holdings [Text Block] |
Assets |
% |
Treasury Debt |
49.1% |
Treasury Repurchase Agreements |
22.7% |
Government Agency Debt |
12.9% |
Government Agency Repurchase Agreements |
9.6% | |
| Largest Holdings [Text Block] |
Holdings |
% |
FICCBA TRI PARTY REPO A, 3.83%, due 01/02/26 |
4.1% |
U.S. Treasury Bills, 4.10%, due 01/02/26 |
3.6% |
FICCJP TRI PARTY REPO A, 3.82%, due 01/02/26 |
3.3% |
FICCUB BI PARTY REPO, 3.85%, due 01/02/26 |
2.7% |
FICCMS TRI PARTY REPO A, 3.85%, due 01/02/26 |
2.5% |
JP MORGAN SEC LLC TPR A, 3.82%, due 01/02/26 |
2.2% |
U.S. Treasury Bills, 4.13%, due 01/15/26 |
1.7% |
JP MORGAN SEC LLC TPR A, 3.86%, due 04/10/26 |
1.6% |
U.S. Treasury Bills, 3.95%, due 02/19/26 |
1.5% |
U.S. Treasury Bills, 3.72%, due 03/19/26 |
1.5% | |
| C000069459 |
|
| Shareholder Report [Line Items] |
|
| Fund Name |
State Street Institutional U.S. Government Money Market Fund
|
| Class Name |
Select Class
|
| Trading Symbol |
GVSXX
|
| Annual or Semi-Annual Statement [Text Block] |
This annual shareholder report contains important information about the State Street Institutional U.S. Government Money Market Fund (the "Fund") for the period of January 1, 2025 through December 31, 2025.
|
| Additional Information [Text Block] |
You can find additional information about the Fund, including the Prospectus, Statement of Additional Information, financial statements and other information at www.ssga.com/us/en/institutional/fund-finder?tab=documents&type=cash. You can also request this information about the Fund by contacting us at 1-866-392-0869.
|
| Additional Information Phone Number |
1-866-392-0869
|
| Additional Information Website |
www.ssga.com/us/en/institutional/fund-finder?tab=documents&type=cash
|
| Expenses [Text Block] |
What were the Fund costs for the last year? (based on a hypothetical $10,000 Investment)
Class Name |
Costs of a $10,000 investment |
Costs paid as a percentage of a $10,000 investment |
Select Class |
$8 |
0.08% | The expense table reflects the proportionate share of expenses allocated to the Fund by the affiliated Portfolio, in which the Fund invests. |
| Expenses Paid, Amount |
$ 8
|
| Expense Ratio, Percent |
0.08%
|
| Expenses Represent Both Master and Feeder [Text] |
The expense table reflects the proportionate share of expenses allocated to the Fund by the affiliated Portfolio, in which the Fund invests.
|
| AssetsNet |
$ 218,645,119,758
|
| Holdings Count | Holding |
248
|
| Advisory Fees Paid, Amount |
$ 0
|
| Additional Fund Statistics [Text Block] |
Key Fund Statistics as of 12/31/2025- Total Net Assets$218,645,119,758
- Number of Portfolio Holdings248
- Total Advisory Fees Paid$0
Reflects holdings of the Portfolio, in which the Fund invests. Advisory fees are paid by the Portfolio, in which the Fund invests. |
| Holdings [Text Block] |
Assets |
% |
Treasury Debt |
49.1% |
Treasury Repurchase Agreements |
22.7% |
Government Agency Debt |
12.9% |
Government Agency Repurchase Agreements |
9.6% | |
| Largest Holdings [Text Block] |
Holdings |
% |
FICCBA TRI PARTY REPO A, 3.83%, due 01/02/26 |
4.1% |
U.S. Treasury Bills, 4.10%, due 01/02/26 |
3.6% |
FICCJP TRI PARTY REPO A, 3.82%, due 01/02/26 |
3.3% |
FICCUB BI PARTY REPO, 3.85%, due 01/02/26 |
2.7% |
FICCMS TRI PARTY REPO A, 3.85%, due 01/02/26 |
2.5% |
JP MORGAN SEC LLC TPR A, 3.82%, due 01/02/26 |
2.2% |
U.S. Treasury Bills, 4.13%, due 01/15/26 |
1.7% |
JP MORGAN SEC LLC TPR A, 3.86%, due 04/10/26 |
1.6% |
U.S. Treasury Bills, 3.95%, due 02/19/26 |
1.5% |
U.S. Treasury Bills, 3.72%, due 03/19/26 |
1.5% | |
| C000261738 |
|
| Shareholder Report [Line Items] |
|
| Fund Name |
State Street Institutional U.S. Government Money Market Fund
|
| Class Name |
Trust Class
|
| Trading Symbol |
GVBXX
|
| Annual or Semi-Annual Statement [Text Block] |
This annual shareholder report contains important information about the State Street Institutional U.S. Government Money Market Fund (the "Fund") for the period of June 13, 2025 (commencement of operations) through December 31, 2025.
|
| Additional Information [Text Block] |
You can find additional information about the Fund, including the Prospectus, Statement of Additional Information, financial statements and other information at www.ssga.com/us/en/institutional/fund-finder?tab=documents&type=cash. You can also request this information about the Fund by contacting us at 1-866-392-0869.
|
| Additional Information Phone Number |
1-866-392-0869
|
| Additional Information Website |
www.ssga.com/us/en/institutional/fund-finder?tab=documents&type=cash
|
| Expenses [Text Block] |
What were the Fund costs for the last year? (based on a hypothetical $10,000 Investment)
Class Name |
Costs of a $10,000 investment |
Costs paid as a percentage of a $10,000 investment |
Trust Class |
$9 |
0.17% | The expense table reflects the proportionate share of expenses allocated to the Fund by the affiliated Portfolio, in which the Fund invests. The dollar amount above reflects expenses paid since the commencement of operations. Expenses for the full reporting period would be higher. |
| Expenses Paid, Amount |
$ 9
|
| Expense Ratio, Percent |
0.17%
|
| Expenses Represent Both Master and Feeder [Text] |
The expense table reflects the proportionate share of expenses allocated to the Fund by the affiliated Portfolio, in which the Fund invests.
|
| AssetsNet |
$ 218,645,119,758
|
| Holdings Count | Holding |
248
|
| Advisory Fees Paid, Amount |
$ 0
|
| Additional Fund Statistics [Text Block] |
Key Fund Statistics as of 12/31/2025- Total Net Assets$218,645,119,758
- Number of Portfolio Holdings248
- Total Advisory Fees Paid$0
Reflects holdings of the Portfolio, in which the Fund invests. Advisory fees are paid by the Portfolio, in which the Fund invests. |
| Holdings [Text Block] |
Assets |
% |
Treasury Debt |
49.1% |
Treasury Repurchase Agreements |
22.7% |
Government Agency Debt |
12.9% |
Government Agency Repurchase Agreements |
9.6% | |
| Largest Holdings [Text Block] |
Holdings |
% |
FICCBA TRI PARTY REPO A, 3.83%, due 01/02/26 |
4.1% |
U.S. Treasury Bills, 4.10%, due 01/02/26 |
3.6% |
FICCJP TRI PARTY REPO A, 3.82%, due 01/02/26 |
3.3% |
FICCUB BI PARTY REPO, 3.85%, due 01/02/26 |
2.7% |
FICCMS TRI PARTY REPO A, 3.85%, due 01/02/26 |
2.5% |
JP MORGAN SEC LLC TPR A, 3.82%, due 01/02/26 |
2.2% |
U.S. Treasury Bills, 4.13%, due 01/15/26 |
1.7% |
JP MORGAN SEC LLC TPR A, 3.86%, due 04/10/26 |
1.6% |
U.S. Treasury Bills, 3.95%, due 02/19/26 |
1.5% |
U.S. Treasury Bills, 3.72%, due 03/19/26 |
1.5% | |
| C000158901 |
|
| Shareholder Report [Line Items] |
|
| Fund Name |
State Street Small/Mid Cap Equity Index Fund
|
| Class Name |
Class A
|
| Trading Symbol |
SSMJX
|
| Annual or Semi-Annual Statement [Text Block] |
This annual shareholder report contains important information about the State Street Small/Mid Cap Equity Index Fund (the "Fund") for the period of January 1, 2025 through December 31, 2025.
|
| Additional Information [Text Block] |
You can find additional information about the Fund, including the Prospectus, Statement of Additional Information, financial statements and other information at www.ssga.com/us/en/institutional/fund-finder?tab=documents&type=mf. You can also request this information about the Fund by contacting us at 1-800-647-7327.
|
| Additional Information Phone Number |
1-800-647-7327
|
| Additional Information Website |
www.ssga.com/us/en/institutional/fund-finder?tab=documents&type=mf
|
| Expenses [Text Block] |
What were the Fund costs for the last year? (based on a hypothetical $10,000 Investment)
Class Name |
Costs of a $10,000 investment |
Costs paid as a percentage of a $10,000 investment |
Class A |
$51 |
0.48% | The expense table reflects expenses from both the Fund and the affiliated Portfolio, in which the Fund invests. |
| Expenses Paid, Amount |
$ 51
|
| Expense Ratio, Percent |
0.48%
|
| Expenses Represent Both Master and Feeder [Text] |
The expense table reflects expenses from both the Fund and the affiliated Portfolio, in which the Fund invests.
|
| Factors Affecting Performance [Text Block] |
How did the Fund perform last year and what affected its performance?Mid and small-cap equities navigated a volatile year shaped by trade tensions, monetary policy shifts, and sector rotations. Early 2025 saw tariff uncertainty weigh on U.S. markets, with technology and consumer discretionary lagging, while value and defensive sectors outperformed. Q2 brought sharp swings as “Liberation Day” tariffs triggered selloffs before easing trade tensions and Artificial Intelligence ("A.I.") optimism fueled rebounds. In Q3, the U.S. Federal Reserve rate cuts and resilient earnings drove strong gains, led by technology and communication services, while emerging markets outpaced developed peers. Q4 capped the year with broad-based strength as inflation moderated, and central banks pivoted toward easing. Commodities surged-gold and silver out-performed on geopolitical risks-while energy lagged. Overall, 2025 delivered robust returns for risk assets, supported by A.I.-driven growth themes and improving macro conditions despite episodic volatility. |
| Performance Past Does Not Indicate Future [Text] |
The Fund’s past performance is not necessarily an indication of how the Fund will perform in the future. The returns do not reflect the deduction of taxes that a shareholder would pay on Fund distributions or on the redemption or sale of Fund shares.
|
| Line Graph [Table Text Block] |
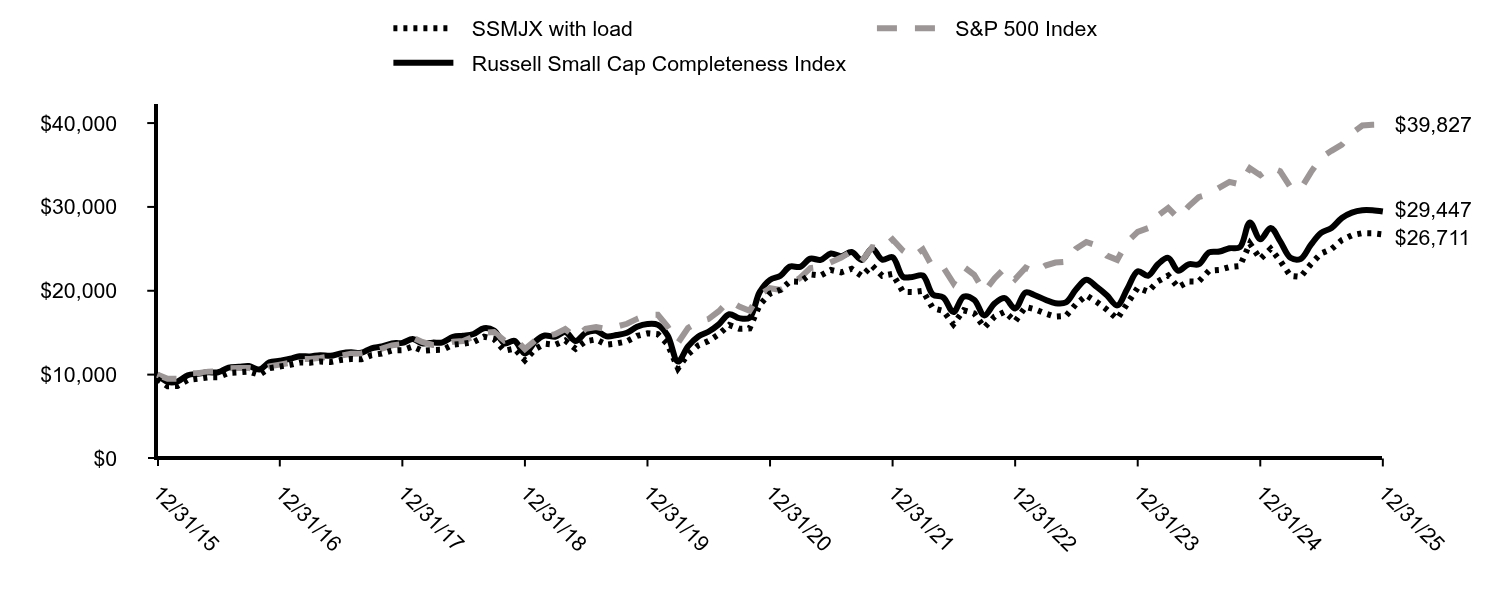
|
SSMJX with load |
S&P 500 Index |
Russell Small Cap Completeness Index |
12/31/15 |
$9,475 |
$10,000 |
$10,000 |
01/31/16 |
$8,621 |
$9,504 |
$9,138 |
02/29/16 |
$8,651 |
$9,491 |
$9,170 |
03/31/16 |
$9,363 |
$10,135 |
$9,930 |
04/30/16 |
$9,516 |
$10,174 |
$10,097 |
05/31/16 |
$9,678 |
$10,357 |
$10,281 |
06/30/16 |
$9,688 |
$10,384 |
$10,277 |
07/31/16 |
$10,207 |
$10,766 |
$10,832 |
08/31/16 |
$10,278 |
$10,782 |
$10,925 |
09/30/16 |
$10,370 |
$10,784 |
$11,022 |
10/31/16 |
$9,973 |
$10,587 |
$10,603 |
11/30/16 |
$10,766 |
$10,979 |
$11,457 |
12/31/16 |
$10,960 |
$11,196 |
$11,659 |
01/31/17 |
$11,175 |
$11,408 |
$11,890 |
02/28/17 |
$11,453 |
$11,861 |
$12,181 |
03/31/17 |
$11,422 |
$11,875 |
$12,171 |
04/30/17 |
$11,566 |
$11,997 |
$12,322 |
05/31/17 |
$11,494 |
$12,166 |
$12,240 |
06/30/17 |
$11,740 |
$12,242 |
$12,521 |
07/31/17 |
$11,864 |
$12,494 |
$12,654 |
08/31/17 |
$11,823 |
$12,532 |
$12,606 |
09/30/17 |
$12,326 |
$12,790 |
$13,143 |
10/31/17 |
$12,511 |
$13,089 |
$13,350 |
11/30/17 |
$12,870 |
$13,490 |
$13,728 |
12/31/17 |
$12,918 |
$13,640 |
$13,790 |
01/31/18 |
$13,350 |
$14,421 |
$14,242 |
02/28/18 |
$12,853 |
$13,890 |
$13,725 |
03/31/18 |
$12,939 |
$13,537 |
$13,814 |
04/30/18 |
$12,961 |
$13,589 |
$13,850 |
05/31/18 |
$13,577 |
$13,916 |
$14,508 |
06/30/18 |
$13,685 |
$14,002 |
$14,632 |
07/31/18 |
$13,880 |
$14,523 |
$14,848 |
08/31/18 |
$14,518 |
$14,996 |
$15,532 |
09/30/18 |
$14,258 |
$15,081 |
$15,262 |
10/31/18 |
$12,842 |
$14,050 |
$13,737 |
11/30/18 |
$13,102 |
$14,337 |
$14,013 |
12/31/18 |
$11,710 |
$13,042 |
$12,520 |
01/31/19 |
$13,063 |
$14,087 |
$13,967 |
02/28/19 |
$13,689 |
$14,540 |
$14,659 |
03/31/19 |
$13,566 |
$14,822 |
$14,518 |
04/30/19 |
$14,070 |
$15,422 |
$15,073 |
05/31/19 |
$13,085 |
$14,442 |
$14,012 |
06/30/19 |
$13,980 |
$15,460 |
$14,977 |
07/31/19 |
$14,193 |
$15,682 |
$15,216 |
08/31/19 |
$13,577 |
$15,434 |
$14,559 |
09/30/19 |
$13,723 |
$15,723 |
$14,717 |
10/31/19 |
$13,969 |
$16,063 |
$14,992 |
11/30/19 |
$14,618 |
$16,646 |
$15,697 |
12/31/19 |
$14,921 |
$17,149 |
$16,032 |
01/31/20 |
$14,815 |
$17,142 |
$15,936 |
02/29/20 |
$13,637 |
$15,731 |
$14,677 |
03/31/20 |
$10,740 |
$13,788 |
$11,562 |
04/30/20 |
$12,412 |
$15,555 |
$13,373 |
05/31/20 |
$13,492 |
$16,296 |
$14,549 |
06/30/20 |
$14,006 |
$16,620 |
$15,113 |
07/31/20 |
$14,809 |
$17,558 |
$15,996 |
08/31/20 |
$15,916 |
$18,820 |
$17,205 |
09/30/20 |
$15,471 |
$18,105 |
$16,735 |
10/31/20 |
$15,516 |
$17,623 |
$16,788 |
11/30/20 |
$18,319 |
$19,552 |
$19,838 |
12/31/20 |
$19,665 |
$20,304 |
$21,302 |
01/31/21 |
$20,109 |
$20,099 |
$21,785 |
02/28/21 |
$21,104 |
$20,653 |
$22,882 |
03/31/21 |
$21,073 |
$21,558 |
$22,852 |
04/30/21 |
$21,948 |
$22,708 |
$23,824 |
05/31/21 |
$21,815 |
$22,867 |
$23,688 |
06/30/21 |
$22,484 |
$23,401 |
$24,436 |
07/31/21 |
$22,191 |
$23,956 |
$24,129 |
08/31/21 |
$22,624 |
$24,685 |
$24,614 |
09/30/21 |
$21,762 |
$23,537 |
$23,682 |
10/31/21 |
$23,003 |
$25,186 |
$25,045 |
11/30/21 |
$21,778 |
$25,011 |
$23,720 |
12/31/21 |
$22,014 |
$26,132 |
$23,994 |
01/31/22 |
$19,865 |
$24,780 |
$21,661 |
02/28/22 |
$19,845 |
$24,038 |
$21,648 |
03/31/22 |
$19,996 |
$24,931 |
$21,819 |
04/30/22 |
$17,909 |
$22,757 |
$19,545 |
05/31/22 |
$17,597 |
$22,798 |
$19,202 |
06/30/22 |
$16,003 |
$20,916 |
$17,464 |
07/31/22 |
$17,673 |
$22,845 |
$19,296 |
08/31/22 |
$17,307 |
$21,913 |
$18,903 |
09/30/22 |
$15,609 |
$19,895 |
$17,051 |
10/31/22 |
$16,926 |
$21,506 |
$18,497 |
11/30/22 |
$17,498 |
$22,708 |
$19,126 |
12/31/22 |
$16,347 |
$21,399 |
$17,877 |
01/31/23 |
$18,090 |
$22,744 |
$19,789 |
02/28/23 |
$17,796 |
$22,189 |
$19,470 |
03/31/23 |
$17,295 |
$23,004 |
$18,929 |
04/30/23 |
$16,913 |
$23,363 |
$18,515 |
05/31/23 |
$16,989 |
$23,464 |
$18,604 |
06/30/23 |
$18,389 |
$25,015 |
$20,140 |
07/31/23 |
$19,456 |
$25,818 |
$21,313 |
08/31/23 |
$18,666 |
$25,407 |
$20,455 |
09/30/23 |
$17,753 |
$24,196 |
$19,460 |
10/31/23 |
$16,647 |
$23,687 |
$18,256 |
11/30/23 |
$18,471 |
$25,850 |
$20,227 |
12/31/23 |
$20,369 |
$27,025 |
$22,312 |
01/31/24 |
$19,889 |
$27,479 |
$21,792 |
02/29/24 |
$21,120 |
$28,946 |
$23,149 |
03/31/24 |
$21,819 |
$29,878 |
$23,923 |
04/30/24 |
$20,411 |
$28,657 |
$22,389 |
05/31/24 |
$21,108 |
$30,078 |
$23,161 |
06/30/24 |
$21,098 |
$31,157 |
$23,154 |
07/31/24 |
$22,394 |
$31,537 |
$24,575 |
08/31/24 |
$22,483 |
$32,302 |
$24,677 |
09/30/24 |
$22,831 |
$32,992 |
$25,066 |
10/31/24 |
$22,948 |
$32,692 |
$25,201 |
11/30/24 |
$25,632 |
$34,611 |
$28,152 |
12/31/24 |
$23,793 |
$33,786 |
$26,136 |
01/31/25 |
$25,015 |
$34,727 |
$27,485 |
02/28/25 |
$23,590 |
$34,274 |
$25,925 |
03/31/25 |
$21,776 |
$32,343 |
$23,938 |
04/30/25 |
$21,652 |
$32,124 |
$23,803 |
05/31/25 |
$23,187 |
$34,146 |
$25,499 |
06/30/25 |
$24,450 |
$35,882 |
$26,901 |
07/31/25 |
$24,972 |
$36,687 |
$27,487 |
08/31/25 |
$26,048 |
$37,431 |
$28,679 |
09/30/25 |
$26,622 |
$38,797 |
$29,320 |
10/31/25 |
$26,871 |
$39,706 |
$29,600 |
11/30/25 |
$26,858 |
$39,803 |
$29,596 |
12/31/25 |
$26,711 |
$39,827 |
$29,447 |
|
| Average Annual Return [Table Text Block] |
Name |
1 Year |
5 Years |
10 Years |
SSMJX |
12.26% |
6.32% |
10.92% |
SSMJX (Adjusted for the 5.25% Maximum Sales Charge) |
6.37% |
5.18% |
10.32% |
S&P 500 Index |
17.88% |
14.42% |
14.82% |
Russell Small Cap Completeness Index |
12.67% |
6.69% |
11.40% | |
| Updated Performance Information Location [Text Block] |
Updated performance information is available by calling 1-800-647-7327 or visiting our website at www.ssga.com.
|
| AssetsNet |
$ 782,666,787
|
| Holdings Count | Holding |
2,476
|
| Advisory Fees Paid, Amount |
$ 0
|
| InvestmentCompanyPortfolioTurnover |
26.00%
|
| Additional Fund Statistics [Text Block] |
Key Fund Statistics as of 12/31/2025- Total Net Assets$782,666,787
- Number of Portfolio Holdings2,476
- Portfolio Turnover Rate26%
- Total Advisory Fees Paid$0
Portfolio holdings and portfolio turnover rate are from the corresponding Portfolio, in which the Fund invests. |
| Holdings [Text Block] |
Industries |
% |
Biotechnology |
6.7% |
Banks |
6.6% |
Software |
6.4% |
Semiconductors & Semiconductor Equipment |
3.6% |
Machinery |
3.4% |
Capital Markets |
3.2% |
IT Services |
3.1% |
Insurance |
3.0% |
Hotels, Restaurants & Leisure |
2.9% |
Aerospace & Defense |
2.9% | |
| Largest Holdings [Text Block] |
Holdings |
% |
Spotify Technology SA |
1.2% |
Marvell Technology, Inc. |
1.0% |
Snowflake, Inc. |
0.9% |
Cloudflare, Inc., Class A |
0.8% |
Vertiv Holdings Co., Class A |
0.8% |
NU Holdings Ltd., Class A |
0.7% |
Alnylam Pharmaceuticals, Inc. |
0.7% |
ROBLOX Corp., Class A |
0.7% |
Anglogold Ashanti PLC |
0.6% |
Ferguson Enterprises, Inc. |
0.6% | |
| Material Fund Change [Text Block] |
|
| C000158902 |
|
| Shareholder Report [Line Items] |
|
| Fund Name |
State Street Small/Mid Cap Equity Index Fund
|
| Class Name |
Class I
|
| Trading Symbol |
SSMLX
|
| Annual or Semi-Annual Statement [Text Block] |
This annual shareholder report contains important information about the State Street Small/Mid Cap Equity Index Fund (the "Fund") for the period of January 1, 2025 through December 31, 2025.
|
| Additional Information [Text Block] |
You can find additional information about the Fund, including the Prospectus, Statement of Additional Information, financial statements and other information at www.ssga.com/us/en/institutional/fund-finder?tab=documents&type=mf. You can also request this information about the Fund by contacting us at 1-800-647-7327.
|
| Additional Information Phone Number |
1-800-647-7327
|
| Additional Information Website |
www.ssga.com/us/en/institutional/fund-finder?tab=documents&type=mf
|
| Expenses [Text Block] |
What were the Fund costs for the last year? (based on a hypothetical $10,000 Investment)
Class Name |
Costs of a $10,000 investment |
Costs paid as a percentage of a $10,000 investment |
Class I |
$12 |
0.11% | The expense table reflects expenses from both the Fund and the affiliated Portfolio, in which the Fund invests. |
| Expenses Paid, Amount |
$ 12
|
| Expense Ratio, Percent |
0.11%
|
| Expenses Represent Both Master and Feeder [Text] |
The expense table reflects expenses from both the Fund and the affiliated Portfolio, in which the Fund invests.
|
| Factors Affecting Performance [Text Block] |
How did the Fund perform last year and what affected its performance?Mid and small-cap equities navigated a volatile year shaped by trade tensions, monetary policy shifts, and sector rotations. Early 2025 saw tariff uncertainty weigh on U.S. markets, with technology and consumer discretionary lagging, while value and defensive sectors outperformed. Q2 brought sharp swings as “Liberation Day” tariffs triggered selloffs before easing trade tensions and Artificial Intelligence ("A.I.") optimism fueled rebounds. In Q3, the U.S. Federal Reserve rate cuts and resilient earnings drove strong gains, led by technology and communication services, while emerging markets outpaced developed peers. Q4 capped the year with broad-based strength as inflation moderated, and central banks pivoted toward easing. Commodities surged-gold and silver out-performed on geopolitical risks-while energy lagged. Overall, 2025 delivered robust returns for risk assets, supported by A.I.-driven growth themes and improving macro conditions despite episodic volatility. |
| Performance Past Does Not Indicate Future [Text] |
The Fund’s past performance is not necessarily an indication of how the Fund will perform in the future. The returns do not reflect the deduction of taxes that a shareholder would pay on Fund distributions or on the redemption or sale of Fund shares.
|
| Line Graph [Table Text Block] |
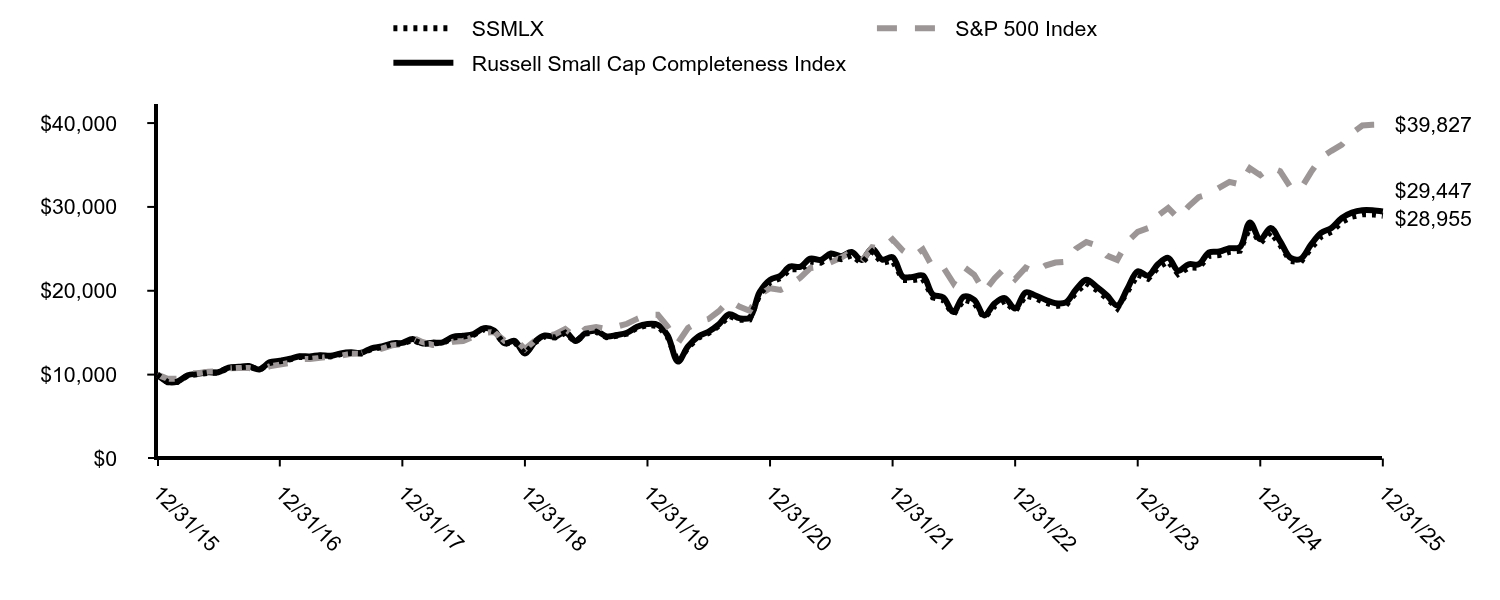
|
SSMLX |
S&P 500 Index |
Russell Small Cap Completeness Index |
12/31/15 |
$10,000 |
$10,000 |
$10,000 |
01/31/16 |
$9,099 |
$9,504 |
$9,138 |
02/29/16 |
$9,131 |
$9,491 |
$9,170 |
03/31/16 |
$9,882 |
$10,135 |
$9,930 |
04/30/16 |
$10,043 |
$10,174 |
$10,097 |
05/31/16 |
$10,225 |
$10,357 |
$10,281 |
06/30/16 |
$10,236 |
$10,384 |
$10,277 |
07/31/16 |
$10,794 |
$10,766 |
$10,832 |
08/31/16 |
$10,869 |
$10,782 |
$10,925 |
09/30/16 |
$10,966 |
$10,784 |
$11,022 |
10/31/16 |
$10,547 |
$10,587 |
$10,603 |
11/30/16 |
$11,395 |
$10,979 |
$11,457 |
12/31/16 |
$11,596 |
$11,196 |
$11,659 |
01/31/17 |
$11,824 |
$11,408 |
$11,890 |
02/28/17 |
$12,118 |
$11,861 |
$12,181 |
03/31/17 |
$12,096 |
$11,875 |
$12,171 |
04/30/17 |
$12,248 |
$11,997 |
$12,322 |
05/31/17 |
$12,172 |
$12,166 |
$12,240 |
06/30/17 |
$12,444 |
$12,242 |
$12,521 |
07/31/17 |
$12,574 |
$12,494 |
$12,654 |
08/31/17 |
$12,531 |
$12,532 |
$12,606 |
09/30/17 |
$13,063 |
$12,790 |
$13,143 |
10/31/17 |
$13,270 |
$13,089 |
$13,350 |
11/30/17 |
$13,650 |
$13,490 |
$13,728 |
12/31/17 |
$13,702 |
$13,640 |
$13,790 |
01/31/18 |
$14,161 |
$14,421 |
$14,242 |
02/28/18 |
$13,645 |
$13,890 |
$13,725 |
03/31/18 |
$13,736 |
$13,537 |
$13,814 |
04/30/18 |
$13,771 |
$13,589 |
$13,850 |
05/31/18 |
$14,424 |
$13,916 |
$14,508 |
06/30/18 |
$14,539 |
$14,002 |
$14,632 |
07/31/18 |
$14,745 |
$14,523 |
$14,848 |
08/31/18 |
$15,422 |
$14,996 |
$15,532 |
09/30/18 |
$15,158 |
$15,081 |
$15,262 |
10/31/18 |
$13,645 |
$14,050 |
$13,737 |
11/30/18 |
$13,920 |
$14,337 |
$14,013 |
12/31/18 |
$12,460 |
$13,042 |
$12,520 |
01/31/19 |
$13,886 |
$14,087 |
$13,967 |
02/28/19 |
$14,564 |
$14,540 |
$14,659 |
03/31/19 |
$14,433 |
$14,822 |
$14,518 |
04/30/19 |
$14,980 |
$15,422 |
$15,073 |
05/31/19 |
$13,922 |
$14,442 |
$14,012 |
06/30/19 |
$14,885 |
$15,460 |
$14,977 |
07/31/19 |
$15,111 |
$15,682 |
$15,216 |
08/31/19 |
$14,457 |
$15,434 |
$14,559 |
09/30/19 |
$14,623 |
$15,723 |
$14,717 |
10/31/19 |
$14,885 |
$16,063 |
$14,992 |
11/30/19 |
$15,586 |
$16,646 |
$15,697 |
12/31/19 |
$15,911 |
$17,149 |
$16,032 |
01/31/20 |
$15,811 |
$17,142 |
$15,936 |
02/29/20 |
$14,555 |
$15,731 |
$14,677 |
03/31/20 |
$11,466 |
$13,788 |
$11,562 |
04/30/20 |
$13,250 |
$15,555 |
$13,373 |
05/31/20 |
$14,406 |
$16,296 |
$14,549 |
06/30/20 |
$14,957 |
$16,620 |
$15,113 |
07/31/20 |
$15,817 |
$17,558 |
$15,996 |
08/31/20 |
$17,004 |
$18,820 |
$17,205 |
09/30/20 |
$16,532 |
$18,105 |
$16,735 |
10/31/20 |
$16,584 |
$17,623 |
$16,788 |
11/30/20 |
$19,584 |
$19,552 |
$19,838 |
12/31/20 |
$21,027 |
$20,304 |
$21,302 |
01/31/21 |
$21,506 |
$20,099 |
$21,785 |
02/28/21 |
$22,574 |
$20,653 |
$22,882 |
03/31/21 |
$22,546 |
$21,558 |
$22,852 |
04/30/21 |
$23,487 |
$22,708 |
$23,824 |
05/31/21 |
$23,350 |
$22,867 |
$23,688 |
06/30/21 |
$24,071 |
$23,401 |
$24,436 |
07/31/21 |
$23,762 |
$23,956 |
$24,129 |
08/31/21 |
$24,231 |
$24,685 |
$24,614 |
09/30/21 |
$23,313 |
$23,537 |
$23,682 |
10/31/21 |
$24,647 |
$25,186 |
$25,045 |
11/30/21 |
$23,339 |
$25,011 |
$23,720 |
12/31/21 |
$23,597 |
$26,132 |
$23,994 |
01/31/22 |
$21,297 |
$24,780 |
$21,661 |
02/28/22 |
$21,280 |
$24,038 |
$21,648 |
03/31/22 |
$21,447 |
$24,931 |
$21,819 |
04/30/22 |
$19,213 |
$22,757 |
$19,545 |
05/31/22 |
$18,881 |
$22,798 |
$19,202 |
06/30/22 |
$17,175 |
$20,916 |
$17,464 |
07/31/22 |
$18,971 |
$22,845 |
$19,296 |
08/31/22 |
$18,583 |
$21,913 |
$18,903 |
09/30/22 |
$16,762 |
$19,895 |
$17,051 |
10/31/22 |
$18,182 |
$21,506 |
$18,497 |
11/30/22 |
$18,800 |
$22,708 |
$19,126 |
12/31/22 |
$17,566 |
$21,399 |
$17,877 |
01/31/23 |
$19,444 |
$22,744 |
$19,789 |
02/28/23 |
$19,132 |
$22,189 |
$19,470 |
03/31/23 |
$18,597 |
$23,004 |
$18,929 |
04/30/23 |
$18,189 |
$23,363 |
$18,515 |
05/31/23 |
$18,276 |
$23,464 |
$18,604 |
06/30/23 |
$19,786 |
$25,015 |
$20,140 |
07/31/23 |
$20,937 |
$25,818 |
$21,313 |
08/31/23 |
$20,092 |
$25,407 |
$20,455 |
09/30/23 |
$19,113 |
$24,196 |
$19,460 |
10/31/23 |
$17,926 |
$23,687 |
$18,256 |
11/30/23 |
$19,895 |
$25,850 |
$20,227 |
12/31/23 |
$21,943 |
$27,025 |
$22,312 |
01/31/24 |
$21,431 |
$27,479 |
$21,792 |
02/29/24 |
$22,762 |
$28,946 |
$23,149 |
03/31/24 |
$23,519 |
$29,878 |
$23,923 |
04/30/24 |
$22,007 |
$28,657 |
$22,389 |
05/31/24 |
$22,764 |
$30,078 |
$23,161 |
06/30/24 |
$22,757 |
$31,157 |
$23,154 |
07/31/24 |
$24,159 |
$31,537 |
$24,575 |
08/31/24 |
$24,261 |
$32,302 |
$24,677 |
09/30/24 |
$24,641 |
$32,992 |
$25,066 |
10/31/24 |
$24,772 |
$32,692 |
$25,201 |
11/30/24 |
$27,676 |
$34,611 |
$28,152 |
12/31/24 |
$25,695 |
$33,786 |
$26,136 |
01/31/25 |
$27,021 |
$34,727 |
$27,485 |
02/28/25 |
$25,487 |
$34,274 |
$25,925 |
03/31/25 |
$23,538 |
$32,343 |
$23,938 |
04/30/25 |
$23,419 |
$32,124 |
$23,803 |
05/31/25 |
$25,089 |
$34,146 |
$25,499 |
06/30/25 |
$26,462 |
$35,882 |
$26,901 |
07/31/25 |
$27,034 |
$36,687 |
$27,487 |
08/31/25 |
$28,207 |
$37,431 |
$28,679 |
09/30/25 |
$28,838 |
$38,797 |
$29,320 |
10/31/25 |
$29,116 |
$39,706 |
$29,600 |
11/30/25 |
$29,110 |
$39,803 |
$29,596 |
12/31/25 |
$28,955 |
$39,827 |
$29,447 |
|
| Average Annual Return [Table Text Block] |
Name |
1 Year |
5 Years |
10 Years |
SSMLX |
12.68% |
6.61% |
11.22% |
S&P 500 Index |
17.88% |
14.42% |
14.82% |
Russell Small Cap Completeness Index |
12.67% |
6.69% |
11.40% | |
| Updated Performance Information Location [Text Block] |
Updated performance information is available by calling 1-800-647-7327 or visiting our website at www.ssga.com.
|
| AssetsNet |
$ 782,666,787
|
| Holdings Count | Holding |
2,476
|
| Advisory Fees Paid, Amount |
$ 0
|
| InvestmentCompanyPortfolioTurnover |
26.00%
|
| Additional Fund Statistics [Text Block] |
Key Fund Statistics as of 12/31/2025- Total Net Assets$782,666,787
- Number of Portfolio Holdings2,476
- Portfolio Turnover Rate26%
- Total Advisory Fees Paid$0
Portfolio holdings and portfolio turnover rate are from the corresponding Portfolio, in which the Fund invests. |
| Holdings [Text Block] |
Industries |
% |
Biotechnology |
6.7% |
Banks |
6.6% |
Software |
6.4% |
Semiconductors & Semiconductor Equipment |
3.6% |
Machinery |
3.4% |
Capital Markets |
3.2% |
IT Services |
3.1% |
Insurance |
3.0% |
Hotels, Restaurants & Leisure |
2.9% |
Aerospace & Defense |
2.9% | |
| Largest Holdings [Text Block] |
Holdings |
% |
Spotify Technology SA |
1.2% |
Marvell Technology, Inc. |
1.0% |
Snowflake, Inc. |
0.9% |
Cloudflare, Inc., Class A |
0.8% |
Vertiv Holdings Co., Class A |
0.8% |
NU Holdings Ltd., Class A |
0.7% |
Alnylam Pharmaceuticals, Inc. |
0.7% |
ROBLOX Corp., Class A |
0.7% |
Anglogold Ashanti PLC |
0.6% |
Ferguson Enterprises, Inc. |
0.6% | |
| Material Fund Change [Text Block] |
|
| C000158903 |
|
| Shareholder Report [Line Items] |
|
| Fund Name |
State Street Small/Mid Cap Equity Index Fund
|
| Class Name |
Class K
|
| Trading Symbol |
SSMKX
|
| Annual or Semi-Annual Statement [Text Block] |
This annual shareholder report contains important information about the State Street Small/Mid Cap Equity Index Fund (the "Fund") for the period of January 1, 2025 through December 31, 2025.
|
| Additional Information [Text Block] |
You can find additional information about the Fund, including the Prospectus, Statement of Additional Information, financial statements and other information at www.ssga.com/us/en/institutional/fund-finder?tab=documents&type=mf. You can also request this information about the Fund by contacting us at 1-800-647-7327.
|
| Additional Information Phone Number |
1-800-647-7327
|
| Additional Information Website |
www.ssga.com/us/en/institutional/fund-finder?tab=documents&type=mf
|
| Expenses [Text Block] |
What were the Fund costs for the last year? (based on a hypothetical $10,000 Investment)
Class Name |
Costs of a $10,000 investment |
Costs paid as a percentage of a $10,000 investment |
Class K |
$3 |
0.03% | The expense table reflects expenses from both the Fund and the affiliated Portfolio, in which the Fund invests. |
| Expenses Paid, Amount |
$ 3
|
| Expense Ratio, Percent |
0.03%
|
| Expenses Represent Both Master and Feeder [Text] |
The expense table reflects expenses from both the Fund and the affiliated Portfolio, in which the Fund invests.
|
| Factors Affecting Performance [Text Block] |
How did the Fund perform last year and what affected its performance?Mid and small-cap equities navigated a volatile year shaped by trade tensions, monetary policy shifts, and sector rotations. Early 2025 saw tariff uncertainty weigh on U.S. markets, with technology and consumer discretionary lagging, while value and defensive sectors outperformed. Q2 brought sharp swings as “Liberation Day” tariffs triggered selloffs before easing trade tensions and Artificial Intelligence ("A.I.") optimism fueled rebounds. In Q3, the U.S. Federal Reserve rate cuts and resilient earnings drove strong gains, led by technology and communication services, while emerging markets outpaced developed peers. Q4 capped the year with broad-based strength as inflation moderated, and central banks pivoted toward easing. Commodities surged-gold and silver out-performed on geopolitical risks-while energy lagged. Overall, 2025 delivered robust returns for risk assets, supported by A.I.-driven growth themes and improving macro conditions despite episodic volatility. |
| Performance Past Does Not Indicate Future [Text] |
The Fund’s past performance is not necessarily an indication of how the Fund will perform in the future. The returns do not reflect the deduction of taxes that a shareholder would pay on Fund distributions or on the redemption or sale of Fund shares.
|
| Line Graph [Table Text Block] |

|
SSMKX |
S&P 500 Index |
Russell Small Cap Completeness Index |
12/31/15 |
$10,000 |
$10,000 |
$10,000 |
01/31/16 |
$9,118 |
$9,504 |
$9,138 |
02/29/16 |
$9,151 |
$9,491 |
$9,170 |
03/31/16 |
$9,903 |
$10,135 |
$9,930 |
04/30/16 |
$10,065 |
$10,174 |
$10,097 |
05/31/16 |
$10,247 |
$10,357 |
$10,281 |
06/30/16 |
$10,258 |
$10,384 |
$10,277 |
07/31/16 |
$10,806 |
$10,766 |
$10,832 |
08/31/16 |
$10,892 |
$10,782 |
$10,925 |
09/30/16 |
$10,989 |
$10,784 |
$11,022 |
10/31/16 |
$10,570 |
$10,587 |
$10,603 |
11/30/16 |
$11,419 |
$10,979 |
$11,457 |
12/31/16 |
$11,621 |
$11,196 |
$11,659 |
01/31/17 |
$11,850 |
$11,408 |
$11,890 |
02/28/17 |
$12,144 |
$11,861 |
$12,181 |
03/31/17 |
$12,122 |
$11,875 |
$12,171 |
04/30/17 |
$12,274 |
$11,997 |
$12,322 |
05/31/17 |
$12,198 |
$12,166 |
$12,240 |
06/30/17 |
$12,470 |
$12,242 |
$12,521 |
07/31/17 |
$12,601 |
$12,494 |
$12,654 |
08/31/17 |
$12,558 |
$12,532 |
$12,606 |
09/30/17 |
$13,091 |
$12,790 |
$13,143 |
10/31/17 |
$13,298 |
$13,089 |
$13,350 |
11/30/17 |
$13,679 |
$13,490 |
$13,728 |
12/31/17 |
$13,731 |
$13,640 |
$13,790 |
01/31/18 |
$14,202 |
$14,421 |
$14,242 |
02/28/18 |
$13,674 |
$13,890 |
$13,725 |
03/31/18 |
$13,766 |
$13,537 |
$13,814 |
04/30/18 |
$13,800 |
$13,589 |
$13,850 |
05/31/18 |
$14,455 |
$13,916 |
$14,508 |
06/30/18 |
$14,570 |
$14,002 |
$14,632 |
07/31/18 |
$14,788 |
$14,523 |
$14,848 |
08/31/18 |
$15,466 |
$14,996 |
$15,532 |
09/30/18 |
$15,191 |
$15,081 |
$15,262 |
10/31/18 |
$13,685 |
$14,050 |
$13,737 |
11/30/18 |
$13,961 |
$14,337 |
$14,013 |
12/31/18 |
$12,491 |
$13,042 |
$12,520 |
01/31/19 |
$13,934 |
$14,087 |
$13,967 |
02/28/19 |
$14,601 |
$14,540 |
$14,659 |
03/31/19 |
$14,470 |
$14,822 |
$14,518 |
04/30/19 |
$15,018 |
$15,422 |
$15,073 |
05/31/19 |
$13,957 |
$14,442 |
$14,012 |
06/30/19 |
$14,935 |
$15,460 |
$14,977 |
07/31/19 |
$15,161 |
$15,682 |
$15,216 |
08/31/19 |
$14,506 |
$15,434 |
$14,559 |
09/30/19 |
$14,673 |
$15,723 |
$14,717 |
10/31/19 |
$14,935 |
$16,063 |
$14,992 |
11/30/19 |
$15,638 |
$16,646 |
$15,697 |
12/31/19 |
$15,969 |
$17,149 |
$16,032 |
01/31/20 |
$15,868 |
$17,142 |
$15,936 |
02/29/20 |
$14,620 |
$15,731 |
$14,677 |
03/31/20 |
$11,520 |
$13,788 |
$11,562 |
04/30/20 |
$13,309 |
$15,555 |
$13,373 |
05/31/20 |
$14,473 |
$16,296 |
$14,549 |
06/30/20 |
$15,029 |
$16,620 |
$15,113 |
07/31/20 |
$15,896 |
$17,558 |
$15,996 |
08/31/20 |
$17,091 |
$18,820 |
$17,205 |
09/30/20 |
$16,619 |
$18,105 |
$16,735 |
10/31/20 |
$16,675 |
$17,623 |
$16,788 |
11/30/20 |
$19,694 |
$19,552 |
$19,838 |
12/31/20 |
$21,149 |
$20,304 |
$21,302 |
01/31/21 |
$21,635 |
$20,099 |
$21,785 |
02/28/21 |
$22,713 |
$20,653 |
$22,882 |
03/31/21 |
$22,689 |
$21,558 |
$22,852 |
04/30/21 |
$23,639 |
$22,708 |
$23,824 |
05/31/21 |
$23,505 |
$22,867 |
$23,688 |
06/30/21 |
$24,234 |
$23,401 |
$24,436 |
07/31/21 |
$23,928 |
$23,956 |
$24,129 |
08/31/21 |
$24,404 |
$24,685 |
$24,614 |
09/30/21 |
$23,484 |
$23,537 |
$23,682 |
10/31/21 |
$24,832 |
$25,186 |
$25,045 |
11/30/21 |
$23,518 |
$25,011 |
$23,720 |
12/31/21 |
$23,781 |
$26,132 |
$23,994 |
01/31/22 |
$21,468 |
$24,780 |
$21,661 |
02/28/22 |
$21,454 |
$24,038 |
$21,648 |
03/31/22 |
$21,626 |
$24,931 |
$21,819 |
04/30/22 |
$19,375 |
$22,757 |
$19,545 |
05/31/22 |
$19,045 |
$22,798 |
$19,202 |
06/30/22 |
$17,327 |
$20,916 |
$17,464 |
07/31/22 |
$19,142 |
$22,845 |
$19,296 |
08/31/22 |
$18,753 |
$21,913 |
$18,903 |
09/30/22 |
$16,919 |
$19,895 |
$17,051 |
10/31/22 |
$18,354 |
$21,506 |
$18,497 |
11/30/22 |
$18,981 |
$22,708 |
$19,126 |
12/31/22 |
$17,739 |
$21,399 |
$17,877 |
01/31/23 |
$19,638 |
$22,744 |
$19,789 |
02/28/23 |
$19,326 |
$22,189 |
$19,470 |
03/31/23 |
$18,790 |
$23,004 |
$18,929 |
04/30/23 |
$18,380 |
$23,363 |
$18,515 |
05/31/23 |
$18,471 |
$23,464 |
$18,604 |
06/30/23 |
$20,000 |
$25,015 |
$20,140 |
07/31/23 |
$21,168 |
$25,818 |
$21,313 |
08/31/23 |
$20,317 |
$25,407 |
$20,455 |
09/30/23 |
$19,329 |
$24,196 |
$19,460 |
10/31/23 |
$18,133 |
$23,687 |
$18,256 |
11/30/23 |
$20,127 |
$25,850 |
$20,227 |
12/31/23 |
$22,203 |
$27,025 |
$22,312 |
01/31/24 |
$21,689 |
$27,479 |
$21,792 |
02/29/24 |
$23,039 |
$28,946 |
$23,149 |
03/31/24 |
$23,810 |
$29,878 |
$23,923 |
04/30/24 |
$22,283 |
$28,657 |
$22,389 |
05/31/24 |
$23,052 |
$30,078 |
$23,161 |
06/30/24 |
$23,046 |
$31,157 |
$23,154 |
07/31/24 |
$24,465 |
$31,537 |
$24,575 |
08/31/24 |
$24,568 |
$32,302 |
$24,677 |
09/30/24 |
$24,953 |
$32,992 |
$25,066 |
10/31/24 |
$25,085 |
$32,692 |
$25,201 |
11/30/24 |
$28,026 |
$34,611 |
$28,152 |
12/31/24 |
$26,020 |
$33,786 |
$26,136 |
01/31/25 |
$27,363 |
$34,727 |
$27,485 |
02/28/25 |
$25,810 |
$34,274 |
$25,925 |
03/31/25 |
$23,836 |
$32,343 |
$23,938 |
04/30/25 |
$23,718 |
$32,124 |
$23,803 |
05/31/25 |
$25,410 |
$34,146 |
$25,499 |
06/30/25 |
$26,803 |
$35,882 |
$26,901 |
07/31/25 |
$27,385 |
$36,687 |
$27,487 |
08/31/25 |
$28,575 |
$37,431 |
$28,679 |
09/30/25 |
$29,215 |
$38,797 |
$29,320 |
10/31/25 |
$29,500 |
$39,706 |
$29,600 |
11/30/25 |
$29,496 |
$39,803 |
$29,596 |
12/31/25 |
$29,345 |
$39,827 |
$29,447 |
|
| Average Annual Return [Table Text Block] |
Name |
1 Year |
5 Years |
10 Years |
SSMKX |
12.78% |
6.77% |
11.37% |
S&P 500 Index |
17.88% |
14.42% |
14.82% |
Russell Small Cap Completeness Index |
12.67% |
6.69% |
11.40% | |
| Updated Performance Information Location [Text Block] |
Updated performance information is available by calling 1-800-647-7327 or visiting our website at www.ssga.com.
|
| AssetsNet |
$ 782,666,787
|
| Holdings Count | Holding |
2,476
|
| Advisory Fees Paid, Amount |
$ 0
|
| InvestmentCompanyPortfolioTurnover |
26.00%
|
| Additional Fund Statistics [Text Block] |
Key Fund Statistics as of 12/31/2025- Total Net Assets$782,666,787
- Number of Portfolio Holdings2,476
- Portfolio Turnover Rate26%
- Total Advisory Fees Paid$0
Portfolio holdings and portfolio turnover rate are from the corresponding Portfolio, in which the Fund invests. |
| Holdings [Text Block] |
Industries |
% |
Biotechnology |
6.7% |
Banks |
6.6% |
Software |
6.4% |
Semiconductors & Semiconductor Equipment |
3.6% |
Machinery |
3.4% |
Capital Markets |
3.2% |
IT Services |
3.1% |
Insurance |
3.0% |
Hotels, Restaurants & Leisure |
2.9% |
Aerospace & Defense |
2.9% | |
| Largest Holdings [Text Block] |
Holdings |
% |
Spotify Technology SA |
1.2% |
Marvell Technology, Inc. |
1.0% |
Snowflake, Inc. |
0.9% |
Cloudflare, Inc., Class A |
0.8% |
Vertiv Holdings Co., Class A |
0.8% |
NU Holdings Ltd., Class A |
0.7% |
Alnylam Pharmaceuticals, Inc. |
0.7% |
ROBLOX Corp., Class A |
0.7% |
Anglogold Ashanti PLC |
0.6% |
Ferguson Enterprises, Inc. |
0.6% | |
| Material Fund Change [Text Block] |
|
| C000158904 |
|
| Shareholder Report [Line Items] |
|
| Fund Name |
State Street Small/Mid Cap Equity Index Portfolio
|
| Trading Symbol |
SSMHX
|
| Annual or Semi-Annual Statement [Text Block] |
This annual shareholder report contains important information about the State Street Small/Mid Cap Equity Index Portfolio (the "Fund") for the period of January 1, 2025 through December 31, 2025.
|
| Additional Information [Text Block] |
You can find additional information about the Fund, including the Prospectus, Statement of Additional Information, financial statements and other information at www.ssga.com/us/en/institutional/resources/master-portfolio-fund-documents. You can also request this information about the Fund by contacting us at 1-800-647-7327.
|
| Additional Information Phone Number |
1-800-647-7327
|
| Additional Information Website |
www.ssga.com/us/en/institutional/resources/master-portfolio-fund-documents
|
| Expenses [Text Block] |
What were the Fund costs for the last year? (based on a hypothetical $10,000 Investment)
Fund Name |
Costs of a $10,000 investment |
Costs paid as a percentage of a $10,000 investment |
State Street Small/Mid Cap Equity Index Portfolio |
$1 |
0.01% | |
| Expenses Paid, Amount |
$ 1
|
| Expense Ratio, Percent |
0.01%
|
| Factors Affecting Performance [Text Block] |
How did the Fund perform last year and what affected its performance?Mid and small-cap equities navigated a volatile year shaped by trade tensions, monetary policy shifts, and sector rotations. Early 2025 saw tariff uncertainty weigh on U.S. markets, with technology and consumer discretionary lagging, while value and defensive sectors outperformed. Q2 brought sharp swings as “Liberation Day” tariffs triggered selloffs before easing trade tensions and Artificial Intelligence ("A.I.") optimism fueled rebounds. In Q3, the U.S. Federal Reserve rate cuts and resilient earnings drove strong gains, led by technology and communication services, while emerging markets outpaced developed peers. Q4 capped the year with broad-based strength as inflation moderated, and central banks pivoted toward easing. Commodities surged-gold and silver out-performed on geopolitical risks-while energy lagged. Overall, 2025 delivered robust returns for risk assets, supported by A.I.-driven growth themes and improving macro conditions despite episodic volatility. |
| Performance Past Does Not Indicate Future [Text] |
The Fund’s past performance is not necessarily an indication of how the Fund will perform in the future. The returns do not reflect the deduction of taxes that a shareholder would pay on Fund distributions or on the redemption or sale of Fund shares.
|
| Line Graph [Table Text Block] |

|
SSMHX |
S&P 500 Index |
Russell Small Cap Completeness Index |
12/31/15 |
$10,000 |
$10,000 |
$10,000 |
01/31/16 |
$9,140 |
$9,504 |
$9,138 |
02/29/16 |
$9,172 |
$9,491 |
$9,170 |
03/31/16 |
$9,925 |
$10,135 |
$9,930 |
04/30/16 |
$10,086 |
$10,174 |
$10,097 |
05/31/16 |
$10,269 |
$10,357 |
$10,281 |
06/30/16 |
$10,280 |
$10,384 |
$10,277 |
07/31/16 |
$10,828 |
$10,766 |
$10,832 |
08/31/16 |
$10,914 |
$10,782 |
$10,925 |
09/30/16 |
$11,011 |
$10,784 |
$11,022 |
10/31/16 |
$10,591 |
$10,587 |
$10,603 |
11/30/16 |
$11,441 |
$10,979 |
$11,457 |
12/31/16 |
$11,646 |
$11,196 |
$11,659 |
01/31/17 |
$11,876 |
$11,408 |
$11,890 |
02/28/17 |
$12,171 |
$11,861 |
$12,181 |
03/31/17 |
$12,149 |
$11,875 |
$12,171 |
04/30/17 |
$12,302 |
$11,997 |
$12,322 |
05/31/17 |
$12,225 |
$12,166 |
$12,240 |
06/30/17 |
$12,499 |
$12,242 |
$12,521 |
07/31/17 |
$12,630 |
$12,494 |
$12,654 |
08/31/17 |
$12,586 |
$12,532 |
$12,606 |
09/30/17 |
$13,122 |
$12,790 |
$13,143 |
10/31/17 |
$13,330 |
$13,089 |
$13,350 |
11/30/17 |
$13,713 |
$13,490 |
$13,728 |
12/31/17 |
$13,766 |
$13,640 |
$13,790 |
01/31/18 |
$14,232 |
$14,421 |
$14,242 |
02/28/18 |
$13,709 |
$13,890 |
$13,725 |
03/31/18 |
$13,800 |
$13,537 |
$13,814 |
04/30/18 |
$13,834 |
$13,589 |
$13,850 |
05/31/18 |
$14,494 |
$13,916 |
$14,508 |
06/30/18 |
$14,608 |
$14,002 |
$14,632 |
07/31/18 |
$14,824 |
$14,523 |
$14,848 |
08/31/18 |
$15,506 |
$14,996 |
$15,532 |
09/30/18 |
$15,233 |
$15,081 |
$15,262 |
10/31/18 |
$13,720 |
$14,050 |
$13,737 |
11/30/18 |
$13,993 |
$14,337 |
$14,013 |
12/31/18 |
$12,517 |
$13,042 |
$12,520 |
01/31/19 |
$13,961 |
$14,087 |
$13,967 |
02/28/19 |
$14,641 |
$14,540 |
$14,659 |
03/31/19 |
$14,508 |
$14,822 |
$14,518 |
04/30/19 |
$15,054 |
$15,422 |
$15,073 |
05/31/19 |
$13,998 |
$14,442 |
$14,012 |
06/30/19 |
$14,969 |
$15,460 |
$14,977 |
07/31/19 |
$15,200 |
$15,682 |
$15,216 |
08/31/19 |
$14,544 |
$15,434 |
$14,559 |
09/30/19 |
$14,714 |
$15,723 |
$14,717 |
10/31/19 |
$14,981 |
$16,063 |
$14,992 |
11/30/19 |
$15,685 |
$16,646 |
$15,697 |
12/31/19 |
$16,018 |
$17,149 |
$16,032 |
01/31/20 |
$15,918 |
$17,142 |
$15,936 |
02/29/20 |
$14,659 |
$15,731 |
$14,677 |
03/31/20 |
$11,551 |
$13,788 |
$11,562 |
04/30/20 |
$13,350 |
$15,555 |
$13,373 |
05/31/20 |
$14,518 |
$16,296 |
$14,549 |
06/30/20 |
$15,077 |
$16,620 |
$15,113 |
07/31/20 |
$15,947 |
$17,558 |
$15,996 |
08/31/20 |
$17,146 |
$18,820 |
$17,205 |
09/30/20 |
$16,673 |
$18,105 |
$16,735 |
10/31/20 |
$16,729 |
$17,623 |
$16,788 |
11/30/20 |
$19,758 |
$19,552 |
$19,838 |
12/31/20 |
$21,218 |
$20,304 |
$21,302 |
01/31/21 |
$21,706 |
$20,099 |
$21,785 |
02/28/21 |
$22,788 |
$20,653 |
$22,882 |
03/31/21 |
$22,765 |
$21,558 |
$22,852 |
04/30/21 |
$23,719 |
$22,708 |
$23,824 |
05/31/21 |
$23,586 |
$22,867 |
$23,688 |
06/30/21 |
$24,319 |
$23,401 |
$24,436 |
07/31/21 |
$24,012 |
$23,956 |
$24,129 |
08/31/21 |
$24,491 |
$24,685 |
$24,614 |
09/30/21 |
$23,568 |
$23,537 |
$23,682 |
10/31/21 |
$24,921 |
$25,186 |
$25,045 |
11/30/21 |
$23,605 |
$25,011 |
$23,720 |
12/31/21 |
$23,870 |
$26,132 |
$23,994 |
01/31/22 |
$21,549 |
$24,780 |
$21,661 |
02/28/22 |
$21,536 |
$24,038 |
$21,648 |
03/31/22 |
$21,709 |
$24,931 |
$21,819 |
04/30/22 |
$19,450 |
$22,757 |
$19,545 |
05/31/22 |
$19,105 |
$22,798 |
$19,202 |
06/30/22 |
$17,380 |
$20,916 |
$17,464 |
07/31/22 |
$19,202 |
$22,845 |
$19,296 |
08/31/22 |
$18,812 |
$21,913 |
$18,903 |
09/30/22 |
$16,973 |
$19,895 |
$17,051 |
10/31/22 |
$18,413 |
$21,506 |
$18,497 |
11/30/22 |
$19,042 |
$22,708 |
$19,126 |
12/31/22 |
$17,796 |
$21,399 |
$17,877 |
01/31/23 |
$19,701 |
$22,744 |
$19,789 |
02/28/23 |
$19,388 |
$22,189 |
$19,470 |
03/31/23 |
$18,851 |
$23,004 |
$18,929 |
04/30/23 |
$18,441 |
$23,363 |
$18,515 |
05/31/23 |
$18,532 |
$23,464 |
$18,604 |
06/30/23 |
$20,067 |
$25,015 |
$20,140 |
07/31/23 |
$21,238 |
$25,818 |
$21,313 |
08/31/23 |
$20,385 |
$25,407 |
$20,455 |
09/30/23 |
$19,395 |
$24,196 |
$19,460 |
10/31/23 |
$18,195 |
$23,687 |
$18,256 |
11/30/23 |
$20,196 |
$25,850 |
$20,227 |
12/31/23 |
$22,278 |
$27,025 |
$22,312 |
01/31/24 |
$21,761 |
$27,479 |
$21,792 |
02/29/24 |
$23,116 |
$28,946 |
$23,149 |
03/31/24 |
$23,890 |
$29,878 |
$23,923 |
04/30/24 |
$22,358 |
$28,657 |
$22,389 |
05/31/24 |
$23,130 |
$30,078 |
$23,161 |
06/30/24 |
$23,125 |
$31,157 |
$23,154 |
07/31/24 |
$24,549 |
$31,537 |
$24,575 |
08/31/24 |
$24,653 |
$32,302 |
$24,677 |
09/30/24 |
$25,040 |
$32,992 |
$25,066 |
10/31/24 |
$25,173 |
$32,692 |
$25,201 |
11/30/24 |
$28,125 |
$34,611 |
$28,152 |
12/31/24 |
$26,110 |
$33,786 |
$26,136 |
01/31/25 |
$27,458 |
$34,727 |
$27,485 |
02/28/25 |
$25,900 |
$34,274 |
$25,925 |
03/31/25 |
$23,921 |
$32,343 |
$23,938 |
04/30/25 |
$23,803 |
$32,124 |
$23,803 |
05/31/25 |
$25,501 |
$34,146 |
$25,499 |
06/30/25 |
$26,900 |
$35,882 |
$26,901 |
07/31/25 |
$27,484 |
$36,687 |
$27,487 |
08/31/25 |
$28,680 |
$37,431 |
$28,679 |
09/30/25 |
$29,323 |
$38,797 |
$29,320 |
10/31/25 |
$29,609 |
$39,706 |
$29,600 |
11/30/25 |
$29,606 |
$39,803 |
$29,596 |
12/31/25 |
$29,455 |
$39,827 |
$29,447 |
|
| Average Annual Return [Table Text Block] |
Name |
1 Year |
5 Years |
10 Years |
SSMHX |
12.81% |
6.78% |
11.41% |
S&P 500 Index |
17.88% |
14.42% |
14.82% |
Russell Small Cap Completeness Index |
12.67% |
6.69% |
11.40% | |
| Updated Performance Information Location [Text Block] |
Updated performance information is available by calling 1-800-647-7327 or visiting our website at www.ssga.com.
|
| AssetsNet |
$ 2,584,665,700
|
| Holdings Count | Holding |
2,476
|
| Advisory Fees Paid, Amount |
$ 0
|
| InvestmentCompanyPortfolioTurnover |
26.00%
|
| Additional Fund Statistics [Text Block] |
Key Fund Statistics as of 12/31/2025- Total Net Assets$2,584,665,700
- Number of Portfolio Holdings2,476
- Portfolio Turnover Rate26%
- Total Advisory Fees Paid$0
|
| Holdings [Text Block] |
Industries |
% |
Biotechnology |
6.7% |
Banks |
6.6% |
Software |
6.4% |
Semiconductors & Semiconductor Equipment |
3.6% |
Machinery |
3.4% |
Capital Markets |
3.2% |
IT Services |
3.1% |
Insurance |
3.0% |
Hotels, Restaurants & Leisure |
2.9% |
Aerospace & Defense |
2.9% | |
| Largest Holdings [Text Block] |
Holdings |
% |
Spotify Technology SA |
1.2% |
Marvell Technology, Inc. |
1.0% |
Snowflake, Inc. |
0.9% |
Cloudflare, Inc., Class A |
0.8% |
Vertiv Holdings Co., Class A |
0.8% |
NU Holdings Ltd., Class A |
0.7% |
Alnylam Pharmaceuticals, Inc. |
0.7% |
ROBLOX Corp., Class A |
0.7% |
Anglogold Ashanti PLC |
0.6% |
Ferguson Enterprises, Inc. |
0.6% | |
| Material Fund Change [Text Block] |
|
| C000232295 |
|
| Shareholder Report [Line Items] |
|
| Fund Name |
State Street Target Retirement 2025 Fund
|
| Class Name |
Class R3
|
| Trading Symbol |
SSAHX
|
| Annual or Semi-Annual Statement [Text Block] |
This annual shareholder report contains important information about the State Street Target Retirement 2025 Fund (the "Fund") for the period of January 1, 2025 through December 31, 2025.
|
| Additional Information [Text Block] |
You can find additional information about the Fund, including the Prospectus, Statement of Additional Information, financial statements and other information at www.ssga.com/us/en/institutional/fund-finder?tab=documents&type=mf. You can also request this information about the Fund by contacting us at 1-800-647-7327.
|
| Additional Information Phone Number |
1-800-647-7327
|
| Additional Information Website |
www.ssga.com/us/en/institutional/fund-finder?tab=documents&type=mf
|
| Expenses [Text Block] |
What were the Fund costs for the last year? (based on a hypothetical $10,000 Investment)
Class Name |
Costs of a $10,000 investment |
Costs paid as a percentage of a $10,000 investment |
Class R3 |
$51 |
0.48% | Does not include expenses of the Underlying Funds in which the Fund invests. |
| Expenses Paid, Amount |
$ 51
|
| Expense Ratio, Percent |
0.48%
|
| Factors Affecting Performance [Text Block] |
How did the Fund perform last year and what affected its performance?The main driver of the Fund’s performance on an absolute basis during the reporting period was its position in the State Street Global Equity ex-US Index Portfolio which returned approximately 32.7% for the reporting period. On an individual security level, the top positive contributors to the Fund’s performance on an absolute basis during the reporting period were the State Street Global Equity ex-US Index Portfolio, State Street Equity 500 Index II Portfolio, and the State Street Aggregate Bond Index Portfolio. There were no negative contributors to the Fund’s performance on an absolute basis during the reporting period. |
| Performance Past Does Not Indicate Future [Text] |
The Fund’s past performance is not necessarily an indication of how the Fund will perform in the future. The returns do not reflect the deduction of taxes that a shareholder would pay on Fund distributions or on the redemption or sale of Fund shares.
|
| Line Graph [Table Text Block] |

|
SSAHX |
S&P 500 Index |
State Street Target Retirement 2025 Composite Index |
12/31/15 |
$10,000 |
$10,000 |
$10,000 |
01/31/16 |
$9,678 |
$9,504 |
$9,647 |
02/29/16 |
$9,674 |
$9,491 |
$9,666 |
03/31/16 |
$10,172 |
$10,135 |
$10,184 |
04/30/16 |
$10,291 |
$10,174 |
$10,302 |
05/31/16 |
$10,327 |
$10,357 |
$10,341 |
06/30/16 |
$10,415 |
$10,384 |
$10,406 |
07/31/16 |
$10,718 |
$10,766 |
$10,761 |
08/31/16 |
$10,744 |
$10,782 |
$10,788 |
09/30/16 |
$10,780 |
$10,784 |
$10,820 |
10/31/16 |
$10,572 |
$10,587 |
$10,626 |
11/30/16 |
$10,588 |
$10,979 |
$10,649 |
12/31/16 |
$10,747 |
$11,196 |
$10,814 |
01/31/17 |
$10,929 |
$11,408 |
$11,012 |
02/28/17 |
$11,174 |
$11,861 |
$11,259 |
03/31/17 |
$11,232 |
$11,875 |
$11,325 |
04/30/17 |
$11,372 |
$11,997 |
$11,471 |
05/31/17 |
$11,534 |
$12,166 |
$11,646 |
06/30/17 |
$11,581 |
$12,242 |
$11,697 |
07/31/17 |
$11,783 |
$12,494 |
$11,904 |
08/31/17 |
$11,851 |
$12,532 |
$11,980 |
09/30/17 |
$11,991 |
$12,790 |
$12,127 |
10/31/17 |
$12,151 |
$13,089 |
$12,290 |
11/30/17 |
$12,322 |
$13,490 |
$12,472 |
12/31/17 |
$12,460 |
$13,640 |
$12,624 |
01/31/18 |
$12,826 |
$14,421 |
$12,997 |
02/28/18 |
$12,397 |
$13,890 |
$12,581 |
03/31/18 |
$12,317 |
$13,537 |
$12,477 |
04/30/18 |
$12,334 |
$13,589 |
$12,518 |
05/31/18 |
$12,445 |
$13,916 |
$12,628 |
06/30/18 |
$12,429 |
$14,002 |
$12,617 |
07/31/18 |
$12,646 |
$14,523 |
$12,842 |
08/31/18 |
$12,799 |
$14,996 |
$12,999 |
09/30/18 |
$12,762 |
$15,081 |
$12,968 |
10/31/18 |
$12,081 |
$14,050 |
$12,276 |
11/30/18 |
$12,224 |
$14,337 |
$12,431 |
12/31/18 |
$11,730 |
$13,042 |
$11,924 |
01/31/19 |
$12,415 |
$14,087 |
$12,624 |
02/28/19 |
$12,632 |
$14,540 |
$12,858 |
03/31/19 |
$12,827 |
$14,822 |
$13,056 |
04/30/19 |
$13,088 |
$15,422 |
$13,329 |
05/31/19 |
$12,705 |
$14,442 |
$12,936 |
06/30/19 |
$13,265 |
$15,460 |
$13,514 |
07/31/19 |
$13,293 |
$15,682 |
$13,568 |
08/31/19 |
$13,287 |
$15,434 |
$13,554 |
09/30/19 |
$13,404 |
$15,723 |
$13,670 |
10/31/19 |
$13,597 |
$16,063 |
$13,891 |
11/30/19 |
$13,813 |
$16,646 |
$14,114 |
12/31/19 |
$14,080 |
$17,149 |
$14,402 |
01/31/20 |
$14,098 |
$17,142 |
$14,444 |
02/29/20 |
$13,550 |
$15,731 |
$13,855 |
03/31/20 |
$12,307 |
$13,788 |
$12,627 |
04/30/20 |
$13,244 |
$15,555 |
$13,574 |
05/31/20 |
$13,674 |
$16,296 |
$14,005 |
06/30/20 |
$13,963 |
$16,620 |
$14,304 |
07/31/20 |
$14,510 |
$17,558 |
$14,870 |
08/31/20 |
$14,974 |
$18,820 |
$15,375 |
09/30/20 |
$14,686 |
$18,105 |
$15,071 |
10/31/20 |
$14,456 |
$17,623 |
$14,843 |
11/30/20 |
$15,589 |
$19,552 |
$16,029 |
12/31/20 |
$16,089 |
$20,304 |
$16,542 |
01/31/21 |
$16,021 |
$20,099 |
$16,490 |
02/28/21 |
$16,174 |
$20,653 |
$16,664 |
03/31/21 |
$16,364 |
$21,558 |
$16,860 |
04/30/21 |
$16,848 |
$22,708 |
$17,364 |
05/31/21 |
$17,013 |
$22,867 |
$17,549 |
06/30/21 |
$17,190 |
$23,401 |
$17,727 |
07/31/21 |
$17,354 |
$23,956 |
$17,910 |
08/31/21 |
$17,567 |
$24,685 |
$18,147 |
09/30/21 |
$17,082 |
$23,537 |
$17,672 |
10/31/21 |
$17,589 |
$25,186 |
$18,183 |
11/30/21 |
$17,325 |
$25,011 |
$17,923 |
12/31/21 |
$17,740 |
$26,132 |
$18,363 |
01/31/22 |
$17,093 |
$24,780 |
$17,663 |
02/28/22 |
$16,813 |
$24,038 |
$17,411 |
03/31/22 |
$16,813 |
$24,931 |
$17,438 |
04/30/22 |
$15,862 |
$22,757 |
$16,466 |
05/31/22 |
$15,901 |
$22,798 |
$16,466 |
06/30/22 |
$14,976 |
$20,916 |
$15,512 |
07/31/22 |
$15,784 |
$22,845 |
$16,352 |
08/31/22 |
$15,236 |
$21,913 |
$15,826 |
09/30/22 |
$14,102 |
$19,895 |
$14,660 |
10/31/22 |
$14,559 |
$21,506 |
$15,122 |
11/30/22 |
$15,367 |
$22,708 |
$15,922 |
12/31/22 |
$14,959 |
$21,399 |
$15,548 |
01/31/23 |
$15,748 |
$22,744 |
$16,359 |
02/28/23 |
$15,346 |
$22,189 |
$15,962 |
03/31/23 |
$15,692 |
$23,004 |
$16,306 |
04/30/23 |
$15,817 |
$23,363 |
$16,449 |
05/31/23 |
$15,595 |
$23,464 |
$16,246 |
06/30/23 |
$16,066 |
$25,015 |
$16,721 |
07/31/23 |
$16,384 |
$25,818 |
$17,076 |
08/31/23 |
$16,094 |
$25,407 |
$16,779 |
09/30/23 |
$15,582 |
$24,196 |
$16,257 |
10/31/23 |
$15,236 |
$23,687 |
$15,891 |
11/30/23 |
$16,204 |
$25,850 |
$16,914 |
12/31/23 |
$16,916 |
$27,025 |
$17,672 |
01/31/24 |
$16,873 |
$27,479 |
$17,651 |
02/29/24 |
$17,132 |
$28,946 |
$17,912 |
03/31/24 |
$17,464 |
$29,878 |
$18,276 |
04/30/24 |
$16,988 |
$28,657 |
$17,794 |
05/31/24 |
$17,464 |
$30,078 |
$18,267 |
06/30/24 |
$17,651 |
$31,157 |
$18,492 |
07/31/24 |
$18,040 |
$31,537 |
$18,903 |
08/31/24 |
$18,372 |
$32,302 |
$19,266 |
09/30/24 |
$18,703 |
$32,992 |
$19,614 |
10/31/24 |
$18,300 |
$32,692 |
$19,208 |
11/30/24 |
$18,732 |
$34,611 |
$19,641 |
12/31/24 |
$18,316 |
$33,786 |
$19,235 |
01/31/25 |
$18,668 |
$34,727 |
$19,616 |
02/28/25 |
$18,806 |
$34,274 |
$19,737 |
03/31/25 |
$18,515 |
$32,343 |
$19,431 |
04/30/25 |
$18,576 |
$32,124 |
$19,523 |
05/31/25 |
$18,989 |
$34,146 |
$19,960 |
06/30/25 |
$19,464 |
$35,882 |
$20,469 |
07/31/25 |
$19,525 |
$36,687 |
$20,570 |
08/31/25 |
$19,953 |
$37,431 |
$20,995 |
09/30/25 |
$20,290 |
$38,797 |
$21,359 |
10/31/25 |
$20,474 |
$39,706 |
$21,565 |
11/30/25 |
$20,581 |
$39,803 |
$21,680 |
12/31/25 |
$20,638 |
$39,827 |
$21,761 |
|
| Average Annual Return [Table Text Block] |
Name |
1 Year |
5 Years |
10 Years |
SSAHXFootnote Reference(1) |
12.68% |
5.11% |
7.51% |
S&P 500 Index |
17.88% |
14.42% |
14.82% |
State Street Target Retirement 2025 Composite Index |
13.13% |
5.64% |
8.09% | |
| Updated Performance Information Location [Text Block] |
Updated performance information is available by calling 1-800-647-7327 or visiting our website at www.ssga.com.
|
| AssetsNet |
$ 1,914,120,399
|
| Holdings Count | Holding |
12
|
| Advisory Fees Paid, Amount |
$ 0
|
| InvestmentCompanyPortfolioTurnover |
18.00%
|
| Additional Fund Statistics [Text Block] |
Key Fund Statistics as of 12/31/2025- Total Net Assets$1,914,120,399
- Number of Portfolio Holdings12
- Portfolio Turnover Rate18%
- Total Advisory Fees Paid$0
|
| Holdings [Text Block] |
Asset Types |
% |
Domestic Fixed Income |
40.5% |
Domestic Equity |
22.4% |
Inflation Linked |
18.1% |
International Equity |
14.2% |
Real Estate |
5.0% |
Short-Term Investments |
1.4% | |
| Largest Holdings [Text Block] |
Holdings |
% |
State Street Aggregate Bond Index Portfolio |
20.9% |
State Street Equity 500 Index II Portfolio |
19.8% |
State Street SPDR Bloomberg 1-10 Year TIPS ETF |
18.1% |
State Street Global All Cap Equity ex-U.S. Index Portfolio |
14.2% |
State Street SPDR Bloomberg High Yield Bond ETF |
7.1% |
State Street SPDR Portfolio Short Term Treasury ETF |
7.0% |
SPDR Dow Jones Global Real Estate ETF |
5.0% |
SPDR Bloomberg Enhanced Roll Yield Commodity Strategy No. K-1 ETF |
3.5% |
State Street Small/Mid Cap Equity Index Portfolio |
2.5% |
State Street SPDR Portfolio Short Term Corporate Bond ETF |
1.8% | |
| Material Fund Change [Text Block] |
|
| C000143868 |
|
| Shareholder Report [Line Items] |
|
| Fund Name |
State Street Target Retirement 2025 Fund
|
| Class Name |
Class I
|
| Trading Symbol |
SSBRX
|
| Annual or Semi-Annual Statement [Text Block] |
This annual shareholder report contains important information about the State Street Target Retirement 2025 Fund (the "Fund") for the period of January 1, 2025 through December 31, 2025.
|
| Additional Information [Text Block] |
You can find additional information about the Fund, including the Prospectus, Statement of Additional Information, financial statements and other information at www.ssga.com/us/en/institutional/fund-finder?tab=documents&type=mf. You can also request this information about the Fund by contacting us at 1-800-647-7327.
|
| Additional Information Phone Number |
1-800-647-7327
|
| Additional Information Website |
www.ssga.com/us/en/institutional/fund-finder?tab=documents&type=mf
|
| Expenses [Text Block] |
What were the Fund costs for the last year? (based on a hypothetical $10,000 Investment)
Class Name |
Costs of a $10,000 investment |
Costs paid as a percentage of a $10,000 investment |
Class I |
$13 |
0.12% | Does not include expenses of the Underlying Funds in which the Fund invests. |
| Expenses Paid, Amount |
$ 13
|
| Expense Ratio, Percent |
0.12%
|
| Factors Affecting Performance [Text Block] |
How did the Fund perform last year and what affected its performance?The main driver of the Fund’s performance on an absolute basis during the reporting period was its position in the State Street Global Equity ex-US Index Portfolio which returned approximately 32.7% for the reporting period. On an individual security level, the top positive contributors to the Fund’s performance on an absolute basis during the reporting period were the State Street Global Equity ex-US Index Portfolio, State Street Equity 500 Index II Portfolio, and the State Street Aggregate Bond Index Portfolio. There were no negative contributors to the Fund’s performance on an absolute basis during the reporting period. |
| Performance Past Does Not Indicate Future [Text] |
The Fund’s past performance is not necessarily an indication of how the Fund will perform in the future. The returns do not reflect the deduction of taxes that a shareholder would pay on Fund distributions or on the redemption or sale of Fund shares.
|
| Line Graph [Table Text Block] |
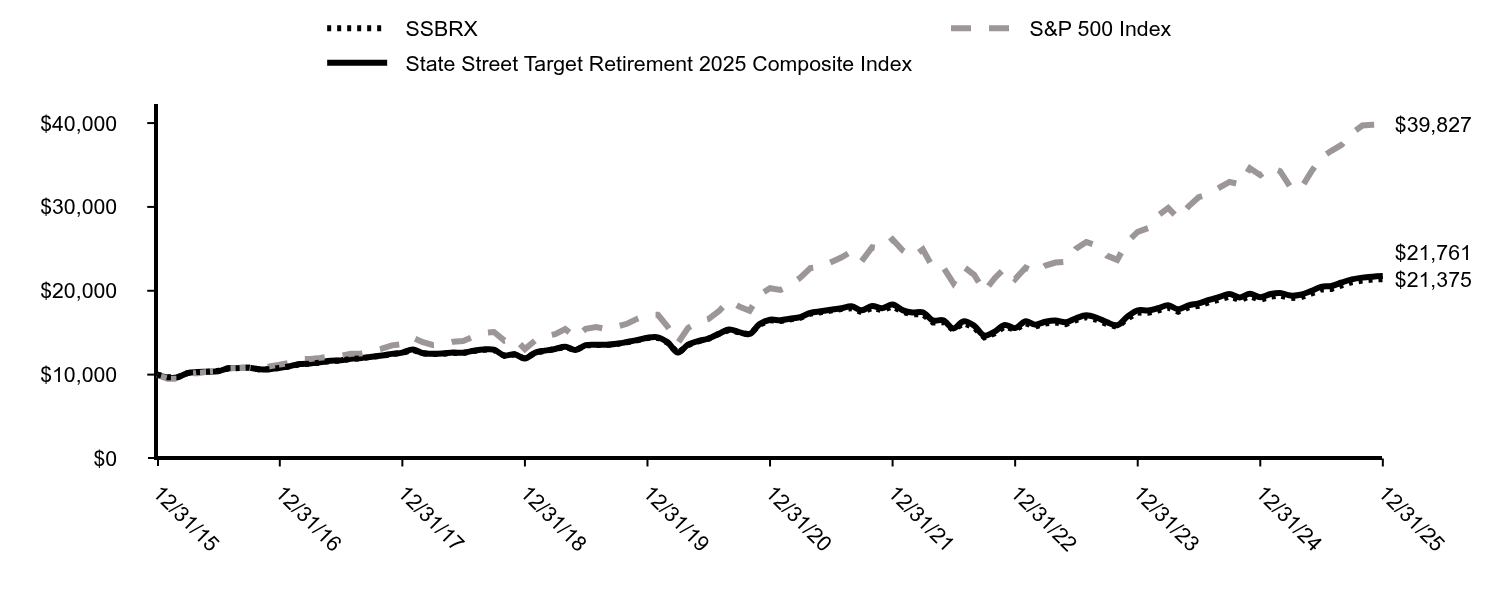
|
SSBRX |
S&P 500 Index |
State Street Target Retirement 2025 Composite Index |
12/31/15 |
$10,000 |
$10,000 |
$10,000 |
01/31/16 |
$9,682 |
$9,504 |
$9,647 |
02/29/16 |
$9,682 |
$9,491 |
$9,666 |
03/31/16 |
$10,195 |
$10,135 |
$10,184 |
04/30/16 |
$10,318 |
$10,174 |
$10,302 |
05/31/16 |
$10,349 |
$10,357 |
$10,341 |
06/30/16 |
$10,441 |
$10,384 |
$10,406 |
07/31/16 |
$10,760 |
$10,766 |
$10,761 |
08/31/16 |
$10,780 |
$10,782 |
$10,788 |
09/30/16 |
$10,832 |
$10,784 |
$10,820 |
10/31/16 |
$10,616 |
$10,587 |
$10,626 |
11/30/16 |
$10,637 |
$10,979 |
$10,649 |
12/31/16 |
$10,801 |
$11,196 |
$10,814 |
01/31/17 |
$10,989 |
$11,408 |
$11,012 |
02/28/17 |
$11,240 |
$11,861 |
$11,259 |
03/31/17 |
$11,303 |
$11,875 |
$11,325 |
04/30/17 |
$11,439 |
$11,997 |
$11,471 |
05/31/17 |
$11,616 |
$12,166 |
$11,646 |
06/30/17 |
$11,669 |
$12,242 |
$11,697 |
07/31/17 |
$11,878 |
$12,494 |
$11,904 |
08/31/17 |
$11,951 |
$12,532 |
$11,980 |
09/30/17 |
$12,097 |
$12,790 |
$12,127 |
10/31/17 |
$12,254 |
$13,089 |
$12,290 |
11/30/17 |
$12,442 |
$13,490 |
$12,472 |
12/31/17 |
$12,587 |
$13,640 |
$12,624 |
01/31/18 |
$12,952 |
$14,421 |
$12,997 |
02/28/18 |
$12,533 |
$13,890 |
$12,581 |
03/31/18 |
$12,458 |
$13,537 |
$12,477 |
04/30/18 |
$12,469 |
$13,589 |
$12,518 |
05/31/18 |
$12,587 |
$13,916 |
$12,628 |
06/30/18 |
$12,576 |
$14,002 |
$12,617 |
07/31/18 |
$12,812 |
$14,523 |
$12,842 |
08/31/18 |
$12,962 |
$14,996 |
$12,999 |
09/30/18 |
$12,930 |
$15,081 |
$12,968 |
10/31/18 |
$12,244 |
$14,050 |
$12,276 |
11/30/18 |
$12,405 |
$14,337 |
$12,431 |
12/31/18 |
$11,897 |
$13,042 |
$11,924 |
01/31/19 |
$12,609 |
$14,087 |
$12,624 |
02/28/19 |
$12,835 |
$14,540 |
$12,858 |
03/31/19 |
$13,038 |
$14,822 |
$13,056 |
04/30/19 |
$13,309 |
$15,422 |
$13,329 |
05/31/19 |
$12,914 |
$14,442 |
$12,936 |
06/30/19 |
$13,490 |
$15,460 |
$13,514 |
07/31/19 |
$13,524 |
$15,682 |
$13,568 |
08/31/19 |
$13,524 |
$15,434 |
$13,554 |
09/30/19 |
$13,648 |
$15,723 |
$13,670 |
10/31/19 |
$13,863 |
$16,063 |
$13,891 |
11/30/19 |
$14,078 |
$16,646 |
$14,114 |
12/31/19 |
$14,366 |
$17,149 |
$14,402 |
01/31/20 |
$14,378 |
$17,142 |
$14,444 |
02/29/20 |
$13,825 |
$15,731 |
$13,855 |
03/31/20 |
$12,572 |
$13,788 |
$12,627 |
04/30/20 |
$13,523 |
$15,555 |
$13,574 |
05/31/20 |
$13,969 |
$16,296 |
$14,005 |
06/30/20 |
$14,270 |
$16,620 |
$14,304 |
07/31/20 |
$14,836 |
$17,558 |
$14,870 |
08/31/20 |
$15,318 |
$18,820 |
$15,375 |
09/30/20 |
$15,029 |
$18,105 |
$15,071 |
10/31/20 |
$14,800 |
$17,623 |
$14,843 |
11/30/20 |
$15,956 |
$19,552 |
$16,029 |
12/31/20 |
$16,473 |
$20,304 |
$16,542 |
01/31/21 |
$16,397 |
$20,099 |
$16,490 |
02/28/21 |
$16,574 |
$20,653 |
$16,664 |
03/31/21 |
$16,776 |
$21,558 |
$16,860 |
04/30/21 |
$17,268 |
$22,708 |
$17,364 |
05/31/21 |
$17,444 |
$22,867 |
$17,549 |
06/30/21 |
$17,633 |
$23,401 |
$17,727 |
07/31/21 |
$17,810 |
$23,956 |
$17,910 |
08/31/21 |
$17,924 |
$24,685 |
$18,147 |
09/30/21 |
$17,444 |
$23,537 |
$17,672 |
10/31/21 |
$17,961 |
$25,186 |
$18,183 |
11/30/21 |
$17,697 |
$25,011 |
$17,923 |
12/31/21 |
$18,125 |
$26,132 |
$18,363 |
01/31/22 |
$17,467 |
$24,780 |
$17,663 |
02/28/22 |
$17,185 |
$24,038 |
$17,411 |
03/31/22 |
$17,185 |
$24,931 |
$17,438 |
04/30/22 |
$16,218 |
$22,757 |
$16,466 |
05/31/22 |
$16,259 |
$22,798 |
$16,466 |
06/30/22 |
$15,319 |
$20,916 |
$15,512 |
07/31/22 |
$16,151 |
$22,845 |
$16,352 |
08/31/22 |
$15,587 |
$21,913 |
$15,826 |
09/30/22 |
$14,446 |
$19,895 |
$14,660 |
10/31/22 |
$14,916 |
$21,506 |
$15,122 |
11/30/22 |
$15,749 |
$22,708 |
$15,922 |
12/31/22 |
$15,321 |
$21,399 |
$15,548 |
01/31/23 |
$16,137 |
$22,744 |
$16,359 |
02/28/23 |
$15,736 |
$22,189 |
$15,962 |
03/31/23 |
$16,094 |
$23,004 |
$16,306 |
04/30/23 |
$16,223 |
$23,363 |
$16,449 |
05/31/23 |
$16,023 |
$23,464 |
$16,246 |
06/30/23 |
$16,495 |
$25,015 |
$16,721 |
07/31/23 |
$16,839 |
$25,818 |
$17,076 |
08/31/23 |
$16,538 |
$25,407 |
$16,779 |
09/30/23 |
$16,023 |
$24,196 |
$16,257 |
10/31/23 |
$15,679 |
$23,687 |
$15,891 |
11/30/23 |
$16,667 |
$25,850 |
$16,914 |
12/31/23 |
$17,402 |
$27,025 |
$17,672 |
01/31/24 |
$17,372 |
$27,479 |
$17,651 |
02/29/24 |
$17,642 |
$28,946 |
$17,912 |
03/31/24 |
$17,986 |
$29,878 |
$18,276 |
04/30/24 |
$17,507 |
$28,657 |
$17,794 |
05/31/24 |
$18,001 |
$30,078 |
$18,267 |
06/30/24 |
$18,211 |
$31,157 |
$18,492 |
07/31/24 |
$18,615 |
$31,537 |
$18,903 |
08/31/24 |
$18,959 |
$32,302 |
$19,266 |
09/30/24 |
$19,304 |
$32,992 |
$19,614 |
10/31/24 |
$18,885 |
$32,692 |
$19,208 |
11/30/24 |
$19,334 |
$34,611 |
$19,641 |
12/31/24 |
$18,926 |
$33,786 |
$19,235 |
01/31/25 |
$19,293 |
$34,727 |
$19,616 |
02/28/25 |
$19,437 |
$34,274 |
$19,737 |
03/31/25 |
$19,134 |
$32,343 |
$19,431 |
04/30/25 |
$19,214 |
$32,124 |
$19,523 |
05/31/25 |
$19,645 |
$34,146 |
$19,960 |
06/30/25 |
$20,140 |
$35,882 |
$20,469 |
07/31/25 |
$20,220 |
$36,687 |
$20,570 |
08/31/25 |
$20,651 |
$37,431 |
$20,995 |
09/30/25 |
$21,018 |
$38,797 |
$21,359 |
10/31/25 |
$21,210 |
$39,706 |
$21,565 |
11/30/25 |
$21,338 |
$39,803 |
$21,680 |
12/31/25 |
$21,375 |
$39,827 |
$21,761 |
|
| Average Annual Return [Table Text Block] |
Name |
1 Year |
5 Years |
10 Years |
SSBRX |
12.94% |
5.35% |
7.89% |
S&P 500 Index |
17.88% |
14.42% |
14.82% |
State Street Target Retirement 2025 Composite Index |
13.13% |
5.64% |
8.09% | |
| Updated Performance Information Location [Text Block] |
Updated performance information is available by calling 1-800-647-7327 or visiting our website at www.ssga.com.
|
| AssetsNet |
$ 1,914,120,399
|
| Holdings Count | Holding |
12
|
| Advisory Fees Paid, Amount |
$ 0
|
| InvestmentCompanyPortfolioTurnover |
18.00%
|
| Additional Fund Statistics [Text Block] |
Key Fund Statistics as of 12/31/2025- Total Net Assets$1,914,120,399
- Number of Portfolio Holdings12
- Portfolio Turnover Rate18%
- Total Advisory Fees Paid$0
|
| Holdings [Text Block] |
Asset Types |
% |
Domestic Fixed Income |
40.5% |
Domestic Equity |
22.4% |
Inflation Linked |
18.1% |
International Equity |
14.2% |
Real Estate |
5.0% |
Short-Term Investments |
1.4% | |
| Largest Holdings [Text Block] |
Holdings |
% |
State Street Aggregate Bond Index Portfolio |
20.9% |
State Street Equity 500 Index II Portfolio |
19.8% |
State Street SPDR Bloomberg 1-10 Year TIPS ETF |
18.1% |
State Street Global All Cap Equity ex-U.S. Index Portfolio |
14.2% |
State Street SPDR Bloomberg High Yield Bond ETF |
7.1% |
State Street SPDR Portfolio Short Term Treasury ETF |
7.0% |
SPDR Dow Jones Global Real Estate ETF |
5.0% |
SPDR Bloomberg Enhanced Roll Yield Commodity Strategy No. K-1 ETF |
3.5% |
State Street Small/Mid Cap Equity Index Portfolio |
2.5% |
State Street SPDR Portfolio Short Term Corporate Bond ETF |
1.8% | |
| Material Fund Change [Text Block] |
|
| C000143869 |
|
| Shareholder Report [Line Items] |
|
| Fund Name |
State Street Target Retirement 2025 Fund
|
| Class Name |
Class K
|
| Trading Symbol |
SSBSX
|
| Annual or Semi-Annual Statement [Text Block] |
This annual shareholder report contains important information about the State Street Target Retirement 2025 Fund (the "Fund") for the period of January 1, 2025 through December 31, 2025.
|
| Additional Information [Text Block] |
You can find additional information about the Fund, including the Prospectus, Statement of Additional Information, financial statements and other information at www.ssga.com/us/en/institutional/fund-finder?tab=documents&type=mf. You can also request this information about the Fund by contacting us at 1-800-647-7327.
|
| Additional Information Phone Number |
1-800-647-7327
|
| Additional Information Website |
www.ssga.com/us/en/institutional/fund-finder?tab=documents&type=mf
|
| Expenses [Text Block] |
What were the Fund costs for the last year? (based on a hypothetical $10,000 Investment)
Class Name |
Costs of a $10,000 investment |
Costs paid as a percentage of a $10,000 investment |
Class K |
$0 |
0.00% | Due to the Fund waiving acquired fund fees, the waiver exceeded total fund expenses. Does not include expenses of the Underlying Funds in which the Fund invests. |
| Expenses Paid, Amount |
$ 0
|
| Expense Ratio, Percent |
0.00%
|
| Factors Affecting Performance [Text Block] |
How did the Fund perform last year and what affected its performance?The main driver of the Fund’s performance on an absolute basis during the reporting period was its position in the State Street Global Equity ex-US Index Portfolio which returned approximately 32.7% for the reporting period. On an individual security level, the top positive contributors to the Fund’s performance on an absolute basis during the reporting period were the State Street Global Equity ex-US Index Portfolio, State Street Equity 500 Index II Portfolio, and the State Street Aggregate Bond Index Portfolio. There were no negative contributors to the Fund’s performance on an absolute basis during the reporting period. |
| Performance Past Does Not Indicate Future [Text] |
The Fund’s past performance is not necessarily an indication of how the Fund will perform in the future. The returns do not reflect the deduction of taxes that a shareholder would pay on Fund distributions or on the redemption or sale of Fund shares.
|
| Line Graph [Table Text Block] |
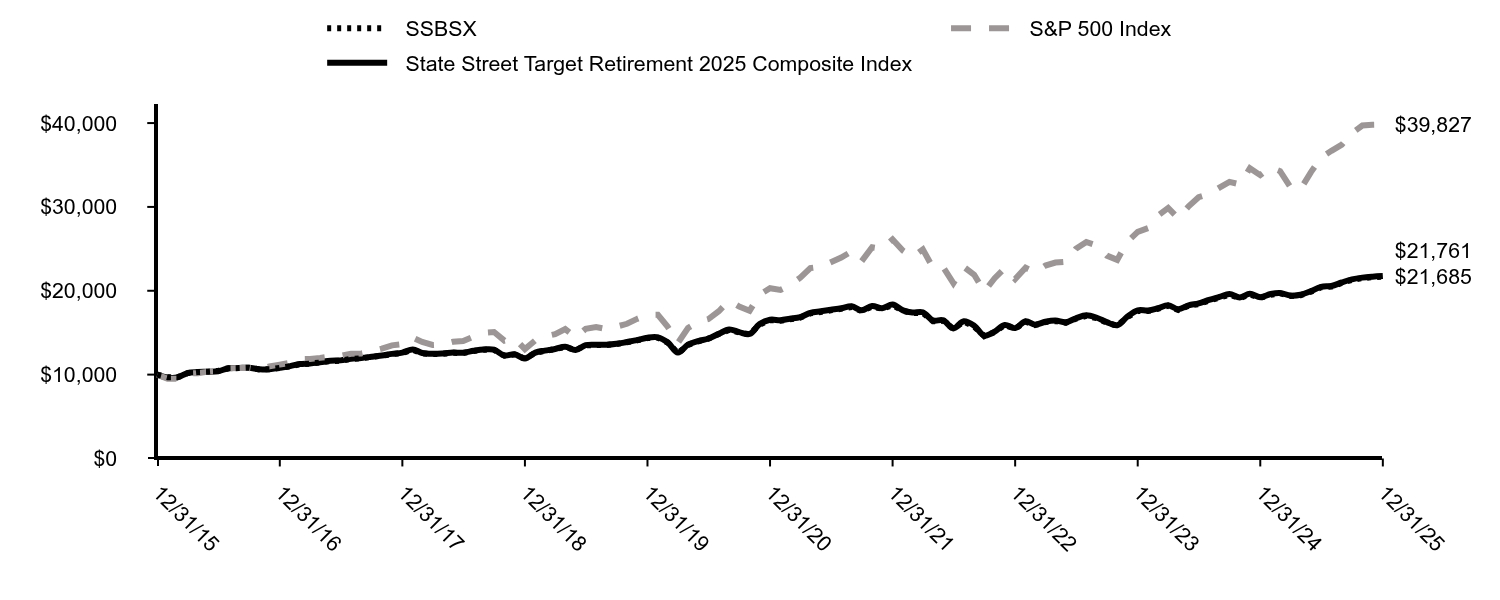
|
SSBSX |
S&P 500 Index |
State Street Target Retirement 2025 Composite Index |
12/31/15 |
$10,000 |
$10,000 |
$10,000 |
01/31/16 |
$9,682 |
$9,504 |
$9,647 |
02/29/16 |
$9,682 |
$9,491 |
$9,666 |
03/31/16 |
$10,185 |
$10,135 |
$10,184 |
04/30/16 |
$10,308 |
$10,174 |
$10,302 |
05/31/16 |
$10,349 |
$10,357 |
$10,341 |
06/30/16 |
$10,441 |
$10,384 |
$10,406 |
07/31/16 |
$10,749 |
$10,766 |
$10,761 |
08/31/16 |
$10,779 |
$10,782 |
$10,788 |
09/30/16 |
$10,821 |
$10,784 |
$10,820 |
10/31/16 |
$10,615 |
$10,587 |
$10,626 |
11/30/16 |
$10,636 |
$10,979 |
$10,649 |
12/31/16 |
$10,800 |
$11,196 |
$10,814 |
01/31/17 |
$10,988 |
$11,408 |
$11,012 |
02/28/17 |
$11,239 |
$11,861 |
$11,259 |
03/31/17 |
$11,301 |
$11,875 |
$11,325 |
04/30/17 |
$11,448 |
$11,997 |
$11,471 |
05/31/17 |
$11,615 |
$12,166 |
$11,646 |
06/30/17 |
$11,667 |
$12,242 |
$11,697 |
07/31/17 |
$11,876 |
$12,494 |
$11,904 |
08/31/17 |
$11,949 |
$12,532 |
$11,980 |
09/30/17 |
$12,095 |
$12,790 |
$12,127 |
10/31/17 |
$12,262 |
$13,089 |
$12,290 |
11/30/17 |
$12,440 |
$13,490 |
$12,472 |
12/31/17 |
$12,584 |
$13,640 |
$12,624 |
01/31/18 |
$12,959 |
$14,421 |
$12,997 |
02/28/18 |
$12,531 |
$13,890 |
$12,581 |
03/31/18 |
$12,456 |
$13,537 |
$12,477 |
04/30/18 |
$12,477 |
$13,589 |
$12,518 |
05/31/18 |
$12,595 |
$13,916 |
$12,628 |
06/30/18 |
$12,584 |
$14,002 |
$12,617 |
07/31/18 |
$12,809 |
$14,523 |
$12,842 |
08/31/18 |
$12,970 |
$14,996 |
$12,999 |
09/30/18 |
$12,938 |
$15,081 |
$12,968 |
10/31/18 |
$12,252 |
$14,050 |
$12,276 |
11/30/18 |
$12,402 |
$14,337 |
$12,431 |
12/31/18 |
$11,907 |
$13,042 |
$11,924 |
01/31/19 |
$12,607 |
$14,087 |
$12,624 |
02/28/19 |
$12,832 |
$14,540 |
$12,858 |
03/31/19 |
$13,036 |
$14,822 |
$13,056 |
04/30/19 |
$13,306 |
$15,422 |
$13,329 |
05/31/19 |
$12,923 |
$14,442 |
$12,936 |
06/30/19 |
$13,498 |
$15,460 |
$13,514 |
07/31/19 |
$13,532 |
$15,682 |
$13,568 |
08/31/19 |
$13,532 |
$15,434 |
$13,554 |
09/30/19 |
$13,656 |
$15,723 |
$13,670 |
10/31/19 |
$13,859 |
$16,063 |
$13,891 |
11/30/19 |
$14,085 |
$16,646 |
$14,114 |
12/31/19 |
$14,363 |
$17,149 |
$14,402 |
01/31/20 |
$14,387 |
$17,142 |
$14,444 |
02/29/20 |
$13,834 |
$15,731 |
$13,855 |
03/31/20 |
$12,571 |
$13,788 |
$12,627 |
04/30/20 |
$13,533 |
$15,555 |
$13,574 |
05/31/20 |
$13,978 |
$16,296 |
$14,005 |
06/30/20 |
$14,279 |
$16,620 |
$14,304 |
07/31/20 |
$14,844 |
$17,558 |
$14,870 |
08/31/20 |
$15,326 |
$18,820 |
$15,375 |
09/30/20 |
$15,037 |
$18,105 |
$15,071 |
10/31/20 |
$14,808 |
$17,623 |
$14,843 |
11/30/20 |
$15,975 |
$19,552 |
$16,029 |
12/31/20 |
$16,495 |
$20,304 |
$16,542 |
01/31/21 |
$16,432 |
$20,099 |
$16,490 |
02/28/21 |
$16,596 |
$20,653 |
$16,664 |
03/31/21 |
$16,797 |
$21,558 |
$16,860 |
04/30/21 |
$17,301 |
$22,708 |
$17,364 |
05/31/21 |
$17,478 |
$22,867 |
$17,549 |
06/30/21 |
$17,667 |
$23,401 |
$17,727 |
07/31/21 |
$17,843 |
$23,956 |
$17,910 |
08/31/21 |
$18,070 |
$24,685 |
$18,147 |
09/30/21 |
$17,579 |
$23,537 |
$17,672 |
10/31/21 |
$18,108 |
$25,186 |
$18,183 |
11/30/21 |
$17,843 |
$25,011 |
$17,923 |
12/31/21 |
$18,278 |
$26,132 |
$18,363 |
01/31/22 |
$17,619 |
$24,780 |
$17,663 |
02/28/22 |
$17,337 |
$24,038 |
$17,411 |
03/31/22 |
$17,351 |
$24,931 |
$17,438 |
04/30/22 |
$16,370 |
$22,757 |
$16,466 |
05/31/22 |
$16,410 |
$22,798 |
$16,466 |
06/30/22 |
$15,456 |
$20,916 |
$15,512 |
07/31/22 |
$16,316 |
$22,845 |
$16,352 |
08/31/22 |
$15,738 |
$21,913 |
$15,826 |
09/30/22 |
$14,582 |
$19,895 |
$14,660 |
10/31/22 |
$15,066 |
$21,506 |
$15,122 |
11/30/22 |
$15,913 |
$22,708 |
$15,922 |
12/31/22 |
$15,475 |
$21,399 |
$15,548 |
01/31/23 |
$16,307 |
$22,744 |
$16,359 |
02/28/23 |
$15,905 |
$22,189 |
$15,962 |
03/31/23 |
$16,264 |
$23,004 |
$16,306 |
04/30/23 |
$16,393 |
$23,363 |
$16,449 |
05/31/23 |
$16,178 |
$23,464 |
$16,246 |
06/30/23 |
$16,665 |
$25,015 |
$16,721 |
07/31/23 |
$17,010 |
$25,818 |
$17,076 |
08/31/23 |
$16,723 |
$25,407 |
$16,779 |
09/30/23 |
$16,192 |
$24,196 |
$16,257 |
10/31/23 |
$15,848 |
$23,687 |
$15,891 |
11/30/23 |
$16,852 |
$25,850 |
$16,914 |
12/31/23 |
$17,591 |
$27,025 |
$17,672 |
01/31/24 |
$17,576 |
$27,479 |
$17,651 |
02/29/24 |
$17,847 |
$28,946 |
$17,912 |
03/31/24 |
$18,207 |
$29,878 |
$18,276 |
04/30/24 |
$17,696 |
$28,657 |
$17,794 |
05/31/24 |
$18,207 |
$30,078 |
$18,267 |
06/30/24 |
$18,417 |
$31,157 |
$18,492 |
07/31/24 |
$18,837 |
$31,537 |
$18,903 |
08/31/24 |
$19,182 |
$32,302 |
$19,266 |
09/30/24 |
$19,528 |
$32,992 |
$19,614 |
10/31/24 |
$19,122 |
$32,692 |
$19,208 |
11/30/24 |
$19,573 |
$34,611 |
$19,641 |
12/31/24 |
$19,161 |
$33,786 |
$19,235 |
01/31/25 |
$19,529 |
$34,727 |
$19,616 |
02/28/25 |
$19,689 |
$34,274 |
$19,737 |
03/31/25 |
$19,385 |
$32,343 |
$19,431 |
04/30/25 |
$19,465 |
$32,124 |
$19,523 |
05/31/25 |
$19,898 |
$34,146 |
$19,960 |
06/30/25 |
$20,410 |
$35,882 |
$20,469 |
07/31/25 |
$20,490 |
$36,687 |
$20,570 |
08/31/25 |
$20,939 |
$37,431 |
$20,995 |
09/30/25 |
$21,307 |
$38,797 |
$21,359 |
10/31/25 |
$21,500 |
$39,706 |
$21,565 |
11/30/25 |
$21,612 |
$39,803 |
$21,680 |
12/31/25 |
$21,685 |
$39,827 |
$21,761 |
|
| Average Annual Return [Table Text Block] |
Name |
1 Year |
5 Years |
10 Years |
SSBSX |
13.17% |
5.62% |
8.05% |
S&P 500 Index |
17.88% |
14.42% |
14.82% |
State Street Target Retirement 2025 Composite Index |
13.13% |
5.64% |
8.09% | |
| Updated Performance Information Location [Text Block] |
Updated performance information is available by calling 1-800-647-7327 or visiting our website at www.ssga.com.
|
| AssetsNet |
$ 1,914,120,399
|
| Holdings Count | Holding |
12
|
| Advisory Fees Paid, Amount |
$ 0
|
| InvestmentCompanyPortfolioTurnover |
18.00%
|
| Additional Fund Statistics [Text Block] |
Key Fund Statistics as of 12/31/2025- Total Net Assets$1,914,120,399
- Number of Portfolio Holdings12
- Portfolio Turnover Rate18%
- Total Advisory Fees Paid$0
|
| Holdings [Text Block] |
Asset Types |
% |
Domestic Fixed Income |
40.5% |
Domestic Equity |
22.4% |
Inflation Linked |
18.1% |
International Equity |
14.2% |
Real Estate |
5.0% |
Short-Term Investments |
1.4% | |
| Largest Holdings [Text Block] |
Holdings |
% |
State Street Aggregate Bond Index Portfolio |
20.9% |
State Street Equity 500 Index II Portfolio |
19.8% |
State Street SPDR Bloomberg 1-10 Year TIPS ETF |
18.1% |
State Street Global All Cap Equity ex-U.S. Index Portfolio |
14.2% |
State Street SPDR Bloomberg High Yield Bond ETF |
7.1% |
State Street SPDR Portfolio Short Term Treasury ETF |
7.0% |
SPDR Dow Jones Global Real Estate ETF |
5.0% |
SPDR Bloomberg Enhanced Roll Yield Commodity Strategy No. K-1 ETF |
3.5% |
State Street Small/Mid Cap Equity Index Portfolio |
2.5% |
State Street SPDR Portfolio Short Term Corporate Bond ETF |
1.8% | |
| Material Fund Change [Text Block] |
|
| C000232296 |
|
| Shareholder Report [Line Items] |
|
| Fund Name |
State Street Target Retirement 2030 Fund
|
| Class Name |
Class R3
|
| Trading Symbol |
SSAJX
|
| Annual or Semi-Annual Statement [Text Block] |
This annual shareholder report contains important information about the State Street Target Retirement 2030 Fund (the "Fund") for the period of January 1, 2025 through December 31, 2025.
|
| Additional Information [Text Block] |
You can find additional information about the Fund, including the Prospectus, Statement of Additional Information, financial statements and other information at www.ssga.com/us/en/institutional/fund-finder?tab=documents&type=mf. You can also request this information about the Fund by contacting us at 1-800-647-7327.
|
| Additional Information Phone Number |
1-800-647-7327
|
| Additional Information Website |
www.ssga.com/us/en/institutional/fund-finder?tab=documents&type=mf
|
| Expenses [Text Block] |
What were the Fund costs for the last year? (based on a hypothetical $10,000 Investment)
Class Name |
Costs of a $10,000 investment |
Costs paid as a percentage of a $10,000 investment |
Class R3 |
$55 |
0.51% | Does not include expenses of the Underlying Funds in which the Fund invests. |
| Expenses Paid, Amount |
$ 55
|
| Expense Ratio, Percent |
0.51%
|
| Factors Affecting Performance [Text Block] |
How did the Fund perform last year and what affected its performance?The main driver of the Fund’s performance on an absolute basis during the reporting period was its position in the State Street Global Equity ex-US Index Portfolio which returned approximately 32.7% for the reporting period. On an individual security level, the top positive contributors to the Fund’s performance on an absolute basis during the reporting period were the State Street Global Equity ex-US Index Portfolio, State Street Equity 500 Index II Portfolio, and the State Street Aggregate Bond Index Portfolio. There were no negative contributors to the Fund’s performance on an absolute basis during the reporting period. |
| Performance Past Does Not Indicate Future [Text] |
The Fund’s past performance is not necessarily an indication of how the Fund will perform in the future. The returns do not reflect the deduction of taxes that a shareholder would pay on Fund distributions or on the redemption or sale of Fund shares.
|
| Line Graph [Table Text Block] |
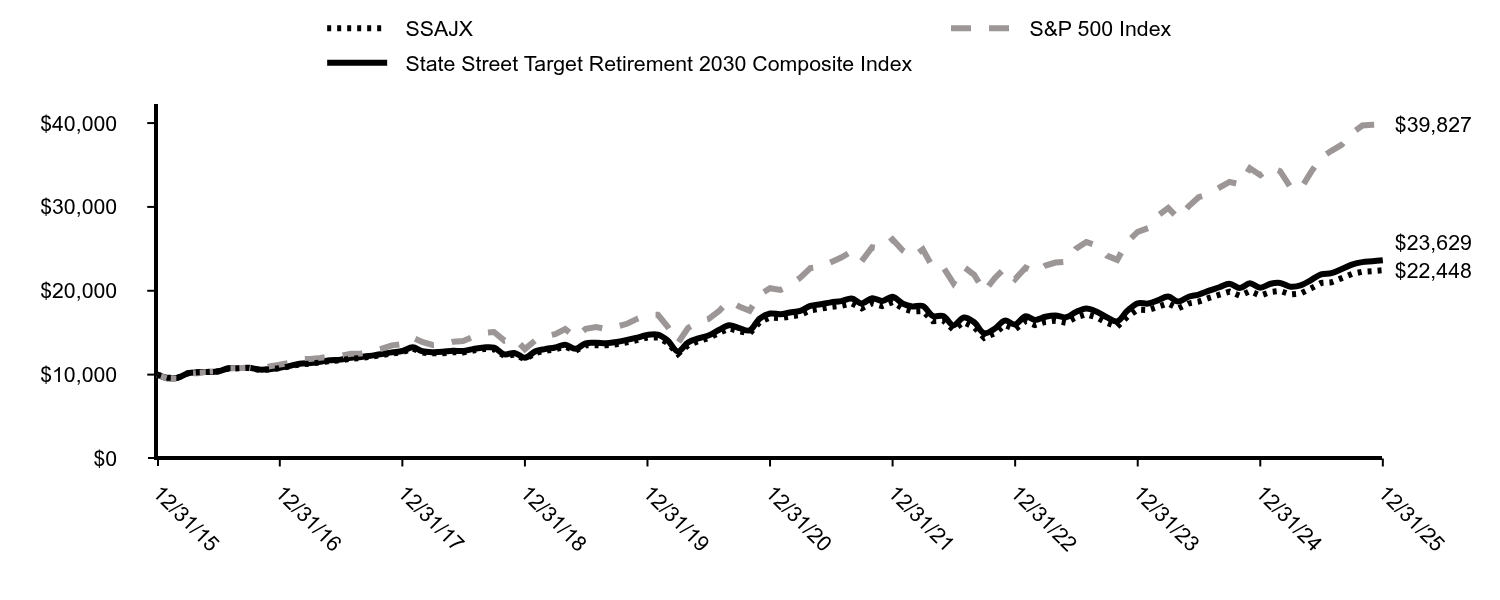
|
SSAJX |
S&P 500 Index |
State Street Target Retirement 2030 Composite Index |
12/31/15 |
$10,000 |
$10,000 |
$10,000 |
01/31/16 |
$9,627 |
$9,504 |
$9,597 |
02/29/16 |
$9,613 |
$9,491 |
$9,608 |
03/31/16 |
$10,162 |
$10,135 |
$10,158 |
04/30/16 |
$10,280 |
$10,174 |
$10,275 |
05/31/16 |
$10,317 |
$10,357 |
$10,318 |
06/30/16 |
$10,394 |
$10,384 |
$10,371 |
07/31/16 |
$10,727 |
$10,766 |
$10,751 |
08/31/16 |
$10,753 |
$10,782 |
$10,779 |
09/30/16 |
$10,800 |
$10,784 |
$10,813 |
10/31/16 |
$10,561 |
$10,587 |
$10,600 |
11/30/16 |
$10,607 |
$10,979 |
$10,648 |
12/31/16 |
$10,767 |
$11,196 |
$10,822 |
01/31/17 |
$10,980 |
$11,408 |
$11,037 |
02/28/17 |
$11,235 |
$11,861 |
$11,300 |
03/31/17 |
$11,303 |
$11,875 |
$11,378 |
04/30/17 |
$11,453 |
$11,997 |
$11,534 |
05/31/17 |
$11,635 |
$12,166 |
$11,725 |
06/30/17 |
$11,692 |
$12,242 |
$11,790 |
07/31/17 |
$11,915 |
$12,494 |
$12,012 |
08/31/17 |
$11,982 |
$12,532 |
$12,094 |
09/30/17 |
$12,153 |
$12,790 |
$12,265 |
10/31/17 |
$12,323 |
$13,089 |
$12,450 |
11/30/17 |
$12,525 |
$13,490 |
$12,655 |
12/31/17 |
$12,680 |
$13,640 |
$12,820 |
01/31/18 |
$13,107 |
$14,421 |
$13,254 |
02/28/18 |
$12,627 |
$13,890 |
$12,797 |
03/31/18 |
$12,538 |
$13,537 |
$12,675 |
04/30/18 |
$12,543 |
$13,589 |
$12,716 |
05/31/18 |
$12,664 |
$13,916 |
$12,840 |
06/30/18 |
$12,638 |
$14,002 |
$12,817 |
07/31/18 |
$12,885 |
$14,523 |
$13,069 |
08/31/18 |
$13,048 |
$14,996 |
$13,239 |
09/30/18 |
$13,011 |
$15,081 |
$13,209 |
10/31/18 |
$12,227 |
$14,050 |
$12,410 |
11/30/18 |
$12,390 |
$14,337 |
$12,584 |
12/31/18 |
$11,831 |
$13,042 |
$12,011 |
01/31/19 |
$12,579 |
$14,087 |
$12,771 |
02/28/19 |
$12,828 |
$14,540 |
$13,039 |
03/31/19 |
$13,022 |
$14,822 |
$13,239 |
04/30/19 |
$13,326 |
$15,422 |
$13,550 |
05/31/19 |
$12,856 |
$14,442 |
$13,077 |
06/30/19 |
$13,492 |
$15,460 |
$13,736 |
07/31/19 |
$13,519 |
$15,682 |
$13,790 |
08/31/19 |
$13,491 |
$15,434 |
$13,749 |
09/30/19 |
$13,629 |
$15,723 |
$13,888 |
10/31/19 |
$13,855 |
$16,063 |
$14,138 |
11/30/19 |
$14,114 |
$16,646 |
$14,408 |
12/31/19 |
$14,424 |
$17,149 |
$14,731 |
01/31/20 |
$14,418 |
$17,142 |
$14,761 |
02/29/20 |
$13,789 |
$15,731 |
$14,076 |
03/31/20 |
$12,458 |
$13,788 |
$12,755 |
04/30/20 |
$13,508 |
$15,555 |
$13,832 |
05/31/20 |
$13,995 |
$16,296 |
$14,321 |
06/30/20 |
$14,341 |
$16,620 |
$14,666 |
07/31/20 |
$14,956 |
$17,558 |
$15,320 |
08/31/20 |
$15,500 |
$18,820 |
$15,895 |
09/30/20 |
$15,177 |
$18,105 |
$15,547 |
10/31/20 |
$14,890 |
$17,623 |
$15,270 |
11/30/20 |
$16,252 |
$19,552 |
$16,688 |
12/31/20 |
$16,827 |
$20,304 |
$17,286 |
01/31/21 |
$16,721 |
$20,099 |
$17,199 |
02/28/21 |
$16,911 |
$20,653 |
$17,405 |
03/31/21 |
$17,124 |
$21,558 |
$17,611 |
04/30/21 |
$17,668 |
$22,708 |
$18,190 |
05/31/21 |
$17,857 |
$22,867 |
$18,400 |
06/30/21 |
$18,070 |
$23,401 |
$18,619 |
07/31/21 |
$18,209 |
$23,956 |
$18,769 |
08/31/21 |
$18,494 |
$24,685 |
$19,073 |
09/30/21 |
$17,900 |
$23,537 |
$18,496 |
10/31/21 |
$18,516 |
$25,186 |
$19,117 |
11/30/21 |
$18,166 |
$25,011 |
$18,782 |
12/31/21 |
$18,646 |
$26,132 |
$19,284 |
01/31/22 |
$17,885 |
$24,780 |
$18,450 |
02/28/22 |
$17,529 |
$24,038 |
$18,130 |
03/31/22 |
$17,567 |
$24,931 |
$18,187 |
04/30/22 |
$16,374 |
$22,757 |
$16,985 |
05/31/22 |
$16,439 |
$22,798 |
$16,993 |
06/30/22 |
$15,362 |
$20,916 |
$15,883 |
07/31/22 |
$16,257 |
$22,845 |
$16,806 |
08/31/22 |
$15,660 |
$21,913 |
$16,244 |
09/30/22 |
$14,389 |
$19,895 |
$14,930 |
10/31/22 |
$14,921 |
$21,506 |
$15,472 |
11/30/22 |
$15,907 |
$22,708 |
$16,443 |
12/31/22 |
$15,408 |
$21,399 |
$15,992 |
01/31/23 |
$16,365 |
$22,744 |
$16,965 |
02/28/23 |
$15,900 |
$22,189 |
$16,512 |
03/31/23 |
$16,283 |
$23,004 |
$16,896 |
04/30/23 |
$16,433 |
$23,363 |
$17,059 |
05/31/23 |
$16,187 |
$23,464 |
$16,832 |
06/30/23 |
$16,816 |
$25,015 |
$17,466 |
07/31/23 |
$17,199 |
$25,818 |
$17,896 |
08/31/23 |
$16,816 |
$25,407 |
$17,496 |
09/30/23 |
$16,173 |
$24,196 |
$16,843 |
10/31/23 |
$15,722 |
$23,687 |
$16,356 |
11/30/23 |
$16,898 |
$25,850 |
$17,607 |
12/31/23 |
$17,742 |
$27,025 |
$18,510 |
01/31/24 |
$17,699 |
$27,479 |
$18,473 |
02/29/24 |
$18,082 |
$28,946 |
$18,863 |
03/31/24 |
$18,493 |
$29,878 |
$19,312 |
04/30/24 |
$17,898 |
$28,657 |
$18,711 |
05/31/24 |
$18,479 |
$30,078 |
$19,287 |
06/30/24 |
$18,706 |
$31,157 |
$19,549 |
07/31/24 |
$19,145 |
$31,537 |
$20,014 |
08/31/24 |
$19,528 |
$32,302 |
$20,422 |
09/30/24 |
$19,896 |
$32,992 |
$20,829 |
10/31/24 |
$19,400 |
$32,692 |
$20,327 |
11/30/24 |
$19,953 |
$34,611 |
$20,883 |
12/31/24 |
$19,427 |
$33,786 |
$20,359 |
01/31/25 |
$19,861 |
$34,727 |
$20,834 |
02/28/25 |
$19,981 |
$34,274 |
$20,928 |
03/31/25 |
$19,562 |
$32,343 |
$20,483 |
04/30/25 |
$19,667 |
$32,124 |
$20,631 |
05/31/25 |
$20,281 |
$34,146 |
$21,275 |
06/30/25 |
$20,925 |
$35,882 |
$21,961 |
07/31/25 |
$21,015 |
$36,687 |
$22,098 |
08/31/25 |
$21,509 |
$37,431 |
$22,590 |
09/30/25 |
$22,003 |
$38,797 |
$23,122 |
10/31/25 |
$22,273 |
$39,706 |
$23,417 |
11/30/25 |
$22,348 |
$39,803 |
$23,509 |
12/31/25 |
$22,448 |
$39,827 |
$23,629 |
|
| Average Annual Return [Table Text Block] |
Name |
1 Year |
5 Years |
10 Years |
SSAJXFootnote Reference(1) |
15.55% |
5.93% |
8.42% |
S&P 500 Index |
17.88% |
14.42% |
14.82% |
State Street Target Retirement 2030 Composite Index |
16.06% |
6.45% |
8.98% | |
| Updated Performance Information Location [Text Block] |
Updated performance information is available by calling 1-800-647-7327 or visiting our website at www.ssga.com.
|
| AssetsNet |
$ 3,332,736,146
|
| Holdings Count | Holding |
13
|
| Advisory Fees Paid, Amount |
$ 0
|
| InvestmentCompanyPortfolioTurnover |
22.00%
|
| Additional Fund Statistics [Text Block] |
Key Fund Statistics as of 12/31/2025- Total Net Assets$3,332,736,146
- Number of Portfolio Holdings13
- Portfolio Turnover Rate22%
- Total Advisory Fees Paid$0
|
| Holdings [Text Block] |
Asset Types |
% |
Domestic Equity |
32.0% |
Domestic Fixed Income |
31.9% |
International Equity |
21.9% |
Inflation Linked |
11.3% |
Real Estate |
3.0% |
Short-Term Investments |
0.3% | |
| Largest Holdings [Text Block] |
Holdings |
% |
State Street Equity 500 Index II Portfolio |
27.8% |
State Street Global All Cap Equity ex-U.S. Index Portfolio |
21.9% |
State Street Aggregate Bond Index Portfolio |
19.9% |
State Street SPDR Bloomberg 1-10 Year TIPS ETF |
11.3% |
State Street SPDR Bloomberg High Yield Bond ETF |
6.5% |
State Street Small/Mid Cap Equity Index Portfolio |
4.2% |
State Street SPDR Portfolio Long Term Treasury ETF |
4.0% |
SPDR Dow Jones Global Real Estate ETF |
3.0% |
SPDR Bloomberg Enhanced Roll Yield Commodity Strategy No. K-1 ETF |
0.7% |
State Street SPDR Portfolio Short Term Treasury ETF |
0.6% | |
| Material Fund Change [Text Block] |
|
| C000143872 |
|
| Shareholder Report [Line Items] |
|
| Fund Name |
State Street Target Retirement 2030 Fund
|
| Class Name |
Class I
|
| Trading Symbol |
SSBWX
|
| Annual or Semi-Annual Statement [Text Block] |
This annual shareholder report contains important information about the State Street Target Retirement 2030 Fund (the "Fund") for the period of January 1, 2025 through December 31, 2025.
|
| Additional Information [Text Block] |
You can find additional information about the Fund, including the Prospectus, Statement of Additional Information, financial statements and other information at www.ssga.com/us/en/institutional/fund-finder?tab=documents&type=mf. You can also request this information about the Fund by contacting us at 1-800-647-7327.
|
| Additional Information Phone Number |
1-800-647-7327
|
| Additional Information Website |
www.ssga.com/us/en/institutional/fund-finder?tab=documents&type=mf
|
| Expenses [Text Block] |
What were the Fund costs for the last year? (based on a hypothetical $10,000 Investment)
Class Name |
Costs of a $10,000 investment |
Costs paid as a percentage of a $10,000 investment |
Class I |
$16 |
0.15% | Does not include expenses of the Underlying Funds in which the Fund invests. |
| Expenses Paid, Amount |
$ 16
|
| Expense Ratio, Percent |
0.15%
|
| Factors Affecting Performance [Text Block] |
How did the Fund perform last year and what affected its performance?The main driver of the Fund’s performance on an absolute basis during the reporting period was its position in the State Street Global Equity ex-US Index Portfolio which returned approximately 32.7% for the reporting period. On an individual security level, the top positive contributors to the Fund’s performance on an absolute basis during the reporting period were the State Street Global Equity ex-US Index Portfolio, State Street Equity 500 Index II Portfolio, and the State Street Aggregate Bond Index Portfolio. There were no negative contributors to the Fund’s performance on an absolute basis during the reporting period. |
| Performance Past Does Not Indicate Future [Text] |
The Fund’s past performance is not necessarily an indication of how the Fund will perform in the future. The returns do not reflect the deduction of taxes that a shareholder would pay on Fund distributions or on the redemption or sale of Fund shares.
|
| Line Graph [Table Text Block] |

|
SSBWX |
S&P 500 Index |
State Street Target Retirement 2030 Composite Index |
12/31/15 |
$10,000 |
$10,000 |
$10,000 |
01/31/16 |
$9,631 |
$9,504 |
$9,597 |
02/29/16 |
$9,621 |
$9,491 |
$9,608 |
03/31/16 |
$10,174 |
$10,135 |
$10,158 |
04/30/16 |
$10,287 |
$10,174 |
$10,275 |
05/31/16 |
$10,338 |
$10,357 |
$10,318 |
06/30/16 |
$10,410 |
$10,384 |
$10,371 |
07/31/16 |
$10,758 |
$10,766 |
$10,751 |
08/31/16 |
$10,779 |
$10,782 |
$10,779 |
09/30/16 |
$10,830 |
$10,784 |
$10,813 |
10/31/16 |
$10,594 |
$10,587 |
$10,600 |
11/30/16 |
$10,645 |
$10,979 |
$10,648 |
12/31/16 |
$10,810 |
$11,196 |
$10,822 |
01/31/17 |
$11,019 |
$11,408 |
$11,037 |
02/28/17 |
$11,290 |
$11,861 |
$11,300 |
03/31/17 |
$11,363 |
$11,875 |
$11,378 |
04/30/17 |
$11,519 |
$11,997 |
$11,534 |
05/31/17 |
$11,707 |
$12,166 |
$11,725 |
06/30/17 |
$11,769 |
$12,242 |
$11,790 |
07/31/17 |
$11,988 |
$12,494 |
$12,012 |
08/31/17 |
$12,072 |
$12,532 |
$12,094 |
09/30/17 |
$12,238 |
$12,790 |
$12,265 |
10/31/17 |
$12,426 |
$13,089 |
$12,450 |
11/30/17 |
$12,634 |
$13,490 |
$12,655 |
12/31/17 |
$12,785 |
$13,640 |
$12,820 |
01/31/18 |
$13,223 |
$14,421 |
$13,254 |
02/28/18 |
$12,743 |
$13,890 |
$12,797 |
03/31/18 |
$12,657 |
$13,537 |
$12,675 |
04/30/18 |
$12,668 |
$13,589 |
$12,716 |
05/31/18 |
$12,807 |
$13,916 |
$12,840 |
06/30/18 |
$12,785 |
$14,002 |
$12,817 |
07/31/18 |
$13,042 |
$14,523 |
$13,069 |
08/31/18 |
$13,202 |
$14,996 |
$13,239 |
09/30/18 |
$13,180 |
$15,081 |
$13,209 |
10/31/18 |
$12,380 |
$14,050 |
$12,410 |
11/30/18 |
$12,561 |
$14,337 |
$12,584 |
12/31/18 |
$11,987 |
$13,042 |
$12,011 |
01/31/19 |
$12,751 |
$14,087 |
$12,771 |
02/28/19 |
$13,010 |
$14,540 |
$13,039 |
03/31/19 |
$13,212 |
$14,822 |
$13,239 |
04/30/19 |
$13,527 |
$15,422 |
$13,550 |
05/31/19 |
$13,055 |
$14,442 |
$13,077 |
06/30/19 |
$13,706 |
$15,460 |
$13,736 |
07/31/19 |
$13,751 |
$15,682 |
$13,790 |
08/31/19 |
$13,729 |
$15,434 |
$13,749 |
09/30/19 |
$13,864 |
$15,723 |
$13,888 |
10/31/19 |
$14,111 |
$16,063 |
$14,138 |
11/30/19 |
$14,380 |
$16,646 |
$14,408 |
12/31/19 |
$14,691 |
$17,149 |
$14,731 |
01/31/20 |
$14,703 |
$17,142 |
$14,761 |
02/29/20 |
$14,056 |
$15,731 |
$14,076 |
03/31/20 |
$12,702 |
$13,788 |
$12,755 |
04/30/20 |
$13,780 |
$15,555 |
$13,832 |
05/31/20 |
$14,283 |
$16,296 |
$14,321 |
06/30/20 |
$14,643 |
$16,620 |
$14,666 |
07/31/20 |
$15,278 |
$17,558 |
$15,320 |
08/31/20 |
$15,841 |
$18,820 |
$15,895 |
09/30/20 |
$15,518 |
$18,105 |
$15,547 |
10/31/20 |
$15,230 |
$17,623 |
$15,270 |
11/30/20 |
$16,620 |
$19,552 |
$16,688 |
12/31/20 |
$17,226 |
$20,304 |
$17,286 |
01/31/21 |
$17,113 |
$20,099 |
$17,199 |
02/28/21 |
$17,314 |
$20,653 |
$17,405 |
03/31/21 |
$17,540 |
$21,558 |
$17,611 |
04/30/21 |
$18,106 |
$22,708 |
$18,190 |
05/31/21 |
$18,295 |
$22,867 |
$18,400 |
06/30/21 |
$18,533 |
$23,401 |
$18,619 |
07/31/21 |
$18,672 |
$23,956 |
$18,769 |
08/31/21 |
$18,898 |
$24,685 |
$19,073 |
09/30/21 |
$18,307 |
$23,537 |
$18,496 |
10/31/21 |
$18,936 |
$25,186 |
$19,117 |
11/30/21 |
$18,584 |
$25,011 |
$18,782 |
12/31/21 |
$19,079 |
$26,132 |
$19,284 |
01/31/22 |
$18,304 |
$24,780 |
$18,450 |
02/28/22 |
$17,944 |
$24,038 |
$18,130 |
03/31/22 |
$17,984 |
$24,931 |
$18,187 |
04/30/22 |
$16,769 |
$22,757 |
$16,985 |
05/31/22 |
$16,836 |
$22,798 |
$16,993 |
06/30/22 |
$15,741 |
$20,916 |
$15,883 |
07/31/22 |
$16,662 |
$22,845 |
$16,806 |
08/31/22 |
$16,061 |
$21,913 |
$16,244 |
09/30/22 |
$14,766 |
$19,895 |
$14,930 |
10/31/22 |
$15,314 |
$21,506 |
$15,472 |
11/30/22 |
$16,328 |
$22,708 |
$16,443 |
12/31/22 |
$15,811 |
$21,399 |
$15,992 |
01/31/23 |
$16,800 |
$22,744 |
$16,965 |
02/28/23 |
$16,334 |
$22,189 |
$16,512 |
03/31/23 |
$16,744 |
$23,004 |
$16,896 |
04/30/23 |
$16,899 |
$23,363 |
$17,059 |
05/31/23 |
$16,659 |
$23,464 |
$16,832 |
06/30/23 |
$17,295 |
$25,015 |
$17,466 |
07/31/23 |
$17,704 |
$25,818 |
$17,896 |
08/31/23 |
$17,309 |
$25,407 |
$17,496 |
09/30/23 |
$16,659 |
$24,196 |
$16,843 |
10/31/23 |
$16,207 |
$23,687 |
$16,356 |
11/30/23 |
$17,422 |
$25,850 |
$17,607 |
12/31/23 |
$18,282 |
$27,025 |
$18,510 |
01/31/24 |
$18,238 |
$27,479 |
$18,473 |
02/29/24 |
$18,635 |
$28,946 |
$18,863 |
03/31/24 |
$19,062 |
$29,878 |
$19,312 |
04/30/24 |
$18,459 |
$28,657 |
$18,711 |
05/31/24 |
$19,077 |
$30,078 |
$19,287 |
06/30/24 |
$19,312 |
$31,157 |
$19,549 |
07/31/24 |
$19,768 |
$31,537 |
$20,014 |
08/31/24 |
$20,165 |
$32,302 |
$20,422 |
09/30/24 |
$20,562 |
$32,992 |
$20,829 |
10/31/24 |
$20,047 |
$32,692 |
$20,327 |
11/30/24 |
$20,621 |
$34,611 |
$20,883 |
12/31/24 |
$20,074 |
$33,786 |
$20,359 |
01/31/25 |
$20,543 |
$34,727 |
$20,834 |
02/28/25 |
$20,667 |
$34,274 |
$20,928 |
03/31/25 |
$20,246 |
$32,343 |
$20,483 |
04/30/25 |
$20,371 |
$32,124 |
$20,631 |
05/31/25 |
$20,995 |
$34,146 |
$21,275 |
06/30/25 |
$21,682 |
$35,882 |
$21,961 |
07/31/25 |
$21,776 |
$36,687 |
$22,098 |
08/31/25 |
$22,291 |
$37,431 |
$22,590 |
09/30/25 |
$22,822 |
$38,797 |
$23,122 |
10/31/25 |
$23,103 |
$39,706 |
$23,417 |
11/30/25 |
$23,196 |
$39,803 |
$23,509 |
12/31/25 |
$23,273 |
$39,827 |
$23,629 |
|
| Average Annual Return [Table Text Block] |
Name |
1 Year |
5 Years |
10 Years |
SSBWX |
15.93% |
6.20% |
8.81% |
S&P 500 Index |
17.88% |
14.42% |
14.82% |
State Street Target Retirement 2030 Composite Index |
16.06% |
6.45% |
8.98% | |
| Updated Performance Information Location [Text Block] |
Updated performance information is available by calling 1-800-647-7327 or visiting our website at www.ssga.com.
|
| AssetsNet |
$ 3,332,736,146
|
| Holdings Count | Holding |
13
|
| Advisory Fees Paid, Amount |
$ 0
|
| InvestmentCompanyPortfolioTurnover |
22.00%
|
| Additional Fund Statistics [Text Block] |
Key Fund Statistics as of 12/31/2025- Total Net Assets$3,332,736,146
- Number of Portfolio Holdings13
- Portfolio Turnover Rate22%
- Total Advisory Fees Paid$0
|
| Holdings [Text Block] |
Asset Types |
% |
Domestic Equity |
32.0% |
Domestic Fixed Income |
31.9% |
International Equity |
21.9% |
Inflation Linked |
11.3% |
Real Estate |
3.0% |
Short-Term Investments |
0.3% | |
| Largest Holdings [Text Block] |
Holdings |
% |
State Street Equity 500 Index II Portfolio |
27.8% |
State Street Global All Cap Equity ex-U.S. Index Portfolio |
21.9% |
State Street Aggregate Bond Index Portfolio |
19.9% |
State Street SPDR Bloomberg 1-10 Year TIPS ETF |
11.3% |
State Street SPDR Bloomberg High Yield Bond ETF |
6.5% |
State Street Small/Mid Cap Equity Index Portfolio |
4.2% |
State Street SPDR Portfolio Long Term Treasury ETF |
4.0% |
SPDR Dow Jones Global Real Estate ETF |
3.0% |
SPDR Bloomberg Enhanced Roll Yield Commodity Strategy No. K-1 ETF |
0.7% |
State Street SPDR Portfolio Short Term Treasury ETF |
0.6% | |
| Material Fund Change [Text Block] |
|
| C000143873 |
|
| Shareholder Report [Line Items] |
|
| Fund Name |
State Street Target Retirement 2030 Fund
|
| Class Name |
Class K
|
| Trading Symbol |
SSBYX
|
| Annual or Semi-Annual Statement [Text Block] |
This annual shareholder report contains important information about the State Street Target Retirement 2030 Fund (the "Fund") for the period of January 1, 2025 through December 31, 2025.
|
| Additional Information [Text Block] |
You can find additional information about the Fund, including the Prospectus, Statement of Additional Information, financial statements and other information at www.ssga.com/us/en/institutional/fund-finder?tab=documents&type=mf. You can also request this information about the Fund by contacting us at 1-800-647-7327.
|
| Additional Information Phone Number |
1-800-647-7327
|
| Additional Information Website |
www.ssga.com/us/en/institutional/fund-finder?tab=documents&type=mf
|
| Expenses [Text Block] |
What were the Fund costs for the last year? (based on a hypothetical $10,000 Investment)
Class Name |
Costs of a $10,000 investment |
Costs paid as a percentage of a $10,000 investment |
Class K |
$1 |
0.01% | Does not include expenses of the Underlying Funds in which the Fund invests. |
| Expenses Paid, Amount |
$ 1
|
| Expense Ratio, Percent |
0.01%
|
| Factors Affecting Performance [Text Block] |
How did the Fund perform last year and what affected its performance?The main driver of the Fund’s performance on an absolute basis during the reporting period was its position in the State Street Global Equity ex-US Index Portfolio which returned approximately 32.7% for the reporting period. On an individual security level, the top positive contributors to the Fund’s performance on an absolute basis during the reporting period were the State Street Global Equity ex-US Index Portfolio, State Street Equity 500 Index II Portfolio, and the State Street Aggregate Bond Index Portfolio. There were no negative contributors to the Fund’s performance on an absolute basis during the reporting period. |
| Performance Past Does Not Indicate Future [Text] |
The Fund’s past performance is not necessarily an indication of how the Fund will perform in the future. The returns do not reflect the deduction of taxes that a shareholder would pay on Fund distributions or on the redemption or sale of Fund shares.
|
| Line Graph [Table Text Block] |
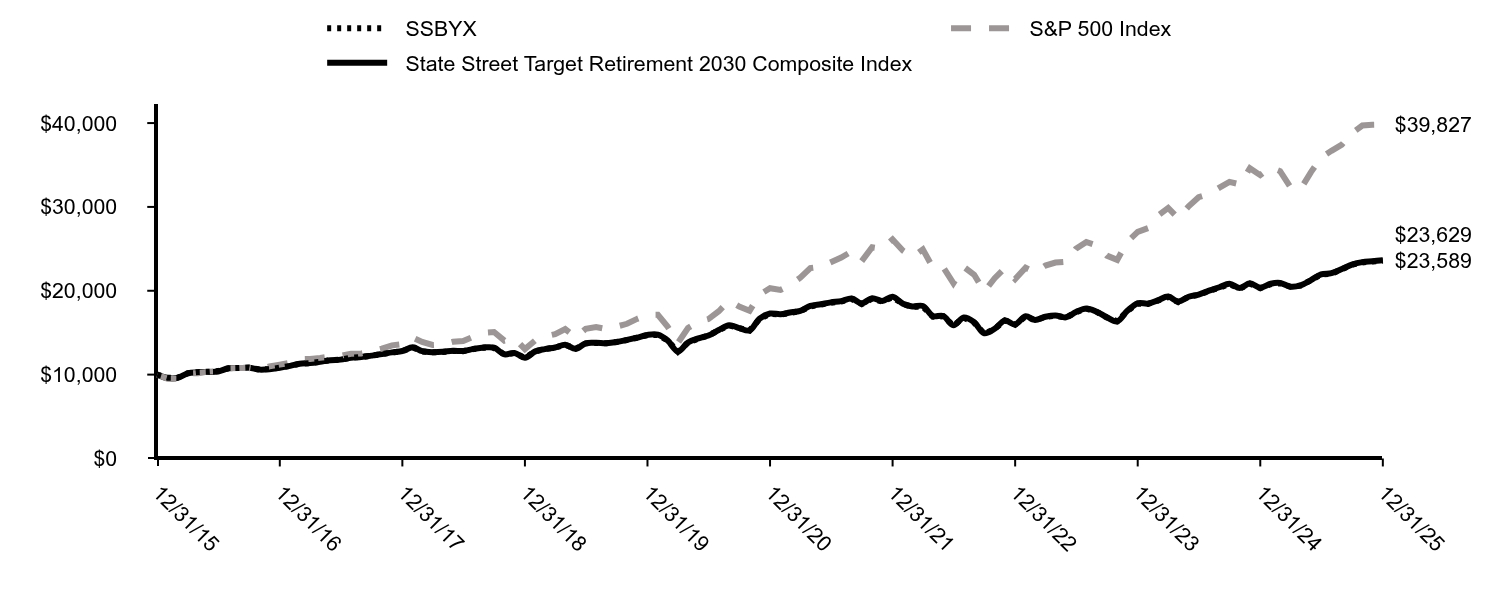
|
SSBYX |
S&P 500 Index |
State Street Target Retirement 2030 Composite Index |
12/31/15 |
$10,000 |
$10,000 |
$10,000 |
01/31/16 |
$9,631 |
$9,504 |
$9,597 |
02/29/16 |
$9,621 |
$9,491 |
$9,608 |
03/31/16 |
$10,174 |
$10,135 |
$10,158 |
04/30/16 |
$10,297 |
$10,174 |
$10,275 |
05/31/16 |
$10,338 |
$10,357 |
$10,318 |
06/30/16 |
$10,420 |
$10,384 |
$10,371 |
07/31/16 |
$10,758 |
$10,766 |
$10,751 |
08/31/16 |
$10,789 |
$10,782 |
$10,779 |
09/30/16 |
$10,840 |
$10,784 |
$10,813 |
10/31/16 |
$10,605 |
$10,587 |
$10,600 |
11/30/16 |
$10,656 |
$10,979 |
$10,648 |
12/31/16 |
$10,820 |
$11,196 |
$10,822 |
01/31/17 |
$11,039 |
$11,408 |
$11,037 |
02/28/17 |
$11,300 |
$11,861 |
$11,300 |
03/31/17 |
$11,373 |
$11,875 |
$11,378 |
04/30/17 |
$11,529 |
$11,997 |
$11,534 |
05/31/17 |
$11,717 |
$12,166 |
$11,725 |
06/30/17 |
$11,779 |
$12,242 |
$11,790 |
07/31/17 |
$12,009 |
$12,494 |
$12,012 |
08/31/17 |
$12,082 |
$12,532 |
$12,094 |
09/30/17 |
$12,259 |
$12,790 |
$12,265 |
10/31/17 |
$12,436 |
$13,089 |
$12,450 |
11/30/17 |
$12,645 |
$13,490 |
$12,655 |
12/31/17 |
$12,806 |
$13,640 |
$12,820 |
01/31/18 |
$13,244 |
$14,421 |
$13,254 |
02/28/18 |
$12,764 |
$13,890 |
$12,797 |
03/31/18 |
$12,678 |
$13,537 |
$12,675 |
04/30/18 |
$12,689 |
$13,589 |
$12,716 |
05/31/18 |
$12,817 |
$13,916 |
$12,840 |
06/30/18 |
$12,796 |
$14,002 |
$12,817 |
07/31/18 |
$13,052 |
$14,523 |
$13,069 |
08/31/18 |
$13,223 |
$14,996 |
$13,239 |
09/30/18 |
$13,191 |
$15,081 |
$13,209 |
10/31/18 |
$12,401 |
$14,050 |
$12,410 |
11/30/18 |
$12,572 |
$14,337 |
$12,584 |
12/31/18 |
$12,010 |
$13,042 |
$12,011 |
01/31/19 |
$12,774 |
$14,087 |
$12,771 |
02/28/19 |
$13,032 |
$14,540 |
$13,039 |
03/31/19 |
$13,234 |
$14,822 |
$13,239 |
04/30/19 |
$13,549 |
$15,422 |
$13,550 |
05/31/19 |
$13,077 |
$14,442 |
$13,077 |
06/30/19 |
$13,728 |
$15,460 |
$13,736 |
07/31/19 |
$13,762 |
$15,682 |
$13,790 |
08/31/19 |
$13,740 |
$15,434 |
$13,749 |
09/30/19 |
$13,886 |
$15,723 |
$13,888 |
10/31/19 |
$14,122 |
$16,063 |
$14,138 |
11/30/19 |
$14,391 |
$16,646 |
$14,408 |
12/31/19 |
$14,714 |
$17,149 |
$14,731 |
01/31/20 |
$14,714 |
$17,142 |
$14,761 |
02/29/20 |
$14,079 |
$15,731 |
$14,076 |
03/31/20 |
$12,725 |
$13,788 |
$12,755 |
04/30/20 |
$13,803 |
$15,555 |
$13,832 |
05/31/20 |
$14,306 |
$16,296 |
$14,321 |
06/30/20 |
$14,666 |
$16,620 |
$14,666 |
07/31/20 |
$15,301 |
$17,558 |
$15,320 |
08/31/20 |
$15,864 |
$18,820 |
$15,895 |
09/30/20 |
$15,540 |
$18,105 |
$15,547 |
10/31/20 |
$15,253 |
$17,623 |
$15,270 |
11/30/20 |
$16,655 |
$19,552 |
$16,688 |
12/31/20 |
$17,251 |
$20,304 |
$17,286 |
01/31/21 |
$17,150 |
$20,099 |
$17,199 |
02/28/21 |
$17,351 |
$20,653 |
$17,405 |
03/31/21 |
$17,578 |
$21,558 |
$17,611 |
04/30/21 |
$18,144 |
$22,708 |
$18,190 |
05/31/21 |
$18,345 |
$22,867 |
$18,400 |
06/30/21 |
$18,571 |
$23,401 |
$18,619 |
07/31/21 |
$18,722 |
$23,956 |
$18,769 |
08/31/21 |
$19,024 |
$24,685 |
$19,073 |
09/30/21 |
$18,420 |
$23,537 |
$18,496 |
10/31/21 |
$19,061 |
$25,186 |
$19,117 |
11/30/21 |
$18,709 |
$25,011 |
$18,782 |
12/31/21 |
$19,212 |
$26,132 |
$19,284 |
01/31/22 |
$18,436 |
$24,780 |
$18,450 |
02/28/22 |
$18,075 |
$24,038 |
$18,130 |
03/31/22 |
$18,115 |
$24,931 |
$18,187 |
04/30/22 |
$16,897 |
$22,757 |
$16,985 |
05/31/22 |
$16,964 |
$22,798 |
$16,993 |
06/30/22 |
$15,854 |
$20,916 |
$15,883 |
07/31/22 |
$16,790 |
$22,845 |
$16,806 |
08/31/22 |
$16,188 |
$21,913 |
$16,244 |
09/30/22 |
$14,877 |
$19,895 |
$14,930 |
10/31/22 |
$15,439 |
$21,506 |
$15,472 |
11/30/22 |
$16,469 |
$22,708 |
$16,443 |
12/31/22 |
$15,955 |
$21,399 |
$15,992 |
01/31/23 |
$16,947 |
$22,744 |
$16,965 |
02/28/23 |
$16,479 |
$22,189 |
$16,512 |
03/31/23 |
$16,876 |
$23,004 |
$16,896 |
04/30/23 |
$17,032 |
$23,363 |
$17,059 |
05/31/23 |
$16,805 |
$23,464 |
$16,832 |
06/30/23 |
$17,443 |
$25,015 |
$17,466 |
07/31/23 |
$17,868 |
$25,818 |
$17,896 |
08/31/23 |
$17,471 |
$25,407 |
$17,496 |
09/30/23 |
$16,819 |
$24,196 |
$16,843 |
10/31/23 |
$16,352 |
$23,687 |
$16,356 |
11/30/23 |
$17,584 |
$25,850 |
$17,607 |
12/31/23 |
$18,466 |
$27,025 |
$18,510 |
01/31/24 |
$18,422 |
$27,479 |
$18,473 |
02/29/24 |
$18,821 |
$28,946 |
$18,863 |
03/31/24 |
$19,264 |
$29,878 |
$19,312 |
04/30/24 |
$18,644 |
$28,657 |
$18,711 |
05/31/24 |
$19,278 |
$30,078 |
$19,287 |
06/30/24 |
$19,515 |
$31,157 |
$19,549 |
07/31/24 |
$19,972 |
$31,537 |
$20,014 |
08/31/24 |
$20,371 |
$32,302 |
$20,422 |
09/30/24 |
$20,784 |
$32,992 |
$20,829 |
10/31/24 |
$20,267 |
$32,692 |
$20,327 |
11/30/24 |
$20,843 |
$34,611 |
$20,883 |
12/31/24 |
$20,308 |
$33,786 |
$20,359 |
01/31/25 |
$20,779 |
$34,727 |
$20,834 |
02/28/25 |
$20,904 |
$34,274 |
$20,928 |
03/31/25 |
$20,481 |
$32,343 |
$20,483 |
04/30/25 |
$20,606 |
$32,124 |
$20,631 |
05/31/25 |
$21,249 |
$34,146 |
$21,275 |
06/30/25 |
$21,939 |
$35,882 |
$21,961 |
07/31/25 |
$22,033 |
$36,687 |
$22,098 |
08/31/25 |
$22,567 |
$37,431 |
$22,590 |
09/30/25 |
$23,100 |
$38,797 |
$23,122 |
10/31/25 |
$23,382 |
$39,706 |
$23,417 |
11/30/25 |
$23,476 |
$39,803 |
$23,509 |
12/31/25 |
$23,589 |
$39,827 |
$23,629 |
|
| Average Annual Return [Table Text Block] |
Name |
1 Year |
5 Years |
10 Years |
SSBYX |
16.15% |
6.46% |
8.96% |
S&P 500 Index |
17.88% |
14.42% |
14.82% |
State Street Target Retirement 2030 Composite Index |
16.06% |
6.45% |
8.98% | |
| Updated Performance Information Location [Text Block] |
Updated performance information is available by calling 1-800-647-7327 or visiting our website at www.ssga.com.
|
| AssetsNet |
$ 3,332,736,146
|
| Holdings Count | Holding |
13
|
| Advisory Fees Paid, Amount |
$ 0
|
| InvestmentCompanyPortfolioTurnover |
22.00%
|
| Additional Fund Statistics [Text Block] |
Key Fund Statistics as of 12/31/2025- Total Net Assets$3,332,736,146
- Number of Portfolio Holdings13
- Portfolio Turnover Rate22%
- Total Advisory Fees Paid$0
|
| Holdings [Text Block] |
Asset Types |
% |
Domestic Equity |
32.0% |
Domestic Fixed Income |
31.9% |
International Equity |
21.9% |
Inflation Linked |
11.3% |
Real Estate |
3.0% |
Short-Term Investments |
0.3% | |
| Largest Holdings [Text Block] |
Holdings |
% |
State Street Equity 500 Index II Portfolio |
27.8% |
State Street Global All Cap Equity ex-U.S. Index Portfolio |
21.9% |
State Street Aggregate Bond Index Portfolio |
19.9% |
State Street SPDR Bloomberg 1-10 Year TIPS ETF |
11.3% |
State Street SPDR Bloomberg High Yield Bond ETF |
6.5% |
State Street Small/Mid Cap Equity Index Portfolio |
4.2% |
State Street SPDR Portfolio Long Term Treasury ETF |
4.0% |
SPDR Dow Jones Global Real Estate ETF |
3.0% |
SPDR Bloomberg Enhanced Roll Yield Commodity Strategy No. K-1 ETF |
0.7% |
State Street SPDR Portfolio Short Term Treasury ETF |
0.6% | |
| Material Fund Change [Text Block] |
|
| C000232297 |
|
| Shareholder Report [Line Items] |
|
| Fund Name |
State Street Target Retirement 2035 Fund
|
| Class Name |
Class R3
|
| Trading Symbol |
SSAZX
|
| Annual or Semi-Annual Statement [Text Block] |
This annual shareholder report contains important information about the State Street Target Retirement 2035 Fund (the "Fund") for the period of January 1, 2025 through December 31, 2025.
|
| Additional Information [Text Block] |
You can find additional information about the Fund, including the Prospectus, Statement of Additional Information, financial statements and other information at www.ssga.com/us/en/institutional/fund-finder?tab=documents&type=mf. You can also request this information about the Fund by contacting us at 1-800-647-7327.
|
| Additional Information Phone Number |
1-800-647-7327
|
| Additional Information Website |
www.ssga.com/us/en/institutional/fund-finder?tab=documents&type=mf
|
| Expenses [Text Block] |
What were the Fund costs for the last year? (based on a hypothetical $10,000 Investment)
Class Name |
Costs of a $10,000 investment |
Costs paid as a percentage of a $10,000 investment |
Class R3 |
$59 |
0.54% | Does not include expenses of the Underlying Funds in which the Fund invests. |
| Expenses Paid, Amount |
$ 59
|
| Expense Ratio, Percent |
0.54%
|
| Factors Affecting Performance [Text Block] |
How did the Fund perform last year and what affected its performance?The main driver of the Fund’s performance on an absolute basis during the reporting period was its position in the State Street Global Equity ex-US Index Portfolio which returned approximately 32.7% for the reporting period. On an individual security level, the top positive contributors to the Fund’s performance on an absolute basis during the reporting period were the State Street Global Equity ex-US Index Portfolio, the State Street Equity 500 Index II Portfolio, and the State Street Aggregate Bond Index Portfolio. There were no negative contributors to the Fund’s performance on an absolute basis during the reporting period. |
| Performance Past Does Not Indicate Future [Text] |
The Fund’s past performance is not necessarily an indication of how the Fund will perform in the future. The returns do not reflect the deduction of taxes that a shareholder would pay on Fund distributions or on the redemption or sale of Fund shares.
|
| Line Graph [Table Text Block] |
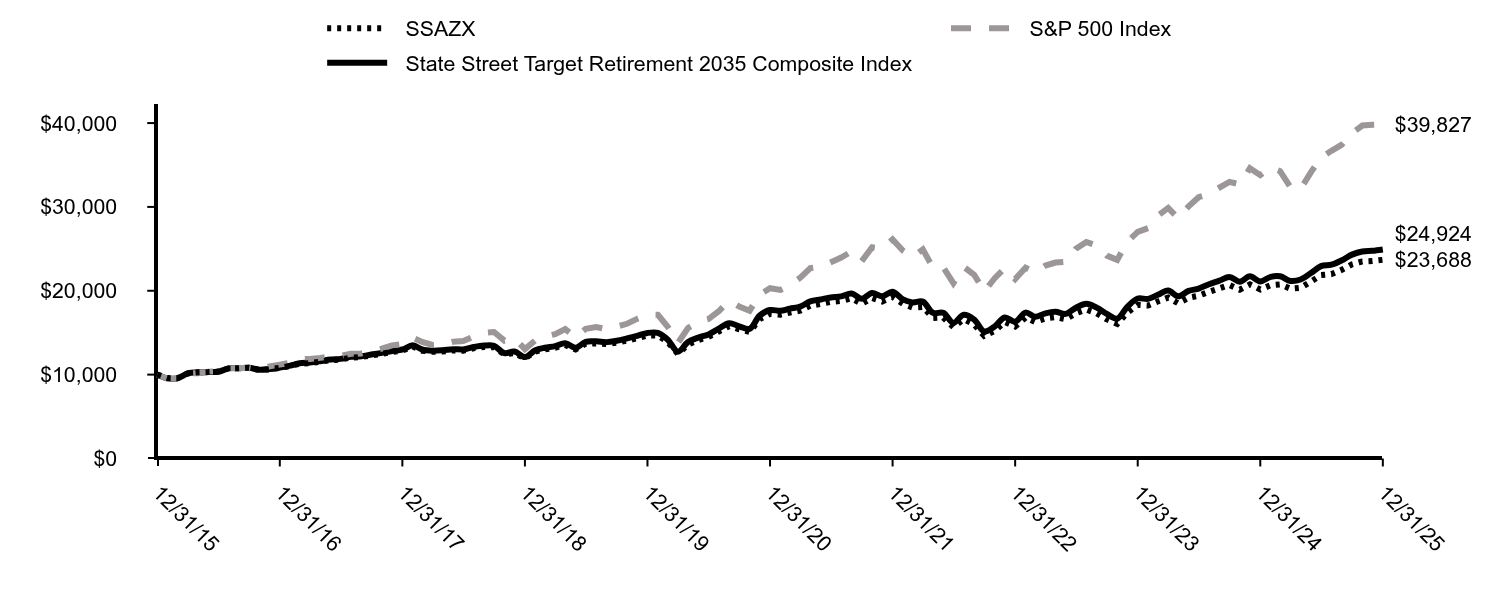
|
SSAZX |
S&P 500 Index |
State Street Target Retirement 2035 Composite Index |
12/31/15 |
$10,000 |
$10,000 |
$10,000 |
01/31/16 |
$9,587 |
$9,504 |
$9,548 |
02/29/16 |
$9,563 |
$9,491 |
$9,551 |
03/31/16 |
$10,141 |
$10,135 |
$10,135 |
04/30/16 |
$10,269 |
$10,174 |
$10,254 |
05/31/16 |
$10,306 |
$10,357 |
$10,300 |
06/30/16 |
$10,373 |
$10,384 |
$10,338 |
07/31/16 |
$10,736 |
$10,766 |
$10,741 |
08/31/16 |
$10,752 |
$10,782 |
$10,769 |
09/30/16 |
$10,809 |
$10,784 |
$10,807 |
10/31/16 |
$10,560 |
$10,587 |
$10,581 |
11/30/16 |
$10,626 |
$10,979 |
$10,660 |
12/31/16 |
$10,806 |
$11,196 |
$10,845 |
01/31/17 |
$11,029 |
$11,408 |
$11,075 |
02/28/17 |
$11,304 |
$11,861 |
$11,352 |
03/31/17 |
$11,382 |
$11,875 |
$11,438 |
04/30/17 |
$11,533 |
$11,997 |
$11,601 |
05/31/17 |
$11,724 |
$12,166 |
$11,801 |
06/30/17 |
$11,791 |
$12,242 |
$11,876 |
07/31/17 |
$12,034 |
$12,494 |
$12,115 |
08/31/17 |
$12,101 |
$12,532 |
$12,194 |
09/30/17 |
$12,292 |
$12,790 |
$12,390 |
10/31/17 |
$12,483 |
$13,089 |
$12,593 |
11/30/17 |
$12,715 |
$13,490 |
$12,820 |
12/31/17 |
$12,874 |
$13,640 |
$12,996 |
01/31/18 |
$13,353 |
$14,421 |
$13,488 |
02/28/18 |
$12,843 |
$13,890 |
$12,993 |
03/31/18 |
$12,732 |
$13,537 |
$12,853 |
04/30/18 |
$12,748 |
$13,589 |
$12,903 |
05/31/18 |
$12,890 |
$13,916 |
$13,037 |
06/30/18 |
$12,853 |
$14,002 |
$13,009 |
07/31/18 |
$13,131 |
$14,523 |
$13,286 |
08/31/18 |
$13,294 |
$14,996 |
$13,467 |
09/30/18 |
$13,267 |
$15,081 |
$13,438 |
10/31/18 |
$12,390 |
$14,050 |
$12,556 |
11/30/18 |
$12,574 |
$14,337 |
$12,747 |
12/31/18 |
$11,933 |
$13,042 |
$12,094 |
01/31/19 |
$12,743 |
$14,087 |
$12,914 |
02/28/19 |
$13,013 |
$14,540 |
$13,209 |
03/31/19 |
$13,206 |
$14,822 |
$13,402 |
04/30/19 |
$13,530 |
$15,422 |
$13,744 |
05/31/19 |
$12,997 |
$14,442 |
$13,196 |
06/30/19 |
$13,684 |
$15,460 |
$13,911 |
07/31/19 |
$13,722 |
$15,682 |
$13,966 |
08/31/19 |
$13,639 |
$15,434 |
$13,875 |
09/30/19 |
$13,798 |
$15,723 |
$14,041 |
10/31/19 |
$14,056 |
$16,063 |
$14,318 |
11/30/19 |
$14,346 |
$16,646 |
$14,620 |
12/31/19 |
$14,677 |
$17,149 |
$14,974 |
01/31/20 |
$14,647 |
$17,142 |
$14,978 |
02/29/20 |
$13,917 |
$15,731 |
$14,188 |
03/31/20 |
$12,454 |
$13,788 |
$12,733 |
04/30/20 |
$13,591 |
$15,555 |
$13,893 |
05/31/20 |
$14,122 |
$16,296 |
$14,418 |
06/30/20 |
$14,500 |
$16,620 |
$14,797 |
07/31/20 |
$15,146 |
$17,558 |
$15,487 |
08/31/20 |
$15,768 |
$18,820 |
$16,138 |
09/30/20 |
$15,401 |
$18,105 |
$15,757 |
10/31/20 |
$15,092 |
$17,623 |
$15,455 |
11/30/20 |
$16,609 |
$19,552 |
$17,032 |
12/31/20 |
$17,259 |
$20,304 |
$17,700 |
01/31/21 |
$17,155 |
$20,099 |
$17,612 |
02/28/21 |
$17,391 |
$20,653 |
$17,866 |
03/31/21 |
$17,626 |
$21,558 |
$18,100 |
04/30/21 |
$18,225 |
$22,708 |
$18,736 |
05/31/21 |
$18,436 |
$22,867 |
$18,966 |
06/30/21 |
$18,671 |
$23,401 |
$19,202 |
07/31/21 |
$18,784 |
$23,956 |
$19,334 |
08/31/21 |
$19,103 |
$24,685 |
$19,681 |
09/30/21 |
$18,441 |
$23,537 |
$19,035 |
10/31/21 |
$19,135 |
$25,186 |
$19,736 |
11/30/21 |
$18,728 |
$25,011 |
$19,344 |
12/31/21 |
$19,264 |
$26,132 |
$19,892 |
01/31/22 |
$18,427 |
$24,780 |
$18,971 |
02/28/22 |
$18,012 |
$24,038 |
$18,616 |
03/31/22 |
$18,076 |
$24,931 |
$18,704 |
04/30/22 |
$16,762 |
$22,757 |
$17,367 |
05/31/22 |
$16,813 |
$22,798 |
$17,375 |
06/30/22 |
$15,652 |
$20,916 |
$16,174 |
07/31/22 |
$16,596 |
$22,845 |
$17,140 |
08/31/22 |
$15,984 |
$21,913 |
$16,562 |
09/30/22 |
$14,619 |
$19,895 |
$15,156 |
10/31/22 |
$15,206 |
$21,506 |
$15,746 |
11/30/22 |
$16,290 |
$22,708 |
$16,820 |
12/31/22 |
$15,738 |
$21,399 |
$16,323 |
01/31/23 |
$16,796 |
$22,744 |
$17,397 |
02/28/23 |
$16,300 |
$22,189 |
$16,910 |
03/31/23 |
$16,702 |
$23,004 |
$17,312 |
04/30/23 |
$16,862 |
$23,363 |
$17,484 |
05/31/23 |
$16,608 |
$23,464 |
$17,244 |
06/30/23 |
$17,317 |
$25,015 |
$17,979 |
07/31/23 |
$17,759 |
$25,818 |
$18,460 |
08/31/23 |
$17,304 |
$25,407 |
$17,987 |
09/30/23 |
$16,581 |
$24,196 |
$17,250 |
10/31/23 |
$16,046 |
$23,687 |
$16,678 |
11/30/23 |
$17,371 |
$25,850 |
$18,079 |
12/31/23 |
$18,310 |
$27,025 |
$19,080 |
01/31/24 |
$18,241 |
$27,479 |
$19,029 |
02/29/24 |
$18,726 |
$28,946 |
$19,514 |
03/31/24 |
$19,183 |
$29,878 |
$20,021 |
04/30/24 |
$18,504 |
$28,657 |
$19,336 |
05/31/24 |
$19,169 |
$30,078 |
$19,983 |
06/30/24 |
$19,405 |
$31,157 |
$20,267 |
07/31/24 |
$19,876 |
$31,537 |
$20,769 |
08/31/24 |
$20,292 |
$32,302 |
$21,205 |
09/30/24 |
$20,694 |
$32,992 |
$21,652 |
10/31/24 |
$20,126 |
$32,692 |
$21,078 |
11/30/24 |
$20,763 |
$34,611 |
$21,729 |
12/31/24 |
$20,151 |
$33,786 |
$21,117 |
01/31/25 |
$20,660 |
$34,727 |
$21,663 |
02/28/25 |
$20,762 |
$34,274 |
$21,724 |
03/31/25 |
$20,238 |
$32,343 |
$21,168 |
04/30/25 |
$20,354 |
$32,124 |
$21,337 |
05/31/25 |
$21,096 |
$34,146 |
$22,120 |
06/30/25 |
$21,867 |
$35,882 |
$22,943 |
07/31/25 |
$21,984 |
$36,687 |
$23,106 |
08/31/25 |
$22,508 |
$37,431 |
$23,636 |
09/30/25 |
$23,148 |
$38,797 |
$24,311 |
10/31/25 |
$23,497 |
$39,706 |
$24,692 |
11/30/25 |
$23,555 |
$39,803 |
$24,763 |
12/31/25 |
$23,688 |
$39,827 |
$24,924 |
|
| Average Annual Return [Table Text Block] |
Name |
1 Year |
5 Years |
10 Years |
SSAZXFootnote Reference(1) |
17.56% |
6.54% |
9.01% |
S&P 500 Index |
17.88% |
14.42% |
14.82% |
State Street Target Retirement 2035 Composite Index |
18.03% |
7.09% |
9.56% | |
| Updated Performance Information Location [Text Block] |
Updated performance information is available by calling 1-800-647-7327 or visiting our website at www.ssga.com.
|
| AssetsNet |
$ 3,506,801,386
|
| Holdings Count | Holding |
10
|
| Advisory Fees Paid, Amount |
$ 0
|
| InvestmentCompanyPortfolioTurnover |
19.00%
|
| Additional Fund Statistics [Text Block] |
Key Fund Statistics as of 12/31/2025- Total Net Assets$3,506,801,386
- Number of Portfolio Holdings10
- Portfolio Turnover Rate19%
- Total Advisory Fees Paid$0
|
| Holdings [Text Block] |
Asset Types |
% |
Domestic Equity |
39.0% |
Domestic Fixed Income |
30.0% |
International Equity |
28.7% |
Short-Term Investments |
4.0% |
Inflation Linked |
2.0% |
Real Estate |
0.5% | |
| Largest Holdings [Text Block] |
Holdings |
% |
State Street Equity 500 Index II Portfolio |
33.1% |
State Street Global All Cap Equity ex-U.S. Index Portfolio |
28.7% |
State Street Aggregate Bond Index Portfolio |
16.1% |
State Street SPDR Portfolio Long Term Treasury ETF |
8.8% |
State Street Small/Mid Cap Equity Index Portfolio |
5.9% |
State Street SPDR Bloomberg High Yield Bond ETF |
5.1% |
State Street SPDR Bloomberg 1-10 Year TIPS ETF |
2.0% |
SPDR Dow Jones Global Real Estate ETF |
0.5% | |
| Material Fund Change [Text Block] |
|
| C000143876 |
|
| Shareholder Report [Line Items] |
|
| Fund Name |
State Street Target Retirement 2035 Fund
|
| Class Name |
Class I
|
| Trading Symbol |
SSCJX
|
| Annual or Semi-Annual Statement [Text Block] |
This annual shareholder report contains important information about the State Street Target Retirement 2035 Fund (the "Fund") for the period of January 1, 2025 through December 31, 2025.
|
| Additional Information [Text Block] |
You can find additional information about the Fund, including the Prospectus, Statement of Additional Information, financial statements and other information at www.ssga.com/us/en/institutional/fund-finder?tab=documents&type=mf. You can also request this information about the Fund by contacting us at 1-800-647-7327.
|
| Additional Information Phone Number |
1-800-647-7327
|
| Additional Information Website |
www.ssga.com/us/en/institutional/fund-finder?tab=documents&type=mf
|
| Expenses [Text Block] |
What were the Fund costs for the last year? (based on a hypothetical $10,000 Investment)
Class Name |
Costs of a $10,000 investment |
Costs paid as a percentage of a $10,000 investment |
Class I |
$20 |
0.18% | Does not include expenses of the Underlying Funds in which the Fund invests. |
| Expenses Paid, Amount |
$ 20
|
| Expense Ratio, Percent |
0.18%
|
| Factors Affecting Performance [Text Block] |
How did the Fund perform last year and what affected its performance?The main driver of the Fund’s performance on an absolute basis during the reporting period was its position in the State Street Global Equity ex-US Index Portfolio which returned approximately 32.7% for the reporting period. On an individual security level, the top positive contributors to the Fund’s performance on an absolute basis during the reporting period were the State Street Global Equity ex-US Index Portfolio, the State Street Equity 500 Index II Portfolio, and the State Street Aggregate Bond Index Portfolio. There were no negative contributors to the Fund’s performance on an absolute basis during the reporting period. |
| Performance Past Does Not Indicate Future [Text] |
The Fund’s past performance is not necessarily an indication of how the Fund will perform in the future. The returns do not reflect the deduction of taxes that a shareholder would pay on Fund distributions or on the redemption or sale of Fund shares.
|
| Line Graph [Table Text Block] |

|
SSCJX |
S&P 500 Index |
State Street Target Retirement 2035 Composite Index |
12/31/15 |
$10,000 |
$10,000 |
$10,000 |
01/31/16 |
$9,591 |
$9,504 |
$9,548 |
02/29/16 |
$9,570 |
$9,491 |
$9,551 |
03/31/16 |
$10,154 |
$10,135 |
$10,135 |
04/30/16 |
$10,287 |
$10,174 |
$10,254 |
05/31/16 |
$10,328 |
$10,357 |
$10,300 |
06/30/16 |
$10,399 |
$10,384 |
$10,338 |
07/31/16 |
$10,768 |
$10,766 |
$10,741 |
08/31/16 |
$10,788 |
$10,782 |
$10,769 |
09/30/16 |
$10,839 |
$10,784 |
$10,807 |
10/31/16 |
$10,594 |
$10,587 |
$10,581 |
11/30/16 |
$10,676 |
$10,979 |
$10,660 |
12/31/16 |
$10,861 |
$11,196 |
$10,845 |
01/31/17 |
$11,079 |
$11,408 |
$11,075 |
02/28/17 |
$11,361 |
$11,861 |
$11,352 |
03/31/17 |
$11,444 |
$11,875 |
$11,438 |
04/30/17 |
$11,600 |
$11,997 |
$11,601 |
05/31/17 |
$11,798 |
$12,166 |
$11,801 |
06/30/17 |
$11,871 |
$12,242 |
$11,876 |
07/31/17 |
$12,110 |
$12,494 |
$12,115 |
08/31/17 |
$12,194 |
$12,532 |
$12,194 |
09/30/17 |
$12,381 |
$12,790 |
$12,390 |
10/31/17 |
$12,579 |
$13,089 |
$12,593 |
11/30/17 |
$12,818 |
$13,490 |
$12,820 |
12/31/17 |
$12,985 |
$13,640 |
$12,996 |
01/31/18 |
$13,475 |
$14,421 |
$13,488 |
02/28/18 |
$12,964 |
$13,890 |
$12,993 |
03/31/18 |
$12,868 |
$13,537 |
$12,853 |
04/30/18 |
$12,878 |
$13,589 |
$12,903 |
05/31/18 |
$13,027 |
$13,916 |
$13,037 |
06/30/18 |
$13,006 |
$14,002 |
$13,009 |
07/31/18 |
$13,283 |
$14,523 |
$13,286 |
08/31/18 |
$13,454 |
$14,996 |
$13,467 |
09/30/18 |
$13,433 |
$15,081 |
$13,438 |
10/31/18 |
$12,548 |
$14,050 |
$12,556 |
11/30/18 |
$12,740 |
$14,337 |
$12,747 |
12/31/18 |
$12,092 |
$13,042 |
$12,094 |
01/31/19 |
$12,920 |
$14,087 |
$12,914 |
02/28/19 |
$13,200 |
$14,540 |
$13,209 |
03/31/19 |
$13,402 |
$14,822 |
$13,402 |
04/30/19 |
$13,738 |
$15,422 |
$13,744 |
05/31/19 |
$13,200 |
$14,442 |
$13,196 |
06/30/19 |
$13,906 |
$15,460 |
$13,911 |
07/31/19 |
$13,939 |
$15,682 |
$13,966 |
08/31/19 |
$13,872 |
$15,434 |
$13,875 |
09/30/19 |
$14,029 |
$15,723 |
$14,041 |
10/31/19 |
$14,309 |
$16,063 |
$14,318 |
11/30/19 |
$14,600 |
$16,646 |
$14,620 |
12/31/19 |
$14,948 |
$17,149 |
$14,974 |
01/31/20 |
$14,924 |
$17,142 |
$14,978 |
02/29/20 |
$14,185 |
$15,731 |
$14,188 |
03/31/20 |
$12,695 |
$13,788 |
$12,733 |
04/30/20 |
$13,851 |
$15,555 |
$13,893 |
05/31/20 |
$14,400 |
$16,296 |
$14,418 |
06/30/20 |
$14,793 |
$16,620 |
$14,797 |
07/31/20 |
$15,461 |
$17,558 |
$15,487 |
08/31/20 |
$16,092 |
$18,820 |
$16,138 |
09/30/20 |
$15,735 |
$18,105 |
$15,757 |
10/31/20 |
$15,425 |
$17,623 |
$15,455 |
11/30/20 |
$16,987 |
$19,552 |
$17,032 |
12/31/20 |
$17,646 |
$20,304 |
$17,700 |
01/31/21 |
$17,547 |
$20,099 |
$17,612 |
02/28/21 |
$17,796 |
$20,653 |
$17,866 |
03/31/21 |
$18,033 |
$21,558 |
$18,100 |
04/30/21 |
$18,656 |
$22,708 |
$18,736 |
05/31/21 |
$18,868 |
$22,867 |
$18,966 |
06/30/21 |
$19,117 |
$23,401 |
$19,202 |
07/31/21 |
$19,241 |
$23,956 |
$19,334 |
08/31/21 |
$19,478 |
$24,685 |
$19,681 |
09/30/21 |
$18,818 |
$23,537 |
$19,035 |
10/31/21 |
$19,528 |
$25,186 |
$19,736 |
11/30/21 |
$19,117 |
$25,011 |
$19,344 |
12/31/21 |
$19,655 |
$26,132 |
$19,892 |
01/31/22 |
$18,801 |
$24,780 |
$18,971 |
02/28/22 |
$18,393 |
$24,038 |
$18,616 |
03/31/22 |
$18,459 |
$24,931 |
$18,704 |
04/30/22 |
$17,119 |
$22,757 |
$17,367 |
05/31/22 |
$17,185 |
$22,798 |
$17,375 |
06/30/22 |
$16,002 |
$20,916 |
$16,174 |
07/31/22 |
$16,961 |
$22,845 |
$17,140 |
08/31/22 |
$16,344 |
$21,913 |
$16,562 |
09/30/22 |
$14,964 |
$19,895 |
$15,156 |
10/31/22 |
$15,556 |
$21,506 |
$15,746 |
11/30/22 |
$16,672 |
$22,708 |
$16,820 |
12/31/22 |
$16,114 |
$21,399 |
$16,323 |
01/31/23 |
$17,193 |
$22,744 |
$17,397 |
02/28/23 |
$16,695 |
$22,189 |
$16,910 |
03/31/23 |
$17,110 |
$23,004 |
$17,312 |
04/30/23 |
$17,276 |
$23,363 |
$17,484 |
05/31/23 |
$17,027 |
$23,464 |
$17,244 |
06/30/23 |
$17,775 |
$25,015 |
$17,979 |
07/31/23 |
$18,232 |
$25,818 |
$18,460 |
08/31/23 |
$17,761 |
$25,407 |
$17,987 |
09/30/23 |
$17,027 |
$24,196 |
$17,250 |
10/31/23 |
$16,487 |
$23,687 |
$16,678 |
11/30/23 |
$17,844 |
$25,850 |
$18,079 |
12/31/23 |
$18,805 |
$27,025 |
$19,080 |
01/31/24 |
$18,748 |
$27,479 |
$19,029 |
02/29/24 |
$19,252 |
$28,946 |
$19,514 |
03/31/24 |
$19,727 |
$29,878 |
$20,021 |
04/30/24 |
$19,036 |
$28,657 |
$19,336 |
05/31/24 |
$19,727 |
$30,078 |
$19,983 |
06/30/24 |
$19,971 |
$31,157 |
$20,267 |
07/31/24 |
$20,461 |
$31,537 |
$20,769 |
08/31/24 |
$20,893 |
$32,302 |
$21,205 |
09/30/24 |
$21,325 |
$32,992 |
$21,652 |
10/31/24 |
$20,735 |
$32,692 |
$21,078 |
11/30/24 |
$21,411 |
$34,611 |
$21,729 |
12/31/24 |
$20,778 |
$33,786 |
$21,117 |
01/31/25 |
$21,309 |
$34,727 |
$21,663 |
02/28/25 |
$21,416 |
$34,274 |
$21,724 |
03/31/25 |
$20,869 |
$32,343 |
$21,168 |
04/30/25 |
$21,021 |
$32,124 |
$21,337 |
05/31/25 |
$21,780 |
$34,146 |
$22,120 |
06/30/25 |
$22,599 |
$35,882 |
$22,943 |
07/31/25 |
$22,721 |
$36,687 |
$23,106 |
08/31/25 |
$23,267 |
$37,431 |
$23,636 |
09/30/25 |
$23,935 |
$38,797 |
$24,311 |
10/31/25 |
$24,315 |
$39,706 |
$24,692 |
11/30/25 |
$24,375 |
$39,803 |
$24,763 |
12/31/25 |
$24,497 |
$39,827 |
$24,924 |
|
| Average Annual Return [Table Text Block] |
Name |
1 Year |
5 Years |
10 Years |
SSCJX |
17.90% |
6.78% |
9.37% |
S&P 500 Index |
17.88% |
14.42% |
14.82% |
State Street Target Retirement 2035 Composite Index |
18.03% |
7.09% |
9.56% | |
| Updated Performance Information Location [Text Block] |
Updated performance information is available by calling 1-800-647-7327 or visiting our website at www.ssga.com.
|
| AssetsNet |
$ 3,506,801,386
|
| Holdings Count | Holding |
10
|
| Advisory Fees Paid, Amount |
$ 0
|
| InvestmentCompanyPortfolioTurnover |
19.00%
|
| Additional Fund Statistics [Text Block] |
Key Fund Statistics as of 12/31/2025- Total Net Assets$3,506,801,386
- Number of Portfolio Holdings10
- Portfolio Turnover Rate19%
- Total Advisory Fees Paid$0
|
| Holdings [Text Block] |
Asset Types |
% |
Domestic Equity |
39.0% |
Domestic Fixed Income |
30.0% |
International Equity |
28.7% |
Short-Term Investments |
4.0% |
Inflation Linked |
2.0% |
Real Estate |
0.5% | |
| Largest Holdings [Text Block] |
Holdings |
% |
State Street Equity 500 Index II Portfolio |
33.1% |
State Street Global All Cap Equity ex-U.S. Index Portfolio |
28.7% |
State Street Aggregate Bond Index Portfolio |
16.1% |
State Street SPDR Portfolio Long Term Treasury ETF |
8.8% |
State Street Small/Mid Cap Equity Index Portfolio |
5.9% |
State Street SPDR Bloomberg High Yield Bond ETF |
5.1% |
State Street SPDR Bloomberg 1-10 Year TIPS ETF |
2.0% |
SPDR Dow Jones Global Real Estate ETF |
0.5% | |
| Material Fund Change [Text Block] |
|
| C000143877 |
|
| Shareholder Report [Line Items] |
|
| Fund Name |
State Street Target Retirement 2035 Fund
|
| Class Name |
Class K
|
| Trading Symbol |
SSCKX
|
| Annual or Semi-Annual Statement [Text Block] |
This annual shareholder report contains important information about the State Street Target Retirement 2035 Fund (the "Fund") for the period of January 1, 2025 through December 31, 2025.
|
| Additional Information [Text Block] |
You can find additional information about the Fund, including the Prospectus, Statement of Additional Information, financial statements and other information at www.ssga.com/us/en/institutional/fund-finder?tab=documents&type=mf. You can also request this information about the Fund by contacting us at 1-800-647-7327.
|
| Additional Information Phone Number |
1-800-647-7327
|
| Additional Information Website |
www.ssga.com/us/en/institutional/fund-finder?tab=documents&type=mf
|
| Expenses [Text Block] |
What were the Fund costs for the last year? (based on a hypothetical $10,000 Investment)
Class Name |
Costs of a $10,000 investment |
Costs paid as a percentage of a $10,000 investment |
Class K |
$4 |
0.04% | Does not include expenses of the Underlying Funds in which the Fund invests. |
| Expenses Paid, Amount |
$ 4
|
| Expense Ratio, Percent |
0.04%
|
| Factors Affecting Performance [Text Block] |
How did the Fund perform last year and what affected its performance?The main driver of the Fund’s performance on an absolute basis during the reporting period was its position in the State Street Global Equity ex-US Index Portfolio which returned approximately 32.7% for the reporting period. On an individual security level, the top positive contributors to the Fund’s performance on an absolute basis during the reporting period were the State Street Global Equity ex-US Index Portfolio, the State Street Equity 500 Index II Portfolio, and the State Street Aggregate Bond Index Portfolio. There were no negative contributors to the Fund’s performance on an absolute basis during the reporting period. |
| Performance Past Does Not Indicate Future [Text] |
The Fund’s past performance is not necessarily an indication of how the Fund will perform in the future. The returns do not reflect the deduction of taxes that a shareholder would pay on Fund distributions or on the redemption or sale of Fund shares.
|
| Line Graph [Table Text Block] |
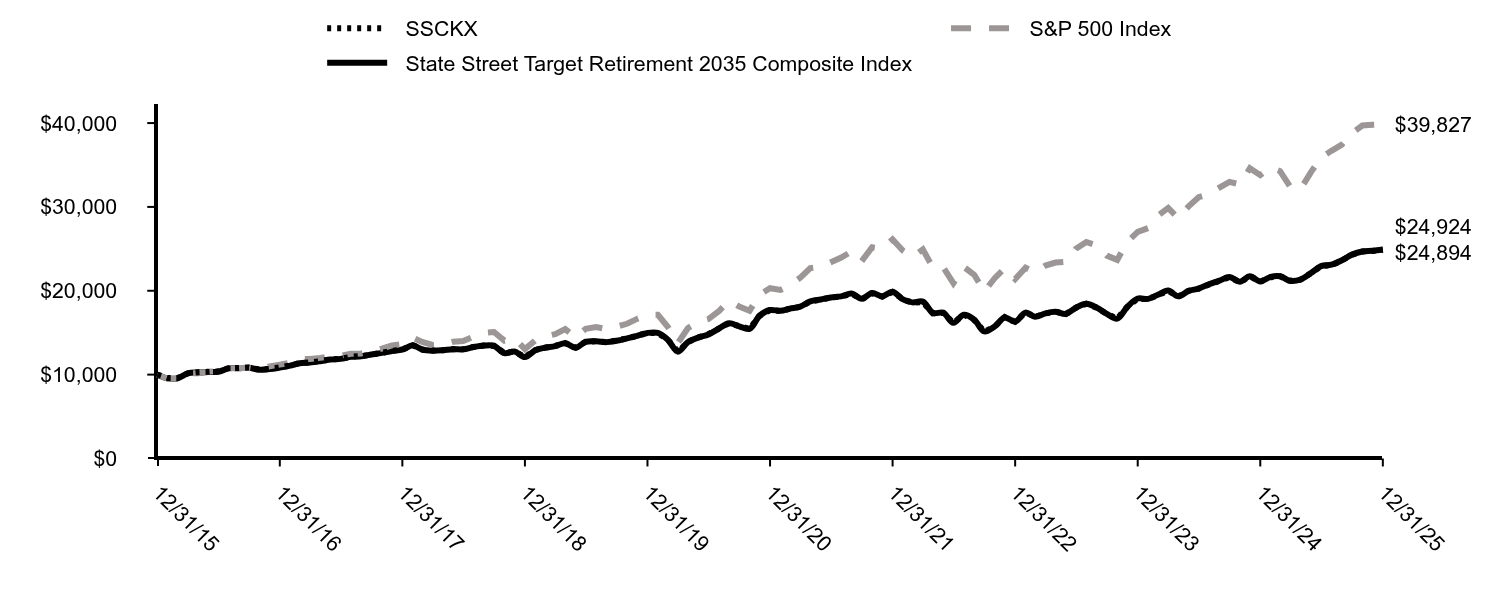
|
SSCKX |
S&P 500 Index |
State Street Target Retirement 2035 Composite Index |
12/31/15 |
$10,000 |
$10,000 |
$10,000 |
01/31/16 |
$9,591 |
$9,504 |
$9,548 |
02/29/16 |
$9,571 |
$9,491 |
$9,551 |
03/31/16 |
$10,153 |
$10,135 |
$10,135 |
04/30/16 |
$10,286 |
$10,174 |
$10,254 |
05/31/16 |
$10,327 |
$10,357 |
$10,300 |
06/30/16 |
$10,399 |
$10,384 |
$10,338 |
07/31/16 |
$10,767 |
$10,766 |
$10,741 |
08/31/16 |
$10,787 |
$10,782 |
$10,769 |
09/30/16 |
$10,849 |
$10,784 |
$10,807 |
10/31/16 |
$10,603 |
$10,587 |
$10,581 |
11/30/16 |
$10,675 |
$10,979 |
$10,660 |
12/31/16 |
$10,860 |
$11,196 |
$10,845 |
01/31/17 |
$11,089 |
$11,408 |
$11,075 |
02/28/17 |
$11,370 |
$11,861 |
$11,352 |
03/31/17 |
$11,453 |
$11,875 |
$11,438 |
04/30/17 |
$11,609 |
$11,997 |
$11,601 |
05/31/17 |
$11,806 |
$12,166 |
$11,801 |
06/30/17 |
$11,879 |
$12,242 |
$11,876 |
07/31/17 |
$12,129 |
$12,494 |
$12,115 |
08/31/17 |
$12,202 |
$12,532 |
$12,194 |
09/30/17 |
$12,399 |
$12,790 |
$12,390 |
10/31/17 |
$12,597 |
$13,089 |
$12,593 |
11/30/17 |
$12,836 |
$13,490 |
$12,820 |
12/31/17 |
$13,003 |
$13,640 |
$12,996 |
01/31/18 |
$13,492 |
$14,421 |
$13,488 |
02/28/18 |
$12,981 |
$13,890 |
$12,993 |
03/31/18 |
$12,875 |
$13,537 |
$12,853 |
04/30/18 |
$12,896 |
$13,589 |
$12,903 |
05/31/18 |
$13,045 |
$13,916 |
$13,037 |
06/30/18 |
$13,013 |
$14,002 |
$13,009 |
07/31/18 |
$13,301 |
$14,523 |
$13,286 |
08/31/18 |
$13,471 |
$14,996 |
$13,467 |
09/30/18 |
$13,450 |
$15,081 |
$13,438 |
10/31/18 |
$12,566 |
$14,050 |
$12,556 |
11/30/18 |
$12,758 |
$14,337 |
$12,747 |
12/31/18 |
$12,112 |
$13,042 |
$12,094 |
01/31/19 |
$12,940 |
$14,087 |
$12,914 |
02/28/19 |
$13,219 |
$14,540 |
$13,209 |
03/31/19 |
$13,421 |
$14,822 |
$13,402 |
04/30/19 |
$13,756 |
$15,422 |
$13,744 |
05/31/19 |
$13,219 |
$14,442 |
$13,196 |
06/30/19 |
$13,924 |
$15,460 |
$13,911 |
07/31/19 |
$13,969 |
$15,682 |
$13,966 |
08/31/19 |
$13,890 |
$15,434 |
$13,875 |
09/30/19 |
$14,058 |
$15,723 |
$14,041 |
10/31/19 |
$14,327 |
$16,063 |
$14,318 |
11/30/19 |
$14,628 |
$16,646 |
$14,620 |
12/31/19 |
$14,971 |
$17,149 |
$14,974 |
01/31/20 |
$14,948 |
$17,142 |
$14,978 |
02/29/20 |
$14,209 |
$15,731 |
$14,188 |
03/31/20 |
$12,720 |
$13,788 |
$12,733 |
04/30/20 |
$13,888 |
$15,555 |
$13,893 |
05/31/20 |
$14,436 |
$16,296 |
$14,418 |
06/30/20 |
$14,829 |
$16,620 |
$14,797 |
07/31/20 |
$15,496 |
$17,558 |
$15,487 |
08/31/20 |
$16,139 |
$18,820 |
$16,138 |
09/30/20 |
$15,769 |
$18,105 |
$15,757 |
10/31/20 |
$15,460 |
$17,623 |
$15,455 |
11/30/20 |
$17,020 |
$19,552 |
$17,032 |
12/31/20 |
$17,695 |
$20,304 |
$17,700 |
01/31/21 |
$17,595 |
$20,099 |
$17,612 |
02/28/21 |
$17,844 |
$20,653 |
$17,866 |
03/31/21 |
$18,093 |
$21,558 |
$18,100 |
04/30/21 |
$18,716 |
$22,708 |
$18,736 |
05/31/21 |
$18,940 |
$22,867 |
$18,966 |
06/30/21 |
$19,189 |
$23,401 |
$19,202 |
07/31/21 |
$19,313 |
$23,956 |
$19,334 |
08/31/21 |
$19,650 |
$24,685 |
$19,681 |
09/30/21 |
$18,977 |
$23,537 |
$19,035 |
10/31/21 |
$19,699 |
$25,186 |
$19,736 |
11/30/21 |
$19,288 |
$25,011 |
$19,344 |
12/31/21 |
$19,849 |
$26,132 |
$19,892 |
01/31/22 |
$18,994 |
$24,780 |
$18,971 |
02/28/22 |
$18,573 |
$24,038 |
$18,616 |
03/31/22 |
$18,652 |
$24,931 |
$18,704 |
04/30/22 |
$17,297 |
$22,757 |
$17,367 |
05/31/22 |
$17,363 |
$22,798 |
$17,375 |
06/30/22 |
$16,166 |
$20,916 |
$16,174 |
07/31/22 |
$17,153 |
$22,845 |
$17,140 |
08/31/22 |
$16,521 |
$21,913 |
$16,562 |
09/30/22 |
$15,127 |
$19,895 |
$15,156 |
10/31/22 |
$15,732 |
$21,506 |
$15,746 |
11/30/22 |
$16,863 |
$22,708 |
$16,820 |
12/31/22 |
$16,298 |
$21,399 |
$16,323 |
01/31/23 |
$17,407 |
$22,744 |
$17,397 |
02/28/23 |
$16,894 |
$22,189 |
$16,910 |
03/31/23 |
$17,310 |
$23,004 |
$17,312 |
04/30/23 |
$17,491 |
$23,363 |
$17,484 |
05/31/23 |
$17,227 |
$23,464 |
$17,244 |
06/30/23 |
$17,990 |
$25,015 |
$17,979 |
07/31/23 |
$18,448 |
$25,818 |
$18,460 |
08/31/23 |
$17,976 |
$25,407 |
$17,987 |
09/30/23 |
$17,241 |
$24,196 |
$17,250 |
10/31/23 |
$16,686 |
$23,687 |
$16,678 |
11/30/23 |
$18,073 |
$25,850 |
$18,079 |
12/31/23 |
$19,058 |
$27,025 |
$19,080 |
01/31/24 |
$18,986 |
$27,479 |
$19,029 |
02/29/24 |
$19,491 |
$28,946 |
$19,514 |
03/31/24 |
$19,996 |
$29,878 |
$20,021 |
04/30/24 |
$19,289 |
$28,657 |
$19,336 |
05/31/24 |
$19,996 |
$30,078 |
$19,983 |
06/30/24 |
$20,242 |
$31,157 |
$20,267 |
07/31/24 |
$20,747 |
$31,537 |
$20,769 |
08/31/24 |
$21,180 |
$32,302 |
$21,205 |
09/30/24 |
$21,628 |
$32,992 |
$21,652 |
10/31/24 |
$21,021 |
$32,692 |
$21,078 |
11/30/24 |
$21,714 |
$34,611 |
$21,729 |
12/31/24 |
$21,081 |
$33,786 |
$21,117 |
01/31/25 |
$21,614 |
$34,727 |
$21,663 |
02/28/25 |
$21,721 |
$34,274 |
$21,724 |
03/31/25 |
$21,188 |
$32,343 |
$21,168 |
04/30/25 |
$21,325 |
$32,124 |
$21,337 |
05/31/25 |
$22,102 |
$34,146 |
$22,120 |
06/30/25 |
$22,940 |
$35,882 |
$22,943 |
07/31/25 |
$23,061 |
$36,687 |
$23,106 |
08/31/25 |
$23,625 |
$37,431 |
$23,636 |
09/30/25 |
$24,295 |
$38,797 |
$24,311 |
10/31/25 |
$24,676 |
$39,706 |
$24,692 |
11/30/25 |
$24,752 |
$39,803 |
$24,763 |
12/31/25 |
$24,894 |
$39,827 |
$24,924 |
|
| Average Annual Return [Table Text Block] |
Name |
1 Year |
5 Years |
10 Years |
SSCKX |
18.09% |
7.07% |
9.55% |
S&P 500 Index |
17.88% |
14.42% |
14.82% |
State Street Target Retirement 2035 Composite Index |
18.03% |
7.09% |
9.56% | |
| Updated Performance Information Location [Text Block] |
Updated performance information is available by calling 1-800-647-7327 or visiting our website at www.ssga.com.
|
| AssetsNet |
$ 3,506,801,386
|
| Holdings Count | Holding |
10
|
| Advisory Fees Paid, Amount |
$ 0
|
| InvestmentCompanyPortfolioTurnover |
19.00%
|
| Additional Fund Statistics [Text Block] |
Key Fund Statistics as of 12/31/2025- Total Net Assets$3,506,801,386
- Number of Portfolio Holdings10
- Portfolio Turnover Rate19%
- Total Advisory Fees Paid$0
|
| Holdings [Text Block] |
Asset Types |
% |
Domestic Equity |
39.0% |
Domestic Fixed Income |
30.0% |
International Equity |
28.7% |
Short-Term Investments |
4.0% |
Inflation Linked |
2.0% |
Real Estate |
0.5% | |
| Largest Holdings [Text Block] |
Holdings |
% |
State Street Equity 500 Index II Portfolio |
33.1% |
State Street Global All Cap Equity ex-U.S. Index Portfolio |
28.7% |
State Street Aggregate Bond Index Portfolio |
16.1% |
State Street SPDR Portfolio Long Term Treasury ETF |
8.8% |
State Street Small/Mid Cap Equity Index Portfolio |
5.9% |
State Street SPDR Bloomberg High Yield Bond ETF |
5.1% |
State Street SPDR Bloomberg 1-10 Year TIPS ETF |
2.0% |
SPDR Dow Jones Global Real Estate ETF |
0.5% | |
| Material Fund Change [Text Block] |
|
| C000232298 |
|
| Shareholder Report [Line Items] |
|
| Fund Name |
State Street Target Retirement 2040 Fund
|
| Class Name |
Class R3
|
| Trading Symbol |
SSAKX
|
| Annual or Semi-Annual Statement [Text Block] |
This annual shareholder report contains important information about the State Street Target Retirement 2040 Fund (the "Fund") for the period of January 1, 2025 through December 31, 2025.
|
| Additional Information [Text Block] |
You can find additional information about the Fund, including the Prospectus, Statement of Additional Information, financial statements and other information at www.ssga.com/us/en/institutional/fund-finder?tab=documents&type=mf. You can also request this information about the Fund by contacting us at 1-800-647-7327.
|
| Additional Information Phone Number |
1-800-647-7327
|
| Additional Information Website |
www.ssga.com/us/en/institutional/fund-finder?tab=documents&type=mf
|
| Expenses [Text Block] |
What were the Fund costs for the last year? (based on a hypothetical $10,000 Investment)
Class Name |
Costs of a $10,000 investment |
Costs paid as a percentage of a $10,000 investment |
Class R3 |
$61 |
0.56% | Does not include expenses of the Underlying Funds in which the Fund invests. |
| Expenses Paid, Amount |
$ 61
|
| Expense Ratio, Percent |
0.56%
|
| Factors Affecting Performance [Text Block] |
How did the Fund perform last year and what affected its performance?The main driver of the Fund’s performance on an absolute basis during the reporting period was its position in the State Street Global Equity ex-US Index Portfolio which returned approximately 32.7% for the reporting period. On an individual security level, the top positive contributors to the Fund’s performance on an absolute basis during the reporting period were the State Street Global Equity ex-US Index Portfolio, the State Street Equity 500 Index II Portfolio, and the State Street Small/Mid Cap Equity Index Portfolio. There were no negative contributors to the Fund’s performance on an absolute basis during the reporting period. |
| Performance Past Does Not Indicate Future [Text] |
The Fund’s past performance is not necessarily an indication of how the Fund will perform in the future. The returns do not reflect the deduction of taxes that a shareholder would pay on Fund distributions or on the redemption or sale of Fund shares.
|
| Line Graph [Table Text Block] |

|
SSAKX |
S&P 500 Index |
State Street Target Retirement 2040 Composite Index |
12/31/15 |
$10,000 |
$10,000 |
$10,000 |
01/31/16 |
$9,543 |
$9,504 |
$9,504 |
02/29/16 |
$9,509 |
$9,491 |
$9,502 |
03/31/16 |
$10,121 |
$10,135 |
$10,118 |
04/30/16 |
$10,251 |
$10,174 |
$10,244 |
05/31/16 |
$10,288 |
$10,357 |
$10,292 |
06/30/16 |
$10,345 |
$10,384 |
$10,318 |
07/31/16 |
$10,720 |
$10,766 |
$10,743 |
08/31/16 |
$10,746 |
$10,782 |
$10,775 |
09/30/16 |
$10,804 |
$10,784 |
$10,819 |
10/31/16 |
$10,543 |
$10,587 |
$10,582 |
11/30/16 |
$10,651 |
$10,979 |
$10,691 |
12/31/16 |
$10,835 |
$11,196 |
$10,887 |
01/31/17 |
$11,070 |
$11,408 |
$11,131 |
02/28/17 |
$11,347 |
$11,861 |
$11,418 |
03/31/17 |
$11,436 |
$11,875 |
$11,511 |
04/30/17 |
$11,597 |
$11,997 |
$11,680 |
05/31/17 |
$11,790 |
$12,166 |
$11,883 |
06/30/17 |
$11,868 |
$12,242 |
$11,967 |
07/31/17 |
$12,113 |
$12,494 |
$12,219 |
08/31/17 |
$12,180 |
$12,532 |
$12,293 |
09/30/17 |
$12,393 |
$12,790 |
$12,512 |
10/31/17 |
$12,606 |
$13,089 |
$12,727 |
11/30/17 |
$12,850 |
$13,490 |
$12,971 |
12/31/17 |
$13,012 |
$13,640 |
$13,153 |
01/31/18 |
$13,536 |
$14,421 |
$13,690 |
02/28/18 |
$12,991 |
$13,890 |
$13,166 |
03/31/18 |
$12,868 |
$13,537 |
$13,015 |
04/30/18 |
$12,895 |
$13,589 |
$13,076 |
05/31/18 |
$13,038 |
$13,916 |
$13,218 |
06/30/18 |
$13,011 |
$14,002 |
$13,188 |
07/31/18 |
$13,302 |
$14,523 |
$13,484 |
08/31/18 |
$13,476 |
$14,996 |
$13,675 |
09/30/18 |
$13,438 |
$15,081 |
$13,646 |
10/31/18 |
$12,503 |
$14,050 |
$12,693 |
11/30/18 |
$12,699 |
$14,337 |
$12,894 |
12/31/18 |
$11,973 |
$13,042 |
$12,166 |
01/31/19 |
$12,844 |
$14,087 |
$13,043 |
02/28/19 |
$13,139 |
$14,540 |
$13,364 |
03/31/19 |
$13,322 |
$14,822 |
$13,547 |
04/30/19 |
$13,682 |
$15,422 |
$13,917 |
05/31/19 |
$13,078 |
$14,442 |
$13,304 |
06/30/19 |
$13,814 |
$15,460 |
$14,064 |
07/31/19 |
$13,841 |
$15,682 |
$14,121 |
08/31/19 |
$13,725 |
$15,434 |
$13,985 |
09/30/19 |
$13,896 |
$15,723 |
$14,171 |
10/31/19 |
$14,189 |
$16,063 |
$14,469 |
11/30/19 |
$14,503 |
$16,646 |
$14,799 |
12/31/19 |
$14,851 |
$17,149 |
$15,182 |
01/31/20 |
$14,810 |
$17,142 |
$15,159 |
02/29/20 |
$13,982 |
$15,731 |
$14,276 |
03/31/20 |
$12,394 |
$13,788 |
$12,683 |
04/30/20 |
$13,584 |
$15,555 |
$13,909 |
05/31/20 |
$14,141 |
$16,296 |
$14,467 |
06/30/20 |
$14,557 |
$16,620 |
$14,875 |
07/31/20 |
$15,230 |
$17,558 |
$15,593 |
08/31/20 |
$15,914 |
$18,820 |
$16,310 |
09/30/20 |
$15,533 |
$18,105 |
$15,902 |
10/31/20 |
$15,199 |
$17,623 |
$15,584 |
11/30/20 |
$16,852 |
$19,552 |
$17,298 |
12/31/20 |
$17,555 |
$20,304 |
$18,031 |
01/31/21 |
$17,462 |
$20,099 |
$17,953 |
02/28/21 |
$17,760 |
$20,653 |
$18,259 |
03/31/21 |
$18,009 |
$21,558 |
$18,525 |
04/30/21 |
$18,673 |
$22,708 |
$19,215 |
05/31/21 |
$18,897 |
$22,867 |
$19,463 |
06/30/21 |
$19,133 |
$23,401 |
$19,711 |
07/31/21 |
$19,247 |
$23,956 |
$19,832 |
08/31/21 |
$19,604 |
$24,685 |
$20,217 |
09/30/21 |
$18,877 |
$23,537 |
$19,510 |
10/31/21 |
$19,661 |
$25,186 |
$20,293 |
11/30/21 |
$19,190 |
$25,011 |
$19,842 |
12/31/21 |
$19,764 |
$26,132 |
$20,438 |
01/31/22 |
$18,868 |
$24,780 |
$19,440 |
02/28/22 |
$18,437 |
$24,038 |
$19,068 |
03/31/22 |
$18,540 |
$24,931 |
$19,204 |
04/30/22 |
$17,125 |
$22,757 |
$17,772 |
05/31/22 |
$17,177 |
$22,798 |
$17,770 |
06/30/22 |
$15,930 |
$20,916 |
$16,482 |
07/31/22 |
$16,920 |
$22,845 |
$17,501 |
08/31/22 |
$16,303 |
$21,913 |
$16,908 |
09/30/22 |
$14,850 |
$19,895 |
$15,406 |
10/31/22 |
$15,493 |
$21,506 |
$16,064 |
11/30/22 |
$16,650 |
$22,708 |
$17,212 |
12/31/22 |
$16,046 |
$21,399 |
$16,665 |
01/31/23 |
$17,193 |
$22,744 |
$17,821 |
02/28/23 |
$16,667 |
$22,189 |
$17,315 |
03/31/23 |
$17,072 |
$23,004 |
$17,716 |
04/30/23 |
$17,234 |
$23,363 |
$17,890 |
05/31/23 |
$16,977 |
$23,464 |
$17,642 |
06/30/23 |
$17,773 |
$25,015 |
$18,466 |
07/31/23 |
$18,273 |
$25,818 |
$19,012 |
08/31/23 |
$17,760 |
$25,407 |
$18,480 |
09/30/23 |
$16,991 |
$24,196 |
$17,692 |
10/31/23 |
$16,410 |
$23,687 |
$17,068 |
11/30/23 |
$17,814 |
$25,850 |
$18,567 |
12/31/23 |
$18,810 |
$27,025 |
$19,630 |
01/31/24 |
$18,740 |
$27,479 |
$19,571 |
02/29/24 |
$19,298 |
$28,946 |
$20,144 |
03/31/24 |
$19,814 |
$29,878 |
$20,699 |
04/30/24 |
$19,075 |
$28,657 |
$19,962 |
05/31/24 |
$19,800 |
$30,078 |
$20,664 |
06/30/24 |
$20,051 |
$31,157 |
$20,957 |
07/31/24 |
$20,553 |
$31,537 |
$21,491 |
08/31/24 |
$20,971 |
$32,302 |
$21,950 |
09/30/24 |
$21,403 |
$32,992 |
$22,426 |
10/31/24 |
$20,804 |
$32,692 |
$21,825 |
11/30/24 |
$21,529 |
$34,611 |
$22,557 |
12/31/24 |
$20,848 |
$33,786 |
$21,881 |
01/31/25 |
$21,416 |
$34,727 |
$22,495 |
02/28/25 |
$21,474 |
$34,274 |
$22,506 |
03/31/25 |
$20,877 |
$32,343 |
$21,874 |
04/30/25 |
$21,022 |
$32,124 |
$22,065 |
05/31/25 |
$21,867 |
$34,146 |
$22,967 |
06/30/25 |
$22,727 |
$35,882 |
$23,872 |
07/31/25 |
$22,858 |
$36,687 |
$24,061 |
08/31/25 |
$23,441 |
$37,431 |
$24,646 |
09/30/25 |
$24,140 |
$38,797 |
$25,397 |
10/31/25 |
$24,533 |
$39,706 |
$25,826 |
11/30/25 |
$24,592 |
$39,803 |
$25,889 |
12/31/25 |
$24,741 |
$39,827 |
$26,078 |
|
| Average Annual Return [Table Text Block] |
Name |
1 Year |
5 Years |
10 Years |
SSAKXFootnote Reference(1) |
18.68% |
7.10% |
9.48% |
S&P 500 Index |
17.88% |
14.42% |
14.82% |
State Street Target Retirement 2040 Composite Index |
19.18% |
7.66% |
10.06% | |
| Updated Performance Information Location [Text Block] |
Updated performance information is available by calling 1-800-647-7327 or visiting our website at www.ssga.com.
|
| AssetsNet |
$ 3,294,400,216
|
| Holdings Count | Holding |
7
|
| Advisory Fees Paid, Amount |
$ 0
|
| InvestmentCompanyPortfolioTurnover |
19.00%
|
| Additional Fund Statistics [Text Block] |
Key Fund Statistics as of 12/31/2025- Total Net Assets$3,294,400,216
- Number of Portfolio Holdings7
- Portfolio Turnover Rate19%
- Total Advisory Fees Paid$0
|
| Holdings [Text Block] |
Asset Types |
% |
Domestic Equity |
43.3% |
International Equity |
32.2% |
Domestic Fixed Income |
24.3% |
Short-Term Investments |
0.2% | |
| Largest Holdings [Text Block] |
Holdings |
% |
State Street Equity 500 Index II Portfolio |
35.7% |
State Street Global All Cap Equity ex-U.S. Index Portfolio |
32.2% |
State Street Aggregate Bond Index Portfolio |
12.0% |
State Street SPDR Portfolio Long Term Treasury ETF |
9.8% |
State Street Small/Mid Cap Equity Index Portfolio |
7.6% |
State Street SPDR Bloomberg High Yield Bond ETF |
2.5% | |
| Material Fund Change [Text Block] |
|
| C000143880 |
|
| Shareholder Report [Line Items] |
|
| Fund Name |
State Street Target Retirement 2040 Fund
|
| Class Name |
Class I
|
| Trading Symbol |
SSCNX
|
| Annual or Semi-Annual Statement [Text Block] |
This annual shareholder report contains important information about the State Street Target Retirement 2040 Fund (the "Fund") for the period of January 1, 2025 through December 31, 2025.
|
| Additional Information [Text Block] |
You can find additional information about the Fund, including the Prospectus, Statement of Additional Information, financial statements and other information at www.ssga.com/us/en/institutional/fund-finder?tab=documents&type=mf. You can also request this information about the Fund by contacting us at 1-800-647-7327.
|
| Additional Information Phone Number |
1-800-647-7327
|
| Additional Information Website |
www.ssga.com/us/en/institutional/fund-finder?tab=documents&type=mf
|
| Expenses [Text Block] |
What were the Fund costs for the last year? (based on a hypothetical $10,000 Investment)
Class Name |
Costs of a $10,000 investment |
Costs paid as a percentage of a $10,000 investment |
Class I |
$22 |
0.20% | Does not include expenses of the Underlying Funds in which the Fund invests. |
| Expenses Paid, Amount |
$ 22
|
| Expense Ratio, Percent |
0.20%
|
| Factors Affecting Performance [Text Block] |
How did the Fund perform last year and what affected its performance?The main driver of the Fund’s performance on an absolute basis during the reporting period was its position in the State Street Global Equity ex-US Index Portfolio which returned approximately 32.7% for the reporting period. On an individual security level, the top positive contributors to the Fund’s performance on an absolute basis during the reporting period were the State Street Global Equity ex-US Index Portfolio, the State Street Equity 500 Index II Portfolio, and the State Street Small/Mid Cap Equity Index Portfolio. There were no negative contributors to the Fund’s performance on an absolute basis during the reporting period. |
| Performance Past Does Not Indicate Future [Text] |
The Fund’s past performance is not necessarily an indication of how the Fund will perform in the future. The returns do not reflect the deduction of taxes that a shareholder would pay on Fund distributions or on the redemption or sale of Fund shares.
|
| Line Graph [Table Text Block] |
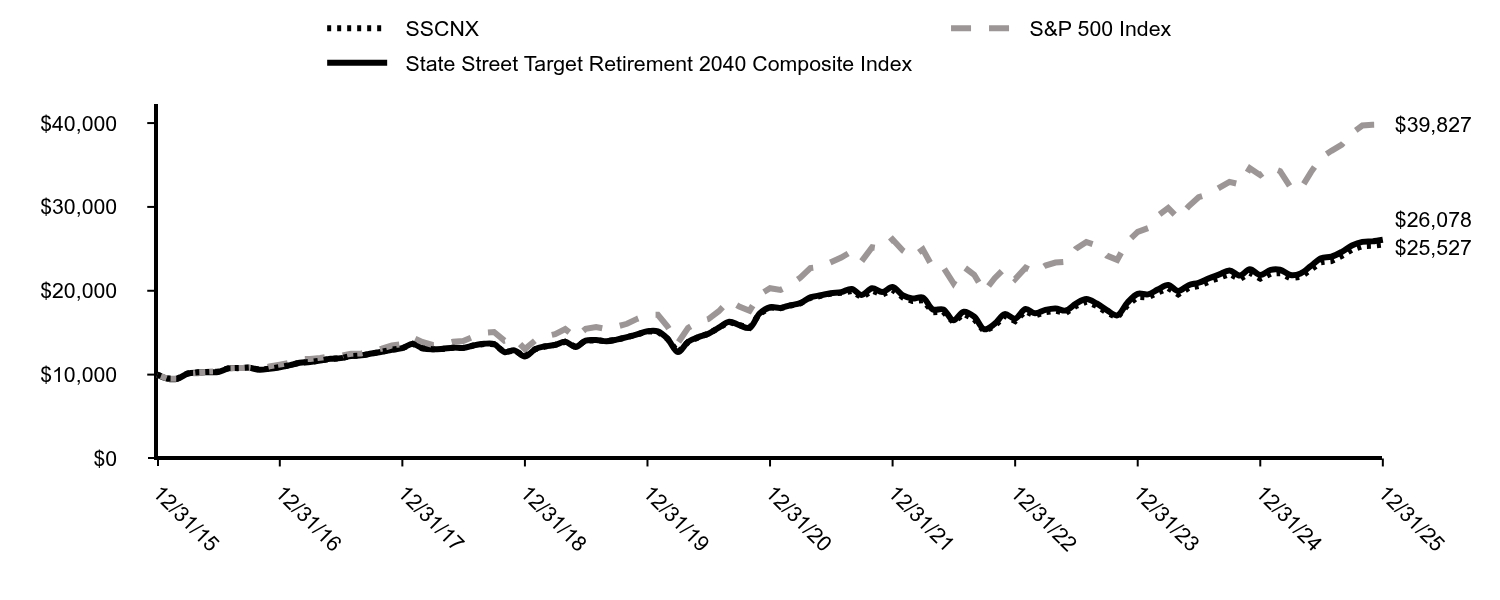
|
SSCNX |
S&P 500 Index |
State Street Target Retirement 2040 Composite Index |
12/31/15 |
$10,000 |
$10,000 |
$10,000 |
01/31/16 |
$9,547 |
$9,504 |
$9,504 |
02/29/16 |
$9,526 |
$9,491 |
$9,502 |
03/31/16 |
$10,144 |
$10,135 |
$10,118 |
04/30/16 |
$10,268 |
$10,174 |
$10,244 |
05/31/16 |
$10,319 |
$10,357 |
$10,292 |
06/30/16 |
$10,371 |
$10,384 |
$10,318 |
07/31/16 |
$10,762 |
$10,766 |
$10,743 |
08/31/16 |
$10,793 |
$10,782 |
$10,775 |
09/30/16 |
$10,855 |
$10,784 |
$10,819 |
10/31/16 |
$10,597 |
$10,587 |
$10,582 |
11/30/16 |
$10,711 |
$10,979 |
$10,691 |
12/31/16 |
$10,900 |
$11,196 |
$10,887 |
01/31/17 |
$11,131 |
$11,408 |
$11,131 |
02/28/17 |
$11,424 |
$11,861 |
$11,418 |
03/31/17 |
$11,508 |
$11,875 |
$11,511 |
04/30/17 |
$11,676 |
$11,997 |
$11,680 |
05/31/17 |
$11,875 |
$12,166 |
$11,883 |
06/30/17 |
$11,959 |
$12,242 |
$11,967 |
07/31/17 |
$12,221 |
$12,494 |
$12,219 |
08/31/17 |
$12,284 |
$12,532 |
$12,293 |
09/30/17 |
$12,504 |
$12,790 |
$12,512 |
10/31/17 |
$12,724 |
$13,089 |
$12,727 |
11/30/17 |
$12,975 |
$13,490 |
$12,971 |
12/31/17 |
$13,145 |
$13,640 |
$13,153 |
01/31/18 |
$13,681 |
$14,421 |
$13,690 |
02/28/18 |
$13,134 |
$13,890 |
$13,166 |
03/31/18 |
$13,027 |
$13,537 |
$13,015 |
04/30/18 |
$13,048 |
$13,589 |
$13,076 |
05/31/18 |
$13,198 |
$13,916 |
$13,218 |
06/30/18 |
$13,177 |
$14,002 |
$13,188 |
07/31/18 |
$13,477 |
$14,523 |
$13,484 |
08/31/18 |
$13,659 |
$14,996 |
$13,675 |
09/30/18 |
$13,627 |
$15,081 |
$13,646 |
10/31/18 |
$12,683 |
$14,050 |
$12,693 |
11/30/18 |
$12,887 |
$14,337 |
$12,894 |
12/31/18 |
$12,164 |
$13,042 |
$12,166 |
01/31/19 |
$13,043 |
$14,087 |
$13,043 |
02/28/19 |
$13,347 |
$14,540 |
$13,364 |
03/31/19 |
$13,539 |
$14,822 |
$13,547 |
04/30/19 |
$13,911 |
$15,422 |
$13,917 |
05/31/19 |
$13,302 |
$14,442 |
$13,304 |
06/30/19 |
$14,058 |
$15,460 |
$14,064 |
07/31/19 |
$14,091 |
$15,682 |
$14,121 |
08/31/19 |
$13,979 |
$15,434 |
$13,985 |
09/30/19 |
$14,159 |
$15,723 |
$14,171 |
10/31/19 |
$14,463 |
$16,063 |
$14,469 |
11/30/19 |
$14,790 |
$16,646 |
$14,799 |
12/31/19 |
$15,161 |
$17,149 |
$15,182 |
01/31/20 |
$15,113 |
$17,142 |
$15,159 |
02/29/20 |
$14,274 |
$15,731 |
$14,276 |
03/31/20 |
$12,656 |
$13,788 |
$12,683 |
04/30/20 |
$13,879 |
$15,555 |
$13,909 |
05/31/20 |
$14,454 |
$16,296 |
$14,467 |
06/30/20 |
$14,886 |
$16,620 |
$14,875 |
07/31/20 |
$15,581 |
$17,558 |
$15,593 |
08/31/20 |
$16,288 |
$18,820 |
$16,310 |
09/30/20 |
$15,904 |
$18,105 |
$15,902 |
10/31/20 |
$15,569 |
$17,623 |
$15,584 |
11/30/20 |
$17,271 |
$19,552 |
$17,298 |
12/31/20 |
$17,996 |
$20,304 |
$18,031 |
01/31/21 |
$17,908 |
$20,099 |
$17,953 |
02/28/21 |
$18,209 |
$20,653 |
$18,259 |
03/31/21 |
$18,485 |
$21,558 |
$18,525 |
04/30/21 |
$19,150 |
$22,708 |
$19,215 |
05/31/21 |
$19,388 |
$22,867 |
$19,463 |
06/30/21 |
$19,651 |
$23,401 |
$19,711 |
07/31/21 |
$19,764 |
$23,956 |
$19,832 |
08/31/21 |
$19,965 |
$24,685 |
$20,217 |
09/30/21 |
$19,225 |
$23,537 |
$19,510 |
10/31/21 |
$20,015 |
$25,186 |
$20,293 |
11/30/21 |
$19,551 |
$25,011 |
$19,842 |
12/31/21 |
$20,111 |
$26,132 |
$20,438 |
01/31/22 |
$19,197 |
$24,780 |
$19,440 |
02/28/22 |
$18,774 |
$24,038 |
$19,068 |
03/31/22 |
$18,880 |
$24,931 |
$19,204 |
04/30/22 |
$17,450 |
$22,757 |
$17,772 |
05/31/22 |
$17,503 |
$22,798 |
$17,770 |
06/30/22 |
$16,245 |
$20,916 |
$16,482 |
07/31/22 |
$17,251 |
$22,845 |
$17,501 |
08/31/22 |
$16,629 |
$21,913 |
$16,908 |
09/30/22 |
$15,146 |
$19,895 |
$15,406 |
10/31/22 |
$15,821 |
$21,506 |
$16,064 |
11/30/22 |
$17,000 |
$22,708 |
$17,212 |
12/31/22 |
$16,389 |
$21,399 |
$16,665 |
01/31/23 |
$17,561 |
$22,744 |
$17,821 |
02/28/23 |
$17,031 |
$22,189 |
$17,315 |
03/31/23 |
$17,450 |
$23,004 |
$17,716 |
04/30/23 |
$17,617 |
$23,363 |
$17,890 |
05/31/23 |
$17,366 |
$23,464 |
$17,642 |
06/30/23 |
$18,176 |
$25,015 |
$18,466 |
07/31/23 |
$18,706 |
$25,818 |
$19,012 |
08/31/23 |
$18,176 |
$25,407 |
$18,480 |
09/30/23 |
$17,408 |
$24,196 |
$17,692 |
10/31/23 |
$16,807 |
$23,687 |
$17,068 |
11/30/23 |
$18,259 |
$25,850 |
$18,567 |
12/31/23 |
$19,281 |
$27,025 |
$19,630 |
01/31/24 |
$19,209 |
$27,479 |
$19,571 |
02/29/24 |
$19,788 |
$28,946 |
$20,144 |
03/31/24 |
$20,324 |
$29,878 |
$20,699 |
04/30/24 |
$19,571 |
$28,657 |
$19,962 |
05/31/24 |
$20,324 |
$30,078 |
$20,664 |
06/30/24 |
$20,570 |
$31,157 |
$20,957 |
07/31/24 |
$21,092 |
$31,537 |
$21,491 |
08/31/24 |
$21,541 |
$32,302 |
$21,950 |
09/30/24 |
$22,005 |
$32,992 |
$22,426 |
10/31/24 |
$21,382 |
$32,692 |
$21,825 |
11/30/24 |
$22,135 |
$34,611 |
$22,557 |
12/31/24 |
$21,449 |
$33,786 |
$21,881 |
01/31/25 |
$22,042 |
$34,727 |
$22,495 |
02/28/25 |
$22,102 |
$34,274 |
$22,506 |
03/31/25 |
$21,494 |
$32,343 |
$21,874 |
04/30/25 |
$21,646 |
$32,124 |
$22,065 |
05/31/25 |
$22,528 |
$34,146 |
$22,967 |
06/30/25 |
$23,410 |
$35,882 |
$23,872 |
07/31/25 |
$23,546 |
$36,687 |
$24,061 |
08/31/25 |
$24,170 |
$37,431 |
$24,646 |
09/30/25 |
$24,899 |
$38,797 |
$25,397 |
10/31/25 |
$25,325 |
$39,706 |
$25,826 |
11/30/25 |
$25,371 |
$39,803 |
$25,889 |
12/31/25 |
$25,527 |
$39,827 |
$26,078 |
|
| Average Annual Return [Table Text Block] |
Name |
1 Year |
5 Years |
10 Years |
SSCNX |
19.02% |
7.24% |
9.82% |
S&P 500 Index |
17.88% |
14.42% |
14.82% |
State Street Target Retirement 2040 Composite Index |
19.18% |
7.66% |
10.06% | |
| Updated Performance Information Location [Text Block] |
Updated performance information is available by calling 1-800-647-7327 or visiting our website at www.ssga.com.
|
| AssetsNet |
$ 3,294,400,216
|
| Holdings Count | Holding |
7
|
| Advisory Fees Paid, Amount |
$ 0
|
| InvestmentCompanyPortfolioTurnover |
19.00%
|
| Additional Fund Statistics [Text Block] |
Key Fund Statistics as of 12/31/2025- Total Net Assets$3,294,400,216
- Number of Portfolio Holdings7
- Portfolio Turnover Rate19%
- Total Advisory Fees Paid$0
|
| Holdings [Text Block] |
Asset Types |
% |
Domestic Equity |
43.3% |
International Equity |
32.2% |
Domestic Fixed Income |
24.3% |
Short-Term Investments |
0.2% | |
| Largest Holdings [Text Block] |
Holdings |
% |
State Street Equity 500 Index II Portfolio |
35.7% |
State Street Global All Cap Equity ex-U.S. Index Portfolio |
32.2% |
State Street Aggregate Bond Index Portfolio |
12.0% |
State Street SPDR Portfolio Long Term Treasury ETF |
9.8% |
State Street Small/Mid Cap Equity Index Portfolio |
7.6% |
State Street SPDR Bloomberg High Yield Bond ETF |
2.5% | |
| Material Fund Change [Text Block] |
|
| C000143881 |
|
| Shareholder Report [Line Items] |
|
| Fund Name |
State Street Target Retirement 2040 Fund
|
| Class Name |
Class K
|
| Trading Symbol |
SSCQX
|
| Annual or Semi-Annual Statement [Text Block] |
This annual shareholder report contains important information about the State Street Target Retirement 2040 Fund (the "Fund") for the period of January 1, 2025 through December 31, 2025.
|
| Additional Information [Text Block] |
You can find additional information about the Fund, including the Prospectus, Statement of Additional Information, financial statements and other information at www.ssga.com/us/en/institutional/fund-finder?tab=documents&type=mf. You can also request this information about the Fund by contacting us at 1-800-647-7327.
|
| Additional Information Phone Number |
1-800-647-7327
|
| Additional Information Website |
www.ssga.com/us/en/institutional/fund-finder?tab=documents&type=mf
|
| Expenses [Text Block] |
What were the Fund costs for the last year? (based on a hypothetical $10,000 Investment)
Class Name |
Costs of a $10,000 investment |
Costs paid as a percentage of a $10,000 investment |
Class K |
$7 |
0.06% | Does not include expenses of the Underlying Funds in which the Fund invests. |
| Expenses Paid, Amount |
$ 7
|
| Expense Ratio, Percent |
0.06%
|
| Factors Affecting Performance [Text Block] |
How did the Fund perform last year and what affected its performance?The main driver of the Fund’s performance on an absolute basis during the reporting period was its position in the State Street Global Equity ex-US Index Portfolio which returned approximately 32.7% for the reporting period. On an individual security level, the top positive contributors to the Fund’s performance on an absolute basis during the reporting period were the State Street Global Equity ex-US Index Portfolio, the State Street Equity 500 Index II Portfolio, and the State Street Small/Mid Cap Equity Index Portfolio. There were no negative contributors to the Fund’s performance on an absolute basis during the reporting period. |
| Performance Past Does Not Indicate Future [Text] |
The Fund’s past performance is not necessarily an indication of how the Fund will perform in the future. The returns do not reflect the deduction of taxes that a shareholder would pay on Fund distributions or on the redemption or sale of Fund shares.
|
| Line Graph [Table Text Block] |

|
SSCQX |
S&P 500 Index |
State Street Target Retirement 2040 Composite Index |
12/31/15 |
$10,000 |
$10,000 |
$10,000 |
01/31/16 |
$9,547 |
$9,504 |
$9,504 |
02/29/16 |
$9,516 |
$9,491 |
$9,502 |
03/31/16 |
$10,134 |
$10,135 |
$10,118 |
04/30/16 |
$10,267 |
$10,174 |
$10,244 |
05/31/16 |
$10,309 |
$10,357 |
$10,292 |
06/30/16 |
$10,370 |
$10,384 |
$10,318 |
07/31/16 |
$10,751 |
$10,766 |
$10,743 |
08/31/16 |
$10,782 |
$10,782 |
$10,775 |
09/30/16 |
$10,844 |
$10,784 |
$10,819 |
10/31/16 |
$10,586 |
$10,587 |
$10,582 |
11/30/16 |
$10,700 |
$10,979 |
$10,691 |
12/31/16 |
$10,889 |
$11,196 |
$10,887 |
01/31/17 |
$11,130 |
$11,408 |
$11,131 |
02/28/17 |
$11,412 |
$11,861 |
$11,418 |
03/31/17 |
$11,507 |
$11,875 |
$11,511 |
04/30/17 |
$11,674 |
$11,997 |
$11,680 |
05/31/17 |
$11,873 |
$12,166 |
$11,883 |
06/30/17 |
$11,957 |
$12,242 |
$11,967 |
07/31/17 |
$12,208 |
$12,494 |
$12,219 |
08/31/17 |
$12,281 |
$12,532 |
$12,293 |
09/30/17 |
$12,501 |
$12,790 |
$12,512 |
10/31/17 |
$12,721 |
$13,089 |
$12,727 |
11/30/17 |
$12,973 |
$13,490 |
$12,971 |
12/31/17 |
$13,141 |
$13,640 |
$13,153 |
01/31/18 |
$13,677 |
$14,421 |
$13,690 |
02/28/18 |
$13,131 |
$13,890 |
$13,166 |
03/31/18 |
$13,013 |
$13,537 |
$13,015 |
04/30/18 |
$13,045 |
$13,589 |
$13,076 |
05/31/18 |
$13,195 |
$13,916 |
$13,218 |
06/30/18 |
$13,174 |
$14,002 |
$13,188 |
07/31/18 |
$13,473 |
$14,523 |
$13,484 |
08/31/18 |
$13,656 |
$14,996 |
$13,675 |
09/30/18 |
$13,623 |
$15,081 |
$13,646 |
10/31/18 |
$12,681 |
$14,050 |
$12,693 |
11/30/18 |
$12,884 |
$14,337 |
$12,894 |
12/31/18 |
$12,153 |
$13,042 |
$12,166 |
01/31/19 |
$13,043 |
$14,087 |
$13,043 |
02/28/19 |
$13,347 |
$14,540 |
$13,364 |
03/31/19 |
$13,538 |
$14,822 |
$13,547 |
04/30/19 |
$13,910 |
$15,422 |
$13,917 |
05/31/19 |
$13,302 |
$14,442 |
$13,304 |
06/30/19 |
$14,056 |
$15,460 |
$14,064 |
07/31/19 |
$14,090 |
$15,682 |
$14,121 |
08/31/19 |
$13,978 |
$15,434 |
$13,985 |
09/30/19 |
$14,158 |
$15,723 |
$14,171 |
10/31/19 |
$14,462 |
$16,063 |
$14,469 |
11/30/19 |
$14,789 |
$16,646 |
$14,799 |
12/31/19 |
$15,150 |
$17,149 |
$15,182 |
01/31/20 |
$15,114 |
$17,142 |
$15,159 |
02/29/20 |
$14,276 |
$15,731 |
$14,276 |
03/31/20 |
$12,659 |
$13,788 |
$12,683 |
04/30/20 |
$13,880 |
$15,555 |
$13,909 |
05/31/20 |
$14,455 |
$16,296 |
$14,467 |
06/30/20 |
$14,886 |
$16,620 |
$14,875 |
07/31/20 |
$15,581 |
$17,558 |
$15,593 |
08/31/20 |
$16,288 |
$18,820 |
$16,310 |
09/30/20 |
$15,904 |
$18,105 |
$15,902 |
10/31/20 |
$15,569 |
$17,623 |
$15,584 |
11/30/20 |
$17,270 |
$19,552 |
$17,298 |
12/31/20 |
$17,997 |
$20,304 |
$18,031 |
01/31/21 |
$17,909 |
$20,099 |
$17,953 |
02/28/21 |
$18,223 |
$20,653 |
$18,259 |
03/31/21 |
$18,486 |
$21,558 |
$18,525 |
04/30/21 |
$19,175 |
$22,708 |
$19,215 |
05/31/21 |
$19,413 |
$22,867 |
$19,463 |
06/30/21 |
$19,664 |
$23,401 |
$19,711 |
07/31/21 |
$19,789 |
$23,956 |
$19,832 |
08/31/21 |
$20,165 |
$24,685 |
$20,217 |
09/30/21 |
$19,426 |
$23,537 |
$19,510 |
10/31/21 |
$20,241 |
$25,186 |
$20,293 |
11/30/21 |
$19,764 |
$25,011 |
$19,842 |
12/31/21 |
$20,364 |
$26,132 |
$20,438 |
01/31/22 |
$19,449 |
$24,780 |
$19,440 |
02/28/22 |
$18,998 |
$24,038 |
$19,068 |
03/31/22 |
$19,117 |
$24,931 |
$19,204 |
04/30/22 |
$17,672 |
$22,757 |
$17,772 |
05/31/22 |
$17,739 |
$22,798 |
$17,770 |
06/30/22 |
$16,453 |
$20,916 |
$16,482 |
07/31/22 |
$17,487 |
$22,845 |
$17,501 |
08/31/22 |
$16,850 |
$21,913 |
$16,908 |
09/30/22 |
$15,352 |
$19,895 |
$15,406 |
10/31/22 |
$16,028 |
$21,506 |
$16,064 |
11/30/22 |
$17,235 |
$22,708 |
$17,212 |
12/31/22 |
$16,617 |
$21,399 |
$16,665 |
01/31/23 |
$17,806 |
$22,744 |
$17,821 |
02/28/23 |
$17,274 |
$22,189 |
$17,315 |
03/31/23 |
$17,694 |
$23,004 |
$17,716 |
04/30/23 |
$17,875 |
$23,363 |
$17,890 |
05/31/23 |
$17,610 |
$23,464 |
$17,642 |
06/30/23 |
$18,449 |
$25,015 |
$18,466 |
07/31/23 |
$18,980 |
$25,818 |
$19,012 |
08/31/23 |
$18,449 |
$25,407 |
$18,480 |
09/30/23 |
$17,666 |
$24,196 |
$17,692 |
10/31/23 |
$17,064 |
$23,687 |
$17,068 |
11/30/23 |
$18,533 |
$25,850 |
$18,567 |
12/31/23 |
$19,578 |
$27,025 |
$19,630 |
01/31/24 |
$19,506 |
$27,479 |
$19,571 |
02/29/24 |
$20,101 |
$28,946 |
$20,144 |
03/31/24 |
$20,639 |
$29,878 |
$20,699 |
04/30/24 |
$19,883 |
$28,657 |
$19,962 |
05/31/24 |
$20,653 |
$30,078 |
$20,664 |
06/30/24 |
$20,915 |
$31,157 |
$20,957 |
07/31/24 |
$21,437 |
$31,537 |
$21,491 |
08/31/24 |
$21,888 |
$32,302 |
$21,950 |
09/30/24 |
$22,367 |
$32,992 |
$22,426 |
10/31/24 |
$21,742 |
$32,692 |
$21,825 |
11/30/24 |
$22,498 |
$34,611 |
$22,557 |
12/31/24 |
$21,811 |
$33,786 |
$21,881 |
01/31/25 |
$22,406 |
$34,727 |
$22,495 |
02/28/25 |
$22,482 |
$34,274 |
$22,506 |
03/31/25 |
$21,857 |
$32,343 |
$21,874 |
04/30/25 |
$22,025 |
$32,124 |
$22,065 |
05/31/25 |
$22,909 |
$34,146 |
$22,967 |
06/30/25 |
$23,825 |
$35,882 |
$23,872 |
07/31/25 |
$23,977 |
$36,687 |
$24,061 |
08/31/25 |
$24,587 |
$37,431 |
$24,646 |
09/30/25 |
$25,350 |
$38,797 |
$25,397 |
10/31/25 |
$25,762 |
$39,706 |
$25,826 |
11/30/25 |
$25,823 |
$39,803 |
$25,889 |
12/31/25 |
$26,003 |
$39,827 |
$26,078 |
|
| Average Annual Return [Table Text Block] |
Name |
1 Year |
5 Years |
10 Years |
SSCQX |
19.22% |
7.64% |
10.03% |
S&P 500 Index |
17.88% |
14.42% |
14.82% |
State Street Target Retirement 2040 Composite Index |
19.18% |
7.66% |
10.06% | |
| Updated Performance Information Location [Text Block] |
Updated performance information is available by calling 1-800-647-7327 or visiting our website at www.ssga.com.
|
| AssetsNet |
$ 3,294,400,216
|
| Holdings Count | Holding |
7
|
| Advisory Fees Paid, Amount |
$ 0
|
| InvestmentCompanyPortfolioTurnover |
19.00%
|
| Additional Fund Statistics [Text Block] |
Key Fund Statistics as of 12/31/2025- Total Net Assets$3,294,400,216
- Number of Portfolio Holdings7
- Portfolio Turnover Rate19%
- Total Advisory Fees Paid$0
|
| Holdings [Text Block] |
Asset Types |
% |
Domestic Equity |
43.3% |
International Equity |
32.2% |
Domestic Fixed Income |
24.3% |
Short-Term Investments |
0.2% | |
| Largest Holdings [Text Block] |
Holdings |
% |
State Street Equity 500 Index II Portfolio |
35.7% |
State Street Global All Cap Equity ex-U.S. Index Portfolio |
32.2% |
State Street Aggregate Bond Index Portfolio |
12.0% |
State Street SPDR Portfolio Long Term Treasury ETF |
9.8% |
State Street Small/Mid Cap Equity Index Portfolio |
7.6% |
State Street SPDR Bloomberg High Yield Bond ETF |
2.5% | |
| Material Fund Change [Text Block] |
|
| C000232299 |
|
| Shareholder Report [Line Items] |
|
| Fund Name |
State Street Target Retirement 2045 Fund
|
| Class Name |
Class R3
|
| Trading Symbol |
SSAOX
|
| Annual or Semi-Annual Statement [Text Block] |
This annual shareholder report contains important information about the State Street Target Retirement 2045 Fund (the "Fund") for the period of January 1, 2025 through December 31, 2025.
|
| Additional Information [Text Block] |
You can find additional information about the Fund, including the Prospectus, Statement of Additional Information, financial statements and other information at www.ssga.com/us/en/institutional/fund-finder?tab=documents&type=mf. You can also request this information about the Fund by contacting us at 1-800-647-7327.
|
| Additional Information Phone Number |
1-800-647-7327
|
| Additional Information Website |
www.ssga.com/us/en/institutional/fund-finder?tab=documents&type=mf
|
| Expenses [Text Block] |
What were the Fund costs for the last year? (based on a hypothetical $10,000 Investment)
Class Name |
Costs of a $10,000 investment |
Costs paid as a percentage of a $10,000 investment |
Class R3 |
$61 |
0.56% | Does not include expenses of the Underlying Funds in which the Fund invests. |
| Expenses Paid, Amount |
$ 61
|
| Expense Ratio, Percent |
0.56%
|
| Factors Affecting Performance [Text Block] |
How did the Fund perform last year and what affected its performance?The main driver of the Fund’s performance on an absolute basis during the reporting period was its position in the State Street Global Equity ex-US Index Portfolio which returned approximately 32.7% for the reporting period. On an individual security level, the top positive contributors to the Fund’s performance on an absolute basis during the reporting period were the State Street Global Equity ex-US Index Portfolio, the State Street Equity 500 Index II Portfolio, and the State Street Small/Mid Cap Equity Index Portfolio. There were no negative contributors to the Fund’s performance on an absolute basis during the reporting period. |
| Performance Past Does Not Indicate Future [Text] |
The Fund’s past performance is not necessarily an indication of how the Fund will perform in the future. The returns do not reflect the deduction of taxes that a shareholder would pay on Fund distributions or on the redemption or sale of Fund shares.
|
| Line Graph [Table Text Block] |

|
SSAOX |
S&P 500 Index |
State Street Target Retirement 2045 Composite Index |
12/31/15 |
$10,000 |
$10,000 |
$10,000 |
01/31/16 |
$9,508 |
$9,504 |
$9,478 |
02/29/16 |
$9,474 |
$9,491 |
$9,472 |
03/31/16 |
$10,112 |
$10,135 |
$10,108 |
04/30/16 |
$10,243 |
$10,174 |
$10,239 |
05/31/16 |
$10,290 |
$10,357 |
$10,288 |
06/30/16 |
$10,338 |
$10,384 |
$10,306 |
07/31/16 |
$10,726 |
$10,766 |
$10,746 |
08/31/16 |
$10,753 |
$10,782 |
$10,782 |
09/30/16 |
$10,821 |
$10,784 |
$10,829 |
10/31/16 |
$10,548 |
$10,587 |
$10,585 |
11/30/16 |
$10,678 |
$10,979 |
$10,716 |
12/31/16 |
$10,877 |
$11,196 |
$10,921 |
01/31/17 |
$11,114 |
$11,408 |
$11,175 |
02/28/17 |
$11,403 |
$11,861 |
$11,471 |
03/31/17 |
$11,493 |
$11,875 |
$11,569 |
04/30/17 |
$11,666 |
$11,997 |
$11,743 |
05/31/17 |
$11,861 |
$12,166 |
$11,948 |
06/30/17 |
$11,939 |
$12,242 |
$12,040 |
07/31/17 |
$12,207 |
$12,494 |
$12,303 |
08/31/17 |
$12,264 |
$12,532 |
$12,373 |
09/30/17 |
$12,500 |
$12,790 |
$12,613 |
10/31/17 |
$12,714 |
$13,089 |
$12,840 |
11/30/17 |
$12,970 |
$13,490 |
$13,099 |
12/31/17 |
$13,145 |
$13,640 |
$13,288 |
01/31/18 |
$13,717 |
$14,421 |
$13,867 |
02/28/18 |
$13,145 |
$13,890 |
$13,316 |
03/31/18 |
$13,022 |
$13,537 |
$13,155 |
04/30/18 |
$13,049 |
$13,589 |
$13,227 |
05/31/18 |
$13,214 |
$13,916 |
$13,376 |
06/30/18 |
$13,177 |
$14,002 |
$13,346 |
07/31/18 |
$13,480 |
$14,523 |
$13,659 |
08/31/18 |
$13,667 |
$14,996 |
$13,859 |
09/30/18 |
$13,640 |
$15,081 |
$13,830 |
10/31/18 |
$12,632 |
$14,050 |
$12,809 |
11/30/18 |
$12,830 |
$14,337 |
$13,019 |
12/31/18 |
$12,040 |
$13,042 |
$12,216 |
01/31/19 |
$12,963 |
$14,087 |
$13,149 |
02/28/19 |
$13,282 |
$14,540 |
$13,496 |
03/31/19 |
$13,455 |
$14,822 |
$13,668 |
04/30/19 |
$13,840 |
$15,422 |
$14,064 |
05/31/19 |
$13,176 |
$14,442 |
$13,388 |
06/30/19 |
$13,951 |
$15,460 |
$14,190 |
07/31/19 |
$13,979 |
$15,682 |
$14,249 |
08/31/19 |
$13,817 |
$15,434 |
$14,068 |
09/30/19 |
$14,012 |
$15,723 |
$14,272 |
10/31/19 |
$14,307 |
$16,063 |
$14,588 |
11/30/19 |
$14,657 |
$16,646 |
$14,943 |
12/31/19 |
$15,035 |
$17,149 |
$15,353 |
01/31/20 |
$14,957 |
$17,142 |
$15,305 |
02/29/20 |
$14,053 |
$15,731 |
$14,337 |
03/31/20 |
$12,324 |
$13,788 |
$12,606 |
04/30/20 |
$13,570 |
$15,555 |
$13,890 |
05/31/20 |
$14,177 |
$16,296 |
$14,485 |
06/30/20 |
$14,608 |
$16,620 |
$14,915 |
07/31/20 |
$15,309 |
$17,558 |
$15,662 |
08/31/20 |
$16,045 |
$18,820 |
$16,436 |
09/30/20 |
$15,638 |
$18,105 |
$16,006 |
10/31/20 |
$15,313 |
$17,623 |
$15,680 |
11/30/20 |
$17,072 |
$19,552 |
$17,519 |
12/31/20 |
$17,844 |
$20,304 |
$18,311 |
01/31/21 |
$17,762 |
$20,099 |
$18,247 |
02/28/21 |
$18,098 |
$20,653 |
$18,604 |
03/31/21 |
$18,384 |
$21,558 |
$18,896 |
04/30/21 |
$19,085 |
$22,708 |
$19,629 |
05/31/21 |
$19,309 |
$22,867 |
$19,890 |
06/30/21 |
$19,569 |
$23,401 |
$20,150 |
07/31/21 |
$19,659 |
$23,956 |
$20,255 |
08/31/21 |
$20,053 |
$24,685 |
$20,672 |
09/30/21 |
$19,289 |
$23,537 |
$19,920 |
10/31/21 |
$20,121 |
$25,186 |
$20,764 |
11/30/21 |
$19,601 |
$25,011 |
$20,256 |
12/31/21 |
$20,210 |
$26,132 |
$20,896 |
01/31/22 |
$19,242 |
$24,780 |
$19,830 |
02/28/22 |
$18,801 |
$24,038 |
$19,447 |
03/31/22 |
$18,941 |
$24,931 |
$19,625 |
04/30/22 |
$17,458 |
$22,757 |
$18,116 |
05/31/22 |
$17,496 |
$22,798 |
$18,103 |
06/30/22 |
$16,166 |
$20,916 |
$16,723 |
07/31/22 |
$17,215 |
$22,845 |
$17,798 |
08/31/22 |
$16,575 |
$21,913 |
$17,195 |
09/30/22 |
$15,053 |
$19,895 |
$15,621 |
10/31/22 |
$15,770 |
$21,506 |
$16,347 |
11/30/22 |
$16,972 |
$22,708 |
$17,540 |
12/31/22 |
$16,339 |
$21,399 |
$16,956 |
01/31/23 |
$17,533 |
$22,744 |
$18,180 |
02/28/23 |
$17,010 |
$22,189 |
$17,665 |
03/31/23 |
$17,399 |
$23,004 |
$18,054 |
04/30/23 |
$17,560 |
$23,363 |
$18,227 |
05/31/23 |
$17,292 |
$23,464 |
$17,972 |
06/30/23 |
$18,164 |
$25,015 |
$18,872 |
07/31/23 |
$18,728 |
$25,818 |
$19,476 |
08/31/23 |
$18,164 |
$25,407 |
$18,899 |
09/30/23 |
$17,359 |
$24,196 |
$18,076 |
10/31/23 |
$16,741 |
$23,687 |
$17,409 |
11/30/23 |
$18,232 |
$25,850 |
$18,987 |
12/31/23 |
$19,272 |
$27,025 |
$20,106 |
01/31/24 |
$19,189 |
$27,479 |
$20,037 |
02/29/24 |
$19,826 |
$28,946 |
$20,685 |
03/31/24 |
$20,366 |
$29,878 |
$21,279 |
04/30/24 |
$19,590 |
$28,657 |
$20,500 |
05/31/24 |
$20,366 |
$30,078 |
$21,244 |
06/30/24 |
$20,615 |
$31,157 |
$21,542 |
07/31/24 |
$21,141 |
$31,537 |
$22,107 |
08/31/24 |
$21,584 |
$32,302 |
$22,583 |
09/30/24 |
$22,041 |
$32,992 |
$23,083 |
10/31/24 |
$21,418 |
$32,692 |
$22,463 |
11/30/24 |
$22,207 |
$34,611 |
$23,272 |
12/31/24 |
$21,474 |
$33,786 |
$22,536 |
01/31/25 |
$22,110 |
$34,727 |
$23,212 |
02/28/25 |
$22,110 |
$34,274 |
$23,174 |
03/31/25 |
$21,460 |
$32,343 |
$22,473 |
04/30/25 |
$21,619 |
$32,124 |
$22,682 |
05/31/25 |
$22,559 |
$34,146 |
$23,691 |
06/30/25 |
$23,484 |
$35,882 |
$24,664 |
07/31/25 |
$23,643 |
$36,687 |
$24,879 |
08/31/25 |
$24,280 |
$37,431 |
$25,517 |
09/30/25 |
$25,032 |
$38,797 |
$26,328 |
10/31/25 |
$25,465 |
$39,706 |
$26,794 |
11/30/25 |
$25,509 |
$39,803 |
$26,850 |
12/31/25 |
$25,691 |
$39,827 |
$27,061 |
|
| Average Annual Return [Table Text Block] |
Name |
1 Year |
5 Years |
10 Years |
SSAOXFootnote Reference(1) |
19.64% |
7.56% |
9.90% |
S&P 500 Index |
17.88% |
14.42% |
14.82% |
State Street Target Retirement 2045 Composite Index |
20.08% |
8.12% |
10.47% | |
| Updated Performance Information Location [Text Block] |
Updated performance information is available by calling 1-800-647-7327 or visiting our website at www.ssga.com.
|
| AssetsNet |
$ 3,074,034,911
|
| Holdings Count | Holding |
7
|
| Advisory Fees Paid, Amount |
$ 0
|
| InvestmentCompanyPortfolioTurnover |
18.00%
|
| Additional Fund Statistics [Text Block] |
Key Fund Statistics as of 12/31/2025- Total Net Assets$3,074,034,911
- Number of Portfolio Holdings7
- Portfolio Turnover Rate18%
- Total Advisory Fees Paid$0
|
| Holdings [Text Block] |
Asset Types |
% |
Domestic Equity |
47.0% |
International Equity |
35.0% |
Domestic Fixed Income |
17.8% |
Short-Term Investments |
0.3% | |
| Largest Holdings [Text Block] |
Holdings |
% |
State Street Equity 500 Index II Portfolio |
37.6% |
State Street Global All Cap Equity ex-U.S. Index Portfolio |
35.0% |
State Street SPDR Portfolio Long Term Treasury ETF |
9.8% |
State Street Small/Mid Cap Equity Index Portfolio |
9.5% |
State Street Aggregate Bond Index Portfolio |
8.0% | |
| Material Fund Change [Text Block] |
|
| C000143884 |
|
| Shareholder Report [Line Items] |
|
| Fund Name |
State Street Target Retirement 2045 Fund
|
| Class Name |
Class I
|
| Trading Symbol |
SSDDX
|
| Annual or Semi-Annual Statement [Text Block] |
This annual shareholder report contains important information about the State Street Target Retirement 2045 Fund (the "Fund") for the period of January 1, 2025 through December 31, 2025.
|
| Additional Information [Text Block] |
You can find additional information about the Fund, including the Prospectus, Statement of Additional Information, financial statements and other information at www.ssga.com/us/en/institutional/fund-finder?tab=documents&type=mf. You can also request this information about the Fund by contacting us at 1-800-647-7327.
|
| Additional Information Phone Number |
1-800-647-7327
|
| Additional Information Website |
www.ssga.com/us/en/institutional/fund-finder?tab=documents&type=mf
|
| Expenses [Text Block] |
What were the Fund costs for the last year? (based on a hypothetical $10,000 Investment)
Class Name |
Costs of a $10,000 investment |
Costs paid as a percentage of a $10,000 investment |
Class I |
$23 |
0.21% | Does not include expenses of the Underlying Funds in which the Fund invests. |
| Expenses Paid, Amount |
$ 23
|
| Expense Ratio, Percent |
0.21%
|
| Factors Affecting Performance [Text Block] |
How did the Fund perform last year and what affected its performance?The main driver of the Fund’s performance on an absolute basis during the reporting period was its position in the State Street Global Equity ex-US Index Portfolio which returned approximately 32.7% for the reporting period. On an individual security level, the top positive contributors to the Fund’s performance on an absolute basis during the reporting period were the State Street Global Equity ex-US Index Portfolio, the State Street Equity 500 Index II Portfolio, and the State Street Small/Mid Cap Equity Index Portfolio. There were no negative contributors to the Fund’s performance on an absolute basis during the reporting period. |
| Performance Past Does Not Indicate Future [Text] |
The Fund’s past performance is not necessarily an indication of how the Fund will perform in the future. The returns do not reflect the deduction of taxes that a shareholder would pay on Fund distributions or on the redemption or sale of Fund shares.
|
| Line Graph [Table Text Block] |

|
SSDDX |
S&P 500 Index |
State Street Target Retirement 2045 Composite Index |
12/31/15 |
$10,000 |
$10,000 |
$10,000 |
01/31/16 |
$9,523 |
$9,504 |
$9,478 |
02/29/16 |
$9,492 |
$9,491 |
$9,472 |
03/31/16 |
$10,124 |
$10,135 |
$10,108 |
04/30/16 |
$10,270 |
$10,174 |
$10,239 |
05/31/16 |
$10,311 |
$10,357 |
$10,288 |
06/30/16 |
$10,363 |
$10,384 |
$10,306 |
07/31/16 |
$10,768 |
$10,766 |
$10,746 |
08/31/16 |
$10,799 |
$10,782 |
$10,782 |
09/30/16 |
$10,861 |
$10,784 |
$10,829 |
10/31/16 |
$10,602 |
$10,587 |
$10,585 |
11/30/16 |
$10,726 |
$10,979 |
$10,716 |
12/31/16 |
$10,931 |
$11,196 |
$10,921 |
01/31/17 |
$11,184 |
$11,408 |
$11,175 |
02/28/17 |
$11,469 |
$11,861 |
$11,471 |
03/31/17 |
$11,575 |
$11,875 |
$11,569 |
04/30/17 |
$11,744 |
$11,997 |
$11,743 |
05/31/17 |
$11,944 |
$12,166 |
$11,948 |
06/30/17 |
$12,039 |
$12,242 |
$12,040 |
07/31/17 |
$12,303 |
$12,494 |
$12,303 |
08/31/17 |
$12,366 |
$12,532 |
$12,373 |
09/30/17 |
$12,609 |
$12,790 |
$12,613 |
10/31/17 |
$12,830 |
$13,089 |
$12,840 |
11/30/17 |
$13,094 |
$13,490 |
$13,099 |
12/31/17 |
$13,276 |
$13,640 |
$13,288 |
01/31/18 |
$13,860 |
$14,421 |
$13,867 |
02/28/18 |
$13,287 |
$13,890 |
$13,316 |
03/31/18 |
$13,179 |
$13,537 |
$13,155 |
04/30/18 |
$13,212 |
$13,589 |
$13,227 |
05/31/18 |
$13,374 |
$13,916 |
$13,376 |
06/30/18 |
$13,341 |
$14,002 |
$13,346 |
07/31/18 |
$13,654 |
$14,523 |
$13,659 |
08/31/18 |
$13,849 |
$14,996 |
$13,859 |
09/30/18 |
$13,827 |
$15,081 |
$13,830 |
10/31/18 |
$12,812 |
$14,050 |
$12,809 |
11/30/18 |
$13,017 |
$14,337 |
$13,019 |
12/31/18 |
$12,219 |
$13,042 |
$12,216 |
01/31/19 |
$13,161 |
$14,087 |
$13,149 |
02/28/19 |
$13,490 |
$14,540 |
$13,496 |
03/31/19 |
$13,672 |
$14,822 |
$13,668 |
04/30/19 |
$14,069 |
$15,422 |
$14,064 |
05/31/19 |
$13,399 |
$14,442 |
$13,388 |
06/30/19 |
$14,193 |
$15,460 |
$14,190 |
07/31/19 |
$14,228 |
$15,682 |
$14,249 |
08/31/19 |
$14,069 |
$15,434 |
$14,068 |
09/30/19 |
$14,273 |
$15,723 |
$14,272 |
10/31/19 |
$14,579 |
$16,063 |
$14,588 |
11/30/19 |
$14,931 |
$16,646 |
$14,943 |
12/31/19 |
$15,329 |
$17,149 |
$15,353 |
01/31/20 |
$15,256 |
$17,142 |
$15,305 |
02/29/20 |
$14,341 |
$15,731 |
$14,337 |
03/31/20 |
$12,581 |
$13,788 |
$12,606 |
04/30/20 |
$13,859 |
$15,555 |
$13,890 |
05/31/20 |
$14,485 |
$16,296 |
$14,485 |
06/30/20 |
$14,931 |
$16,620 |
$14,915 |
07/31/20 |
$15,654 |
$17,558 |
$15,662 |
08/31/20 |
$16,413 |
$18,820 |
$16,436 |
09/30/20 |
$16,016 |
$18,105 |
$16,006 |
10/31/20 |
$15,678 |
$17,623 |
$15,680 |
11/30/20 |
$17,498 |
$19,552 |
$17,519 |
12/31/20 |
$18,281 |
$20,304 |
$18,311 |
01/31/21 |
$18,206 |
$20,099 |
$18,247 |
02/28/21 |
$18,557 |
$20,653 |
$18,604 |
03/31/21 |
$18,845 |
$21,558 |
$18,896 |
04/30/21 |
$19,560 |
$22,708 |
$19,629 |
05/31/21 |
$19,811 |
$22,867 |
$19,890 |
06/30/21 |
$20,086 |
$23,401 |
$20,150 |
07/31/21 |
$20,187 |
$23,956 |
$20,255 |
08/31/21 |
$20,488 |
$24,685 |
$20,672 |
09/30/21 |
$19,710 |
$23,537 |
$19,920 |
10/31/21 |
$20,575 |
$25,186 |
$20,764 |
11/30/21 |
$20,049 |
$25,011 |
$20,256 |
12/31/21 |
$20,672 |
$26,132 |
$20,896 |
01/31/22 |
$19,686 |
$24,780 |
$19,830 |
02/28/22 |
$19,239 |
$24,038 |
$19,447 |
03/31/22 |
$19,383 |
$24,931 |
$19,625 |
04/30/22 |
$17,871 |
$22,757 |
$18,116 |
05/31/22 |
$17,924 |
$22,798 |
$18,103 |
06/30/22 |
$16,569 |
$20,916 |
$16,723 |
07/31/22 |
$17,634 |
$22,845 |
$17,798 |
08/31/22 |
$16,990 |
$21,913 |
$17,195 |
09/30/22 |
$15,438 |
$19,895 |
$15,621 |
10/31/22 |
$16,175 |
$21,506 |
$16,347 |
11/30/22 |
$17,424 |
$22,708 |
$17,540 |
12/31/22 |
$16,760 |
$21,399 |
$16,956 |
01/31/23 |
$18,007 |
$22,744 |
$18,180 |
02/28/23 |
$17,467 |
$22,189 |
$17,665 |
03/31/23 |
$17,869 |
$23,004 |
$18,054 |
04/30/23 |
$18,049 |
$23,363 |
$18,227 |
05/31/23 |
$17,772 |
$23,464 |
$17,972 |
06/30/23 |
$18,687 |
$25,015 |
$18,872 |
07/31/23 |
$19,255 |
$25,818 |
$19,476 |
08/31/23 |
$18,687 |
$25,407 |
$18,899 |
09/30/23 |
$17,869 |
$24,196 |
$18,076 |
10/31/23 |
$17,245 |
$23,687 |
$17,409 |
11/30/23 |
$18,770 |
$25,850 |
$18,987 |
12/31/23 |
$19,853 |
$27,025 |
$20,106 |
01/31/24 |
$19,767 |
$27,479 |
$20,037 |
02/29/24 |
$20,427 |
$28,946 |
$20,685 |
03/31/24 |
$21,001 |
$29,878 |
$21,279 |
04/30/24 |
$20,212 |
$28,657 |
$20,500 |
05/31/24 |
$21,001 |
$30,078 |
$21,244 |
06/30/24 |
$21,260 |
$31,157 |
$21,542 |
07/31/24 |
$21,819 |
$31,537 |
$22,107 |
08/31/24 |
$22,279 |
$32,302 |
$22,583 |
09/30/24 |
$22,767 |
$32,992 |
$23,083 |
10/31/24 |
$22,121 |
$32,692 |
$22,463 |
11/30/24 |
$22,954 |
$34,611 |
$23,272 |
12/31/24 |
$22,203 |
$33,786 |
$22,536 |
01/31/25 |
$22,850 |
$34,727 |
$23,212 |
02/28/25 |
$22,880 |
$34,274 |
$23,174 |
03/31/25 |
$22,203 |
$32,343 |
$22,473 |
04/30/25 |
$22,368 |
$32,124 |
$22,682 |
05/31/25 |
$23,362 |
$34,146 |
$23,691 |
06/30/25 |
$24,325 |
$35,882 |
$24,664 |
07/31/25 |
$24,476 |
$36,687 |
$24,879 |
08/31/25 |
$25,153 |
$37,431 |
$25,517 |
09/30/25 |
$25,951 |
$38,797 |
$26,328 |
10/31/25 |
$26,402 |
$39,706 |
$26,794 |
11/30/25 |
$26,463 |
$39,803 |
$26,850 |
12/31/25 |
$26,628 |
$39,827 |
$27,061 |
|
| Average Annual Return [Table Text Block] |
Name |
1 Year |
5 Years |
10 Years |
SSDDX |
19.93% |
7.81% |
10.29% |
S&P 500 Index |
17.88% |
14.42% |
14.82% |
State Street Target Retirement 2045 Composite Index |
20.08% |
8.12% |
10.47% | |
| Updated Performance Information Location [Text Block] |
Updated performance information is available by calling 1-800-647-7327 or visiting our website at www.ssga.com.
|
| AssetsNet |
$ 3,074,034,911
|
| Holdings Count | Holding |
7
|
| Advisory Fees Paid, Amount |
$ 0
|
| InvestmentCompanyPortfolioTurnover |
18.00%
|
| Additional Fund Statistics [Text Block] |
Key Fund Statistics as of 12/31/2025- Total Net Assets$3,074,034,911
- Number of Portfolio Holdings7
- Portfolio Turnover Rate18%
- Total Advisory Fees Paid$0
|
| Holdings [Text Block] |
Asset Types |
% |
Domestic Equity |
47.0% |
International Equity |
35.0% |
Domestic Fixed Income |
17.8% |
Short-Term Investments |
0.3% | |
| Largest Holdings [Text Block] |
Holdings |
% |
State Street Equity 500 Index II Portfolio |
37.6% |
State Street Global All Cap Equity ex-U.S. Index Portfolio |
35.0% |
State Street SPDR Portfolio Long Term Treasury ETF |
9.8% |
State Street Small/Mid Cap Equity Index Portfolio |
9.5% |
State Street Aggregate Bond Index Portfolio |
8.0% | |
| Material Fund Change [Text Block] |
|
| C000143885 |
|
| Shareholder Report [Line Items] |
|
| Fund Name |
State Street Target Retirement 2045 Fund
|
| Class Name |
Class K
|
| Trading Symbol |
SSDEX
|
| Annual or Semi-Annual Statement [Text Block] |
This annual shareholder report contains important information about the State Street Target Retirement 2045 Fund (the "Fund") for the period of January 1, 2025 through December 31, 2025.
|
| Additional Information [Text Block] |
You can find additional information about the Fund, including the Prospectus, Statement of Additional Information, financial statements and other information at www.ssga.com/us/en/institutional/fund-finder?tab=documents&type=mf. You can also request this information about the Fund by contacting us at 1-800-647-7327.
|
| Additional Information Phone Number |
1-800-647-7327
|
| Additional Information Website |
www.ssga.com/us/en/institutional/fund-finder?tab=documents&type=mf
|
| Expenses [Text Block] |
What were the Fund costs for the last year? (based on a hypothetical $10,000 Investment)
Class Name |
Costs of a $10,000 investment |
Costs paid as a percentage of a $10,000 investment |
Class K |
$7 |
0.06% | Does not include expenses of the Underlying Funds in which the Fund invests. |
| Expenses Paid, Amount |
$ 7
|
| Expense Ratio, Percent |
0.06%
|
| Factors Affecting Performance [Text Block] |
How did the Fund perform last year and what affected its performance?The main driver of the Fund’s performance on an absolute basis during the reporting period was its position in the State Street Global Equity ex-US Index Portfolio which returned approximately 32.7% for the reporting period. On an individual security level, the top positive contributors to the Fund’s performance on an absolute basis during the reporting period were the State Street Global Equity ex-US Index Portfolio, the State Street Equity 500 Index II Portfolio, and the State Street Small/Mid Cap Equity Index Portfolio. There were no negative contributors to the Fund’s performance on an absolute basis during the reporting period. |
| Performance Past Does Not Indicate Future [Text] |
The Fund’s past performance is not necessarily an indication of how the Fund will perform in the future. The returns do not reflect the deduction of taxes that a shareholder would pay on Fund distributions or on the redemption or sale of Fund shares.
|
| Line Graph [Table Text Block] |

|
SSDEX |
S&P 500 Index |
State Street Target Retirement 2045 Composite Index |
12/31/15 |
$10,000 |
$10,000 |
$10,000 |
01/31/16 |
$9,512 |
$9,504 |
$9,478 |
02/29/16 |
$9,481 |
$9,491 |
$9,472 |
03/31/16 |
$10,124 |
$10,135 |
$10,108 |
04/30/16 |
$10,259 |
$10,174 |
$10,239 |
05/31/16 |
$10,311 |
$10,357 |
$10,288 |
06/30/16 |
$10,363 |
$10,384 |
$10,306 |
07/31/16 |
$10,757 |
$10,766 |
$10,746 |
08/31/16 |
$10,788 |
$10,782 |
$10,782 |
09/30/16 |
$10,861 |
$10,784 |
$10,829 |
10/31/16 |
$10,591 |
$10,587 |
$10,585 |
11/30/16 |
$10,726 |
$10,979 |
$10,716 |
12/31/16 |
$10,931 |
$11,196 |
$10,921 |
01/31/17 |
$11,174 |
$11,408 |
$11,175 |
02/28/17 |
$11,469 |
$11,861 |
$11,471 |
03/31/17 |
$11,564 |
$11,875 |
$11,569 |
04/30/17 |
$11,744 |
$11,997 |
$11,743 |
05/31/17 |
$11,944 |
$12,166 |
$11,948 |
06/30/17 |
$12,028 |
$12,242 |
$12,040 |
07/31/17 |
$12,303 |
$12,494 |
$12,303 |
08/31/17 |
$12,366 |
$12,532 |
$12,373 |
09/30/17 |
$12,609 |
$12,790 |
$12,613 |
10/31/17 |
$12,830 |
$13,089 |
$12,840 |
11/30/17 |
$13,094 |
$13,490 |
$13,099 |
12/31/17 |
$13,276 |
$13,640 |
$13,288 |
01/31/18 |
$13,860 |
$14,421 |
$13,867 |
02/28/18 |
$13,287 |
$13,890 |
$13,316 |
03/31/18 |
$13,168 |
$13,537 |
$13,155 |
04/30/18 |
$13,201 |
$13,589 |
$13,227 |
05/31/18 |
$13,374 |
$13,916 |
$13,376 |
06/30/18 |
$13,341 |
$14,002 |
$13,346 |
07/31/18 |
$13,654 |
$14,523 |
$13,659 |
08/31/18 |
$13,849 |
$14,996 |
$13,859 |
09/30/18 |
$13,827 |
$15,081 |
$13,830 |
10/31/18 |
$12,812 |
$14,050 |
$12,809 |
11/30/18 |
$13,017 |
$14,337 |
$13,019 |
12/31/18 |
$12,222 |
$13,042 |
$12,216 |
01/31/19 |
$13,163 |
$14,087 |
$13,149 |
02/28/19 |
$13,493 |
$14,540 |
$13,496 |
03/31/19 |
$13,674 |
$14,822 |
$13,668 |
04/30/19 |
$14,071 |
$15,422 |
$14,064 |
05/31/19 |
$13,402 |
$14,442 |
$13,388 |
06/30/19 |
$14,196 |
$15,460 |
$14,190 |
07/31/19 |
$14,230 |
$15,682 |
$14,249 |
08/31/19 |
$14,071 |
$15,434 |
$14,068 |
09/30/19 |
$14,276 |
$15,723 |
$14,272 |
10/31/19 |
$14,582 |
$16,063 |
$14,588 |
11/30/19 |
$14,945 |
$16,646 |
$14,943 |
12/31/19 |
$15,337 |
$17,149 |
$15,353 |
01/31/20 |
$15,264 |
$17,142 |
$15,305 |
02/29/20 |
$14,348 |
$15,731 |
$14,337 |
03/31/20 |
$12,588 |
$13,788 |
$12,606 |
04/30/20 |
$13,866 |
$15,555 |
$13,890 |
05/31/20 |
$14,493 |
$16,296 |
$14,485 |
06/30/20 |
$14,939 |
$16,620 |
$14,915 |
07/31/20 |
$15,662 |
$17,558 |
$15,662 |
08/31/20 |
$16,422 |
$18,820 |
$16,436 |
09/30/20 |
$16,012 |
$18,105 |
$16,006 |
10/31/20 |
$15,686 |
$17,623 |
$15,680 |
11/30/20 |
$17,495 |
$19,552 |
$17,519 |
12/31/20 |
$18,293 |
$20,304 |
$18,311 |
01/31/21 |
$18,218 |
$20,099 |
$18,247 |
02/28/21 |
$18,569 |
$20,653 |
$18,604 |
03/31/21 |
$18,870 |
$21,558 |
$18,896 |
04/30/21 |
$19,598 |
$22,708 |
$19,629 |
05/31/21 |
$19,837 |
$22,867 |
$19,890 |
06/30/21 |
$20,113 |
$23,401 |
$20,150 |
07/31/21 |
$20,213 |
$23,956 |
$20,255 |
08/31/21 |
$20,627 |
$24,685 |
$20,672 |
09/30/21 |
$19,849 |
$23,537 |
$19,920 |
10/31/21 |
$20,715 |
$25,186 |
$20,764 |
11/30/21 |
$20,188 |
$25,011 |
$20,256 |
12/31/21 |
$20,824 |
$26,132 |
$20,896 |
01/31/22 |
$19,835 |
$24,780 |
$19,830 |
02/28/22 |
$19,386 |
$24,038 |
$19,447 |
03/31/22 |
$19,545 |
$24,931 |
$19,625 |
04/30/22 |
$18,015 |
$22,757 |
$18,116 |
05/31/22 |
$18,068 |
$22,798 |
$18,103 |
06/30/22 |
$16,696 |
$20,916 |
$16,723 |
07/31/22 |
$17,791 |
$22,845 |
$17,798 |
08/31/22 |
$17,144 |
$21,913 |
$17,195 |
09/30/22 |
$15,575 |
$19,895 |
$15,621 |
10/31/22 |
$16,327 |
$21,506 |
$16,347 |
11/30/22 |
$17,566 |
$22,708 |
$17,540 |
12/31/22 |
$16,920 |
$21,399 |
$16,956 |
01/31/23 |
$18,172 |
$22,744 |
$18,180 |
02/28/23 |
$17,630 |
$22,189 |
$17,665 |
03/31/23 |
$18,033 |
$23,004 |
$18,054 |
04/30/23 |
$18,214 |
$23,363 |
$18,227 |
05/31/23 |
$17,950 |
$23,464 |
$17,972 |
06/30/23 |
$18,854 |
$25,015 |
$18,872 |
07/31/23 |
$19,452 |
$25,818 |
$19,476 |
08/31/23 |
$18,868 |
$25,407 |
$18,899 |
09/30/23 |
$18,047 |
$24,196 |
$18,076 |
10/31/23 |
$17,407 |
$23,687 |
$17,409 |
11/30/23 |
$18,965 |
$25,850 |
$18,987 |
12/31/23 |
$20,060 |
$27,025 |
$20,106 |
01/31/24 |
$19,973 |
$27,479 |
$20,037 |
02/29/24 |
$20,651 |
$28,946 |
$20,685 |
03/31/24 |
$21,228 |
$29,878 |
$21,279 |
04/30/24 |
$20,420 |
$28,657 |
$20,500 |
05/31/24 |
$21,242 |
$30,078 |
$21,244 |
06/30/24 |
$21,502 |
$31,157 |
$21,542 |
07/31/24 |
$22,064 |
$31,537 |
$22,107 |
08/31/24 |
$22,526 |
$32,302 |
$22,583 |
09/30/24 |
$23,016 |
$32,992 |
$23,083 |
10/31/24 |
$22,381 |
$32,692 |
$22,463 |
11/30/24 |
$23,218 |
$34,611 |
$23,272 |
12/31/24 |
$22,467 |
$33,786 |
$22,536 |
01/31/25 |
$23,133 |
$34,727 |
$23,212 |
02/28/25 |
$23,148 |
$34,274 |
$23,174 |
03/31/25 |
$22,467 |
$32,343 |
$22,473 |
04/30/25 |
$22,649 |
$32,124 |
$22,682 |
05/31/25 |
$23,648 |
$34,146 |
$23,691 |
06/30/25 |
$24,617 |
$35,882 |
$24,664 |
07/31/25 |
$24,798 |
$36,687 |
$24,879 |
08/31/25 |
$25,480 |
$37,431 |
$25,517 |
09/30/25 |
$26,282 |
$38,797 |
$26,328 |
10/31/25 |
$26,736 |
$39,706 |
$26,794 |
11/30/25 |
$26,797 |
$39,803 |
$26,850 |
12/31/25 |
$27,002 |
$39,827 |
$27,061 |
|
| Average Annual Return [Table Text Block] |
Name |
1 Year |
5 Years |
10 Years |
SSDEX |
20.19% |
8.10% |
10.44% |
S&P 500 Index |
17.88% |
14.42% |
14.82% |
State Street Target Retirement 2045 Composite Index |
20.08% |
8.12% |
10.47% | |
| Updated Performance Information Location [Text Block] |
Updated performance information is available by calling 1-800-647-7327 or visiting our website at www.ssga.com.
|
| AssetsNet |
$ 3,074,034,911
|
| Holdings Count | Holding |
7
|
| Advisory Fees Paid, Amount |
$ 0
|
| InvestmentCompanyPortfolioTurnover |
18.00%
|
| Additional Fund Statistics [Text Block] |
Key Fund Statistics as of 12/31/2025- Total Net Assets$3,074,034,911
- Number of Portfolio Holdings7
- Portfolio Turnover Rate18%
- Total Advisory Fees Paid$0
|
| Holdings [Text Block] |
Asset Types |
% |
Domestic Equity |
47.0% |
International Equity |
35.0% |
Domestic Fixed Income |
17.8% |
Short-Term Investments |
0.3% | |
| Largest Holdings [Text Block] |
Holdings |
% |
State Street Equity 500 Index II Portfolio |
37.6% |
State Street Global All Cap Equity ex-U.S. Index Portfolio |
35.0% |
State Street SPDR Portfolio Long Term Treasury ETF |
9.8% |
State Street Small/Mid Cap Equity Index Portfolio |
9.5% |
State Street Aggregate Bond Index Portfolio |
8.0% | |
| Material Fund Change [Text Block] |
|
| C000232290 |
|
| Shareholder Report [Line Items] |
|
| Fund Name |
State Street Target Retirement 2050 Fund
|
| Class Name |
Class R3
|
| Trading Symbol |
SSAUX
|
| Annual or Semi-Annual Statement [Text Block] |
This annual shareholder report contains important information about the State Street Target Retirement 2050 Fund (the "Fund") for the period of January 1, 2025 through December 31, 2025.
|
| Additional Information [Text Block] |
You can find additional information about the Fund, including the Prospectus, Statement of Additional Information, financial statements and other information at www.ssga.com/us/en/institutional/fund-finder?tab=documents&type=mf. You can also request this information about the Fund by contacting us at 1-800-647-7327.
|
| Additional Information Phone Number |
1-800-647-7327
|
| Additional Information Website |
www.ssga.com/us/en/institutional/fund-finder?tab=documents&type=mf
|
| Expenses [Text Block] |
What were the Fund costs for the last year? (based on a hypothetical $10,000 Investment)
Class Name |
Costs of a $10,000 investment |
Costs paid as a percentage of a $10,000 investment |
Class R3 |
$62 |
0.56% | Does not include expenses of the Underlying Funds in which the Fund invests. |
| Expenses Paid, Amount |
$ 62
|
| Expense Ratio, Percent |
0.56%
|
| Factors Affecting Performance [Text Block] |
How did the Fund perform last year and what affected its performance?The main driver of the Fund’s performance on an absolute basis during the reporting period was its position in the State Street Global Equity ex-US Index Portfolio which returned approximately 32.7% for the reporting period. On an individual security level, the top positive contributors to the Fund’s performance on an absolute basis during the reporting period were the State Street Global Equity ex-US Index Portfolio, the State Street Equity 500 Index II Portfolio, and the State Street Small/Mid Cap Equity Index Portfolio. There were no negative contributors to the Fund’s performance on an absolute basis during the reporting period. |
| Performance Past Does Not Indicate Future [Text] |
The Fund’s past performance is not necessarily an indication of how the Fund will perform in the future. The returns do not reflect the deduction of taxes that a shareholder would pay on Fund distributions or on the redemption or sale of Fund shares.
|
| Line Graph [Table Text Block] |

|
SSAUX |
S&P 500 Index |
State Street Target Retirement 2050 Composite Index |
12/31/15 |
$10,000 |
$10,000 |
$10,000 |
01/31/16 |
$9,517 |
$9,504 |
$9,478 |
02/29/16 |
$9,482 |
$9,491 |
$9,472 |
03/31/16 |
$10,112 |
$10,135 |
$10,108 |
04/30/16 |
$10,243 |
$10,174 |
$10,239 |
05/31/16 |
$10,291 |
$10,357 |
$10,288 |
06/30/16 |
$10,339 |
$10,384 |
$10,306 |
07/31/16 |
$10,729 |
$10,766 |
$10,746 |
08/31/16 |
$10,755 |
$10,782 |
$10,782 |
09/30/16 |
$10,824 |
$10,784 |
$10,829 |
10/31/16 |
$10,549 |
$10,587 |
$10,585 |
11/30/16 |
$10,680 |
$10,979 |
$10,716 |
12/31/16 |
$10,881 |
$11,196 |
$10,921 |
01/31/17 |
$11,118 |
$11,408 |
$11,175 |
02/28/17 |
$11,409 |
$11,861 |
$11,471 |
03/31/17 |
$11,499 |
$11,875 |
$11,569 |
04/30/17 |
$11,662 |
$11,997 |
$11,743 |
05/31/17 |
$11,868 |
$12,166 |
$11,948 |
06/30/17 |
$11,947 |
$12,242 |
$12,040 |
07/31/17 |
$12,204 |
$12,494 |
$12,303 |
08/31/17 |
$12,273 |
$12,532 |
$12,373 |
09/30/17 |
$12,499 |
$12,790 |
$12,613 |
10/31/17 |
$12,724 |
$13,089 |
$12,840 |
11/30/17 |
$12,981 |
$13,490 |
$13,099 |
12/31/17 |
$13,146 |
$13,640 |
$13,288 |
01/31/18 |
$13,720 |
$14,421 |
$13,867 |
02/28/18 |
$13,135 |
$13,890 |
$13,316 |
03/31/18 |
$13,022 |
$13,537 |
$13,155 |
04/30/18 |
$13,049 |
$13,589 |
$13,228 |
05/31/18 |
$13,205 |
$13,916 |
$13,377 |
06/30/18 |
$13,178 |
$14,002 |
$13,346 |
07/31/18 |
$13,483 |
$14,523 |
$13,661 |
08/31/18 |
$13,670 |
$14,996 |
$13,862 |
09/30/18 |
$13,643 |
$15,081 |
$13,833 |
10/31/18 |
$12,621 |
$14,050 |
$12,803 |
11/30/18 |
$12,829 |
$14,337 |
$13,014 |
12/31/18 |
$12,017 |
$13,042 |
$12,201 |
01/31/19 |
$12,955 |
$14,087 |
$13,144 |
02/28/19 |
$13,276 |
$14,540 |
$13,495 |
03/31/19 |
$13,450 |
$14,822 |
$13,664 |
04/30/19 |
$13,837 |
$15,422 |
$14,066 |
05/31/19 |
$13,158 |
$14,442 |
$13,377 |
06/30/19 |
$13,937 |
$15,460 |
$14,187 |
07/31/19 |
$13,976 |
$15,682 |
$14,247 |
08/31/19 |
$13,802 |
$15,434 |
$14,052 |
09/30/19 |
$13,998 |
$15,723 |
$14,261 |
10/31/19 |
$14,305 |
$16,063 |
$14,583 |
11/30/19 |
$14,657 |
$16,646 |
$14,945 |
12/31/19 |
$15,044 |
$17,149 |
$15,363 |
01/31/20 |
$14,954 |
$17,142 |
$15,304 |
02/29/20 |
$14,029 |
$15,731 |
$14,306 |
03/31/20 |
$12,246 |
$13,788 |
$12,526 |
04/30/20 |
$13,517 |
$15,555 |
$13,832 |
05/31/20 |
$14,131 |
$16,296 |
$14,441 |
06/30/20 |
$14,578 |
$16,620 |
$14,880 |
07/31/20 |
$15,298 |
$17,558 |
$15,640 |
08/31/20 |
$16,053 |
$18,820 |
$16,440 |
09/30/20 |
$15,642 |
$18,105 |
$15,999 |
10/31/20 |
$15,302 |
$17,623 |
$15,671 |
11/30/20 |
$17,139 |
$19,552 |
$17,573 |
12/31/20 |
$17,928 |
$20,304 |
$18,397 |
01/31/21 |
$17,858 |
$20,099 |
$18,343 |
02/28/21 |
$18,234 |
$20,653 |
$18,730 |
03/31/21 |
$18,523 |
$21,558 |
$19,034 |
04/30/21 |
$19,244 |
$22,708 |
$19,792 |
05/31/21 |
$19,483 |
$22,867 |
$20,060 |
06/30/21 |
$19,747 |
$23,401 |
$20,327 |
07/31/21 |
$19,825 |
$23,956 |
$20,418 |
08/31/21 |
$20,236 |
$24,685 |
$20,854 |
09/30/21 |
$19,438 |
$23,537 |
$20,077 |
10/31/21 |
$20,317 |
$25,186 |
$20,960 |
11/30/21 |
$19,754 |
$25,011 |
$20,410 |
12/31/21 |
$20,401 |
$26,132 |
$21,077 |
01/31/22 |
$19,384 |
$24,780 |
$19,961 |
02/28/22 |
$18,929 |
$24,038 |
$19,576 |
03/31/22 |
$19,097 |
$24,931 |
$19,784 |
04/30/22 |
$17,571 |
$22,757 |
$18,223 |
05/31/22 |
$17,610 |
$22,798 |
$18,200 |
06/30/22 |
$16,213 |
$20,916 |
$16,753 |
07/31/22 |
$17,299 |
$22,845 |
$17,868 |
08/31/22 |
$16,653 |
$21,913 |
$17,265 |
09/30/22 |
$15,089 |
$19,895 |
$15,642 |
10/31/22 |
$15,851 |
$21,506 |
$16,424 |
11/30/22 |
$17,093 |
$22,708 |
$17,647 |
12/31/22 |
$16,412 |
$21,399 |
$17,032 |
01/31/23 |
$17,675 |
$22,744 |
$18,314 |
02/28/23 |
$17,145 |
$22,189 |
$17,797 |
03/31/23 |
$17,512 |
$23,004 |
$18,164 |
04/30/23 |
$17,675 |
$23,363 |
$18,330 |
05/31/23 |
$17,403 |
$23,464 |
$18,073 |
06/30/23 |
$18,341 |
$25,015 |
$19,039 |
07/31/23 |
$18,939 |
$25,818 |
$19,695 |
08/31/23 |
$18,341 |
$25,407 |
$19,081 |
09/30/23 |
$17,526 |
$24,196 |
$18,234 |
10/31/23 |
$16,873 |
$23,687 |
$17,530 |
11/30/23 |
$18,409 |
$25,850 |
$19,167 |
12/31/23 |
$19,505 |
$27,025 |
$20,332 |
01/31/24 |
$19,393 |
$27,479 |
$20,251 |
02/29/24 |
$20,105 |
$28,946 |
$20,965 |
03/31/24 |
$20,677 |
$29,878 |
$21,591 |
04/30/24 |
$19,882 |
$28,657 |
$20,783 |
05/31/24 |
$20,677 |
$30,078 |
$21,555 |
06/30/24 |
$20,914 |
$31,157 |
$21,850 |
07/31/24 |
$21,472 |
$31,537 |
$22,442 |
08/31/24 |
$21,919 |
$32,302 |
$22,927 |
09/30/24 |
$22,393 |
$32,992 |
$23,444 |
10/31/24 |
$21,765 |
$32,692 |
$22,819 |
11/30/24 |
$22,630 |
$34,611 |
$23,696 |
12/31/24 |
$21,842 |
$33,786 |
$22,912 |
01/31/25 |
$22,525 |
$34,727 |
$23,641 |
02/28/25 |
$22,496 |
$34,274 |
$23,550 |
03/31/25 |
$21,784 |
$32,343 |
$22,789 |
04/30/25 |
$21,943 |
$32,124 |
$23,011 |
05/31/25 |
$22,975 |
$34,146 |
$24,111 |
06/30/25 |
$23,949 |
$35,882 |
$25,137 |
07/31/25 |
$24,123 |
$36,687 |
$25,374 |
08/31/25 |
$24,806 |
$37,431 |
$26,056 |
09/30/25 |
$25,606 |
$38,797 |
$26,907 |
10/31/25 |
$26,056 |
$39,706 |
$27,395 |
11/30/25 |
$26,085 |
$39,803 |
$27,445 |
12/31/25 |
$26,293 |
$39,827 |
$27,677 |
|
| Average Annual Return [Table Text Block] |
Name |
1 Year |
5 Years |
10 Years |
SSAUXFootnote Reference(1) |
20.38% |
7.96% |
10.15% |
S&P 500 Index |
17.88% |
14.42% |
14.82% |
State Street Target Retirement 2050 Composite Index |
20.80% |
8.51% |
10.72% | |
| Updated Performance Information Location [Text Block] |
Updated performance information is available by calling 1-800-647-7327 or visiting our website at www.ssga.com.
|
| AssetsNet |
$ 2,666,361,416
|
| Holdings Count | Holding |
6
|
| Advisory Fees Paid, Amount |
$ 0
|
| InvestmentCompanyPortfolioTurnover |
17.00%
|
| Additional Fund Statistics [Text Block] |
Key Fund Statistics as of 12/31/2025- Total Net Assets$2,666,361,416
- Number of Portfolio Holdings6
- Portfolio Turnover Rate17%
- Total Advisory Fees Paid$0
|
| Holdings [Text Block] |
Asset Types |
% |
Domestic Equity |
49.8% |
International Equity |
37.1% |
Domestic Fixed Income |
12.8% |
Short-Term Investments |
0.2% | |
| Largest Holdings [Text Block] |
Holdings |
% |
State Street Equity 500 Index II Portfolio |
38.4% |
State Street Global All Cap Equity ex-U.S. Index Portfolio |
37.1% |
State Street Small/Mid Cap Equity Index Portfolio |
11.5% |
State Street SPDR Portfolio Long Term Treasury ETF |
9.8% |
State Street Aggregate Bond Index Portfolio |
3.0% | |
| Material Fund Change [Text Block] |
|
| C000143828 |
|
| Shareholder Report [Line Items] |
|
| Fund Name |
State Street Target Retirement 2050 Fund
|
| Class Name |
Class I
|
| Trading Symbol |
SSDJX
|
| Annual or Semi-Annual Statement [Text Block] |
This annual shareholder report contains important information about the State Street Target Retirement 2050 Fund (the "Fund") for the period of January 1, 2025 through December 31, 2025.
|
| Additional Information [Text Block] |
You can find additional information about the Fund, including the Prospectus, Statement of Additional Information, financial statements and other information at www.ssga.com/us/en/institutional/fund-finder?tab=documents&type=mf. You can also request this information about the Fund by contacting us at 1-800-647-7327.
|
| Additional Information Phone Number |
1-800-647-7327
|
| Additional Information Website |
www.ssga.com/us/en/institutional/fund-finder?tab=documents&type=mf
|
| Expenses [Text Block] |
What were the Fund costs for the last year? (based on a hypothetical $10,000 Investment)
Class Name |
Costs of a $10,000 investment |
Costs paid as a percentage of a $10,000 investment |
Class I |
$23 |
0.21% | Does not include expenses of the Underlying Funds in which the Fund invests. |
| Expenses Paid, Amount |
$ 23
|
| Expense Ratio, Percent |
0.21%
|
| Factors Affecting Performance [Text Block] |
How did the Fund perform last year and what affected its performance?The main driver of the Fund’s performance on an absolute basis during the reporting period was its position in the State Street Global Equity ex-US Index Portfolio which returned approximately 32.7% for the reporting period. On an individual security level, the top positive contributors to the Fund’s performance on an absolute basis during the reporting period were the State Street Global Equity ex-US Index Portfolio, the State Street Equity 500 Index II Portfolio, and the State Street Small/Mid Cap Equity Index Portfolio. There were no negative contributors to the Fund’s performance on an absolute basis during the reporting period. |
| Performance Past Does Not Indicate Future [Text] |
The Fund’s past performance is not necessarily an indication of how the Fund will perform in the future. The returns do not reflect the deduction of taxes that a shareholder would pay on Fund distributions or on the redemption or sale of Fund shares.
|
| Line Graph [Table Text Block] |

|
SSDJX |
S&P 500 Index |
State Street Target Retirement 2050 Composite Index |
12/31/15 |
$10,000 |
$10,000 |
$10,000 |
01/31/16 |
$9,511 |
$9,504 |
$9,478 |
02/29/16 |
$9,480 |
$9,491 |
$9,472 |
03/31/16 |
$10,114 |
$10,135 |
$10,108 |
04/30/16 |
$10,260 |
$10,174 |
$10,239 |
05/31/16 |
$10,301 |
$10,357 |
$10,288 |
06/30/16 |
$10,353 |
$10,384 |
$10,306 |
07/31/16 |
$10,759 |
$10,766 |
$10,746 |
08/31/16 |
$10,790 |
$10,782 |
$10,782 |
09/30/16 |
$10,863 |
$10,784 |
$10,829 |
10/31/16 |
$10,593 |
$10,587 |
$10,585 |
11/30/16 |
$10,728 |
$10,979 |
$10,716 |
12/31/16 |
$10,934 |
$11,196 |
$10,921 |
01/31/17 |
$11,167 |
$11,408 |
$11,175 |
02/28/17 |
$11,463 |
$11,861 |
$11,471 |
03/31/17 |
$11,558 |
$11,875 |
$11,569 |
04/30/17 |
$11,727 |
$11,997 |
$11,743 |
05/31/17 |
$11,939 |
$12,166 |
$11,948 |
06/30/17 |
$12,023 |
$12,242 |
$12,040 |
07/31/17 |
$12,288 |
$12,494 |
$12,303 |
08/31/17 |
$12,351 |
$12,532 |
$12,373 |
09/30/17 |
$12,594 |
$12,790 |
$12,613 |
10/31/17 |
$12,827 |
$13,089 |
$12,840 |
11/30/17 |
$13,091 |
$13,490 |
$13,099 |
12/31/17 |
$13,263 |
$13,640 |
$13,288 |
01/31/18 |
$13,848 |
$14,421 |
$13,867 |
02/28/18 |
$13,274 |
$13,890 |
$13,316 |
03/31/18 |
$13,155 |
$13,537 |
$13,155 |
04/30/18 |
$13,187 |
$13,589 |
$13,228 |
05/31/18 |
$13,350 |
$13,916 |
$13,377 |
06/30/18 |
$13,328 |
$14,002 |
$13,346 |
07/31/18 |
$13,643 |
$14,523 |
$13,661 |
08/31/18 |
$13,838 |
$14,996 |
$13,862 |
09/30/18 |
$13,816 |
$15,081 |
$13,833 |
10/31/18 |
$12,787 |
$14,050 |
$12,803 |
11/30/18 |
$12,992 |
$14,337 |
$13,014 |
12/31/18 |
$12,183 |
$13,042 |
$12,201 |
01/31/19 |
$13,128 |
$14,087 |
$13,144 |
02/28/19 |
$13,470 |
$14,540 |
$13,495 |
03/31/19 |
$13,641 |
$14,822 |
$13,664 |
04/30/19 |
$14,039 |
$15,422 |
$14,066 |
05/31/19 |
$13,368 |
$14,442 |
$13,377 |
06/30/19 |
$14,165 |
$15,460 |
$14,187 |
07/31/19 |
$14,199 |
$15,682 |
$14,247 |
08/31/19 |
$14,028 |
$15,434 |
$14,052 |
09/30/19 |
$14,233 |
$15,723 |
$14,261 |
10/31/19 |
$14,552 |
$16,063 |
$14,583 |
11/30/19 |
$14,916 |
$16,646 |
$14,945 |
12/31/19 |
$15,322 |
$17,149 |
$15,363 |
01/31/20 |
$15,237 |
$17,142 |
$15,304 |
02/29/20 |
$14,301 |
$15,731 |
$14,306 |
03/31/20 |
$12,489 |
$13,788 |
$12,526 |
04/30/20 |
$13,790 |
$15,555 |
$13,832 |
05/31/20 |
$14,422 |
$16,296 |
$14,441 |
06/30/20 |
$14,872 |
$16,620 |
$14,880 |
07/31/20 |
$15,614 |
$17,558 |
$15,640 |
08/31/20 |
$16,404 |
$18,820 |
$16,440 |
09/30/20 |
$15,979 |
$18,105 |
$15,999 |
10/31/20 |
$15,650 |
$17,623 |
$15,671 |
11/30/20 |
$17,523 |
$19,552 |
$17,573 |
12/31/20 |
$18,335 |
$20,304 |
$18,397 |
01/31/21 |
$18,272 |
$20,099 |
$18,343 |
02/28/21 |
$18,652 |
$20,653 |
$18,730 |
03/31/21 |
$18,968 |
$21,558 |
$19,034 |
04/30/21 |
$19,703 |
$22,708 |
$19,792 |
05/31/21 |
$19,956 |
$22,867 |
$20,060 |
06/30/21 |
$20,235 |
$23,401 |
$20,327 |
07/31/21 |
$20,323 |
$23,956 |
$20,418 |
08/31/21 |
$20,589 |
$24,685 |
$20,854 |
09/30/21 |
$19,779 |
$23,537 |
$20,077 |
10/31/21 |
$20,665 |
$25,186 |
$20,960 |
11/30/21 |
$20,108 |
$25,011 |
$20,410 |
12/31/21 |
$20,741 |
$26,132 |
$21,077 |
01/31/22 |
$19,719 |
$24,780 |
$19,961 |
02/28/22 |
$19,267 |
$24,038 |
$19,576 |
03/31/22 |
$19,440 |
$24,931 |
$19,784 |
04/30/22 |
$17,886 |
$22,757 |
$18,223 |
05/31/22 |
$17,926 |
$22,798 |
$18,200 |
06/30/22 |
$16,518 |
$20,916 |
$16,753 |
07/31/22 |
$17,621 |
$22,845 |
$17,868 |
08/31/22 |
$16,983 |
$21,913 |
$17,265 |
09/30/22 |
$15,390 |
$19,895 |
$15,642 |
10/31/22 |
$16,173 |
$21,506 |
$16,424 |
11/30/22 |
$17,435 |
$22,708 |
$17,647 |
12/31/22 |
$16,761 |
$21,399 |
$17,032 |
01/31/23 |
$18,050 |
$22,744 |
$18,314 |
02/28/23 |
$17,503 |
$22,189 |
$17,797 |
03/31/23 |
$17,882 |
$23,004 |
$18,164 |
04/30/23 |
$18,050 |
$23,363 |
$18,330 |
05/31/23 |
$17,784 |
$23,464 |
$18,073 |
06/30/23 |
$18,751 |
$25,015 |
$19,039 |
07/31/23 |
$19,381 |
$25,818 |
$19,695 |
08/31/23 |
$18,765 |
$25,407 |
$19,081 |
09/30/23 |
$17,938 |
$24,196 |
$18,234 |
10/31/23 |
$17,265 |
$23,687 |
$17,530 |
11/30/23 |
$18,849 |
$25,850 |
$19,167 |
12/31/23 |
$19,972 |
$27,025 |
$20,332 |
01/31/24 |
$19,870 |
$27,479 |
$20,251 |
02/29/24 |
$20,593 |
$28,946 |
$20,965 |
03/31/24 |
$21,185 |
$29,878 |
$21,591 |
04/30/24 |
$20,376 |
$28,657 |
$20,783 |
05/31/24 |
$21,200 |
$30,078 |
$21,555 |
06/30/24 |
$21,460 |
$31,157 |
$21,850 |
07/31/24 |
$22,024 |
$31,537 |
$22,442 |
08/31/24 |
$22,500 |
$32,302 |
$22,927 |
09/30/24 |
$22,992 |
$32,992 |
$23,444 |
10/31/24 |
$22,356 |
$32,692 |
$22,819 |
11/30/24 |
$23,238 |
$34,611 |
$23,696 |
12/31/24 |
$22,445 |
$33,786 |
$22,912 |
01/31/25 |
$23,155 |
$34,727 |
$23,641 |
02/28/25 |
$23,125 |
$34,274 |
$23,550 |
03/31/25 |
$22,399 |
$32,343 |
$22,789 |
04/30/25 |
$22,566 |
$32,124 |
$23,011 |
05/31/25 |
$23,639 |
$34,146 |
$24,111 |
06/30/25 |
$24,651 |
$35,882 |
$25,137 |
07/31/25 |
$24,833 |
$36,687 |
$25,374 |
08/31/25 |
$25,558 |
$37,431 |
$26,056 |
09/30/25 |
$26,390 |
$38,797 |
$26,907 |
10/31/25 |
$26,858 |
$39,706 |
$27,395 |
11/30/25 |
$26,903 |
$39,803 |
$27,445 |
12/31/25 |
$27,095 |
$39,827 |
$27,677 |
|
| Average Annual Return [Table Text Block] |
Name |
1 Year |
5 Years |
10 Years |
SSDJX |
20.72% |
8.12% |
10.48% |
S&P 500 Index |
17.88% |
14.42% |
14.82% |
State Street Target Retirement 2050 Composite Index |
20.80% |
8.51% |
10.72% | |
| Updated Performance Information Location [Text Block] |
Updated performance information is available by calling 1-800-647-7327 or visiting our website at www.ssga.com.
|
| AssetsNet |
$ 2,666,361,416
|
| Holdings Count | Holding |
6
|
| Advisory Fees Paid, Amount |
$ 0
|
| InvestmentCompanyPortfolioTurnover |
17.00%
|
| Additional Fund Statistics [Text Block] |
Key Fund Statistics as of 12/31/2025- Total Net Assets$2,666,361,416
- Number of Portfolio Holdings6
- Portfolio Turnover Rate17%
- Total Advisory Fees Paid$0
|
| Holdings [Text Block] |
Asset Types |
% |
Domestic Equity |
49.8% |
International Equity |
37.1% |
Domestic Fixed Income |
12.8% |
Short-Term Investments |
0.2% | |
| Largest Holdings [Text Block] |
Holdings |
% |
State Street Equity 500 Index II Portfolio |
38.4% |
State Street Global All Cap Equity ex-U.S. Index Portfolio |
37.1% |
State Street Small/Mid Cap Equity Index Portfolio |
11.5% |
State Street SPDR Portfolio Long Term Treasury ETF |
9.8% |
State Street Aggregate Bond Index Portfolio |
3.0% | |
| Material Fund Change [Text Block] |
|
| C000143829 |
|
| Shareholder Report [Line Items] |
|
| Fund Name |
State Street Target Retirement 2050 Fund
|
| Class Name |
Class K
|
| Trading Symbol |
SSDLX
|
| Annual or Semi-Annual Statement [Text Block] |
This annual shareholder report contains important information about the State Street Target Retirement 2050 Fund (the "Fund") for the period of January 1, 2025 through December 31, 2025.
|
| Additional Information [Text Block] |
You can find additional information about the Fund, including the Prospectus, Statement of Additional Information, financial statements and other information at www.ssga.com/us/en/institutional/fund-finder?tab=documents&type=mf. You can also request this information about the Fund by contacting us at 1-800-647-7327.
|
| Additional Information Phone Number |
1-800-647-7327
|
| Additional Information Website |
www.ssga.com/us/en/institutional/fund-finder?tab=documents&type=mf
|
| Expenses [Text Block] |
What were the Fund costs for the last year? (based on a hypothetical $10,000 Investment)
Class Name |
Costs of a $10,000 investment |
Costs paid as a percentage of a $10,000 investment |
Class K |
$7 |
0.06% | Does not include expenses of the Underlying Funds in which the Fund invests. |
| Expenses Paid, Amount |
$ 7
|
| Expense Ratio, Percent |
0.06%
|
| Factors Affecting Performance [Text Block] |
How did the Fund perform last year and what affected its performance?The main driver of the Fund’s performance on an absolute basis during the reporting period was its position in the State Street Global Equity ex-US Index Portfolio which returned approximately 32.7% for the reporting period. On an individual security level, the top positive contributors to the Fund’s performance on an absolute basis during the reporting period were the State Street Global Equity ex-US Index Portfolio, the State Street Equity 500 Index II Portfolio, and the State Street Small/Mid Cap Equity Index Portfolio. There were no negative contributors to the Fund’s performance on an absolute basis during the reporting period. |
| Performance Past Does Not Indicate Future [Text] |
The Fund’s past performance is not necessarily an indication of how the Fund will perform in the future. The returns do not reflect the deduction of taxes that a shareholder would pay on Fund distributions or on the redemption or sale of Fund shares.
|
| Line Graph [Table Text Block] |

|
SSDLX |
S&P 500 Index |
State Street Target Retirement 2050 Composite Index |
12/31/15 |
$10,000 |
$10,000 |
$10,000 |
01/31/16 |
$9,521 |
$9,504 |
$9,478 |
02/29/16 |
$9,490 |
$9,491 |
$9,472 |
03/31/16 |
$10,125 |
$10,135 |
$10,108 |
04/30/16 |
$10,260 |
$10,174 |
$10,239 |
05/31/16 |
$10,312 |
$10,357 |
$10,288 |
06/30/16 |
$10,364 |
$10,384 |
$10,306 |
07/31/16 |
$10,760 |
$10,766 |
$10,746 |
08/31/16 |
$10,791 |
$10,782 |
$10,782 |
09/30/16 |
$10,864 |
$10,784 |
$10,829 |
10/31/16 |
$10,593 |
$10,587 |
$10,585 |
11/30/16 |
$10,728 |
$10,979 |
$10,716 |
12/31/16 |
$10,935 |
$11,196 |
$10,921 |
01/31/17 |
$11,178 |
$11,408 |
$11,175 |
02/28/17 |
$11,475 |
$11,861 |
$11,471 |
03/31/17 |
$11,570 |
$11,875 |
$11,569 |
04/30/17 |
$11,739 |
$11,997 |
$11,743 |
05/31/17 |
$11,951 |
$12,166 |
$11,948 |
06/30/17 |
$12,036 |
$12,242 |
$12,040 |
07/31/17 |
$12,300 |
$12,494 |
$12,303 |
08/31/17 |
$12,375 |
$12,532 |
$12,373 |
09/30/17 |
$12,607 |
$12,790 |
$12,613 |
10/31/17 |
$12,840 |
$13,089 |
$12,840 |
11/30/17 |
$13,105 |
$13,490 |
$13,099 |
12/31/17 |
$13,277 |
$13,640 |
$13,288 |
01/31/18 |
$13,863 |
$14,421 |
$13,867 |
02/28/18 |
$13,277 |
$13,890 |
$13,316 |
03/31/18 |
$13,169 |
$13,537 |
$13,155 |
04/30/18 |
$13,201 |
$13,589 |
$13,228 |
05/31/18 |
$13,364 |
$13,916 |
$13,377 |
06/30/18 |
$13,342 |
$14,002 |
$13,346 |
07/31/18 |
$13,657 |
$14,523 |
$13,661 |
08/31/18 |
$13,852 |
$14,996 |
$13,862 |
09/30/18 |
$13,830 |
$15,081 |
$13,833 |
10/31/18 |
$12,800 |
$14,050 |
$12,803 |
11/30/18 |
$13,017 |
$14,337 |
$13,014 |
12/31/18 |
$12,198 |
$13,042 |
$12,201 |
01/31/19 |
$13,156 |
$14,087 |
$13,144 |
02/28/19 |
$13,486 |
$14,540 |
$13,495 |
03/31/19 |
$13,669 |
$14,822 |
$13,664 |
04/30/19 |
$14,068 |
$15,422 |
$14,066 |
05/31/19 |
$13,384 |
$14,442 |
$13,377 |
06/30/19 |
$14,182 |
$15,460 |
$14,187 |
07/31/19 |
$14,227 |
$15,682 |
$14,247 |
08/31/19 |
$14,056 |
$15,434 |
$14,052 |
09/30/19 |
$14,261 |
$15,723 |
$14,261 |
10/31/19 |
$14,581 |
$16,063 |
$14,583 |
11/30/19 |
$14,945 |
$16,646 |
$14,945 |
12/31/19 |
$15,347 |
$17,149 |
$15,363 |
01/31/20 |
$15,261 |
$17,142 |
$15,304 |
02/29/20 |
$14,323 |
$15,731 |
$14,306 |
03/31/20 |
$12,509 |
$13,788 |
$12,526 |
04/30/20 |
$13,812 |
$15,555 |
$13,832 |
05/31/20 |
$14,445 |
$16,296 |
$14,441 |
06/30/20 |
$14,908 |
$16,620 |
$14,880 |
07/31/20 |
$15,651 |
$17,558 |
$15,640 |
08/31/20 |
$16,431 |
$18,820 |
$16,440 |
09/30/20 |
$16,016 |
$18,105 |
$15,999 |
10/31/20 |
$15,675 |
$17,623 |
$15,671 |
11/30/20 |
$17,563 |
$19,552 |
$17,573 |
12/31/20 |
$18,380 |
$20,304 |
$18,397 |
01/31/21 |
$18,316 |
$20,099 |
$18,343 |
02/28/21 |
$18,709 |
$20,653 |
$18,730 |
03/31/21 |
$19,014 |
$21,558 |
$19,034 |
04/30/21 |
$19,762 |
$22,708 |
$19,792 |
05/31/21 |
$20,016 |
$22,867 |
$20,060 |
06/30/21 |
$20,295 |
$23,401 |
$20,327 |
07/31/21 |
$20,384 |
$23,956 |
$20,418 |
08/31/21 |
$20,815 |
$24,685 |
$20,854 |
09/30/21 |
$20,003 |
$23,537 |
$20,077 |
10/31/21 |
$20,916 |
$25,186 |
$20,960 |
11/30/21 |
$20,346 |
$25,011 |
$20,410 |
12/31/21 |
$21,021 |
$26,132 |
$21,077 |
01/31/22 |
$19,981 |
$24,780 |
$19,961 |
02/28/22 |
$19,528 |
$24,038 |
$19,576 |
03/31/22 |
$19,701 |
$24,931 |
$19,784 |
04/30/22 |
$18,128 |
$22,757 |
$18,223 |
05/31/22 |
$18,182 |
$22,798 |
$18,200 |
06/30/22 |
$16,742 |
$20,916 |
$16,753 |
07/31/22 |
$17,875 |
$22,845 |
$17,868 |
08/31/22 |
$17,222 |
$21,913 |
$17,265 |
09/30/22 |
$15,609 |
$19,895 |
$15,642 |
10/31/22 |
$16,409 |
$21,506 |
$16,424 |
11/30/22 |
$17,688 |
$22,708 |
$17,647 |
12/31/22 |
$17,007 |
$21,399 |
$17,032 |
01/31/23 |
$18,316 |
$22,744 |
$18,314 |
02/28/23 |
$17,767 |
$22,189 |
$17,797 |
03/31/23 |
$18,161 |
$23,004 |
$18,164 |
04/30/23 |
$18,330 |
$23,363 |
$18,330 |
05/31/23 |
$18,048 |
$23,464 |
$18,073 |
06/30/23 |
$19,034 |
$25,015 |
$19,039 |
07/31/23 |
$19,681 |
$25,818 |
$19,695 |
08/31/23 |
$19,062 |
$25,407 |
$19,081 |
09/30/23 |
$18,217 |
$24,196 |
$18,234 |
10/31/23 |
$17,541 |
$23,687 |
$17,530 |
11/30/23 |
$19,146 |
$25,850 |
$19,167 |
12/31/23 |
$20,299 |
$27,025 |
$20,332 |
01/31/24 |
$20,197 |
$27,479 |
$20,251 |
02/29/24 |
$20,938 |
$28,946 |
$20,965 |
03/31/24 |
$21,548 |
$29,878 |
$21,591 |
04/30/24 |
$20,720 |
$28,657 |
$20,783 |
05/31/24 |
$21,563 |
$30,078 |
$21,555 |
06/30/24 |
$21,825 |
$31,157 |
$21,850 |
07/31/24 |
$22,406 |
$31,537 |
$22,442 |
08/31/24 |
$22,885 |
$32,302 |
$22,927 |
09/30/24 |
$23,394 |
$32,992 |
$23,444 |
10/31/24 |
$22,740 |
$32,692 |
$22,819 |
11/30/24 |
$23,655 |
$34,611 |
$23,696 |
12/31/24 |
$22,848 |
$33,786 |
$22,912 |
01/31/25 |
$23,578 |
$34,727 |
$23,641 |
02/28/25 |
$23,548 |
$34,274 |
$23,550 |
03/31/25 |
$22,802 |
$32,343 |
$22,789 |
04/30/25 |
$22,985 |
$32,124 |
$23,011 |
05/31/25 |
$24,080 |
$34,146 |
$24,111 |
06/30/25 |
$25,115 |
$35,882 |
$25,137 |
07/31/25 |
$25,297 |
$36,687 |
$25,374 |
08/31/25 |
$26,027 |
$37,431 |
$26,056 |
09/30/25 |
$26,879 |
$38,797 |
$26,907 |
10/31/25 |
$27,366 |
$39,706 |
$27,395 |
11/30/25 |
$27,412 |
$39,803 |
$27,445 |
12/31/25 |
$27,630 |
$39,827 |
$27,677 |
|
| Average Annual Return [Table Text Block] |
Name |
1 Year |
5 Years |
10 Years |
SSDLX |
20.93% |
8.49% |
10.70% |
S&P 500 Index |
17.88% |
14.42% |
14.82% |
State Street Target Retirement 2050 Composite Index |
20.80% |
8.51% |
10.72% | |
| Updated Performance Information Location [Text Block] |
Updated performance information is available by calling 1-800-647-7327 or visiting our website at www.ssga.com.
|
| AssetsNet |
$ 2,666,361,416
|
| Holdings Count | Holding |
6
|
| Advisory Fees Paid, Amount |
$ 0
|
| InvestmentCompanyPortfolioTurnover |
17.00%
|
| Additional Fund Statistics [Text Block] |
Key Fund Statistics as of 12/31/2025- Total Net Assets$2,666,361,416
- Number of Portfolio Holdings6
- Portfolio Turnover Rate17%
- Total Advisory Fees Paid$0
|
| Holdings [Text Block] |
Asset Types |
% |
Domestic Equity |
49.8% |
International Equity |
37.1% |
Domestic Fixed Income |
12.8% |
Short-Term Investments |
0.2% | |
| Largest Holdings [Text Block] |
Holdings |
% |
State Street Equity 500 Index II Portfolio |
38.4% |
State Street Global All Cap Equity ex-U.S. Index Portfolio |
37.1% |
State Street Small/Mid Cap Equity Index Portfolio |
11.5% |
State Street SPDR Portfolio Long Term Treasury ETF |
9.8% |
State Street Aggregate Bond Index Portfolio |
3.0% | |
| Material Fund Change [Text Block] |
|
| C000232291 |
|
| Shareholder Report [Line Items] |
|
| Fund Name |
State Street Target Retirement 2055 Fund
|
| Class Name |
Class R3
|
| Trading Symbol |
SSAWX
|
| Annual or Semi-Annual Statement [Text Block] |
This annual shareholder report contains important information about the State Street Target Retirement 2055 Fund (the "Fund") for the period of January 1, 2025 through December 31, 2025.
|
| Additional Information [Text Block] |
You can find additional information about the Fund, including the Prospectus, Statement of Additional Information, financial statements and other information at www.ssga.com/us/en/institutional/fund-finder?tab=documents&type=mf. You can also request this information about the Fund by contacting us at 1-800-647-7327.
|
| Additional Information Phone Number |
1-800-647-7327
|
| Additional Information Website |
www.ssga.com/us/en/institutional/fund-finder?tab=documents&type=mf
|
| Expenses [Text Block] |
What were the Fund costs for the last year? (based on a hypothetical $10,000 Investment)
Class Name |
Costs of a $10,000 investment |
Costs paid as a percentage of a $10,000 investment |
Class R3 |
$62 |
0.56% | Does not include expenses of the Underlying Funds in which the Fund invests. |
| Expenses Paid, Amount |
$ 62
|
| Expense Ratio, Percent |
0.56%
|
| Factors Affecting Performance [Text Block] |
How did the Fund perform last year and what affected its performance?The main driver of the Fund’s performance on an absolute basis during the reporting period was its position in the State Street Global Equity ex-US Index Portfolio which returned approximately 32.7% for the reporting period. On an individual security level, the top positive contributors to the Fund’s performance on an absolute basis during the reporting period were the State Street Global Equity ex-US Index Portfolio, the State Street Equity 500 Index II Portfolio, and the State Street Small/Mid Cap Equity Index Portfolio. There were no negative contributors to the Fund’s performance on an absolute basis during the reporting period. |
| Performance Past Does Not Indicate Future [Text] |
The Fund’s past performance is not necessarily an indication of how the Fund will perform in the future. The returns do not reflect the deduction of taxes that a shareholder would pay on Fund distributions or on the redemption or sale of Fund shares.
|
| Line Graph [Table Text Block] |

|
SSAWX |
S&P 500 Index |
State Street Target Retirement 2055 Composite Index |
12/31/15 |
$10,000 |
$10,000 |
$10,000 |
01/31/16 |
$9,516 |
$9,504 |
$9,478 |
02/29/16 |
$9,481 |
$9,491 |
$9,472 |
03/31/16 |
$10,113 |
$10,135 |
$10,108 |
04/30/16 |
$10,244 |
$10,174 |
$10,239 |
05/31/16 |
$10,292 |
$10,357 |
$10,288 |
06/30/16 |
$10,340 |
$10,384 |
$10,306 |
07/31/16 |
$10,741 |
$10,766 |
$10,746 |
08/31/16 |
$10,767 |
$10,782 |
$10,782 |
09/30/16 |
$10,825 |
$10,784 |
$10,829 |
10/31/16 |
$10,561 |
$10,587 |
$10,585 |
11/30/16 |
$10,681 |
$10,979 |
$10,716 |
12/31/16 |
$10,880 |
$11,196 |
$10,921 |
01/31/17 |
$11,128 |
$11,408 |
$11,175 |
02/28/17 |
$11,419 |
$11,861 |
$11,471 |
03/31/17 |
$11,509 |
$11,875 |
$11,569 |
04/30/17 |
$11,673 |
$11,997 |
$11,743 |
05/31/17 |
$11,868 |
$12,166 |
$11,948 |
06/30/17 |
$11,958 |
$12,242 |
$12,040 |
07/31/17 |
$12,216 |
$12,494 |
$12,303 |
08/31/17 |
$12,274 |
$12,532 |
$12,373 |
09/30/17 |
$12,511 |
$12,790 |
$12,613 |
10/31/17 |
$12,726 |
$13,089 |
$12,840 |
11/30/17 |
$12,984 |
$13,490 |
$13,099 |
12/31/17 |
$13,156 |
$13,640 |
$13,288 |
01/31/18 |
$13,731 |
$14,421 |
$13,867 |
02/28/18 |
$13,167 |
$13,890 |
$13,316 |
03/31/18 |
$13,043 |
$13,537 |
$13,155 |
04/30/18 |
$13,081 |
$13,589 |
$13,228 |
05/31/18 |
$13,236 |
$13,916 |
$13,377 |
06/30/18 |
$13,209 |
$14,002 |
$13,346 |
07/31/18 |
$13,515 |
$14,523 |
$13,661 |
08/31/18 |
$13,702 |
$14,996 |
$13,862 |
09/30/18 |
$13,664 |
$15,081 |
$13,833 |
10/31/18 |
$12,651 |
$14,050 |
$12,803 |
11/30/18 |
$12,850 |
$14,337 |
$13,014 |
12/31/18 |
$12,051 |
$13,042 |
$12,201 |
01/31/19 |
$12,982 |
$14,087 |
$13,144 |
02/28/19 |
$13,304 |
$14,540 |
$13,495 |
03/31/19 |
$13,479 |
$14,822 |
$13,664 |
04/30/19 |
$13,868 |
$15,422 |
$14,066 |
05/31/19 |
$13,186 |
$14,442 |
$13,377 |
06/30/19 |
$13,969 |
$15,460 |
$14,187 |
07/31/19 |
$13,997 |
$15,682 |
$14,247 |
08/31/19 |
$13,833 |
$15,434 |
$14,052 |
09/30/19 |
$14,030 |
$15,723 |
$14,261 |
10/31/19 |
$14,327 |
$16,063 |
$14,583 |
11/30/19 |
$14,681 |
$16,646 |
$14,945 |
12/31/19 |
$15,073 |
$17,149 |
$15,363 |
01/31/20 |
$14,983 |
$17,142 |
$15,304 |
02/29/20 |
$14,061 |
$15,731 |
$14,306 |
03/31/20 |
$12,271 |
$13,788 |
$12,526 |
04/30/20 |
$13,538 |
$15,555 |
$13,832 |
05/31/20 |
$14,150 |
$16,296 |
$14,441 |
06/30/20 |
$14,596 |
$16,620 |
$14,880 |
07/31/20 |
$15,314 |
$17,558 |
$15,640 |
08/31/20 |
$16,067 |
$18,820 |
$16,440 |
09/30/20 |
$15,657 |
$18,105 |
$15,999 |
10/31/20 |
$15,318 |
$17,623 |
$15,671 |
11/30/20 |
$17,149 |
$19,552 |
$17,573 |
12/31/20 |
$17,945 |
$20,304 |
$18,397 |
01/31/21 |
$17,876 |
$20,099 |
$18,343 |
02/28/21 |
$18,248 |
$20,653 |
$18,730 |
03/31/21 |
$18,532 |
$21,558 |
$19,034 |
04/30/21 |
$19,256 |
$22,708 |
$19,792 |
05/31/21 |
$19,492 |
$22,867 |
$20,060 |
06/30/21 |
$19,764 |
$23,401 |
$20,327 |
07/31/21 |
$19,841 |
$23,956 |
$20,418 |
08/31/21 |
$20,246 |
$24,685 |
$20,854 |
09/30/21 |
$19,447 |
$23,537 |
$20,077 |
10/31/21 |
$20,326 |
$25,186 |
$20,960 |
11/30/21 |
$19,759 |
$25,011 |
$20,410 |
12/31/21 |
$20,410 |
$26,132 |
$21,077 |
01/31/22 |
$19,397 |
$24,780 |
$19,961 |
02/28/22 |
$18,934 |
$24,038 |
$19,576 |
03/31/22 |
$19,099 |
$24,931 |
$19,784 |
04/30/22 |
$17,575 |
$22,757 |
$18,223 |
05/31/22 |
$17,613 |
$22,798 |
$18,200 |
06/30/22 |
$16,216 |
$20,916 |
$16,753 |
07/31/22 |
$17,295 |
$22,845 |
$17,868 |
08/31/22 |
$16,661 |
$21,913 |
$17,265 |
09/30/22 |
$15,086 |
$19,895 |
$15,642 |
10/31/22 |
$15,861 |
$21,506 |
$16,424 |
11/30/22 |
$17,092 |
$22,708 |
$17,647 |
12/31/22 |
$16,429 |
$21,399 |
$17,032 |
01/31/23 |
$17,691 |
$22,744 |
$18,314 |
02/28/23 |
$17,160 |
$22,189 |
$17,797 |
03/31/23 |
$17,518 |
$23,004 |
$18,164 |
04/30/23 |
$17,678 |
$23,363 |
$18,330 |
05/31/23 |
$17,412 |
$23,464 |
$18,073 |
06/30/23 |
$18,355 |
$25,015 |
$19,042 |
07/31/23 |
$18,966 |
$25,818 |
$19,703 |
08/31/23 |
$18,355 |
$25,407 |
$19,085 |
09/30/23 |
$17,532 |
$24,196 |
$18,237 |
10/31/23 |
$16,881 |
$23,687 |
$17,528 |
11/30/23 |
$18,421 |
$25,850 |
$19,171 |
12/31/23 |
$19,525 |
$27,025 |
$20,342 |
01/31/24 |
$19,416 |
$27,479 |
$20,259 |
02/29/24 |
$20,124 |
$28,946 |
$20,985 |
03/31/24 |
$20,710 |
$29,878 |
$21,616 |
04/30/24 |
$19,906 |
$28,657 |
$20,802 |
05/31/24 |
$20,710 |
$30,078 |
$21,579 |
06/30/24 |
$20,942 |
$31,157 |
$21,873 |
07/31/24 |
$21,500 |
$31,537 |
$22,472 |
08/31/24 |
$21,950 |
$32,302 |
$22,957 |
09/30/24 |
$22,440 |
$32,992 |
$23,477 |
10/31/24 |
$21,800 |
$32,692 |
$22,854 |
11/30/24 |
$22,685 |
$34,611 |
$23,753 |
12/31/24 |
$21,897 |
$33,786 |
$22,954 |
01/31/25 |
$22,591 |
$34,727 |
$23,702 |
02/28/25 |
$22,534 |
$34,274 |
$23,588 |
03/31/25 |
$21,797 |
$32,343 |
$22,806 |
04/30/25 |
$21,967 |
$32,124 |
$23,032 |
05/31/25 |
$23,030 |
$34,146 |
$24,168 |
06/30/25 |
$24,022 |
$35,882 |
$25,213 |
07/31/25 |
$24,207 |
$36,687 |
$25,460 |
08/31/25 |
$24,901 |
$37,431 |
$26,160 |
09/30/25 |
$25,723 |
$38,797 |
$27,026 |
10/31/25 |
$26,177 |
$39,706 |
$27,522 |
11/30/25 |
$26,205 |
$39,803 |
$27,568 |
12/31/25 |
$26,421 |
$39,827 |
$27,810 |
|
| Average Annual Return [Table Text Block] |
Name |
1 Year |
5 Years |
10 Years |
SSAWXFootnote Reference(1) |
20.66% |
8.04% |
10.20% |
S&P 500 Index |
17.88% |
14.42% |
14.82% |
State Street Target Retirement 2055 Composite Index |
21.15% |
8.61% |
10.77% | |
| Updated Performance Information Location [Text Block] |
Updated performance information is available by calling 1-800-647-7327 or visiting our website at www.ssga.com.
|
| AssetsNet |
$ 2,069,269,991
|
| Holdings Count | Holding |
5
|
| Advisory Fees Paid, Amount |
$ 0
|
| InvestmentCompanyPortfolioTurnover |
17.00%
|
| Additional Fund Statistics [Text Block] |
Key Fund Statistics as of 12/31/2025- Total Net Assets$2,069,269,991
- Number of Portfolio Holdings5
- Portfolio Turnover Rate17%
- Total Advisory Fees Paid$0
|
| Holdings [Text Block] |
Asset Types |
% |
Domestic Equity |
51.6% |
International Equity |
38.4% |
Domestic Fixed Income |
9.8% |
Short-Term Investments |
0.2% | |
| Largest Holdings [Text Block] |
Holdings |
% |
State Street Equity 500 Index II Portfolio |
38.7% |
State Street Global All Cap Equity ex-U.S. Index Portfolio |
38.4% |
State Street Small/Mid Cap Equity Index Portfolio |
12.9% |
State Street SPDR Portfolio Long Term Treasury ETF |
9.8% | |
| Material Fund Change [Text Block] |
|
| C000143832 |
|
| Shareholder Report [Line Items] |
|
| Fund Name |
State Street Target Retirement 2055 Fund
|
| Class Name |
Class I
|
| Trading Symbol |
SSDOX
|
| Annual or Semi-Annual Statement [Text Block] |
This annual shareholder report contains important information about the State Street Target Retirement 2055 Fund (the "Fund") for the period of January 1, 2025 through December 31, 2025.
|
| Additional Information [Text Block] |
You can find additional information about the Fund, including the Prospectus, Statement of Additional Information, financial statements and other information at www.ssga.com/us/en/institutional/fund-finder?tab=documents&type=mf. You can also request this information about the Fund by contacting us at 1-800-647-7327.
|
| Additional Information Phone Number |
1-800-647-7327
|
| Additional Information Website |
www.ssga.com/us/en/institutional/fund-finder?tab=documents&type=mf
|
| Expenses [Text Block] |
What were the Fund costs for the last year? (based on a hypothetical $10,000 Investment)
Class Name |
Costs of a $10,000 investment |
Costs paid as a percentage of a $10,000 investment |
Class I |
$28 |
0.25% | Does not include expenses of the Underlying Funds in which the Fund invests. |
| Expenses Paid, Amount |
$ 28
|
| Expense Ratio, Percent |
0.25%
|
| Factors Affecting Performance [Text Block] |
How did the Fund perform last year and what affected its performance?The main driver of the Fund’s performance on an absolute basis during the reporting period was its position in the State Street Global Equity ex-US Index Portfolio which returned approximately 32.7% for the reporting period. On an individual security level, the top positive contributors to the Fund’s performance on an absolute basis during the reporting period were the State Street Global Equity ex-US Index Portfolio, the State Street Equity 500 Index II Portfolio, and the State Street Small/Mid Cap Equity Index Portfolio. There were no negative contributors to the Fund’s performance on an absolute basis during the reporting period. |
| Performance Past Does Not Indicate Future [Text] |
The Fund’s past performance is not necessarily an indication of how the Fund will perform in the future. The returns do not reflect the deduction of taxes that a shareholder would pay on Fund distributions or on the redemption or sale of Fund shares.
|
| Line Graph [Table Text Block] |

|
SSDOX |
S&P 500 Index |
State Street Target Retirement 2055 Composite Index |
12/31/15 |
$10,000 |
$10,000 |
$10,000 |
01/31/16 |
$9,521 |
$9,504 |
$9,478 |
02/29/16 |
$9,490 |
$9,491 |
$9,472 |
03/31/16 |
$10,125 |
$10,135 |
$10,108 |
04/30/16 |
$10,260 |
$10,174 |
$10,239 |
05/31/16 |
$10,313 |
$10,357 |
$10,288 |
06/30/16 |
$10,365 |
$10,384 |
$10,306 |
07/31/16 |
$10,771 |
$10,766 |
$10,746 |
08/31/16 |
$10,802 |
$10,782 |
$10,782 |
09/30/16 |
$10,865 |
$10,784 |
$10,829 |
10/31/16 |
$10,604 |
$10,587 |
$10,585 |
11/30/16 |
$10,729 |
$10,979 |
$10,716 |
12/31/16 |
$10,933 |
$11,196 |
$10,921 |
01/31/17 |
$11,187 |
$11,408 |
$11,175 |
02/28/17 |
$11,484 |
$11,861 |
$11,471 |
03/31/17 |
$11,579 |
$11,875 |
$11,569 |
04/30/17 |
$11,749 |
$11,997 |
$11,743 |
05/31/17 |
$11,950 |
$12,166 |
$11,948 |
06/30/17 |
$12,045 |
$12,242 |
$12,040 |
07/31/17 |
$12,310 |
$12,494 |
$12,303 |
08/31/17 |
$12,374 |
$12,532 |
$12,373 |
09/30/17 |
$12,617 |
$12,790 |
$12,613 |
10/31/17 |
$12,850 |
$13,089 |
$12,840 |
11/30/17 |
$13,115 |
$13,490 |
$13,099 |
12/31/17 |
$13,294 |
$13,640 |
$13,288 |
01/31/18 |
$13,880 |
$14,421 |
$13,867 |
02/28/18 |
$13,316 |
$13,890 |
$13,316 |
03/31/18 |
$13,197 |
$13,537 |
$13,155 |
04/30/18 |
$13,240 |
$13,589 |
$13,228 |
05/31/18 |
$13,403 |
$13,916 |
$13,377 |
06/30/18 |
$13,381 |
$14,002 |
$13,346 |
07/31/18 |
$13,696 |
$14,523 |
$13,661 |
08/31/18 |
$13,891 |
$14,996 |
$13,862 |
09/30/18 |
$13,870 |
$15,081 |
$13,833 |
10/31/18 |
$12,839 |
$14,050 |
$12,803 |
11/30/18 |
$13,045 |
$14,337 |
$13,014 |
12/31/18 |
$12,241 |
$13,042 |
$12,201 |
01/31/19 |
$13,190 |
$14,087 |
$13,144 |
02/28/19 |
$13,522 |
$14,540 |
$13,495 |
03/31/19 |
$13,705 |
$14,822 |
$13,664 |
04/30/19 |
$14,105 |
$15,422 |
$14,066 |
05/31/19 |
$13,419 |
$14,442 |
$13,377 |
06/30/19 |
$14,220 |
$15,460 |
$14,187 |
07/31/19 |
$14,265 |
$15,682 |
$14,247 |
08/31/19 |
$14,094 |
$15,434 |
$14,052 |
09/30/19 |
$14,300 |
$15,723 |
$14,261 |
10/31/19 |
$14,609 |
$16,063 |
$14,583 |
11/30/19 |
$14,975 |
$16,646 |
$14,945 |
12/31/19 |
$15,380 |
$17,149 |
$15,363 |
01/31/20 |
$15,295 |
$17,142 |
$15,304 |
02/29/20 |
$14,361 |
$15,731 |
$14,306 |
03/31/20 |
$12,542 |
$13,788 |
$12,526 |
04/30/20 |
$13,840 |
$15,555 |
$13,832 |
05/31/20 |
$14,470 |
$16,296 |
$14,441 |
06/30/20 |
$14,931 |
$16,620 |
$14,880 |
07/31/20 |
$15,671 |
$17,558 |
$15,640 |
08/31/20 |
$16,460 |
$18,820 |
$16,440 |
09/30/20 |
$16,035 |
$18,105 |
$15,999 |
10/31/20 |
$15,695 |
$17,623 |
$15,671 |
11/30/20 |
$17,575 |
$19,552 |
$17,573 |
12/31/20 |
$18,395 |
$20,304 |
$18,397 |
01/31/21 |
$18,332 |
$20,099 |
$18,343 |
02/28/21 |
$18,707 |
$20,653 |
$18,730 |
03/31/21 |
$19,019 |
$21,558 |
$19,034 |
04/30/21 |
$19,757 |
$22,708 |
$19,792 |
05/31/21 |
$20,007 |
$22,867 |
$20,060 |
06/30/21 |
$20,294 |
$23,401 |
$20,327 |
07/31/21 |
$20,381 |
$23,956 |
$20,418 |
08/31/21 |
$20,681 |
$24,685 |
$20,854 |
09/30/21 |
$19,869 |
$23,537 |
$20,077 |
10/31/21 |
$20,781 |
$25,186 |
$20,960 |
11/30/21 |
$20,207 |
$25,011 |
$20,410 |
12/31/21 |
$20,845 |
$26,132 |
$21,077 |
01/31/22 |
$19,828 |
$24,780 |
$19,961 |
02/28/22 |
$19,358 |
$24,038 |
$19,576 |
03/31/22 |
$19,541 |
$24,931 |
$19,784 |
04/30/22 |
$17,975 |
$22,757 |
$18,223 |
05/31/22 |
$18,027 |
$22,798 |
$18,200 |
06/30/22 |
$16,606 |
$20,916 |
$16,753 |
07/31/22 |
$17,714 |
$22,845 |
$17,868 |
08/31/22 |
$17,062 |
$21,913 |
$17,265 |
09/30/22 |
$15,471 |
$19,895 |
$15,642 |
10/31/22 |
$16,266 |
$21,506 |
$16,424 |
11/30/22 |
$17,532 |
$22,708 |
$17,647 |
12/31/22 |
$16,836 |
$21,399 |
$17,032 |
01/31/23 |
$18,138 |
$22,744 |
$18,314 |
02/28/23 |
$17,604 |
$22,189 |
$17,797 |
03/31/23 |
$17,973 |
$23,004 |
$18,164 |
04/30/23 |
$18,138 |
$23,363 |
$18,330 |
05/31/23 |
$17,864 |
$23,464 |
$18,073 |
06/30/23 |
$18,850 |
$25,015 |
$19,042 |
07/31/23 |
$19,480 |
$25,818 |
$19,703 |
08/31/23 |
$18,864 |
$25,407 |
$19,085 |
09/30/23 |
$18,028 |
$24,196 |
$18,237 |
10/31/23 |
$17,357 |
$23,687 |
$17,528 |
11/30/23 |
$18,946 |
$25,850 |
$19,171 |
12/31/23 |
$20,090 |
$27,025 |
$20,342 |
01/31/24 |
$19,977 |
$27,479 |
$20,259 |
02/29/24 |
$20,725 |
$28,946 |
$20,985 |
03/31/24 |
$21,318 |
$29,878 |
$21,616 |
04/30/24 |
$20,485 |
$28,657 |
$20,802 |
05/31/24 |
$21,332 |
$30,078 |
$21,579 |
06/30/24 |
$21,586 |
$31,157 |
$21,873 |
07/31/24 |
$22,150 |
$31,537 |
$22,472 |
08/31/24 |
$22,630 |
$32,302 |
$22,957 |
09/30/24 |
$23,123 |
$32,992 |
$23,477 |
10/31/24 |
$22,488 |
$32,692 |
$22,854 |
11/30/24 |
$23,406 |
$34,611 |
$23,753 |
12/31/24 |
$22,582 |
$33,786 |
$22,954 |
01/31/25 |
$23,303 |
$34,727 |
$23,702 |
02/28/25 |
$23,259 |
$34,274 |
$23,588 |
03/31/25 |
$22,493 |
$32,343 |
$22,806 |
04/30/25 |
$22,670 |
$32,124 |
$23,032 |
05/31/25 |
$23,790 |
$34,146 |
$24,168 |
06/30/25 |
$24,821 |
$35,882 |
$25,213 |
07/31/25 |
$25,012 |
$36,687 |
$25,460 |
08/31/25 |
$25,749 |
$37,431 |
$26,160 |
09/30/25 |
$26,588 |
$38,797 |
$27,026 |
10/31/25 |
$27,074 |
$39,706 |
$27,522 |
11/30/25 |
$27,119 |
$39,803 |
$27,568 |
12/31/25 |
$27,330 |
$39,827 |
$27,810 |
|
| Average Annual Return [Table Text Block] |
Name |
1 Year |
5 Years |
10 Years |
SSDOX |
21.03% |
8.24% |
10.58% |
S&P 500 Index |
17.88% |
14.42% |
14.82% |
State Street Target Retirement 2055 Composite Index |
21.15% |
8.61% |
10.77% | |
| Updated Performance Information Location [Text Block] |
Updated performance information is available by calling 1-800-647-7327 or visiting our website at www.ssga.com.
|
| AssetsNet |
$ 2,069,269,991
|
| Holdings Count | Holding |
5
|
| Advisory Fees Paid, Amount |
$ 0
|
| InvestmentCompanyPortfolioTurnover |
17.00%
|
| Additional Fund Statistics [Text Block] |
Key Fund Statistics as of 12/31/2025- Total Net Assets$2,069,269,991
- Number of Portfolio Holdings5
- Portfolio Turnover Rate17%
- Total Advisory Fees Paid$0
|
| Holdings [Text Block] |
Asset Types |
% |
Domestic Equity |
51.6% |
International Equity |
38.4% |
Domestic Fixed Income |
9.8% |
Short-Term Investments |
0.2% | |
| Largest Holdings [Text Block] |
Holdings |
% |
State Street Equity 500 Index II Portfolio |
38.7% |
State Street Global All Cap Equity ex-U.S. Index Portfolio |
38.4% |
State Street Small/Mid Cap Equity Index Portfolio |
12.9% |
State Street SPDR Portfolio Long Term Treasury ETF |
9.8% | |
| Material Fund Change [Text Block] |
|
| C000143833 |
|
| Shareholder Report [Line Items] |
|
| Fund Name |
State Street Target Retirement 2055 Fund
|
| Class Name |
Class K
|
| Trading Symbol |
SSDQX
|
| Annual or Semi-Annual Statement [Text Block] |
This annual shareholder report contains important information about the State Street Target Retirement 2055 Fund (the "Fund") for the period of January 1, 2025 through December 31, 2025.
|
| Additional Information [Text Block] |
You can find additional information about the Fund, including the Prospectus, Statement of Additional Information, financial statements and other information at www.ssga.com/us/en/institutional/fund-finder?tab=documents&type=mf. You can also request this information about the Fund by contacting us at 1-800-647-7327.
|
| Additional Information Phone Number |
1-800-647-7327
|
| Additional Information Website |
www.ssga.com/us/en/institutional/fund-finder?tab=documents&type=mf
|
| Expenses [Text Block] |
What were the Fund costs for the last year? (based on a hypothetical $10,000 Investment)
Class Name |
Costs of a $10,000 investment |
Costs paid as a percentage of a $10,000 investment |
Class K |
$7 |
0.06% | Does not include expenses of the Underlying Funds in which the Fund invests. |
| Expenses Paid, Amount |
$ 7
|
| Expense Ratio, Percent |
0.06%
|
| Factors Affecting Performance [Text Block] |
How did the Fund perform last year and what affected its performance?The main driver of the Fund’s performance on an absolute basis during the reporting period was its position in the State Street Global Equity ex-US Index Portfolio which returned approximately 32.7% for the reporting period. On an individual security level, the top positive contributors to the Fund’s performance on an absolute basis during the reporting period were the State Street Global Equity ex-US Index Portfolio, the State Street Equity 500 Index II Portfolio, and the State Street Small/Mid Cap Equity Index Portfolio. There were no negative contributors to the Fund’s performance on an absolute basis during the reporting period. |
| Performance Past Does Not Indicate Future [Text] |
The Fund’s past performance is not necessarily an indication of how the Fund will perform in the future. The returns do not reflect the deduction of taxes that a shareholder would pay on Fund distributions or on the redemption or sale of Fund shares.
|
| Line Graph [Table Text Block] |
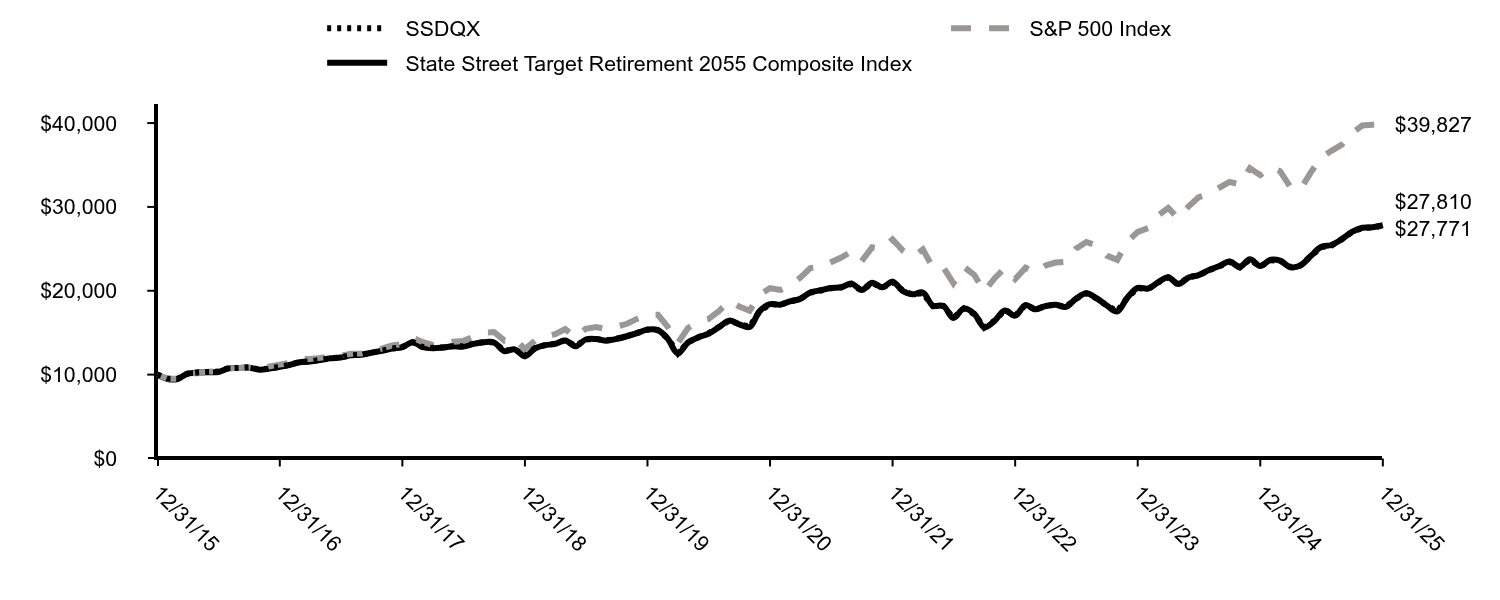
|
SSDQX |
S&P 500 Index |
State Street Target Retirement 2055 Composite Index |
12/31/15 |
$10,000 |
$10,000 |
$10,000 |
01/31/16 |
$9,520 |
$9,504 |
$9,478 |
02/29/16 |
$9,489 |
$9,491 |
$9,472 |
03/31/16 |
$10,125 |
$10,135 |
$10,108 |
04/30/16 |
$10,261 |
$10,174 |
$10,239 |
05/31/16 |
$10,313 |
$10,357 |
$10,288 |
06/30/16 |
$10,365 |
$10,384 |
$10,306 |
07/31/16 |
$10,772 |
$10,766 |
$10,746 |
08/31/16 |
$10,803 |
$10,782 |
$10,782 |
09/30/16 |
$10,865 |
$10,784 |
$10,829 |
10/31/16 |
$10,605 |
$10,587 |
$10,585 |
11/30/16 |
$10,730 |
$10,979 |
$10,716 |
12/31/16 |
$10,934 |
$11,196 |
$10,921 |
01/31/17 |
$11,188 |
$11,408 |
$11,175 |
02/28/17 |
$11,485 |
$11,861 |
$11,471 |
03/31/17 |
$11,581 |
$11,875 |
$11,569 |
04/30/17 |
$11,750 |
$11,997 |
$11,743 |
05/31/17 |
$11,952 |
$12,166 |
$11,948 |
06/30/17 |
$12,047 |
$12,242 |
$12,040 |
07/31/17 |
$12,312 |
$12,494 |
$12,303 |
08/31/17 |
$12,376 |
$12,532 |
$12,373 |
09/30/17 |
$12,620 |
$12,790 |
$12,613 |
10/31/17 |
$12,843 |
$13,089 |
$12,840 |
11/30/17 |
$13,108 |
$13,490 |
$13,099 |
12/31/17 |
$13,287 |
$13,640 |
$13,288 |
01/31/18 |
$13,874 |
$14,421 |
$13,867 |
02/28/18 |
$13,309 |
$13,890 |
$13,316 |
03/31/18 |
$13,190 |
$13,537 |
$13,155 |
04/30/18 |
$13,233 |
$13,589 |
$13,228 |
05/31/18 |
$13,396 |
$13,916 |
$13,377 |
06/30/18 |
$13,374 |
$14,002 |
$13,346 |
07/31/18 |
$13,689 |
$14,523 |
$13,661 |
08/31/18 |
$13,885 |
$14,996 |
$13,862 |
09/30/18 |
$13,852 |
$15,081 |
$13,833 |
10/31/18 |
$12,831 |
$14,050 |
$12,803 |
11/30/18 |
$13,037 |
$14,337 |
$13,014 |
12/31/18 |
$12,232 |
$13,042 |
$12,201 |
01/31/19 |
$13,183 |
$14,087 |
$13,144 |
02/28/19 |
$13,515 |
$14,540 |
$13,495 |
03/31/19 |
$13,698 |
$14,822 |
$13,664 |
04/30/19 |
$14,099 |
$15,422 |
$14,066 |
05/31/19 |
$13,412 |
$14,442 |
$13,377 |
06/30/19 |
$14,214 |
$15,460 |
$14,187 |
07/31/19 |
$14,248 |
$15,682 |
$14,247 |
08/31/19 |
$14,088 |
$15,434 |
$14,052 |
09/30/19 |
$14,294 |
$15,723 |
$14,261 |
10/31/19 |
$14,603 |
$16,063 |
$14,583 |
11/30/19 |
$14,970 |
$16,646 |
$14,945 |
12/31/19 |
$15,376 |
$17,149 |
$15,363 |
01/31/20 |
$15,291 |
$17,142 |
$15,304 |
02/29/20 |
$14,356 |
$15,731 |
$14,306 |
03/31/20 |
$12,534 |
$13,788 |
$12,526 |
04/30/20 |
$13,833 |
$15,555 |
$13,832 |
05/31/20 |
$14,465 |
$16,296 |
$14,441 |
06/30/20 |
$14,926 |
$16,620 |
$14,880 |
07/31/20 |
$15,667 |
$17,558 |
$15,640 |
08/31/20 |
$16,445 |
$18,820 |
$16,440 |
09/30/20 |
$16,032 |
$18,105 |
$15,999 |
10/31/20 |
$15,692 |
$17,623 |
$15,671 |
11/30/20 |
$17,574 |
$19,552 |
$17,573 |
12/31/20 |
$18,397 |
$20,304 |
$18,397 |
01/31/21 |
$18,335 |
$20,099 |
$18,343 |
02/28/21 |
$18,723 |
$20,653 |
$18,730 |
03/31/21 |
$19,023 |
$21,558 |
$19,034 |
04/30/21 |
$19,774 |
$22,708 |
$19,792 |
05/31/21 |
$20,024 |
$22,867 |
$20,060 |
06/30/21 |
$20,312 |
$23,401 |
$20,327 |
07/31/21 |
$20,400 |
$23,956 |
$20,418 |
08/31/21 |
$20,825 |
$24,685 |
$20,854 |
09/30/21 |
$20,012 |
$23,537 |
$20,077 |
10/31/21 |
$20,926 |
$25,186 |
$20,960 |
11/30/21 |
$20,350 |
$25,011 |
$20,410 |
12/31/21 |
$21,029 |
$26,132 |
$21,077 |
01/31/22 |
$19,995 |
$24,780 |
$19,961 |
02/28/22 |
$19,537 |
$24,038 |
$19,576 |
03/31/22 |
$19,720 |
$24,931 |
$19,784 |
04/30/22 |
$18,149 |
$22,757 |
$18,223 |
05/31/22 |
$18,188 |
$22,798 |
$18,200 |
06/30/22 |
$16,748 |
$20,916 |
$16,753 |
07/31/22 |
$17,887 |
$22,845 |
$17,868 |
08/31/22 |
$17,232 |
$21,913 |
$17,265 |
09/30/22 |
$15,608 |
$19,895 |
$15,642 |
10/31/22 |
$16,420 |
$21,506 |
$16,424 |
11/30/22 |
$17,703 |
$22,708 |
$17,647 |
12/31/22 |
$17,014 |
$21,399 |
$17,032 |
01/31/23 |
$18,322 |
$22,744 |
$18,314 |
02/28/23 |
$17,785 |
$22,189 |
$17,797 |
03/31/23 |
$18,171 |
$23,004 |
$18,164 |
04/30/23 |
$18,336 |
$23,363 |
$18,330 |
05/31/23 |
$18,074 |
$23,464 |
$18,073 |
06/30/23 |
$19,052 |
$25,015 |
$19,042 |
07/31/23 |
$19,698 |
$25,818 |
$19,703 |
08/31/23 |
$19,079 |
$25,407 |
$19,085 |
09/30/23 |
$18,239 |
$24,196 |
$18,237 |
10/31/23 |
$17,551 |
$23,687 |
$17,528 |
11/30/23 |
$19,175 |
$25,850 |
$19,171 |
12/31/23 |
$20,323 |
$27,025 |
$20,342 |
01/31/24 |
$20,210 |
$27,479 |
$20,259 |
02/29/24 |
$20,976 |
$28,946 |
$20,985 |
03/31/24 |
$21,586 |
$29,878 |
$21,616 |
04/30/24 |
$20,749 |
$28,657 |
$20,802 |
05/31/24 |
$21,601 |
$30,078 |
$21,579 |
06/30/24 |
$21,856 |
$31,157 |
$21,873 |
07/31/24 |
$22,452 |
$31,537 |
$22,472 |
08/31/24 |
$22,935 |
$32,302 |
$22,957 |
09/30/24 |
$23,446 |
$32,992 |
$23,477 |
10/31/24 |
$22,793 |
$32,692 |
$22,854 |
11/30/24 |
$23,729 |
$34,611 |
$23,753 |
12/31/24 |
$22,895 |
$33,786 |
$22,954 |
01/31/25 |
$23,637 |
$34,727 |
$23,702 |
02/28/25 |
$23,593 |
$34,274 |
$23,588 |
03/31/25 |
$22,836 |
$32,343 |
$22,806 |
04/30/25 |
$23,014 |
$32,124 |
$23,032 |
05/31/25 |
$24,142 |
$34,146 |
$24,168 |
06/30/25 |
$25,195 |
$35,882 |
$25,213 |
07/31/25 |
$25,388 |
$36,687 |
$25,460 |
08/31/25 |
$26,145 |
$37,431 |
$26,160 |
09/30/25 |
$27,006 |
$38,797 |
$27,026 |
10/31/25 |
$27,495 |
$39,706 |
$27,522 |
11/30/25 |
$27,540 |
$39,803 |
$27,568 |
12/31/25 |
$27,771 |
$39,827 |
$27,810 |
|
| Average Annual Return [Table Text Block] |
Name |
1 Year |
5 Years |
10 Years |
SSDQX |
21.30% |
8.58% |
10.75% |
S&P 500 Index |
17.88% |
14.42% |
14.82% |
State Street Target Retirement 2055 Composite Index |
21.15% |
8.61% |
10.77% | |
| Updated Performance Information Location [Text Block] |
Updated performance information is available by calling 1-800-647-7327 or visiting our website at www.ssga.com.
|
| AssetsNet |
$ 2,069,269,991
|
| Holdings Count | Holding |
5
|
| Advisory Fees Paid, Amount |
$ 0
|
| InvestmentCompanyPortfolioTurnover |
17.00%
|
| Additional Fund Statistics [Text Block] |
Key Fund Statistics as of 12/31/2025- Total Net Assets$2,069,269,991
- Number of Portfolio Holdings5
- Portfolio Turnover Rate17%
- Total Advisory Fees Paid$0
|
| Holdings [Text Block] |
Asset Types |
% |
Domestic Equity |
51.6% |
International Equity |
38.4% |
Domestic Fixed Income |
9.8% |
Short-Term Investments |
0.2% | |
| Largest Holdings [Text Block] |
Holdings |
% |
State Street Equity 500 Index II Portfolio |
38.7% |
State Street Global All Cap Equity ex-U.S. Index Portfolio |
38.4% |
State Street Small/Mid Cap Equity Index Portfolio |
12.9% |
State Street SPDR Portfolio Long Term Treasury ETF |
9.8% | |
| Material Fund Change [Text Block] |
|
| C000232292 |
|
| Shareholder Report [Line Items] |
|
| Fund Name |
State Street Target Retirement 2060 Fund
|
| Class Name |
Class R3
|
| Trading Symbol |
SSAYX
|
| Annual or Semi-Annual Statement [Text Block] |
This annual shareholder report contains important information about the State Street Target Retirement 2060 Fund (the "Fund") for the period of January 1, 2025 through December 31, 2025.
|
| Additional Information [Text Block] |
You can find additional information about the Fund, including the Prospectus, Statement of Additional Information, financial statements and other information at www.ssga.com/us/en/institutional/fund-finder?tab=documents&type=mf. You can also request this information about the Fund by contacting us at 1-800-647-7327.
|
| Additional Information Phone Number |
1-800-647-7327
|
| Additional Information Website |
www.ssga.com/us/en/institutional/fund-finder?tab=documents&type=mf
|
| Expenses [Text Block] |
What were the Fund costs for the last year? (based on a hypothetical $10,000 Investment)
Class Name |
Costs of a $10,000 investment |
Costs paid as a percentage of a $10,000 investment |
Class R3 |
$62 |
0.56% | Does not include expenses of the Underlying Funds in which the Fund invests. |
| Expenses Paid, Amount |
$ 62
|
| Expense Ratio, Percent |
0.56%
|
| Factors Affecting Performance [Text Block] |
How did the Fund perform last year and what affected its performance?The main driver of the Fund’s performance on an absolute basis during the reporting period was its position in the State Street Global Equity ex-US Index Portfolio which returned approximately 32.7% for the reporting period. On an individual security level, the top positive contributors to the Fund’s performance on an absolute basis during the reporting period were the State Street Global Equity ex-US Index Portfolio, the State Street Equity 500 Index II Portfolio, and the State Street Small/Mid Cap Equity Index Portfolio. There were no negative contributors to the Fund’s performance on an absolute basis during the reporting period. |
| Performance Past Does Not Indicate Future [Text] |
The Fund’s past performance is not necessarily an indication of how the Fund will perform in the future. The returns do not reflect the deduction of taxes that a shareholder would pay on Fund distributions or on the redemption or sale of Fund shares.
|
| Line Graph [Table Text Block] |

|
SSAYX |
S&P 500 Index |
State Street Target Retirement 2060 Composite Index |
12/31/15 |
$10,000 |
$10,000 |
$10,000 |
01/31/16 |
$9,480 |
$9,504 |
$9,478 |
02/29/16 |
$9,445 |
$9,491 |
$9,472 |
03/31/16 |
$10,093 |
$10,135 |
$10,108 |
04/30/16 |
$10,225 |
$10,174 |
$10,239 |
05/31/16 |
$10,263 |
$10,357 |
$10,288 |
06/30/16 |
$10,322 |
$10,384 |
$10,306 |
07/31/16 |
$10,696 |
$10,766 |
$10,746 |
08/31/16 |
$10,722 |
$10,782 |
$10,782 |
09/30/16 |
$10,792 |
$10,784 |
$10,829 |
10/31/16 |
$10,525 |
$10,587 |
$10,585 |
11/30/16 |
$10,646 |
$10,979 |
$10,716 |
12/31/16 |
$10,844 |
$11,196 |
$10,921 |
01/31/17 |
$11,097 |
$11,408 |
$11,175 |
02/28/17 |
$11,383 |
$11,861 |
$11,471 |
03/31/17 |
$11,475 |
$11,875 |
$11,569 |
04/30/17 |
$11,642 |
$11,997 |
$11,743 |
05/31/17 |
$11,831 |
$12,166 |
$11,948 |
06/30/17 |
$11,922 |
$12,242 |
$12,040 |
07/31/17 |
$12,175 |
$12,494 |
$12,303 |
08/31/17 |
$12,234 |
$12,532 |
$12,373 |
09/30/17 |
$12,476 |
$12,790 |
$12,613 |
10/31/17 |
$12,695 |
$13,089 |
$12,840 |
11/30/17 |
$12,947 |
$13,490 |
$13,099 |
12/31/17 |
$13,118 |
$13,640 |
$13,288 |
01/31/18 |
$13,685 |
$14,421 |
$13,867 |
02/28/18 |
$13,107 |
$13,890 |
$13,316 |
03/31/18 |
$12,981 |
$13,537 |
$13,155 |
04/30/18 |
$13,019 |
$13,589 |
$13,228 |
05/31/18 |
$13,178 |
$13,916 |
$13,377 |
06/30/18 |
$13,140 |
$14,002 |
$13,346 |
07/31/18 |
$13,442 |
$14,523 |
$13,661 |
08/31/18 |
$13,634 |
$14,996 |
$13,862 |
09/30/18 |
$13,606 |
$15,081 |
$13,833 |
10/31/18 |
$12,591 |
$14,050 |
$12,803 |
11/30/18 |
$12,795 |
$14,337 |
$13,014 |
12/31/18 |
$11,991 |
$13,042 |
$12,201 |
01/31/19 |
$12,919 |
$14,087 |
$13,144 |
02/28/19 |
$13,240 |
$14,540 |
$13,495 |
03/31/19 |
$13,410 |
$14,822 |
$13,664 |
04/30/19 |
$13,812 |
$15,422 |
$14,066 |
05/31/19 |
$13,142 |
$14,442 |
$13,377 |
06/30/19 |
$13,917 |
$15,460 |
$14,187 |
07/31/19 |
$13,946 |
$15,682 |
$14,247 |
08/31/19 |
$13,777 |
$15,434 |
$14,052 |
09/30/19 |
$13,969 |
$15,723 |
$14,261 |
10/31/19 |
$14,277 |
$16,063 |
$14,583 |
11/30/19 |
$14,631 |
$16,646 |
$14,945 |
12/31/19 |
$15,018 |
$17,149 |
$15,363 |
01/31/20 |
$14,928 |
$17,142 |
$15,304 |
02/29/20 |
$14,011 |
$15,731 |
$14,306 |
03/31/20 |
$12,234 |
$13,788 |
$12,526 |
04/30/20 |
$13,485 |
$15,555 |
$13,832 |
05/31/20 |
$14,102 |
$16,296 |
$14,441 |
06/30/20 |
$14,538 |
$16,620 |
$14,880 |
07/31/20 |
$15,261 |
$17,558 |
$15,640 |
08/31/20 |
$16,019 |
$18,820 |
$16,440 |
09/30/20 |
$15,595 |
$18,105 |
$15,999 |
10/31/20 |
$15,266 |
$17,623 |
$15,671 |
11/30/20 |
$17,085 |
$19,552 |
$17,573 |
12/31/20 |
$17,876 |
$20,304 |
$18,397 |
01/31/21 |
$17,808 |
$20,099 |
$18,343 |
02/28/21 |
$18,178 |
$20,653 |
$18,730 |
03/31/21 |
$18,474 |
$21,558 |
$19,034 |
04/30/21 |
$19,195 |
$22,708 |
$19,792 |
05/31/21 |
$19,430 |
$22,867 |
$20,060 |
06/30/21 |
$19,689 |
$23,401 |
$20,327 |
07/31/21 |
$19,766 |
$23,956 |
$20,418 |
08/31/21 |
$20,182 |
$24,685 |
$20,854 |
09/30/21 |
$19,385 |
$23,537 |
$20,077 |
10/31/21 |
$20,262 |
$25,186 |
$20,960 |
11/30/21 |
$19,696 |
$25,011 |
$20,410 |
12/31/21 |
$20,338 |
$26,132 |
$21,077 |
01/31/22 |
$19,332 |
$24,780 |
$19,961 |
02/28/22 |
$18,862 |
$24,038 |
$19,576 |
03/31/22 |
$19,039 |
$24,931 |
$19,784 |
04/30/22 |
$17,512 |
$22,757 |
$18,223 |
05/31/22 |
$17,550 |
$22,798 |
$18,200 |
06/30/22 |
$16,150 |
$20,916 |
$16,753 |
07/31/22 |
$17,235 |
$22,845 |
$17,868 |
08/31/22 |
$16,604 |
$21,913 |
$17,265 |
09/30/22 |
$15,040 |
$19,895 |
$15,642 |
10/31/22 |
$15,809 |
$21,506 |
$16,424 |
11/30/22 |
$17,033 |
$22,708 |
$17,647 |
12/31/22 |
$16,364 |
$21,399 |
$17,032 |
01/31/23 |
$17,622 |
$22,744 |
$18,314 |
02/28/23 |
$17,085 |
$22,189 |
$17,797 |
03/31/23 |
$17,452 |
$23,004 |
$18,164 |
04/30/23 |
$17,609 |
$23,363 |
$18,330 |
05/31/23 |
$17,347 |
$23,464 |
$18,073 |
06/30/23 |
$18,277 |
$25,015 |
$19,042 |
07/31/23 |
$18,893 |
$25,818 |
$19,703 |
08/31/23 |
$18,290 |
$25,407 |
$19,085 |
09/30/23 |
$17,465 |
$24,196 |
$18,237 |
10/31/23 |
$16,810 |
$23,687 |
$17,528 |
11/30/23 |
$18,356 |
$25,850 |
$19,171 |
12/31/23 |
$19,450 |
$27,025 |
$20,342 |
01/31/24 |
$19,343 |
$27,479 |
$20,259 |
02/29/24 |
$20,054 |
$28,946 |
$20,985 |
03/31/24 |
$20,630 |
$29,878 |
$21,616 |
04/30/24 |
$19,826 |
$28,657 |
$20,802 |
05/31/24 |
$20,630 |
$30,078 |
$21,579 |
06/30/24 |
$20,871 |
$31,157 |
$21,873 |
07/31/24 |
$21,421 |
$31,537 |
$22,471 |
08/31/24 |
$21,877 |
$32,302 |
$22,957 |
09/30/24 |
$22,346 |
$32,992 |
$23,477 |
10/31/24 |
$21,729 |
$32,692 |
$22,854 |
11/30/24 |
$22,601 |
$34,611 |
$23,753 |
12/31/24 |
$21,817 |
$33,786 |
$22,954 |
01/31/25 |
$22,512 |
$34,727 |
$23,702 |
02/28/25 |
$22,456 |
$34,274 |
$23,588 |
03/31/25 |
$21,720 |
$32,343 |
$22,806 |
04/30/25 |
$21,886 |
$32,124 |
$23,032 |
05/31/25 |
$22,956 |
$34,146 |
$24,168 |
06/30/25 |
$23,943 |
$35,882 |
$25,213 |
07/31/25 |
$24,124 |
$36,687 |
$25,460 |
08/31/25 |
$24,818 |
$37,431 |
$26,160 |
09/30/25 |
$25,624 |
$38,797 |
$27,026 |
10/31/25 |
$26,083 |
$39,706 |
$27,522 |
11/30/25 |
$26,111 |
$39,803 |
$27,568 |
12/31/25 |
$26,316 |
$39,827 |
$27,810 |
|
| Average Annual Return [Table Text Block] |
Name |
1 Year |
5 Years |
10 Years |
SSAYXFootnote Reference(1) |
20.62% |
8.04% |
10.16% |
S&P 500 Index |
17.88% |
14.42% |
14.82% |
State Street Target Retirement 2060 Composite Index |
21.15% |
8.61% |
10.77% | |
| Updated Performance Information Location [Text Block] |
Updated performance information is available by calling 1-800-647-7327 or visiting our website at www.ssga.com.
|
| AssetsNet |
$ 1,505,762,529
|
| Holdings Count | Holding |
5
|
| Advisory Fees Paid, Amount |
$ 0
|
| InvestmentCompanyPortfolioTurnover |
16.00%
|
| Additional Fund Statistics [Text Block] |
Key Fund Statistics as of 12/31/2025- Total Net Assets$1,505,762,529
- Number of Portfolio Holdings5
- Portfolio Turnover Rate16%
- Total Advisory Fees Paid$0
|
| Holdings [Text Block] |
Asset Types |
% |
Domestic Equity |
51.6% |
International Equity |
38.3% |
Domestic Fixed Income |
9.8% |
Short-Term Investments |
0.4% | |
| Largest Holdings [Text Block] |
Holdings |
% |
State Street Equity 500 Index II Portfolio |
38.7% |
State Street Global All Cap Equity ex-U.S. Index Portfolio |
38.3% |
State Street Small/Mid Cap Equity Index Portfolio |
12.9% |
State Street SPDR Portfolio Long Term Treasury ETF |
9.8% | |
| Material Fund Change [Text Block] |
|
| C000143836 |
|
| Shareholder Report [Line Items] |
|
| Fund Name |
State Street Target Retirement 2060 Fund
|
| Class Name |
Class I
|
| Trading Symbol |
SSDWX
|
| Annual or Semi-Annual Statement [Text Block] |
This annual shareholder report contains important information about the State Street Target Retirement 2060 Fund (the "Fund") for the period of January 1, 2025 through December 31, 2025.
|
| Additional Information [Text Block] |
You can find additional information about the Fund, including the Prospectus, Statement of Additional Information, financial statements and other information at www.ssga.com/us/en/institutional/fund-finder?tab=documents&type=mf. You can also request this information about the Fund by contacting us at 1-800-647-7327.
|
| Additional Information Phone Number |
1-800-647-7327
|
| Additional Information Website |
www.ssga.com/us/en/institutional/fund-finder?tab=documents&type=mf
|
| Expenses [Text Block] |
What were the Fund costs for the last year? (based on a hypothetical $10,000 Investment)
Class Name |
Costs of a $10,000 investment |
Costs paid as a percentage of a $10,000 investment |
Class I |
$22 |
0.20% | Does not include expenses of the Underlying Funds in which the Fund invests. |
| Expenses Paid, Amount |
$ 22
|
| Expense Ratio, Percent |
0.20%
|
| Factors Affecting Performance [Text Block] |
How did the Fund perform last year and what affected its performance?The main driver of the Fund’s performance on an absolute basis during the reporting period was its position in the State Street Global Equity ex-US Index Portfolio which returned approximately 32.7% for the reporting period. On an individual security level, the top positive contributors to the Fund’s performance on an absolute basis during the reporting period were the State Street Global Equity ex-US Index Portfolio, the State Street Equity 500 Index II Portfolio, and the State Street Small/Mid Cap Equity Index Portfolio. There were no negative contributors to the Fund’s performance on an absolute basis during the reporting period. |
| Performance Past Does Not Indicate Future [Text] |
The Fund’s past performance is not necessarily an indication of how the Fund will perform in the future. The returns do not reflect the deduction of taxes that a shareholder would pay on Fund distributions or on the redemption or sale of Fund shares.
|
| Line Graph [Table Text Block] |

|
SSDWX |
S&P 500 Index |
State Street Target Retirement 2060 Composite Index |
12/31/15 |
$10,000 |
$10,000 |
$10,000 |
01/31/16 |
$9,495 |
$9,504 |
$9,478 |
02/29/16 |
$9,463 |
$9,491 |
$9,472 |
03/31/16 |
$10,105 |
$10,135 |
$10,108 |
04/30/16 |
$10,242 |
$10,174 |
$10,239 |
05/31/16 |
$10,295 |
$10,357 |
$10,288 |
06/30/16 |
$10,347 |
$10,384 |
$10,306 |
07/31/16 |
$10,737 |
$10,766 |
$10,746 |
08/31/16 |
$10,758 |
$10,782 |
$10,782 |
09/30/16 |
$10,832 |
$10,784 |
$10,829 |
10/31/16 |
$10,568 |
$10,587 |
$10,585 |
11/30/16 |
$10,705 |
$10,979 |
$10,716 |
12/31/16 |
$10,909 |
$11,196 |
$10,921 |
01/31/17 |
$11,157 |
$11,408 |
$11,175 |
02/28/17 |
$11,449 |
$11,861 |
$11,471 |
03/31/17 |
$11,546 |
$11,875 |
$11,569 |
04/30/17 |
$11,719 |
$11,997 |
$11,743 |
05/31/17 |
$11,925 |
$12,166 |
$11,948 |
06/30/17 |
$12,011 |
$12,242 |
$12,040 |
07/31/17 |
$12,282 |
$12,494 |
$12,303 |
08/31/17 |
$12,346 |
$12,532 |
$12,373 |
09/30/17 |
$12,584 |
$12,790 |
$12,613 |
10/31/17 |
$12,811 |
$13,089 |
$12,840 |
11/30/17 |
$13,082 |
$13,490 |
$13,099 |
12/31/17 |
$13,248 |
$13,640 |
$13,288 |
01/31/18 |
$13,827 |
$14,421 |
$13,867 |
02/28/18 |
$13,248 |
$13,890 |
$13,316 |
03/31/18 |
$13,137 |
$13,537 |
$13,155 |
04/30/18 |
$13,170 |
$13,589 |
$13,228 |
05/31/18 |
$13,337 |
$13,916 |
$13,377 |
06/30/18 |
$13,304 |
$14,002 |
$13,346 |
07/31/18 |
$13,626 |
$14,523 |
$13,661 |
08/31/18 |
$13,816 |
$14,996 |
$13,862 |
09/30/18 |
$13,793 |
$15,081 |
$13,833 |
10/31/18 |
$12,781 |
$14,050 |
$12,803 |
11/30/18 |
$12,981 |
$14,337 |
$13,014 |
12/31/18 |
$12,171 |
$13,042 |
$12,201 |
01/31/19 |
$13,118 |
$14,087 |
$13,144 |
02/28/19 |
$13,450 |
$14,540 |
$13,495 |
03/31/19 |
$13,639 |
$14,822 |
$13,664 |
04/30/19 |
$14,042 |
$15,422 |
$14,066 |
05/31/19 |
$13,367 |
$14,442 |
$13,377 |
06/30/19 |
$14,160 |
$15,460 |
$14,187 |
07/31/19 |
$14,208 |
$15,682 |
$14,247 |
08/31/19 |
$14,030 |
$15,434 |
$14,052 |
09/30/19 |
$14,243 |
$15,723 |
$14,261 |
10/31/19 |
$14,563 |
$16,063 |
$14,583 |
11/30/19 |
$14,918 |
$16,646 |
$14,945 |
12/31/19 |
$15,319 |
$17,149 |
$15,363 |
01/31/20 |
$15,234 |
$17,142 |
$15,304 |
02/29/20 |
$14,304 |
$15,731 |
$14,306 |
03/31/20 |
$12,495 |
$13,788 |
$12,526 |
04/30/20 |
$13,791 |
$15,555 |
$13,832 |
05/31/20 |
$14,414 |
$16,296 |
$14,441 |
06/30/20 |
$14,867 |
$16,620 |
$14,880 |
07/31/20 |
$15,613 |
$17,558 |
$15,640 |
08/31/20 |
$16,395 |
$18,820 |
$16,440 |
09/30/20 |
$15,967 |
$18,105 |
$15,999 |
10/31/20 |
$15,637 |
$17,623 |
$15,671 |
11/30/20 |
$17,508 |
$19,552 |
$17,573 |
12/31/20 |
$18,323 |
$20,304 |
$18,397 |
01/31/21 |
$18,261 |
$20,099 |
$18,343 |
02/28/21 |
$18,635 |
$20,653 |
$18,730 |
03/31/21 |
$18,947 |
$21,558 |
$19,034 |
04/30/21 |
$19,683 |
$22,708 |
$19,792 |
05/31/21 |
$19,945 |
$22,867 |
$20,060 |
06/30/21 |
$20,219 |
$23,401 |
$20,327 |
07/31/21 |
$20,307 |
$23,956 |
$20,418 |
08/31/21 |
$20,668 |
$24,685 |
$20,854 |
09/30/21 |
$19,858 |
$23,537 |
$20,077 |
10/31/21 |
$20,768 |
$25,186 |
$20,960 |
11/30/21 |
$20,194 |
$25,011 |
$20,410 |
12/31/21 |
$20,842 |
$26,132 |
$21,077 |
01/31/22 |
$19,817 |
$24,780 |
$19,961 |
02/28/22 |
$19,363 |
$24,038 |
$19,576 |
03/31/22 |
$19,545 |
$24,931 |
$19,784 |
04/30/22 |
$17,974 |
$22,757 |
$18,223 |
05/31/22 |
$18,026 |
$22,798 |
$18,200 |
06/30/22 |
$16,599 |
$20,916 |
$16,753 |
07/31/22 |
$17,715 |
$22,845 |
$17,868 |
08/31/22 |
$17,066 |
$21,913 |
$17,265 |
09/30/22 |
$15,470 |
$19,895 |
$15,642 |
10/31/22 |
$16,261 |
$21,506 |
$16,424 |
11/30/22 |
$17,533 |
$22,708 |
$17,647 |
12/31/22 |
$16,849 |
$21,399 |
$17,032 |
01/31/23 |
$18,148 |
$22,744 |
$18,314 |
02/28/23 |
$17,607 |
$22,189 |
$17,797 |
03/31/23 |
$17,986 |
$23,004 |
$18,164 |
04/30/23 |
$18,148 |
$23,363 |
$18,330 |
05/31/23 |
$17,877 |
$23,464 |
$18,073 |
06/30/23 |
$18,852 |
$25,015 |
$19,042 |
07/31/23 |
$19,488 |
$25,818 |
$19,703 |
08/31/23 |
$18,879 |
$25,407 |
$19,085 |
09/30/23 |
$18,040 |
$24,196 |
$18,237 |
10/31/23 |
$17,363 |
$23,687 |
$17,528 |
11/30/23 |
$18,960 |
$25,850 |
$19,171 |
12/31/23 |
$20,087 |
$27,025 |
$20,342 |
01/31/24 |
$19,990 |
$27,479 |
$20,259 |
02/29/24 |
$20,726 |
$28,946 |
$20,985 |
03/31/24 |
$21,338 |
$29,878 |
$21,616 |
04/30/24 |
$20,504 |
$28,657 |
$20,802 |
05/31/24 |
$21,352 |
$30,078 |
$21,579 |
06/30/24 |
$21,588 |
$31,157 |
$21,873 |
07/31/24 |
$22,186 |
$31,537 |
$22,471 |
08/31/24 |
$22,645 |
$32,302 |
$22,957 |
09/30/24 |
$23,159 |
$32,992 |
$23,477 |
10/31/24 |
$22,506 |
$32,692 |
$22,854 |
11/30/24 |
$23,423 |
$34,611 |
$23,753 |
12/31/24 |
$22,611 |
$33,786 |
$22,954 |
01/31/25 |
$23,349 |
$34,727 |
$23,702 |
02/28/25 |
$23,291 |
$34,274 |
$23,588 |
03/31/25 |
$22,539 |
$32,343 |
$22,806 |
04/30/25 |
$22,727 |
$32,124 |
$23,032 |
05/31/25 |
$23,841 |
$34,146 |
$24,168 |
06/30/25 |
$24,868 |
$35,882 |
$25,213 |
07/31/25 |
$25,056 |
$36,687 |
$25,460 |
08/31/25 |
$25,794 |
$37,431 |
$26,160 |
09/30/25 |
$26,648 |
$38,797 |
$27,026 |
10/31/25 |
$27,140 |
$39,706 |
$27,522 |
11/30/25 |
$27,183 |
$39,803 |
$27,568 |
12/31/25 |
$27,397 |
$39,827 |
$27,810 |
|
| Average Annual Return [Table Text Block] |
Name |
1 Year |
5 Years |
10 Years |
SSDWX |
21.17% |
8.38% |
10.60% |
S&P 500 Index |
17.88% |
14.42% |
14.82% |
State Street Target Retirement 2060 Composite Index |
21.15% |
8.61% |
10.77% | |
| Updated Performance Information Location [Text Block] |
Updated performance information is available by calling 1-800-647-7327 or visiting our website at www.ssga.com.
|
| AssetsNet |
$ 1,505,762,529
|
| Holdings Count | Holding |
5
|
| Advisory Fees Paid, Amount |
$ 0
|
| InvestmentCompanyPortfolioTurnover |
16.00%
|
| Additional Fund Statistics [Text Block] |
Key Fund Statistics as of 12/31/2025- Total Net Assets$1,505,762,529
- Number of Portfolio Holdings5
- Portfolio Turnover Rate16%
- Total Advisory Fees Paid$0
|
| Holdings [Text Block] |
Asset Types |
% |
Domestic Equity |
51.6% |
International Equity |
38.3% |
Domestic Fixed Income |
9.8% |
Short-Term Investments |
0.4% | |
| Largest Holdings [Text Block] |
Holdings |
% |
State Street Equity 500 Index II Portfolio |
38.7% |
State Street Global All Cap Equity ex-U.S. Index Portfolio |
38.3% |
State Street Small/Mid Cap Equity Index Portfolio |
12.9% |
State Street SPDR Portfolio Long Term Treasury ETF |
9.8% | |
| Material Fund Change [Text Block] |
|
| C000143837 |
|
| Shareholder Report [Line Items] |
|
| Fund Name |
State Street Target Retirement 2060 Fund
|
| Class Name |
Class K
|
| Trading Symbol |
SSDYX
|
| Annual or Semi-Annual Statement [Text Block] |
This annual shareholder report contains important information about the State Street Target Retirement 2060 Fund (the "Fund") for the period of January 1, 2025 through December 31, 2025.
|
| Additional Information [Text Block] |
You can find additional information about the Fund, including the Prospectus, Statement of Additional Information, financial statements and other information at www.ssga.com/us/en/institutional/fund-finder?tab=documents&type=mf. You can also request this information about the Fund by contacting us at 1-800-647-7327.
|
| Additional Information Phone Number |
1-800-647-7327
|
| Additional Information Website |
www.ssga.com/us/en/institutional/fund-finder?tab=documents&type=mf
|
| Expenses [Text Block] |
What were the Fund costs for the last year? (based on a hypothetical $10,000 Investment)
Class Name |
Costs of a $10,000 investment |
Costs paid as a percentage of a $10,000 investment |
Class K |
$7 |
0.06% | Does not include expenses of the Underlying Funds in which the Fund invests. |
| Expenses Paid, Amount |
$ 7
|
| Expense Ratio, Percent |
0.06%
|
| Factors Affecting Performance [Text Block] |
How did the Fund perform last year and what affected its performance?The main driver of the Fund’s performance on an absolute basis during the reporting period was its position in the State Street Global Equity ex-US Index Portfolio which returned approximately 32.7% for the reporting period. On an individual security level, the top positive contributors to the Fund’s performance on an absolute basis during the reporting period were the State Street Global Equity ex-US Index Portfolio, the State Street Equity 500 Index II Portfolio, and the State Street Small/Mid Cap Equity Index Portfolio. There were no negative contributors to the Fund’s performance on an absolute basis during the reporting period. |
| Performance Past Does Not Indicate Future [Text] |
The Fund’s past performance is not necessarily an indication of how the Fund will perform in the future. The returns do not reflect the deduction of taxes that a shareholder would pay on Fund distributions or on the redemption or sale of Fund shares.
|
| Line Graph [Table Text Block] |

|
SSDYX |
S&P 500 Index |
State Street Target Retirement 2060 Composite Index |
12/31/15 |
$10,000 |
$10,000 |
$10,000 |
01/31/16 |
$9,484 |
$9,504 |
$9,478 |
02/29/16 |
$9,453 |
$9,491 |
$9,472 |
03/31/16 |
$10,105 |
$10,135 |
$10,108 |
04/30/16 |
$10,242 |
$10,174 |
$10,239 |
05/31/16 |
$10,284 |
$10,357 |
$10,288 |
06/30/16 |
$10,347 |
$10,384 |
$10,306 |
07/31/16 |
$10,726 |
$10,766 |
$10,746 |
08/31/16 |
$10,758 |
$10,782 |
$10,782 |
09/30/16 |
$10,832 |
$10,784 |
$10,829 |
10/31/16 |
$10,568 |
$10,587 |
$10,585 |
11/30/16 |
$10,695 |
$10,979 |
$10,716 |
12/31/16 |
$10,898 |
$11,196 |
$10,921 |
01/31/17 |
$11,157 |
$11,408 |
$11,175 |
02/28/17 |
$11,449 |
$11,861 |
$11,471 |
03/31/17 |
$11,546 |
$11,875 |
$11,569 |
04/30/17 |
$11,719 |
$11,997 |
$11,743 |
05/31/17 |
$11,914 |
$12,166 |
$11,948 |
06/30/17 |
$12,011 |
$12,242 |
$12,040 |
07/31/17 |
$12,271 |
$12,494 |
$12,303 |
08/31/17 |
$12,336 |
$12,532 |
$12,373 |
09/30/17 |
$12,584 |
$12,790 |
$12,613 |
10/31/17 |
$12,811 |
$13,089 |
$12,840 |
11/30/17 |
$13,071 |
$13,490 |
$13,099 |
12/31/17 |
$13,249 |
$13,640 |
$13,288 |
01/31/18 |
$13,827 |
$14,421 |
$13,867 |
02/28/18 |
$13,249 |
$13,890 |
$13,316 |
03/31/18 |
$13,126 |
$13,537 |
$13,155 |
04/30/18 |
$13,171 |
$13,589 |
$13,228 |
05/31/18 |
$13,338 |
$13,916 |
$13,377 |
06/30/18 |
$13,304 |
$14,002 |
$13,346 |
07/31/18 |
$13,616 |
$14,523 |
$13,661 |
08/31/18 |
$13,816 |
$14,996 |
$13,862 |
09/30/18 |
$13,794 |
$15,081 |
$13,833 |
10/31/18 |
$12,770 |
$14,050 |
$12,803 |
11/30/18 |
$12,982 |
$14,337 |
$13,014 |
12/31/18 |
$12,172 |
$13,042 |
$12,201 |
01/31/19 |
$13,119 |
$14,087 |
$13,144 |
02/28/19 |
$13,450 |
$14,540 |
$13,495 |
03/31/19 |
$13,628 |
$14,822 |
$13,664 |
04/30/19 |
$14,042 |
$15,422 |
$14,066 |
05/31/19 |
$13,367 |
$14,442 |
$13,377 |
06/30/19 |
$14,161 |
$15,460 |
$14,187 |
07/31/19 |
$14,196 |
$15,682 |
$14,247 |
08/31/19 |
$14,030 |
$15,434 |
$14,052 |
09/30/19 |
$14,232 |
$15,723 |
$14,261 |
10/31/19 |
$14,551 |
$16,063 |
$14,583 |
11/30/19 |
$14,918 |
$16,646 |
$14,945 |
12/31/19 |
$15,320 |
$17,149 |
$15,363 |
01/31/20 |
$15,234 |
$17,142 |
$15,304 |
02/29/20 |
$14,305 |
$15,731 |
$14,306 |
03/31/20 |
$12,496 |
$13,788 |
$12,526 |
04/30/20 |
$13,779 |
$15,555 |
$13,832 |
05/31/20 |
$14,415 |
$16,296 |
$14,441 |
06/30/20 |
$14,868 |
$16,620 |
$14,880 |
07/31/20 |
$15,613 |
$17,558 |
$15,640 |
08/31/20 |
$16,396 |
$18,820 |
$16,440 |
09/30/20 |
$15,968 |
$18,105 |
$15,999 |
10/31/20 |
$15,638 |
$17,623 |
$15,671 |
11/30/20 |
$17,508 |
$19,552 |
$17,573 |
12/31/20 |
$18,327 |
$20,304 |
$18,397 |
01/31/21 |
$18,265 |
$20,099 |
$18,343 |
02/28/21 |
$18,651 |
$20,653 |
$18,730 |
03/31/21 |
$18,963 |
$21,558 |
$19,034 |
04/30/21 |
$19,712 |
$22,708 |
$19,792 |
05/31/21 |
$19,961 |
$22,867 |
$20,060 |
06/30/21 |
$20,236 |
$23,401 |
$20,327 |
07/31/21 |
$20,323 |
$23,956 |
$20,418 |
08/31/21 |
$20,760 |
$24,685 |
$20,854 |
09/30/21 |
$19,949 |
$23,537 |
$20,077 |
10/31/21 |
$20,859 |
$25,186 |
$20,960 |
11/30/21 |
$20,286 |
$25,011 |
$20,410 |
12/31/21 |
$20,955 |
$26,132 |
$21,077 |
01/31/22 |
$19,928 |
$24,780 |
$19,961 |
02/28/22 |
$19,459 |
$24,038 |
$19,576 |
03/31/22 |
$19,642 |
$24,931 |
$19,784 |
04/30/22 |
$18,081 |
$22,757 |
$18,223 |
05/31/22 |
$18,120 |
$22,798 |
$18,200 |
06/30/22 |
$16,702 |
$20,916 |
$16,753 |
07/31/22 |
$17,820 |
$22,845 |
$17,868 |
08/31/22 |
$17,170 |
$21,913 |
$17,265 |
09/30/22 |
$15,557 |
$19,895 |
$15,642 |
10/31/22 |
$16,364 |
$21,506 |
$16,424 |
11/30/22 |
$17,638 |
$22,708 |
$17,647 |
12/31/22 |
$16,957 |
$21,399 |
$17,032 |
01/31/23 |
$18,260 |
$22,744 |
$18,314 |
02/28/23 |
$17,717 |
$22,189 |
$17,797 |
03/31/23 |
$18,111 |
$23,004 |
$18,164 |
04/30/23 |
$18,274 |
$23,363 |
$18,330 |
05/31/23 |
$18,002 |
$23,464 |
$18,073 |
06/30/23 |
$18,994 |
$25,015 |
$19,042 |
07/31/23 |
$19,632 |
$25,818 |
$19,703 |
08/31/23 |
$19,007 |
$25,407 |
$19,085 |
09/30/23 |
$18,165 |
$24,196 |
$18,237 |
10/31/23 |
$17,487 |
$23,687 |
$17,528 |
11/30/23 |
$19,102 |
$25,850 |
$19,171 |
12/31/23 |
$20,256 |
$27,025 |
$20,342 |
01/31/24 |
$20,144 |
$27,479 |
$20,259 |
02/29/24 |
$20,898 |
$28,946 |
$20,985 |
03/31/24 |
$21,512 |
$29,878 |
$21,616 |
04/30/24 |
$20,674 |
$28,657 |
$20,802 |
05/31/24 |
$21,526 |
$30,078 |
$21,579 |
06/30/24 |
$21,777 |
$31,157 |
$21,873 |
07/31/24 |
$22,378 |
$31,537 |
$22,471 |
08/31/24 |
$22,852 |
$32,302 |
$22,957 |
09/30/24 |
$23,355 |
$32,992 |
$23,477 |
10/31/24 |
$22,713 |
$32,692 |
$22,854 |
11/30/24 |
$23,648 |
$34,611 |
$23,753 |
12/31/24 |
$22,821 |
$33,786 |
$22,954 |
01/31/25 |
$23,563 |
$34,727 |
$23,702 |
02/28/25 |
$23,519 |
$34,274 |
$23,588 |
03/31/25 |
$22,763 |
$32,343 |
$22,806 |
04/30/25 |
$22,937 |
$32,124 |
$23,032 |
05/31/25 |
$24,072 |
$34,146 |
$24,168 |
06/30/25 |
$25,119 |
$35,882 |
$25,213 |
07/31/25 |
$25,308 |
$36,687 |
$25,460 |
08/31/25 |
$26,065 |
$37,431 |
$26,160 |
09/30/25 |
$26,923 |
$38,797 |
$27,026 |
10/31/25 |
$27,403 |
$39,706 |
$27,522 |
11/30/25 |
$27,446 |
$39,803 |
$27,568 |
12/31/25 |
$27,684 |
$39,827 |
$27,810 |
|
| Average Annual Return [Table Text Block] |
Name |
1 Year |
5 Years |
10 Years |
SSDYX |
21.31% |
8.60% |
10.72% |
S&P 500 Index |
17.88% |
14.42% |
14.82% |
State Street Target Retirement 2060 Composite Index |
21.15% |
8.61% |
10.77% | |
| Updated Performance Information Location [Text Block] |
Updated performance information is available by calling 1-800-647-7327 or visiting our website at www.ssga.com.
|
| AssetsNet |
$ 1,505,762,529
|
| Holdings Count | Holding |
5
|
| Advisory Fees Paid, Amount |
$ 0
|
| InvestmentCompanyPortfolioTurnover |
16.00%
|
| Additional Fund Statistics [Text Block] |
Key Fund Statistics as of 12/31/2025- Total Net Assets$1,505,762,529
- Number of Portfolio Holdings5
- Portfolio Turnover Rate16%
- Total Advisory Fees Paid$0
|
| Holdings [Text Block] |
Asset Types |
% |
Domestic Equity |
51.6% |
International Equity |
38.3% |
Domestic Fixed Income |
9.8% |
Short-Term Investments |
0.4% | |
| Largest Holdings [Text Block] |
Holdings |
% |
State Street Equity 500 Index II Portfolio |
38.7% |
State Street Global All Cap Equity ex-U.S. Index Portfolio |
38.3% |
State Street Small/Mid Cap Equity Index Portfolio |
12.9% |
State Street SPDR Portfolio Long Term Treasury ETF |
9.8% | |
| Material Fund Change [Text Block] |
|
| C000232300 |
|
| Shareholder Report [Line Items] |
|
| Fund Name |
State Street Target Retirement 2065 Fund
|
| Class Name |
Class R3
|
| Trading Symbol |
SSFPX
|
| Annual or Semi-Annual Statement [Text Block] |
This annual shareholder report contains important information about the State Street Target Retirement 2065 Fund (the "Fund") for the period of January 1, 2025 through December 31, 2025.
|
| Additional Information [Text Block] |
You can find additional information about the Fund, including the Prospectus, Statement of Additional Information, financial statements and other information at www.ssga.com/us/en/institutional/fund-finder?tab=documents&type=mf. You can also request this information about the Fund by contacting us at 1-800-647-7327.
|
| Additional Information Phone Number |
1-800-647-7327
|
| Additional Information Website |
www.ssga.com/us/en/institutional/fund-finder?tab=documents&type=mf
|
| Expenses [Text Block] |
What were the Fund costs for the last year? (based on a hypothetical $10,000 Investment)
Class Name |
Costs of a $10,000 investment |
Costs paid as a percentage of a $10,000 investment |
Class R3 |
$62 |
0.56% | Does not include expenses of the Underlying Funds in which the Fund invests. |
| Expenses Paid, Amount |
$ 62
|
| Expense Ratio, Percent |
0.56%
|
| Factors Affecting Performance [Text Block] |
How did the Fund perform last year and what affected its performance?The main driver of the Fund’s performance on an absolute basis during the reporting period were its positions in the State Street Global Equity ex-US Index Portfolio which returned approximately 32.7% for the reporting period. On an individual security level, the top positive contributors to the Fund’s performance on an absolute basis during the reporting period were the State Street Global Equity ex-US Index Portfolio, the State Street Equity 500 Index II Portfolio, and the State Street Small/Mid Cap Equity Index Portfolio. There were no negative contributors to the Fund’s performance on an absolute basis during the reporting period. |
| Performance Past Does Not Indicate Future [Text] |
The Fund’s past performance is not necessarily an indication of how the Fund will perform in the future. The returns do not reflect the deduction of taxes that a shareholder would pay on Fund distributions or on the redemption or sale of Fund shares.
|
| Line Graph [Table Text Block] |

|
SSFPX |
S&P 500 Index |
State Street Target Retirement 2065 Composite Index |
03/30/20 |
$10,000 |
$10,000 |
$10,000 |
03/31/20 |
$9,900 |
$9,841 |
$10,117 |
04/30/20 |
$10,937 |
$11,102 |
$11,171 |
05/31/20 |
$11,393 |
$11,631 |
$11,664 |
06/30/20 |
$11,729 |
$11,863 |
$12,018 |
07/31/20 |
$12,274 |
$12,531 |
$12,632 |
08/31/20 |
$12,879 |
$13,432 |
$13,278 |
09/30/20 |
$12,524 |
$12,922 |
$12,922 |
10/31/20 |
$12,259 |
$12,578 |
$12,657 |
11/30/20 |
$13,682 |
$13,955 |
$14,193 |
12/31/20 |
$14,309 |
$14,492 |
$14,859 |
01/31/21 |
$14,261 |
$14,345 |
$14,815 |
02/28/21 |
$14,558 |
$14,741 |
$15,128 |
03/31/21 |
$14,782 |
$15,386 |
$15,374 |
04/30/21 |
$15,339 |
$16,208 |
$15,986 |
05/31/21 |
$15,573 |
$16,321 |
$16,202 |
06/30/21 |
$15,775 |
$16,702 |
$16,418 |
07/31/21 |
$15,831 |
$17,099 |
$16,491 |
08/31/21 |
$16,168 |
$17,618 |
$16,843 |
09/30/21 |
$15,526 |
$16,799 |
$16,215 |
10/31/21 |
$16,238 |
$17,976 |
$16,929 |
11/30/21 |
$15,773 |
$17,851 |
$16,485 |
12/31/21 |
$16,287 |
$18,651 |
$17,024 |
01/31/22 |
$15,478 |
$17,686 |
$16,122 |
02/28/22 |
$15,119 |
$17,157 |
$15,811 |
03/31/22 |
$15,279 |
$17,794 |
$15,979 |
04/30/22 |
$14,061 |
$16,242 |
$14,718 |
05/31/22 |
$14,083 |
$16,272 |
$14,700 |
06/30/22 |
$12,961 |
$14,929 |
$13,531 |
07/31/22 |
$13,837 |
$16,305 |
$14,432 |
08/31/22 |
$13,324 |
$15,640 |
$13,944 |
09/30/22 |
$12,074 |
$14,200 |
$12,634 |
10/31/22 |
$12,683 |
$15,349 |
$13,265 |
11/30/22 |
$13,677 |
$16,207 |
$14,253 |
12/31/22 |
$13,139 |
$15,273 |
$13,756 |
01/31/23 |
$14,135 |
$16,233 |
$14,792 |
02/28/23 |
$13,708 |
$15,837 |
$14,374 |
03/31/23 |
$14,004 |
$16,419 |
$14,671 |
04/30/23 |
$14,124 |
$16,675 |
$14,805 |
05/31/23 |
$13,916 |
$16,747 |
$14,597 |
06/30/23 |
$14,672 |
$17,854 |
$15,380 |
07/31/23 |
$15,153 |
$18,427 |
$15,913 |
08/31/23 |
$14,672 |
$18,134 |
$15,414 |
09/30/23 |
$14,015 |
$17,269 |
$14,729 |
10/31/23 |
$13,489 |
$16,906 |
$14,157 |
11/30/23 |
$14,715 |
$18,450 |
$15,484 |
12/31/23 |
$15,595 |
$19,289 |
$16,430 |
01/31/24 |
$15,517 |
$19,613 |
$16,363 |
02/29/24 |
$16,085 |
$20,660 |
$16,949 |
03/31/24 |
$16,553 |
$21,325 |
$17,458 |
04/30/24 |
$15,907 |
$20,454 |
$16,801 |
05/31/24 |
$16,553 |
$21,468 |
$17,429 |
06/30/24 |
$16,732 |
$22,238 |
$17,666 |
07/31/24 |
$17,189 |
$22,509 |
$18,150 |
08/31/24 |
$17,545 |
$23,055 |
$18,542 |
09/30/24 |
$17,924 |
$23,547 |
$18,962 |
10/31/24 |
$17,423 |
$23,334 |
$18,459 |
11/30/24 |
$18,125 |
$24,703 |
$19,184 |
12/31/24 |
$17,490 |
$24,114 |
$18,539 |
01/31/25 |
$18,049 |
$24,786 |
$19,144 |
02/28/25 |
$18,003 |
$24,463 |
$19,052 |
03/31/25 |
$17,410 |
$23,084 |
$18,420 |
04/30/25 |
$17,547 |
$22,928 |
$18,603 |
05/31/25 |
$18,391 |
$24,371 |
$19,520 |
06/30/25 |
$19,177 |
$25,610 |
$20,364 |
07/31/25 |
$19,326 |
$26,185 |
$20,563 |
08/31/25 |
$19,884 |
$26,716 |
$21,129 |
09/30/25 |
$20,534 |
$27,691 |
$21,828 |
10/31/25 |
$20,899 |
$28,339 |
$22,229 |
11/30/25 |
$20,922 |
$28,409 |
$22,266 |
12/31/25 |
$21,093 |
$28,426 |
$22,461 |
|
| Average Annual Return [Table Text Block] |
Name |
1 Year |
5 Years |
Since Inception 03/30/20 |
SSFPXFootnote Reference(1) |
20.60% |
8.07% |
13.84% |
S&P 500 Index |
17.88% |
14.42% |
19.90% |
State Street Target Retirement 2065 Composite Index |
21.15% |
8.61% |
15.09% | |
| Performance Inception Date |
Mar. 30, 2020
|
| Updated Performance Information Location [Text Block] |
Updated performance information is available by calling 1-800-647-7327 or visiting our website at www.ssga.com.
|
| AssetsNet |
$ 517,313,159
|
| Holdings Count | Holding |
5
|
| Advisory Fees Paid, Amount |
$ 0
|
| InvestmentCompanyPortfolioTurnover |
20.00%
|
| Additional Fund Statistics [Text Block] |
Key Fund Statistics as of 12/31/2025- Total Net Assets$517,313,159
- Number of Portfolio Holdings5
- Portfolio Turnover Rate20%
- Total Advisory Fees Paid$0
|
| Holdings [Text Block] |
Asset Types |
% |
Domestic Equity |
51.6% |
International Equity |
38.3% |
Domestic Fixed Income |
9.8% |
Short-Term Investments |
0.3% | |
| Largest Holdings [Text Block] |
Holdings |
% |
State Street Equity 500 Index II Portfolio |
38.7% |
State Street Global All Cap Equity ex-U.S. Index Portfolio |
38.3% |
State Street Small/Mid Cap Equity Index Portfolio |
12.9% |
State Street SPDR Portfolio Long Term Treasury ETF |
9.8% | |
| Material Fund Change [Text Block] |
|
| C000216582 |
|
| Shareholder Report [Line Items] |
|
| Fund Name |
State Street Target Retirement 2065 Fund
|
| Class Name |
Class I
|
| Trading Symbol |
SSFJX
|
| Annual or Semi-Annual Statement [Text Block] |
This annual shareholder report contains important information about the State Street Target Retirement 2065 Fund (the "Fund") for the period of January 1, 2025 through December 31, 2025.
|
| Additional Information [Text Block] |
You can find additional information about the Fund, including the Prospectus, Statement of Additional Information, financial statements and other information at www.ssga.com/us/en/institutional/fund-finder?tab=documents&type=mf. You can also request this information about the Fund by contacting us at 1-800-647-7327.
|
| Additional Information Phone Number |
1-800-647-7327
|
| Additional Information Website |
www.ssga.com/us/en/institutional/fund-finder?tab=documents&type=mf
|
| Expenses [Text Block] |
What were the Fund costs for the last year? (based on a hypothetical $10,000 Investment)
Class Name |
Costs of a $10,000 investment |
Costs paid as a percentage of a $10,000 investment |
Class I |
$22 |
0.20% | Does not include expenses of the Underlying Funds in which the Fund invests. |
| Expenses Paid, Amount |
$ 22
|
| Expense Ratio, Percent |
0.20%
|
| Factors Affecting Performance [Text Block] |
How did the Fund perform last year and what affected its performance?The main driver of the Fund’s performance on an absolute basis during the reporting period were its positions in the State Street Global Equity ex-US Index Portfolio which returned approximately 32.7% for the reporting period. On an individual security level, the top positive contributors to the Fund’s performance on an absolute basis during the reporting period were the State Street Global Equity ex-US Index Portfolio, the State Street Equity 500 Index II Portfolio, and the State Street Small/Mid Cap Equity Index Portfolio. There were no negative contributors to the Fund’s performance on an absolute basis during the reporting period. |
| Performance Past Does Not Indicate Future [Text] |
The Fund’s past performance is not necessarily an indication of how the Fund will perform in the future. The returns do not reflect the deduction of taxes that a shareholder would pay on Fund distributions or on the redemption or sale of Fund shares.
|
| Line Graph [Table Text Block] |
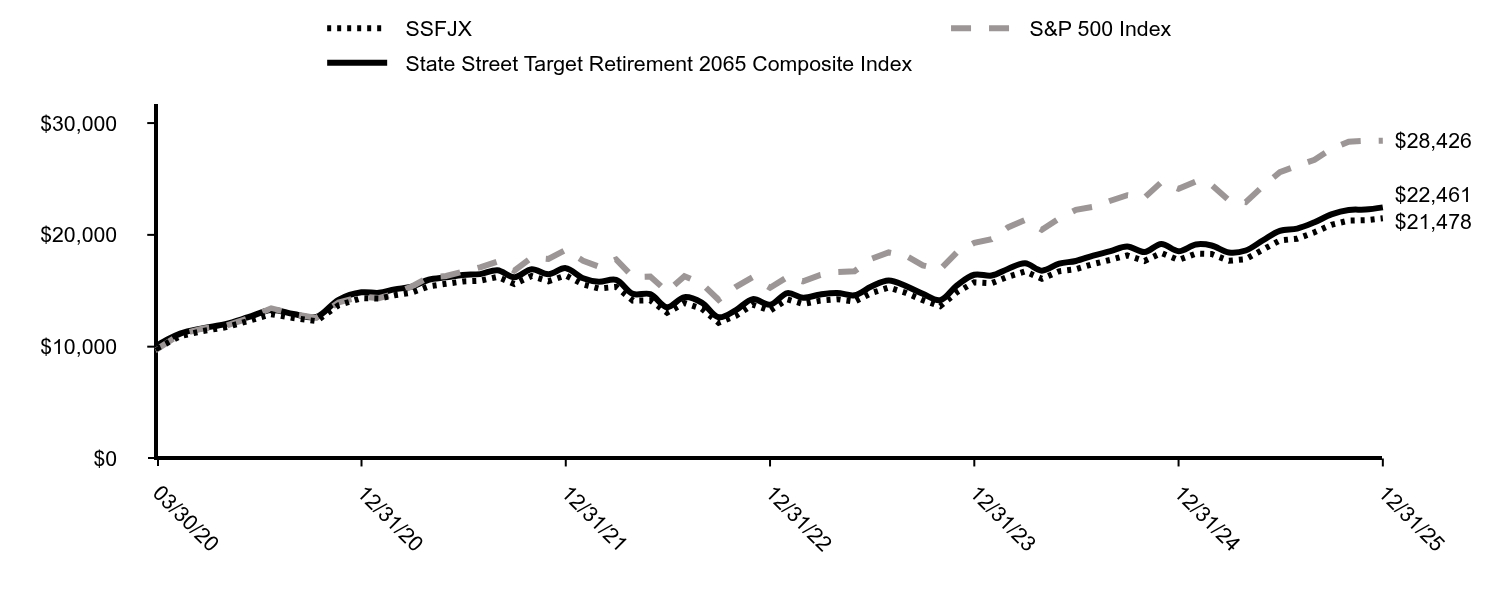
|
SSFJX |
S&P 500 Index |
State Street Target Retirement 2065 Composite Index |
03/30/20 |
$10,000 |
$10,000 |
$10,000 |
03/31/20 |
$9,900 |
$9,841 |
$10,117 |
04/30/20 |
$10,942 |
$11,102 |
$11,171 |
05/31/20 |
$11,403 |
$11,631 |
$11,664 |
06/30/20 |
$11,733 |
$11,863 |
$12,018 |
07/31/20 |
$12,295 |
$12,531 |
$12,632 |
08/31/20 |
$12,906 |
$13,432 |
$13,278 |
09/30/20 |
$12,555 |
$12,922 |
$12,922 |
10/31/20 |
$12,285 |
$12,578 |
$12,657 |
11/30/20 |
$13,707 |
$13,955 |
$14,193 |
12/31/20 |
$14,344 |
$14,492 |
$14,859 |
01/31/21 |
$14,302 |
$14,345 |
$14,815 |
02/28/21 |
$14,596 |
$14,741 |
$15,128 |
03/31/21 |
$14,837 |
$15,386 |
$15,374 |
04/30/21 |
$15,392 |
$16,208 |
$15,986 |
05/31/21 |
$15,622 |
$16,321 |
$16,202 |
06/30/21 |
$15,832 |
$16,702 |
$16,418 |
07/31/21 |
$15,895 |
$17,099 |
$16,491 |
08/31/21 |
$16,241 |
$17,618 |
$16,843 |
09/30/21 |
$15,601 |
$16,799 |
$16,215 |
10/31/21 |
$16,314 |
$17,976 |
$16,929 |
11/30/21 |
$15,853 |
$17,851 |
$16,485 |
12/31/21 |
$16,366 |
$18,651 |
$17,024 |
01/31/22 |
$15,570 |
$17,686 |
$16,122 |
02/28/22 |
$15,204 |
$17,157 |
$15,811 |
03/31/22 |
$15,344 |
$17,794 |
$15,979 |
04/30/22 |
$14,118 |
$16,242 |
$14,718 |
05/31/22 |
$14,151 |
$16,272 |
$14,700 |
06/30/22 |
$13,032 |
$14,929 |
$13,531 |
07/31/22 |
$13,903 |
$16,305 |
$14,432 |
08/31/22 |
$13,398 |
$15,640 |
$13,944 |
09/30/22 |
$12,140 |
$14,200 |
$12,634 |
10/31/22 |
$12,764 |
$15,349 |
$13,265 |
11/30/22 |
$13,753 |
$16,207 |
$14,253 |
12/31/22 |
$13,219 |
$15,273 |
$13,756 |
01/31/23 |
$14,236 |
$16,233 |
$14,792 |
02/28/23 |
$13,816 |
$15,837 |
$14,374 |
03/31/23 |
$14,114 |
$16,419 |
$14,671 |
04/30/23 |
$14,247 |
$16,675 |
$14,805 |
05/31/23 |
$14,026 |
$16,747 |
$14,597 |
06/30/23 |
$14,789 |
$17,854 |
$15,380 |
07/31/23 |
$15,286 |
$18,427 |
$15,913 |
08/31/23 |
$14,800 |
$18,134 |
$15,414 |
09/30/23 |
$14,148 |
$17,269 |
$14,729 |
10/31/23 |
$13,617 |
$16,906 |
$14,157 |
11/30/23 |
$14,866 |
$18,450 |
$15,484 |
12/31/23 |
$15,757 |
$19,289 |
$16,430 |
01/31/24 |
$15,678 |
$19,613 |
$16,363 |
02/29/24 |
$16,253 |
$20,660 |
$16,949 |
03/31/24 |
$16,727 |
$21,325 |
$17,458 |
04/30/24 |
$16,073 |
$20,454 |
$16,801 |
05/31/24 |
$16,739 |
$21,468 |
$17,429 |
06/30/24 |
$16,930 |
$22,238 |
$17,666 |
07/31/24 |
$17,393 |
$22,509 |
$18,150 |
08/31/24 |
$17,766 |
$23,055 |
$18,542 |
09/30/24 |
$18,161 |
$23,547 |
$18,962 |
10/31/24 |
$17,664 |
$23,334 |
$18,459 |
11/30/24 |
$18,375 |
$24,703 |
$19,184 |
12/31/24 |
$17,753 |
$24,114 |
$18,539 |
01/31/25 |
$18,321 |
$24,786 |
$19,144 |
02/28/25 |
$18,286 |
$24,463 |
$19,052 |
03/31/25 |
$17,684 |
$23,084 |
$18,420 |
04/30/25 |
$17,823 |
$22,928 |
$18,603 |
05/31/25 |
$18,692 |
$24,371 |
$19,520 |
06/30/25 |
$19,503 |
$25,610 |
$20,364 |
07/31/25 |
$19,654 |
$26,185 |
$20,563 |
08/31/25 |
$20,233 |
$26,716 |
$21,129 |
09/30/25 |
$20,905 |
$27,691 |
$21,828 |
10/31/25 |
$21,276 |
$28,339 |
$22,229 |
11/30/25 |
$21,311 |
$28,409 |
$22,266 |
12/31/25 |
$21,478 |
$28,426 |
$22,461 |
|
| Average Annual Return [Table Text Block] |
Name |
1 Year |
5 Years |
Since Inception 03/30/20 |
SSFJX |
20.98% |
8.41% |
14.20% |
S&P 500 Index |
17.88% |
14.42% |
19.90% |
State Street Target Retirement 2065 Composite Index |
21.15% |
8.61% |
15.09% | |
| Performance Inception Date |
Mar. 30, 2020
|
| Updated Performance Information Location [Text Block] |
Updated performance information is available by calling 1-800-647-7327 or visiting our website at www.ssga.com.
|
| AssetsNet |
$ 517,313,159
|
| Holdings Count | Holding |
5
|
| Advisory Fees Paid, Amount |
$ 0
|
| InvestmentCompanyPortfolioTurnover |
20.00%
|
| Additional Fund Statistics [Text Block] |
Key Fund Statistics as of 12/31/2025- Total Net Assets$517,313,159
- Number of Portfolio Holdings5
- Portfolio Turnover Rate20%
- Total Advisory Fees Paid$0
|
| Holdings [Text Block] |
Asset Types |
% |
Domestic Equity |
51.6% |
International Equity |
38.3% |
Domestic Fixed Income |
9.8% |
Short-Term Investments |
0.3% | |
| Largest Holdings [Text Block] |
Holdings |
% |
State Street Equity 500 Index II Portfolio |
38.7% |
State Street Global All Cap Equity ex-U.S. Index Portfolio |
38.3% |
State Street Small/Mid Cap Equity Index Portfolio |
12.9% |
State Street SPDR Portfolio Long Term Treasury ETF |
9.8% | |
| Material Fund Change [Text Block] |
|
| C000216583 |
|
| Shareholder Report [Line Items] |
|
| Fund Name |
State Street Target Retirement 2065 Fund
|
| Class Name |
Class K
|
| Trading Symbol |
SSFKX
|
| Annual or Semi-Annual Statement [Text Block] |
This annual shareholder report contains important information about the State Street Target Retirement 2065 Fund (the "Fund") for the period of January 1, 2025 through December 31, 2025.
|
| Additional Information [Text Block] |
You can find additional information about the Fund, including the Prospectus, Statement of Additional Information, financial statements and other information at www.ssga.com/us/en/institutional/fund-finder?tab=documents&type=mf. You can also request this information about the Fund by contacting us at 1-800-647-7327.
|
| Additional Information Phone Number |
1-800-647-7327
|
| Additional Information Website |
www.ssga.com/us/en/institutional/fund-finder?tab=documents&type=mf
|
| Expenses [Text Block] |
What were the Fund costs for the last year? (based on a hypothetical $10,000 Investment)
Class Name |
Costs of a $10,000 investment |
Costs paid as a percentage of a $10,000 investment |
Class K |
$7 |
0.06% | Does not include expenses of the Underlying Funds in which the Fund invests. |
| Expenses Paid, Amount |
$ 7
|
| Expense Ratio, Percent |
0.06%
|
| Factors Affecting Performance [Text Block] |
How did the Fund perform last year and what affected its performance?The main driver of the Fund’s performance on an absolute basis during the reporting period were its positions in the State Street Global Equity ex-US Index Portfolio which returned approximately 32.7% for the reporting period. On an individual security level, the top positive contributors to the Fund’s performance on an absolute basis during the reporting period were the State Street Global Equity ex-US Index Portfolio, the State Street Equity 500 Index II Portfolio, and the State Street Small/Mid Cap Equity Index Portfolio. There were no negative contributors to the Fund’s performance on an absolute basis during the reporting period. |
| Performance Past Does Not Indicate Future [Text] |
The Fund’s past performance is not necessarily an indication of how the Fund will perform in the future. The returns do not reflect the deduction of taxes that a shareholder would pay on Fund distributions or on the redemption or sale of Fund shares.
|
| Line Graph [Table Text Block] |

|
SSFKX |
S&P 500 Index |
State Street Target Retirement 2065 Composite Index |
03/30/20 |
$10,000 |
$10,000 |
$10,000 |
03/31/20 |
$9,900 |
$9,841 |
$10,117 |
04/30/20 |
$10,942 |
$11,102 |
$11,171 |
05/31/20 |
$11,403 |
$11,631 |
$11,664 |
06/30/20 |
$11,743 |
$11,863 |
$12,018 |
07/31/20 |
$12,295 |
$12,531 |
$12,632 |
08/31/20 |
$12,906 |
$13,432 |
$13,278 |
09/30/20 |
$12,555 |
$12,922 |
$12,922 |
10/31/20 |
$12,295 |
$12,578 |
$12,657 |
11/30/20 |
$13,727 |
$13,955 |
$14,193 |
12/31/20 |
$14,363 |
$14,492 |
$14,859 |
01/31/21 |
$14,321 |
$14,345 |
$14,815 |
02/28/21 |
$14,625 |
$14,741 |
$15,128 |
03/31/21 |
$14,856 |
$15,386 |
$15,374 |
04/30/21 |
$15,422 |
$16,208 |
$15,986 |
05/31/21 |
$15,664 |
$16,321 |
$16,202 |
06/30/21 |
$15,873 |
$16,702 |
$16,418 |
07/31/21 |
$15,936 |
$17,099 |
$16,491 |
08/31/21 |
$16,283 |
$17,618 |
$16,843 |
09/30/21 |
$15,643 |
$16,799 |
$16,215 |
10/31/21 |
$16,366 |
$17,976 |
$16,929 |
11/30/21 |
$15,905 |
$17,851 |
$16,485 |
12/31/21 |
$16,430 |
$18,651 |
$17,024 |
01/31/22 |
$15,621 |
$17,686 |
$16,122 |
02/28/22 |
$15,265 |
$17,157 |
$15,811 |
03/31/22 |
$15,405 |
$17,794 |
$15,979 |
04/30/22 |
$14,175 |
$16,242 |
$14,718 |
05/31/22 |
$14,207 |
$16,272 |
$14,700 |
06/30/22 |
$13,086 |
$14,929 |
$13,531 |
07/31/22 |
$13,970 |
$16,305 |
$14,432 |
08/31/22 |
$13,463 |
$15,640 |
$13,944 |
09/30/22 |
$12,201 |
$14,200 |
$12,634 |
10/31/22 |
$12,827 |
$15,349 |
$13,265 |
11/30/22 |
$13,830 |
$16,207 |
$14,253 |
12/31/22 |
$13,289 |
$15,273 |
$13,756 |
01/31/23 |
$14,322 |
$16,233 |
$14,792 |
02/28/23 |
$13,889 |
$15,837 |
$14,374 |
03/31/23 |
$14,200 |
$16,419 |
$14,671 |
04/30/23 |
$14,334 |
$16,675 |
$14,805 |
05/31/23 |
$14,111 |
$16,747 |
$14,597 |
06/30/23 |
$14,889 |
$17,854 |
$15,380 |
07/31/23 |
$15,389 |
$18,427 |
$15,913 |
08/31/23 |
$14,900 |
$18,134 |
$15,414 |
09/30/23 |
$14,245 |
$17,269 |
$14,729 |
10/31/23 |
$13,711 |
$16,906 |
$14,157 |
11/30/23 |
$14,978 |
$18,450 |
$15,484 |
12/31/23 |
$15,871 |
$19,289 |
$16,430 |
01/31/24 |
$15,792 |
$19,613 |
$16,363 |
02/29/24 |
$16,383 |
$20,660 |
$16,949 |
03/31/24 |
$16,861 |
$21,325 |
$17,458 |
04/30/24 |
$16,213 |
$20,454 |
$16,801 |
05/31/24 |
$16,872 |
$21,468 |
$17,429 |
06/30/24 |
$17,077 |
$22,238 |
$17,666 |
07/31/24 |
$17,543 |
$22,509 |
$18,150 |
08/31/24 |
$17,907 |
$23,055 |
$18,542 |
09/30/24 |
$18,304 |
$23,547 |
$18,962 |
10/31/24 |
$17,804 |
$23,334 |
$18,459 |
11/30/24 |
$18,532 |
$24,703 |
$19,184 |
12/31/24 |
$17,895 |
$24,114 |
$18,539 |
01/31/25 |
$18,468 |
$24,786 |
$19,144 |
02/28/25 |
$18,433 |
$24,463 |
$19,052 |
03/31/25 |
$17,825 |
$23,084 |
$18,420 |
04/30/25 |
$17,965 |
$22,928 |
$18,603 |
05/31/25 |
$18,853 |
$24,371 |
$19,520 |
06/30/25 |
$19,660 |
$25,610 |
$20,364 |
07/31/25 |
$19,824 |
$26,185 |
$20,563 |
08/31/25 |
$20,408 |
$26,716 |
$21,129 |
09/30/25 |
$21,086 |
$27,691 |
$21,828 |
10/31/25 |
$21,460 |
$28,339 |
$22,229 |
11/30/25 |
$21,495 |
$28,409 |
$22,266 |
12/31/25 |
$21,674 |
$28,426 |
$22,461 |
|
| Average Annual Return [Table Text Block] |
Name |
1 Year |
5 Years |
Since Inception 03/30/20 |
SSFKX |
21.12% |
8.58% |
14.38% |
S&P 500 Index |
17.88% |
14.42% |
19.90% |
State Street Target Retirement 2065 Composite Index |
21.15% |
8.61% |
15.09% | |
| Performance Inception Date |
Mar. 30, 2020
|
| Updated Performance Information Location [Text Block] |
Updated performance information is available by calling 1-800-647-7327 or visiting our website at www.ssga.com.
|
| AssetsNet |
$ 517,313,159
|
| Holdings Count | Holding |
5
|
| Advisory Fees Paid, Amount |
$ 0
|
| InvestmentCompanyPortfolioTurnover |
20.00%
|
| Additional Fund Statistics [Text Block] |
Key Fund Statistics as of 12/31/2025- Total Net Assets$517,313,159
- Number of Portfolio Holdings5
- Portfolio Turnover Rate20%
- Total Advisory Fees Paid$0
|
| Holdings [Text Block] |
Asset Types |
% |
Domestic Equity |
51.6% |
International Equity |
38.3% |
Domestic Fixed Income |
9.8% |
Short-Term Investments |
0.3% | |
| Largest Holdings [Text Block] |
Holdings |
% |
State Street Equity 500 Index II Portfolio |
38.7% |
State Street Global All Cap Equity ex-U.S. Index Portfolio |
38.3% |
State Street Small/Mid Cap Equity Index Portfolio |
12.9% |
State Street SPDR Portfolio Long Term Treasury ETF |
9.8% | |
| Material Fund Change [Text Block] |
|
| C000253750 |
|
| Shareholder Report [Line Items] |
|
| Fund Name |
State Street Target Retirement 2070 Fund
|
| Class Name |
Class I
|
| Trading Symbol |
SSGQX
|
| Annual or Semi-Annual Statement [Text Block] |
This annual shareholder report contains important information about the State Street Target Retirement 2070 Fund (the "Fund") for the period of January 1, 2025 through December 31, 2025.
|
| Additional Information [Text Block] |
You can find additional information about the Fund, including the Prospectus, Statement of Additional Information, financial statements and other information at www.ssga.com/us/en/institutional/fund-finder?tab=documents&type=mf. You can also request this information about the Fund by contacting us at 1-800-647-7327 .
|
| Additional Information Phone Number |
1-800-647-7327
|
| Additional Information Website |
www.ssga.com/us/en/institutional/fund-finder?tab=documents&type=mf
|
| Expenses [Text Block] |
What were the Fund costs for the last year? (based on a hypothetical $10,000 Investment)
Class Name |
Costs of a $10,000 investment |
Costs paid as a percentage of a $10,000 investment |
Class I |
$7 |
0.06% | Does not include expenses of the Underlying Funds in which the Fund invests. |
| Expenses Paid, Amount |
$ 7
|
| Expense Ratio, Percent |
0.06%
|
| Factors Affecting Performance [Text Block] |
How did the Fund perform last year and what affected its performance?The main driver of the Fund’s performance on an absolute basis during the reporting period was its position in the State Street Global Equity ex-US Index Portfolio which returned approximately 32.7% for the reporting period. On an individual security level, the top positive contributors to the Fund’s performance on an absolute basis during the reporting period were the State Street Global Equity ex-US Index Portfolio, the State Street Equity 500 Index II Portfolio, and the State Street Small/Mid Cap Equity Index Portfolio. A non-recurring operational matter contributed to the outperformance of the Fund relative to the Composite Index for the month of March 2025. There were no negative contributors to the Fund’s performance on an absolute basis during the reporting period. |
| Performance Past Does Not Indicate Future [Text] |
The Fund’s past performance is not necessarily an indication of how the Fund will perform in the future. The returns do not reflect the deduction of taxes that a shareholder would pay on Fund distributions or on the redemption or sale of Fund shares.
|
| Line Graph [Table Text Block] |
|
SSGQX |
S&P 500 Index |
State Street Target Retirement 2070 Composite Index |
12/31/24 |
$10,000 |
$10,000 |
$10,000 |
01/31/25 |
$10,320 |
$10,278 |
$10,326 |
02/28/25 |
$10,300 |
$10,144 |
$10,276 |
03/31/25 |
$10,180 |
$9,573 |
$9,935 |
04/30/25 |
$10,260 |
$9,508 |
$10,034 |
05/31/25 |
$10,770 |
$10,106 |
$10,529 |
06/30/25 |
$11,230 |
$10,621 |
$10,984 |
07/31/25 |
$11,320 |
$10,859 |
$11,092 |
08/31/25 |
$11,650 |
$11,079 |
$11,397 |
09/30/25 |
$12,030 |
$11,483 |
$11,774 |
10/31/25 |
$12,250 |
$11,752 |
$11,990 |
11/30/25 |
$12,270 |
$11,781 |
$12,010 |
12/31/25 |
$12,378 |
$11,789 |
$12,115 |
|
| Average Annual Return [Table Text Block] |
Name |
1 Year |
Since Inception 12/31/24 |
SSGQX |
23.78% |
23.71% |
S&P 500 Index |
17.88% |
15.07% |
State Street Target Retirement 2070 Composite Index |
21.15% |
21.15% | |
| Performance Inception Date |
Dec. 31, 2024
|
| Updated Performance Information Location [Text Block] |
Updated performance information is available by calling 1-800-647-7327 or visiting our website at www.ssga.com.
|
| AssetsNet |
$ 57,775,705
|
| Holdings Count | Holding |
5
|
| Advisory Fees Paid, Amount |
$ 0
|
| InvestmentCompanyPortfolioTurnover |
7.00%
|
| Additional Fund Statistics [Text Block] |
Key Fund Statistics as of 12/31/2025- Total Net Assets$57,775,705
- Number of Portfolio Holdings5
- Portfolio Turnover Rate7%
- Total Advisory Fees Paid$0
|
| Holdings [Text Block] |
Asset Types |
% |
Domestic Equity |
51.5% |
International Equity |
38.3% |
Domestic Fixed Income |
9.8% |
Short-Term Investments |
0.5% | |
| Largest Holdings [Text Block] |
Holdings |
% |
State Street Equity 500 Index II Portfolio |
38.5% |
State Street Global All Cap Equity ex-U.S. Index Portfolio |
38.3% |
State Street Small/Mid Cap Equity Index Portfolio |
12.6% |
State Street SPDR Portfolio Long Term Treasury ETF |
9.8% | |
| Material Fund Change [Text Block] |
|
| C000253751 |
|
| Shareholder Report [Line Items] |
|
| Fund Name |
State Street Target Retirement 2070 Fund
|
| Class Name |
Class K
|
| Trading Symbol |
SSGNX
|
| Annual or Semi-Annual Statement [Text Block] |
This annual shareholder report contains important information about the State Street Target Retirement 2070 Fund (the "Fund") for the period of January 1, 2025 through December 31, 2025.
|
| Additional Information [Text Block] |
You can find additional information about the Fund, including the Prospectus, Statement of Additional Information, financial statements and other information at www.ssga.com/us/en/institutional/fund-finder?tab=documents&type=mf. You can also request this information about the Fund by contacting us at 1-800-647-7327 .
|
| Additional Information Phone Number |
1-800-647-7327
|
| Additional Information Website |
www.ssga.com/us/en/institutional/fund-finder?tab=documents&type=mf
|
| Expenses [Text Block] |
What were the Fund costs for the last year? (based on a hypothetical $10,000 Investment)
Class Name |
Costs of a $10,000 investment |
Costs paid as a percentage of a $10,000 investment |
Class K |
$7 |
0.06% | Does not include expenses of the Underlying Funds in which the Fund invests. |
| Expenses Paid, Amount |
$ 7
|
| Expense Ratio, Percent |
0.06%
|
| Factors Affecting Performance [Text Block] |
How did the Fund perform last year and what affected its performance?The main driver of the Fund’s performance on an absolute basis during the reporting period was its position in the State Street Global Equity ex-US Index Portfolio which returned approximately 32.7% for the reporting period. On an individual security level, the top positive contributors to the Fund’s performance on an absolute basis during the reporting period were the State Street Global Equity ex-US Index Portfolio, the State Street Equity 500 Index II Portfolio, and the State Street Small/Mid Cap Equity Index Portfolio. A non-recurring operational matter contributed to the outperformance of the Fund relative to the Composite Index for the month of March 2025. There were no negative contributors to the Fund’s performance on an absolute basis during the reporting period. |
| Performance Past Does Not Indicate Future [Text] |
The Fund’s past performance is not necessarily an indication of how the Fund will perform in the future. The returns do not reflect the deduction of taxes that a shareholder would pay on Fund distributions or on the redemption or sale of Fund shares.
|
| Line Graph [Table Text Block] |
|
SSGNX |
S&P 500 Index |
State Street Target Retirement 2070 Composite Index |
12/31/24 |
$10,000 |
$10,000 |
$10,000 |
01/31/25 |
$10,320 |
$10,278 |
$10,326 |
02/28/25 |
$10,300 |
$10,144 |
$10,276 |
03/31/25 |
$10,180 |
$9,573 |
$9,935 |
04/30/25 |
$10,270 |
$9,508 |
$10,034 |
05/31/25 |
$10,770 |
$10,106 |
$10,529 |
06/30/25 |
$11,230 |
$10,621 |
$10,984 |
07/31/25 |
$11,320 |
$10,859 |
$11,092 |
08/31/25 |
$11,650 |
$11,079 |
$11,397 |
09/30/25 |
$12,040 |
$11,483 |
$11,774 |
10/31/25 |
$12,260 |
$11,752 |
$11,990 |
11/30/25 |
$12,270 |
$11,781 |
$12,010 |
12/31/25 |
$12,378 |
$11,789 |
$12,115 |
|
| Average Annual Return [Table Text Block] |
Name |
1 Year |
Since Inception 12/31/24 |
SSGNX |
23.78% |
23.71% |
S&P 500 Index |
17.88% |
15.07% |
State Street Target Retirement 2070 Composite Index |
21.15% |
21.15% | |
| Performance Inception Date |
Dec. 31, 2024
|
| Updated Performance Information Location [Text Block] |
Updated performance information is available by calling 1-800-647-7327 or visiting our website at www.ssga.com.
|
| AssetsNet |
$ 57,775,705
|
| Holdings Count | Holding |
5
|
| Advisory Fees Paid, Amount |
$ 0
|
| InvestmentCompanyPortfolioTurnover |
7.00%
|
| Additional Fund Statistics [Text Block] |
Key Fund Statistics as of 12/31/2025- Total Net Assets$57,775,705
- Number of Portfolio Holdings5
- Portfolio Turnover Rate7%
- Total Advisory Fees Paid$0
|
| Holdings [Text Block] |
Asset Types |
% |
Domestic Equity |
51.5% |
International Equity |
38.3% |
Domestic Fixed Income |
9.8% |
Short-Term Investments |
0.5% | |
| Largest Holdings [Text Block] |
Holdings |
% |
State Street Equity 500 Index II Portfolio |
38.5% |
State Street Global All Cap Equity ex-U.S. Index Portfolio |
38.3% |
State Street Small/Mid Cap Equity Index Portfolio |
12.6% |
State Street SPDR Portfolio Long Term Treasury ETF |
9.8% | |
| Material Fund Change [Text Block] |
|
| C000253749 |
|
| Shareholder Report [Line Items] |
|
| Fund Name |
State Street Target Retirement 2070 Fund
|
| Class Name |
Class R3
|
| Trading Symbol |
SSGUX
|
| Annual or Semi-Annual Statement [Text Block] |
This annual shareholder report contains important information about the State Street Target Retirement 2070 Fund (the "Fund") for the period of January 1, 2025 through December 31, 2025.
|
| Additional Information [Text Block] |
You can find additional information about the Fund, including the Prospectus, Statement of Additional Information, financial statements and other information at www.ssga.com/us/en/institutional/fund-finder?tab=documents&type=mf. You can also request this information about the Fund by contacting us at 1-800-647-7327 .
|
| Additional Information Phone Number |
1-800-647-7327
|
| Additional Information Website |
www.ssga.com/us/en/institutional/fund-finder?tab=documents&type=mf
|
| Expenses [Text Block] |
What were the Fund costs for the last year? (based on a hypothetical $10,000 Investment)
Class Name |
Costs of a $10,000 investment |
Costs paid as a percentage of a $10,000 investment |
Class R3 |
$35 |
0.31% | Does not include expenses of the Underlying Funds in which the Fund invests. |
| Expenses Paid, Amount |
$ 35
|
| Expense Ratio, Percent |
0.31%
|
| Factors Affecting Performance [Text Block] |
How did the Fund perform last year and what affected its performance?The main driver of the Fund’s performance on an absolute basis during the reporting period was its position in the State Street Global Equity ex-US Index Portfolio which returned approximately 32.7% for the reporting period. On an individual security level, the top positive contributors to the Fund’s performance on an absolute basis during the reporting period were the State Street Global Equity ex-US Index Portfolio, the State Street Equity 500 Index II Portfolio, and the State Street Small/Mid Cap Equity Index Portfolio. A non-recurring operational matter contributed to the outperformance of the Fund relative to the Composite Index for the month of March 2025. There were no negative contributors to the Fund’s performance on an absolute basis during the reporting period. |
| Performance Past Does Not Indicate Future [Text] |
The Fund’s past performance is not necessarily an indication of how the Fund will perform in the future. The returns do not reflect the deduction of taxes that a shareholder would pay on Fund distributions or on the redemption or sale of Fund shares.
|
| Line Graph [Table Text Block] |
|
SSGUX |
S&P 500 Index |
State Street Target Retirement 2070 Composite Index |
12/31/24 |
$10,000 |
$10,000 |
$10,000 |
01/31/25 |
$10,320 |
$10,278 |
$10,326 |
02/28/25 |
$10,300 |
$10,144 |
$10,276 |
03/31/25 |
$10,180 |
$9,573 |
$9,935 |
04/30/25 |
$10,260 |
$9,508 |
$10,034 |
05/31/25 |
$10,750 |
$10,106 |
$10,529 |
06/30/25 |
$11,210 |
$10,621 |
$10,984 |
07/31/25 |
$11,300 |
$10,859 |
$11,092 |
08/31/25 |
$11,630 |
$11,079 |
$11,397 |
09/30/25 |
$12,010 |
$11,483 |
$11,774 |
10/31/25 |
$12,230 |
$11,752 |
$11,990 |
11/30/25 |
$12,240 |
$11,781 |
$12,010 |
12/31/25 |
$12,347 |
$11,789 |
$12,115 |
|
| Average Annual Return [Table Text Block] |
Name |
1 Year |
Since Inception 12/31/24 |
SSGUX |
23.47% |
23.40% |
S&P 500 Index |
17.88% |
15.07% |
State Street Target Retirement 2070 Composite Index |
21.15% |
21.15% | |
| Performance Inception Date |
Dec. 31, 2024
|
| Updated Performance Information Location [Text Block] |
Updated performance information is available by calling 1-800-647-7327 or visiting our website at www.ssga.com.
|
| AssetsNet |
$ 57,775,705
|
| Holdings Count | Holding |
5
|
| Advisory Fees Paid, Amount |
$ 0
|
| InvestmentCompanyPortfolioTurnover |
7.00%
|
| Additional Fund Statistics [Text Block] |
Key Fund Statistics as of 12/31/2025- Total Net Assets$57,775,705
- Number of Portfolio Holdings5
- Portfolio Turnover Rate7%
- Total Advisory Fees Paid$0
|
| Holdings [Text Block] |
Asset Types |
% |
Domestic Equity |
51.5% |
International Equity |
38.3% |
Domestic Fixed Income |
9.8% |
Short-Term Investments |
0.5% | |
| Largest Holdings [Text Block] |
Holdings |
% |
State Street Equity 500 Index II Portfolio |
38.5% |
State Street Global All Cap Equity ex-U.S. Index Portfolio |
38.3% |
State Street Small/Mid Cap Equity Index Portfolio |
12.6% |
State Street SPDR Portfolio Long Term Treasury ETF |
9.8% | |
| Material Fund Change [Text Block] |
|
| C000232293 |
|
| Shareholder Report [Line Items] |
|
| Fund Name |
State Street Target Retirement Fund
|
| Class Name |
Class R3
|
| Trading Symbol |
SSFQX
|
| Annual or Semi-Annual Statement [Text Block] |
This annual shareholder report contains important information about the State Street Target Retirement Fund (the "Fund") for the period of January 1, 2025 through December 31, 2025.
|
| Additional Information [Text Block] |
You can find additional information about the Fund, including the Prospectus, Statement of Additional Information, financial statements and other information at www.ssga.com/us/en/institutional/fund-finder?tab=documents&type=mf. You can also request this information about the Fund by contacting us at 1-800-647-7327.
|
| Additional Information Phone Number |
1-800-647-7327
|
| Additional Information Website |
www.ssga.com/us/en/institutional/fund-finder?tab=documents&type=mf
|
| Expenses [Text Block] |
What were the Fund costs for the last year? (based on a hypothetical $10,000 Investment)
Class Name |
Costs of a $10,000 investment |
Costs paid as a percentage of a $10,000 investment |
Class R3 |
$48 |
0.46% | Does not include expenses of the Underlying Funds in which the Fund invests. |
| Expenses Paid, Amount |
$ 48
|
| Expense Ratio, Percent |
0.46%
|
| Factors Affecting Performance [Text Block] |
How did the Fund perform last year and what affected its performance?The main driver of the Fund’s performance on an absolute basis during the reporting period was its position in the State Street Global Equity ex-US Index Portfolio which returned approximately 32.7% for the reporting period. On an individual security level, the top positive contributors to the Fund’s performance on an absolute basis during the reporting period were the State Street Global Equity ex-US Index Portfolio, the State Street Equity 500 Index II Portfolio, and the State Street Aggregate Bond Index Portfolio. There were no negative contributors to the Fund’s performance on an absolute basis during the reporting period. |
| Performance Past Does Not Indicate Future [Text] |
The Fund’s past performance is not necessarily an indication of how the Fund will perform in the future. The returns do not reflect the deduction of taxes that a shareholder would pay on Fund distributions or on the redemption or sale of Fund shares.
|
| Line Graph [Table Text Block] |
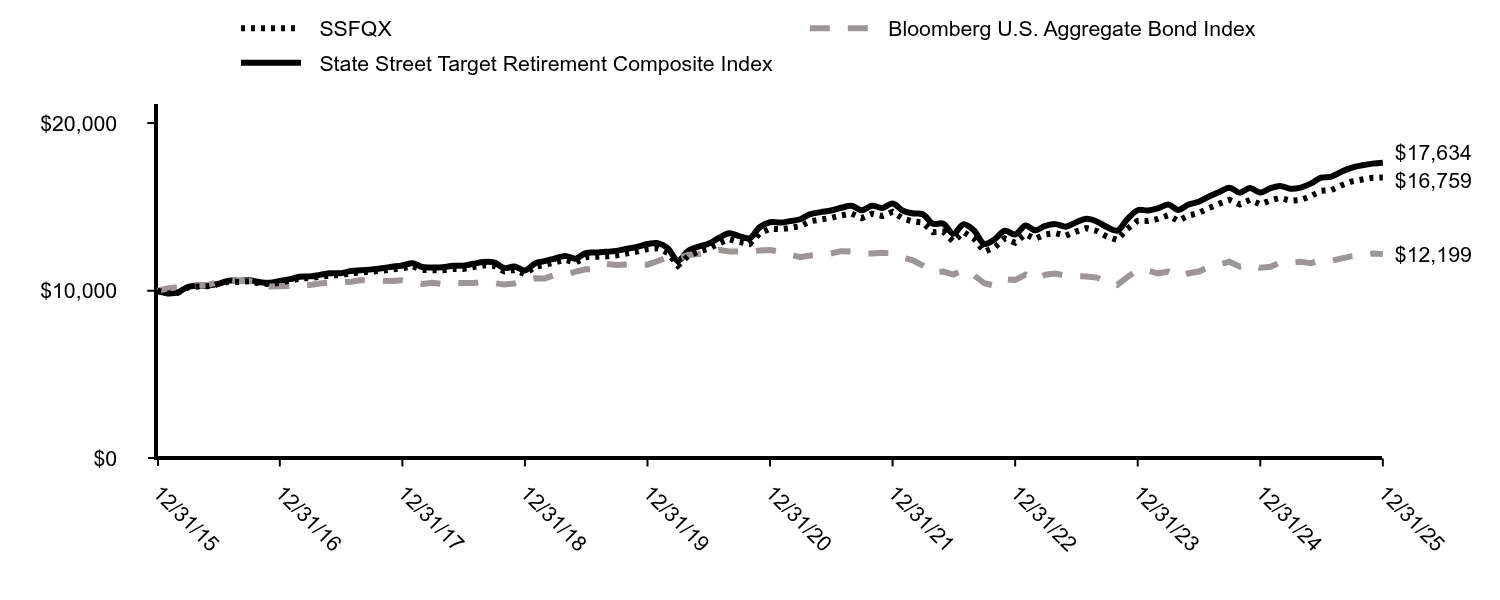
|
SSFQX |
Bloomberg U.S. Aggregate Bond Index |
State Street Target Retirement Composite Index |
12/31/15 |
$10,000 |
$10,000 |
$10,000 |
01/31/16 |
$9,842 |
$10,138 |
$9,859 |
02/29/16 |
$9,869 |
$10,210 |
$9,887 |
03/31/16 |
$10,192 |
$10,303 |
$10,224 |
04/30/16 |
$10,259 |
$10,343 |
$10,302 |
05/31/16 |
$10,275 |
$10,345 |
$10,314 |
06/30/16 |
$10,394 |
$10,531 |
$10,411 |
07/31/16 |
$10,542 |
$10,598 |
$10,606 |
08/31/16 |
$10,527 |
$10,586 |
$10,602 |
09/30/16 |
$10,564 |
$10,580 |
$10,631 |
10/31/16 |
$10,437 |
$10,499 |
$10,518 |
11/30/16 |
$10,392 |
$10,250 |
$10,475 |
12/31/16 |
$10,476 |
$10,265 |
$10,581 |
01/31/17 |
$10,595 |
$10,285 |
$10,692 |
02/28/17 |
$10,736 |
$10,354 |
$10,838 |
03/31/17 |
$10,752 |
$10,349 |
$10,858 |
04/30/17 |
$10,831 |
$10,428 |
$10,949 |
05/31/17 |
$10,919 |
$10,509 |
$11,041 |
06/30/17 |
$10,925 |
$10,498 |
$11,048 |
07/31/17 |
$11,044 |
$10,543 |
$11,176 |
08/31/17 |
$11,091 |
$10,638 |
$11,222 |
09/30/17 |
$11,139 |
$10,587 |
$11,276 |
10/31/17 |
$11,196 |
$10,593 |
$11,348 |
11/30/17 |
$11,274 |
$10,580 |
$11,430 |
12/31/17 |
$11,344 |
$10,628 |
$11,510 |
01/31/18 |
$11,466 |
$10,506 |
$11,641 |
02/28/18 |
$11,240 |
$10,406 |
$11,414 |
03/31/18 |
$11,224 |
$10,473 |
$11,392 |
04/30/18 |
$11,220 |
$10,395 |
$11,408 |
05/31/18 |
$11,300 |
$10,469 |
$11,486 |
06/30/18 |
$11,305 |
$10,456 |
$11,499 |
07/31/18 |
$11,417 |
$10,459 |
$11,611 |
08/31/18 |
$11,518 |
$10,526 |
$11,718 |
09/30/18 |
$11,481 |
$10,458 |
$11,687 |
10/31/18 |
$11,149 |
$10,376 |
$11,354 |
11/30/18 |
$11,240 |
$10,438 |
$11,450 |
12/31/18 |
$11,005 |
$10,630 |
$11,212 |
01/31/19 |
$11,440 |
$10,742 |
$11,644 |
02/28/19 |
$11,546 |
$10,736 |
$11,770 |
03/31/19 |
$11,695 |
$10,942 |
$11,926 |
04/30/19 |
$11,844 |
$10,945 |
$12,075 |
05/31/19 |
$11,685 |
$11,139 |
$11,918 |
06/30/19 |
$11,999 |
$11,279 |
$12,247 |
07/31/19 |
$12,026 |
$11,304 |
$12,282 |
08/31/19 |
$12,054 |
$11,597 |
$12,323 |
09/30/19 |
$12,115 |
$11,535 |
$12,379 |
10/31/19 |
$12,231 |
$11,570 |
$12,512 |
11/30/19 |
$12,335 |
$11,564 |
$12,616 |
12/31/19 |
$12,484 |
$11,556 |
$12,787 |
01/31/20 |
$12,535 |
$11,778 |
$12,843 |
02/29/20 |
$12,258 |
$11,990 |
$12,552 |
03/31/20 |
$11,496 |
$11,920 |
$11,789 |
04/30/20 |
$12,067 |
$12,132 |
$12,366 |
05/31/20 |
$12,334 |
$12,188 |
$12,627 |
06/30/20 |
$12,498 |
$12,265 |
$12,806 |
07/31/20 |
$12,820 |
$12,448 |
$13,148 |
08/31/20 |
$13,085 |
$12,348 |
$13,434 |
09/30/20 |
$12,911 |
$12,341 |
$13,258 |
10/31/20 |
$12,792 |
$12,286 |
$13,130 |
11/30/20 |
$13,418 |
$12,406 |
$13,789 |
12/31/20 |
$13,699 |
$12,424 |
$14,086 |
01/31/21 |
$13,671 |
$12,334 |
$14,068 |
02/28/21 |
$13,745 |
$12,156 |
$14,152 |
03/31/21 |
$13,854 |
$12,005 |
$14,266 |
04/30/21 |
$14,145 |
$12,099 |
$14,571 |
05/31/21 |
$14,253 |
$12,139 |
$14,688 |
06/30/21 |
$14,339 |
$12,224 |
$14,784 |
07/31/21 |
$14,493 |
$12,361 |
$14,948 |
08/31/21 |
$14,601 |
$12,337 |
$15,065 |
09/30/21 |
$14,332 |
$12,231 |
$14,797 |
10/31/21 |
$14,600 |
$12,227 |
$15,073 |
11/30/21 |
$14,457 |
$12,263 |
$14,941 |
12/31/21 |
$14,710 |
$12,232 |
$15,202 |
01/31/22 |
$14,302 |
$11,968 |
$14,767 |
02/28/22 |
$14,139 |
$11,835 |
$14,620 |
03/31/22 |
$14,066 |
$11,506 |
$14,569 |
04/30/22 |
$13,494 |
$11,069 |
$13,994 |
05/31/22 |
$13,531 |
$11,141 |
$14,002 |
06/30/22 |
$12,934 |
$10,966 |
$13,396 |
07/31/22 |
$13,494 |
$11,234 |
$13,972 |
08/31/22 |
$13,093 |
$10,917 |
$13,586 |
09/30/22 |
$12,326 |
$10,445 |
$12,791 |
10/31/22 |
$12,594 |
$10,310 |
$13,068 |
11/30/22 |
$13,117 |
$10,689 |
$13,581 |
12/31/22 |
$12,866 |
$10,641 |
$13,358 |
01/31/23 |
$13,375 |
$10,968 |
$13,888 |
02/28/23 |
$13,095 |
$10,684 |
$13,604 |
03/31/23 |
$13,362 |
$10,956 |
$13,872 |
04/30/23 |
$13,439 |
$11,022 |
$13,974 |
05/31/23 |
$13,286 |
$10,902 |
$13,822 |
06/30/23 |
$13,528 |
$10,863 |
$14,075 |
07/31/23 |
$13,732 |
$10,856 |
$14,298 |
08/31/23 |
$13,566 |
$10,786 |
$14,133 |
09/30/23 |
$13,235 |
$10,512 |
$13,799 |
10/31/23 |
$13,031 |
$10,346 |
$13,580 |
11/30/23 |
$13,681 |
$10,815 |
$14,267 |
12/31/23 |
$14,180 |
$11,229 |
$14,802 |
01/31/24 |
$14,166 |
$11,198 |
$14,793 |
02/29/24 |
$14,286 |
$11,040 |
$14,908 |
03/31/24 |
$14,500 |
$11,142 |
$15,148 |
04/30/24 |
$14,166 |
$10,860 |
$14,821 |
05/31/24 |
$14,487 |
$11,044 |
$15,143 |
06/30/24 |
$14,633 |
$11,149 |
$15,306 |
07/31/24 |
$14,941 |
$11,409 |
$15,621 |
08/31/24 |
$15,194 |
$11,573 |
$15,892 |
09/30/24 |
$15,421 |
$11,728 |
$16,146 |
10/31/24 |
$15,141 |
$11,437 |
$15,852 |
11/30/24 |
$15,421 |
$11,558 |
$16,130 |
12/31/24 |
$15,156 |
$11,369 |
$15,866 |
01/31/25 |
$15,395 |
$11,430 |
$16,121 |
02/28/25 |
$15,536 |
$11,681 |
$16,253 |
03/31/25 |
$15,367 |
$11,685 |
$16,084 |
04/30/25 |
$15,409 |
$11,731 |
$16,154 |
05/31/25 |
$15,649 |
$11,647 |
$16,402 |
06/30/25 |
$15,959 |
$11,826 |
$16,742 |
07/31/25 |
$16,001 |
$11,795 |
$16,801 |
08/31/25 |
$16,297 |
$11,936 |
$17,111 |
09/30/25 |
$16,522 |
$12,067 |
$17,346 |
10/31/25 |
$16,635 |
$12,142 |
$17,482 |
11/30/25 |
$16,733 |
$12,217 |
$17,581 |
12/31/25 |
$16,759 |
$12,199 |
$17,634 |
|
| Average Annual Return [Table Text Block] |
Name |
1 Year |
5 Years |
10 Years |
SSFQXFootnote Reference(1) |
10.58% |
4.11% |
5.30% |
Bloomberg U.S. Aggregate Bond Index |
7.30% |
(0.36%) |
2.01% |
State Street Target Retirement Composite Index |
11.14% |
4.60% |
5.84% | |
| Updated Performance Information Location [Text Block] |
Updated performance information is available by calling 1-800-647-7327 or visiting our website at www.ssga.com.
|
| AssetsNet |
$ 1,485,766,318
|
| Holdings Count | Holding |
12
|
| Advisory Fees Paid, Amount |
$ 0
|
| InvestmentCompanyPortfolioTurnover |
19.00%
|
| Additional Fund Statistics [Text Block] |
Key Fund Statistics as of 12/31/2025- Total Net Assets$1,485,766,318
- Number of Portfolio Holdings12
- Portfolio Turnover Rate19%
- Total Advisory Fees Paid$0
|
| Holdings [Text Block] |
Asset Types |
% |
Domestic Fixed Income |
50.4% |
Inflation Linked |
18.0% |
Domestic Equity |
16.3% |
International Equity |
10.1% |
Real Estate |
5.0% |
Short-Term Investments |
2.8% | |
| Largest Holdings [Text Block] |
Holdings |
% |
State Street Aggregate Bond Index Portfolio |
20.0% |
State Street SPDR Bloomberg 1-10 Year TIPS ETF |
18.0% |
State Street SPDR Portfolio Short Term Treasury ETF |
15.9% |
State Street Equity 500 Index II Portfolio |
14.7% |
State Street Global All Cap Equity ex-U.S. Index Portfolio |
10.1% |
State Street SPDR Bloomberg High Yield Bond ETF |
7.0% |
SPDR Dow Jones Global Real Estate ETF |
5.0% |
State Street SPDR Portfolio Short Term Corporate Bond ETF |
4.0% |
SPDR Bloomberg Enhanced Roll Yield Commodity Strategy No. K-1 ETF |
3.5% |
State Street Small/Mid Cap Equity Index Portfolio |
1.6% | |
| Material Fund Change [Text Block] |
|
| C000143856 |
|
| Shareholder Report [Line Items] |
|
| Fund Name |
State Street Target Retirement Fund
|
| Class Name |
Class I
|
| Trading Symbol |
SSFNX
|
| Annual or Semi-Annual Statement [Text Block] |
This annual shareholder report contains important information about the State Street Target Retirement Fund (the "Fund") for the period of January 1, 2025 through December 31, 2025.
|
| Additional Information [Text Block] |
You can find additional information about the Fund, including the Prospectus, Statement of Additional Information, financial statements and other information at www.ssga.com/us/en/institutional/fund-finder?tab=documents&type=mf. You can also request this information about the Fund by contacting us at 1-800-647-7327.
|
| Additional Information Phone Number |
1-800-647-7327
|
| Additional Information Website |
www.ssga.com/us/en/institutional/fund-finder?tab=documents&type=mf
|
| Expenses [Text Block] |
What were the Fund costs for the last year? (based on a hypothetical $10,000 Investment)
Class Name |
Costs of a $10,000 investment |
Costs paid as a percentage of a $10,000 investment |
Class I |
$12 |
0.11% | Does not include expenses of the Underlying Funds in which the Fund invests. |
| Expenses Paid, Amount |
$ 12
|
| Expense Ratio, Percent |
0.11%
|
| Factors Affecting Performance [Text Block] |
How did the Fund perform last year and what affected its performance?The main driver of the Fund’s performance on an absolute basis during the reporting period was its position in the State Street Global Equity ex-US Index Portfolio which returned approximately 32.7% for the reporting period. On an individual security level, the top positive contributors to the Fund’s performance on an absolute basis during the reporting period were the State Street Global Equity ex-US Index Portfolio, the State Street Equity 500 Index II Portfolio, and the State Street Aggregate Bond Index Portfolio. There were no negative contributors to the Fund’s performance on an absolute basis during the reporting period. |
| Performance Past Does Not Indicate Future [Text] |
The Fund’s past performance is not necessarily an indication of how the Fund will perform in the future. The returns do not reflect the deduction of taxes that a shareholder would pay on Fund distributions or on the redemption or sale of Fund shares.
|
| Line Graph [Table Text Block] |
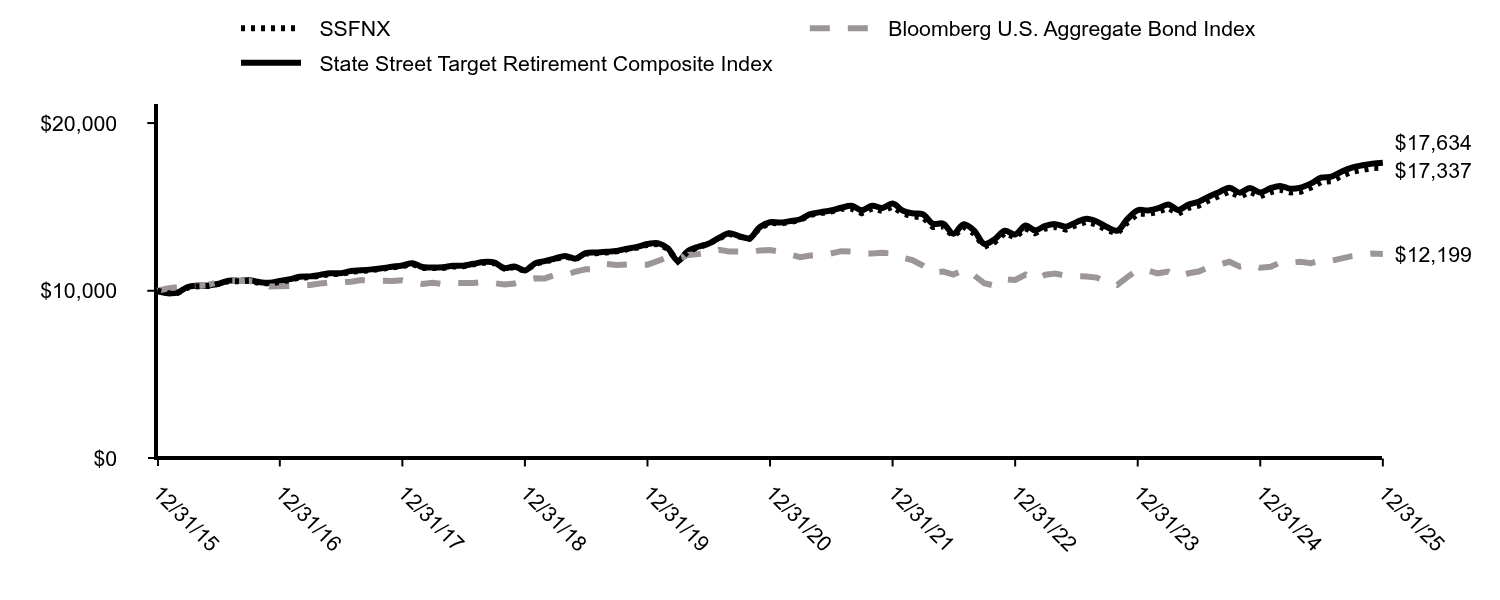
|
SSFNX |
Bloomberg U.S. Aggregate Bond Index |
State Street Target Retirement Composite Index |
12/31/15 |
$10,000 |
$10,000 |
$10,000 |
01/31/16 |
$9,847 |
$10,138 |
$9,859 |
02/29/16 |
$9,867 |
$10,210 |
$9,887 |
03/31/16 |
$10,194 |
$10,303 |
$10,224 |
04/30/16 |
$10,266 |
$10,343 |
$10,302 |
05/31/16 |
$10,286 |
$10,345 |
$10,314 |
06/30/16 |
$10,409 |
$10,531 |
$10,411 |
07/31/16 |
$10,572 |
$10,598 |
$10,606 |
08/31/16 |
$10,562 |
$10,586 |
$10,602 |
09/30/16 |
$10,592 |
$10,580 |
$10,631 |
10/31/16 |
$10,470 |
$10,499 |
$10,518 |
11/30/16 |
$10,439 |
$10,250 |
$10,475 |
12/31/16 |
$10,527 |
$10,265 |
$10,581 |
01/31/17 |
$10,652 |
$10,285 |
$10,692 |
02/28/17 |
$10,787 |
$10,354 |
$10,838 |
03/31/17 |
$10,808 |
$10,349 |
$10,858 |
04/30/17 |
$10,902 |
$10,428 |
$10,949 |
05/31/17 |
$10,995 |
$10,509 |
$11,041 |
06/30/17 |
$10,995 |
$10,498 |
$11,048 |
07/31/17 |
$11,131 |
$10,543 |
$11,176 |
08/31/17 |
$11,172 |
$10,638 |
$11,222 |
09/30/17 |
$11,235 |
$10,587 |
$11,276 |
10/31/17 |
$11,307 |
$10,593 |
$11,348 |
11/30/17 |
$11,391 |
$10,580 |
$11,430 |
12/31/17 |
$11,467 |
$10,628 |
$11,510 |
01/31/18 |
$11,595 |
$10,506 |
$11,641 |
02/28/18 |
$11,360 |
$10,406 |
$11,414 |
03/31/18 |
$11,360 |
$10,473 |
$11,392 |
04/30/18 |
$11,360 |
$10,395 |
$11,408 |
05/31/18 |
$11,445 |
$10,469 |
$11,486 |
06/30/18 |
$11,456 |
$10,456 |
$11,499 |
07/31/18 |
$11,573 |
$10,459 |
$11,611 |
08/31/18 |
$11,670 |
$10,526 |
$11,718 |
09/30/18 |
$11,648 |
$10,458 |
$11,687 |
10/31/18 |
$11,317 |
$10,376 |
$11,354 |
11/30/18 |
$11,413 |
$10,438 |
$11,450 |
12/31/18 |
$11,180 |
$10,630 |
$11,212 |
01/31/19 |
$11,615 |
$10,742 |
$11,644 |
02/28/19 |
$11,738 |
$10,736 |
$11,770 |
03/31/19 |
$11,894 |
$10,942 |
$11,926 |
04/30/19 |
$12,039 |
$10,945 |
$12,075 |
05/31/19 |
$11,883 |
$11,139 |
$11,918 |
06/30/19 |
$12,218 |
$11,279 |
$12,247 |
07/31/19 |
$12,240 |
$11,304 |
$12,282 |
08/31/19 |
$12,284 |
$11,597 |
$12,323 |
09/30/19 |
$12,351 |
$11,535 |
$12,379 |
10/31/19 |
$12,474 |
$11,570 |
$12,512 |
11/30/19 |
$12,575 |
$11,564 |
$12,616 |
12/31/19 |
$12,743 |
$11,556 |
$12,787 |
01/31/20 |
$12,789 |
$11,778 |
$12,843 |
02/29/20 |
$12,512 |
$11,990 |
$12,552 |
03/31/20 |
$11,751 |
$11,920 |
$11,789 |
04/30/20 |
$12,339 |
$12,132 |
$12,366 |
05/31/20 |
$12,604 |
$12,188 |
$12,627 |
06/30/20 |
$12,789 |
$12,265 |
$12,806 |
07/31/20 |
$13,123 |
$12,448 |
$13,148 |
08/31/20 |
$13,400 |
$12,348 |
$13,434 |
09/30/20 |
$13,227 |
$12,341 |
$13,258 |
10/31/20 |
$13,100 |
$12,286 |
$13,130 |
11/30/20 |
$13,746 |
$12,406 |
$13,789 |
12/31/20 |
$14,049 |
$12,424 |
$14,086 |
01/31/21 |
$14,014 |
$12,334 |
$14,068 |
02/28/21 |
$14,096 |
$12,156 |
$14,152 |
03/31/21 |
$14,225 |
$12,005 |
$14,266 |
04/30/21 |
$14,518 |
$12,099 |
$14,571 |
05/31/21 |
$14,635 |
$12,139 |
$14,688 |
06/30/21 |
$14,729 |
$12,224 |
$14,784 |
07/31/21 |
$14,893 |
$12,361 |
$14,948 |
08/31/21 |
$14,893 |
$12,337 |
$15,065 |
09/30/21 |
$14,623 |
$12,231 |
$14,797 |
10/31/21 |
$14,905 |
$12,227 |
$15,073 |
11/30/21 |
$14,764 |
$12,263 |
$14,941 |
12/31/21 |
$15,014 |
$12,232 |
$15,202 |
01/31/22 |
$14,602 |
$11,968 |
$14,767 |
02/28/22 |
$14,439 |
$11,835 |
$14,620 |
03/31/22 |
$14,377 |
$11,506 |
$14,569 |
04/30/22 |
$13,802 |
$11,069 |
$13,994 |
05/31/22 |
$13,839 |
$11,141 |
$14,002 |
06/30/22 |
$13,239 |
$10,966 |
$13,396 |
07/31/22 |
$13,814 |
$11,234 |
$13,972 |
08/31/22 |
$13,402 |
$10,917 |
$13,586 |
09/30/22 |
$12,627 |
$10,445 |
$12,791 |
10/31/22 |
$12,902 |
$10,310 |
$13,068 |
11/30/22 |
$13,452 |
$10,689 |
$13,581 |
12/31/22 |
$13,184 |
$10,641 |
$13,358 |
01/31/23 |
$13,723 |
$10,968 |
$13,888 |
02/28/23 |
$13,434 |
$10,684 |
$13,604 |
03/31/23 |
$13,710 |
$10,956 |
$13,872 |
04/30/23 |
$13,802 |
$11,022 |
$13,974 |
05/31/23 |
$13,644 |
$10,902 |
$13,822 |
06/30/23 |
$13,907 |
$10,863 |
$14,075 |
07/31/23 |
$14,118 |
$10,856 |
$14,298 |
08/31/23 |
$13,947 |
$10,786 |
$14,133 |
09/30/23 |
$13,618 |
$10,512 |
$13,799 |
10/31/23 |
$13,408 |
$10,346 |
$13,580 |
11/30/23 |
$14,078 |
$10,815 |
$14,267 |
12/31/23 |
$14,596 |
$11,229 |
$14,802 |
01/31/24 |
$14,582 |
$11,198 |
$14,793 |
02/29/24 |
$14,707 |
$11,040 |
$14,908 |
03/31/24 |
$14,928 |
$11,142 |
$15,148 |
04/30/24 |
$14,596 |
$10,860 |
$14,821 |
05/31/24 |
$14,942 |
$11,044 |
$15,143 |
06/30/24 |
$15,080 |
$11,149 |
$15,306 |
07/31/24 |
$15,398 |
$11,409 |
$15,621 |
08/31/24 |
$15,661 |
$11,573 |
$15,892 |
09/30/24 |
$15,910 |
$11,728 |
$16,146 |
10/31/24 |
$15,606 |
$11,437 |
$15,852 |
11/30/24 |
$15,896 |
$11,558 |
$16,130 |
12/31/24 |
$15,628 |
$11,369 |
$15,866 |
01/31/25 |
$15,876 |
$11,430 |
$16,121 |
02/28/25 |
$16,023 |
$11,681 |
$16,253 |
03/31/25 |
$15,862 |
$11,685 |
$16,084 |
04/30/25 |
$15,906 |
$11,731 |
$16,154 |
05/31/25 |
$16,154 |
$11,647 |
$16,402 |
06/30/25 |
$16,491 |
$11,826 |
$16,742 |
07/31/25 |
$16,535 |
$11,795 |
$16,801 |
08/31/25 |
$16,857 |
$11,936 |
$17,111 |
09/30/25 |
$17,091 |
$12,067 |
$17,346 |
10/31/25 |
$17,208 |
$12,142 |
$17,482 |
11/30/25 |
$17,325 |
$12,217 |
$17,581 |
12/31/25 |
$17,337 |
$12,199 |
$17,634 |
|
| Average Annual Return [Table Text Block] |
Name |
1 Year |
5 Years |
10 Years |
SSFNX |
10.94% |
4.29% |
5.66% |
Bloomberg U.S. Aggregate Bond Index |
7.30% |
(0.36%) |
2.01% |
State Street Target Retirement Composite Index |
11.14% |
4.60% |
5.84% | |
| Updated Performance Information Location [Text Block] |
Updated performance information is available by calling 1-800-647-7327 or visiting our website at www.ssga.com.
|
| AssetsNet |
$ 1,485,766,318
|
| Holdings Count | Holding |
12
|
| Advisory Fees Paid, Amount |
$ 0
|
| InvestmentCompanyPortfolioTurnover |
19.00%
|
| Additional Fund Statistics [Text Block] |
Key Fund Statistics as of 12/31/2025- Total Net Assets$1,485,766,318
- Number of Portfolio Holdings12
- Portfolio Turnover Rate19%
- Total Advisory Fees Paid$0
|
| Holdings [Text Block] |
Asset Types |
% |
Domestic Fixed Income |
50.4% |
Inflation Linked |
18.0% |
Domestic Equity |
16.3% |
International Equity |
10.1% |
Real Estate |
5.0% |
Short-Term Investments |
2.8% | |
| Largest Holdings [Text Block] |
Holdings |
% |
State Street Aggregate Bond Index Portfolio |
20.0% |
State Street SPDR Bloomberg 1-10 Year TIPS ETF |
18.0% |
State Street SPDR Portfolio Short Term Treasury ETF |
15.9% |
State Street Equity 500 Index II Portfolio |
14.7% |
State Street Global All Cap Equity ex-U.S. Index Portfolio |
10.1% |
State Street SPDR Bloomberg High Yield Bond ETF |
7.0% |
SPDR Dow Jones Global Real Estate ETF |
5.0% |
State Street SPDR Portfolio Short Term Corporate Bond ETF |
4.0% |
SPDR Bloomberg Enhanced Roll Yield Commodity Strategy No. K-1 ETF |
3.5% |
State Street Small/Mid Cap Equity Index Portfolio |
1.6% | |
| Material Fund Change [Text Block] |
|
| C000143857 |
|
| Shareholder Report [Line Items] |
|
| Fund Name |
State Street Target Retirement Fund
|
| Class Name |
Class K
|
| Trading Symbol |
SSFOX
|
| Annual or Semi-Annual Statement [Text Block] |
This annual shareholder report contains important information about the State Street Target Retirement Fund (the "Fund") for the period of January 1, 2025 through December 31, 2025.
|
| Additional Information [Text Block] |
You can find additional information about the Fund, including the Prospectus, Statement of Additional Information, financial statements and other information at www.ssga.com/us/en/institutional/fund-finder?tab=documents&type=mf. You can also request this information about the Fund by contacting us at 1-800-647-7327.
|
| Additional Information Phone Number |
1-800-647-7327
|
| Additional Information Website |
www.ssga.com/us/en/institutional/fund-finder?tab=documents&type=mf
|
| Expenses [Text Block] |
What were the Fund costs for the last year? (based on a hypothetical $10,000 Investment)
Class Name |
Costs of a $10,000 investment |
Costs paid as a percentage of a $10,000 investment |
Class K |
$0 |
0.00% | Due to the Fund waiving acquired fund fees, the waiver exceeded total fund expenses. Does not include expenses of the Underlying Funds in which the Fund invests. |
| Expenses Paid, Amount |
$ 0
|
| Expense Ratio, Percent |
0.00%
|
| Factors Affecting Performance [Text Block] |
How did the Fund perform last year and what affected its performance?The main driver of the Fund’s performance on an absolute basis during the reporting period was its position in the State Street Global Equity ex-US Index Portfolio which returned approximately 32.7% for the reporting period. On an individual security level, the top positive contributors to the Fund’s performance on an absolute basis during the reporting period were the State Street Global Equity ex-US Index Portfolio, the State Street Equity 500 Index II Portfolio, and the State Street Aggregate Bond Index Portfolio. There were no negative contributors to the Fund’s performance on an absolute basis during the reporting period. |
| Performance Past Does Not Indicate Future [Text] |
The Fund’s past performance is not necessarily an indication of how the Fund will perform in the future. The returns do not reflect the deduction of taxes that a shareholder would pay on Fund distributions or on the redemption or sale of Fund shares.
|
| Line Graph [Table Text Block] |
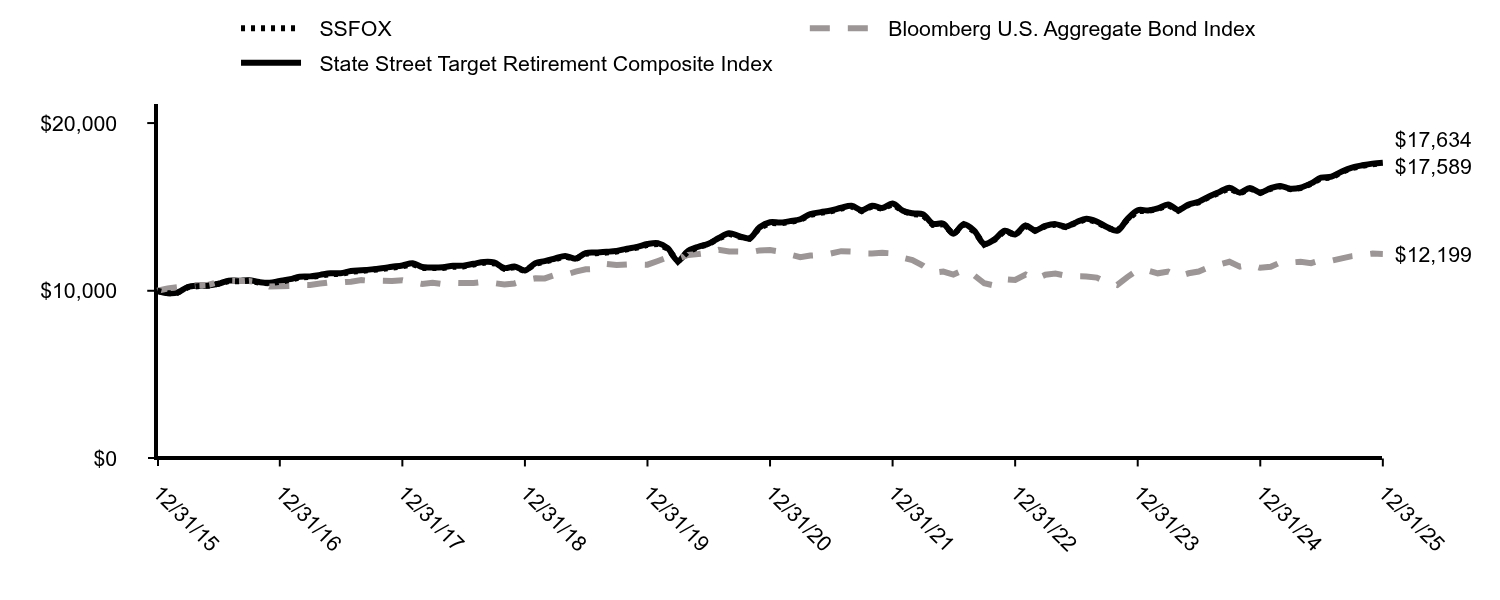
|
SSFOX |
Bloomberg U.S. Aggregate Bond Index |
State Street Target Retirement Composite Index |
12/31/15 |
$10,000 |
$10,000 |
$10,000 |
01/31/16 |
$9,847 |
$10,138 |
$9,859 |
02/29/16 |
$9,877 |
$10,210 |
$9,887 |
03/31/16 |
$10,204 |
$10,303 |
$10,224 |
04/30/16 |
$10,276 |
$10,343 |
$10,302 |
05/31/16 |
$10,297 |
$10,345 |
$10,314 |
06/30/16 |
$10,419 |
$10,531 |
$10,411 |
07/31/16 |
$10,573 |
$10,598 |
$10,606 |
08/31/16 |
$10,562 |
$10,586 |
$10,602 |
09/30/16 |
$10,603 |
$10,580 |
$10,631 |
10/31/16 |
$10,481 |
$10,499 |
$10,518 |
11/30/16 |
$10,440 |
$10,250 |
$10,475 |
12/31/16 |
$10,528 |
$10,265 |
$10,581 |
01/31/17 |
$10,653 |
$10,285 |
$10,692 |
02/28/17 |
$10,799 |
$10,354 |
$10,838 |
03/31/17 |
$10,819 |
$10,349 |
$10,858 |
04/30/17 |
$10,903 |
$10,428 |
$10,949 |
05/31/17 |
$10,996 |
$10,509 |
$11,041 |
06/30/17 |
$11,007 |
$10,498 |
$11,048 |
07/31/17 |
$11,132 |
$10,543 |
$11,176 |
08/31/17 |
$11,184 |
$10,638 |
$11,222 |
09/30/17 |
$11,236 |
$10,587 |
$11,276 |
10/31/17 |
$11,298 |
$10,593 |
$11,348 |
11/30/17 |
$11,382 |
$10,580 |
$11,430 |
12/31/17 |
$11,458 |
$10,628 |
$11,510 |
01/31/18 |
$11,586 |
$10,506 |
$11,641 |
02/28/18 |
$11,361 |
$10,406 |
$11,414 |
03/31/18 |
$11,351 |
$10,473 |
$11,392 |
04/30/18 |
$11,351 |
$10,395 |
$11,408 |
05/31/18 |
$11,436 |
$10,469 |
$11,486 |
06/30/18 |
$11,447 |
$10,456 |
$11,499 |
07/31/18 |
$11,565 |
$10,459 |
$11,611 |
08/31/18 |
$11,672 |
$10,526 |
$11,718 |
09/30/18 |
$11,640 |
$10,458 |
$11,687 |
10/31/18 |
$11,308 |
$10,376 |
$11,354 |
11/30/18 |
$11,404 |
$10,438 |
$11,450 |
12/31/18 |
$11,171 |
$10,630 |
$11,212 |
01/31/19 |
$11,618 |
$10,742 |
$11,644 |
02/28/19 |
$11,729 |
$10,736 |
$11,770 |
03/31/19 |
$11,886 |
$10,942 |
$11,926 |
04/30/19 |
$12,042 |
$10,945 |
$12,075 |
05/31/19 |
$11,886 |
$11,139 |
$11,918 |
06/30/19 |
$12,210 |
$11,279 |
$12,247 |
07/31/19 |
$12,243 |
$11,304 |
$12,282 |
08/31/19 |
$12,277 |
$11,597 |
$12,323 |
09/30/19 |
$12,344 |
$11,535 |
$12,379 |
10/31/19 |
$12,466 |
$11,570 |
$12,512 |
11/30/19 |
$12,578 |
$11,564 |
$12,616 |
12/31/19 |
$12,735 |
$11,556 |
$12,787 |
01/31/20 |
$12,793 |
$11,778 |
$12,843 |
02/29/20 |
$12,516 |
$11,990 |
$12,552 |
03/31/20 |
$11,742 |
$11,920 |
$11,789 |
04/30/20 |
$12,331 |
$12,132 |
$12,366 |
05/31/20 |
$12,608 |
$12,188 |
$12,627 |
06/30/20 |
$12,781 |
$12,265 |
$12,806 |
07/31/20 |
$13,116 |
$12,448 |
$13,148 |
08/31/20 |
$13,393 |
$12,348 |
$13,434 |
09/30/20 |
$13,220 |
$12,341 |
$13,258 |
10/31/20 |
$13,104 |
$12,286 |
$13,130 |
11/30/20 |
$13,751 |
$12,406 |
$13,789 |
12/31/20 |
$14,045 |
$12,424 |
$14,086 |
01/31/21 |
$14,022 |
$12,334 |
$14,068 |
02/28/21 |
$14,104 |
$12,156 |
$14,152 |
03/31/21 |
$14,221 |
$12,005 |
$14,266 |
04/30/21 |
$14,526 |
$12,099 |
$14,571 |
05/31/21 |
$14,643 |
$12,139 |
$14,688 |
06/30/21 |
$14,737 |
$12,224 |
$14,784 |
07/31/21 |
$14,902 |
$12,361 |
$14,948 |
08/31/21 |
$15,019 |
$12,337 |
$15,065 |
09/30/21 |
$14,749 |
$12,231 |
$14,797 |
10/31/21 |
$15,031 |
$12,227 |
$15,073 |
11/30/21 |
$14,890 |
$12,263 |
$14,941 |
12/31/21 |
$15,157 |
$12,232 |
$15,202 |
01/31/22 |
$14,743 |
$11,968 |
$14,767 |
02/28/22 |
$14,580 |
$11,835 |
$14,620 |
03/31/22 |
$14,517 |
$11,506 |
$14,569 |
04/30/22 |
$13,927 |
$11,069 |
$13,994 |
05/31/22 |
$13,965 |
$11,141 |
$14,002 |
06/30/22 |
$13,363 |
$10,966 |
$13,396 |
07/31/22 |
$13,953 |
$11,234 |
$13,972 |
08/31/22 |
$13,538 |
$10,917 |
$13,586 |
09/30/22 |
$12,748 |
$10,445 |
$12,791 |
10/31/22 |
$13,037 |
$10,310 |
$13,068 |
11/30/22 |
$13,576 |
$10,689 |
$13,581 |
12/31/22 |
$13,321 |
$10,641 |
$13,358 |
01/31/23 |
$13,863 |
$10,968 |
$13,888 |
02/28/23 |
$13,572 |
$10,684 |
$13,604 |
03/31/23 |
$13,849 |
$10,956 |
$13,872 |
04/30/23 |
$13,942 |
$11,022 |
$13,974 |
05/31/23 |
$13,797 |
$10,902 |
$13,822 |
06/30/23 |
$14,047 |
$10,863 |
$14,075 |
07/31/23 |
$14,272 |
$10,856 |
$14,298 |
08/31/23 |
$14,100 |
$10,786 |
$14,133 |
09/30/23 |
$13,770 |
$10,512 |
$13,799 |
10/31/23 |
$13,559 |
$10,346 |
$13,580 |
11/30/23 |
$14,232 |
$10,815 |
$14,267 |
12/31/23 |
$14,756 |
$11,229 |
$14,802 |
01/31/24 |
$14,756 |
$11,198 |
$14,793 |
02/29/24 |
$14,881 |
$11,040 |
$14,908 |
03/31/24 |
$15,104 |
$11,142 |
$15,148 |
04/30/24 |
$14,770 |
$10,860 |
$14,821 |
05/31/24 |
$15,118 |
$11,044 |
$15,143 |
06/30/24 |
$15,270 |
$11,149 |
$15,306 |
07/31/24 |
$15,590 |
$11,409 |
$15,621 |
08/31/24 |
$15,855 |
$11,573 |
$15,892 |
09/30/24 |
$16,105 |
$11,728 |
$16,146 |
10/31/24 |
$15,799 |
$11,437 |
$15,852 |
11/30/24 |
$16,105 |
$11,558 |
$16,130 |
12/31/24 |
$15,828 |
$11,369 |
$15,866 |
01/31/25 |
$16,078 |
$11,430 |
$16,121 |
02/28/25 |
$16,225 |
$11,681 |
$16,253 |
03/31/25 |
$16,063 |
$11,685 |
$16,084 |
04/30/25 |
$16,122 |
$11,731 |
$16,154 |
05/31/25 |
$16,373 |
$11,647 |
$16,402 |
06/30/25 |
$16,711 |
$11,826 |
$16,742 |
07/31/25 |
$16,755 |
$11,795 |
$16,801 |
08/31/25 |
$17,079 |
$11,936 |
$17,111 |
09/30/25 |
$17,315 |
$12,067 |
$17,346 |
10/31/25 |
$17,447 |
$12,142 |
$17,482 |
11/30/25 |
$17,550 |
$12,217 |
$17,581 |
12/31/25 |
$17,589 |
$12,199 |
$17,634 |
|
| Average Annual Return [Table Text Block] |
Name |
1 Year |
5 Years |
10 Years |
SSFOX |
11.13% |
4.60% |
5.81% |
Bloomberg U.S. Aggregate Bond Index |
7.30% |
(0.36%) |
2.01% |
State Street Target Retirement Composite Index |
11.14% |
4.60% |
5.84% | |
| Updated Performance Information Location [Text Block] |
Updated performance information is available by calling 1-800-647-7327 or visiting our website at www.ssga.com.
|
| AssetsNet |
$ 1,485,766,318
|
| Holdings Count | Holding |
12
|
| Advisory Fees Paid, Amount |
$ 0
|
| InvestmentCompanyPortfolioTurnover |
19.00%
|
| Additional Fund Statistics [Text Block] |
Key Fund Statistics as of 12/31/2025- Total Net Assets$1,485,766,318
- Number of Portfolio Holdings12
- Portfolio Turnover Rate19%
- Total Advisory Fees Paid$0
|
| Holdings [Text Block] |
Asset Types |
% |
Domestic Fixed Income |
50.4% |
Inflation Linked |
18.0% |
Domestic Equity |
16.3% |
International Equity |
10.1% |
Real Estate |
5.0% |
Short-Term Investments |
2.8% | |
| Largest Holdings [Text Block] |
Holdings |
% |
State Street Aggregate Bond Index Portfolio |
20.0% |
State Street SPDR Bloomberg 1-10 Year TIPS ETF |
18.0% |
State Street SPDR Portfolio Short Term Treasury ETF |
15.9% |
State Street Equity 500 Index II Portfolio |
14.7% |
State Street Global All Cap Equity ex-U.S. Index Portfolio |
10.1% |
State Street SPDR Bloomberg High Yield Bond ETF |
7.0% |
SPDR Dow Jones Global Real Estate ETF |
5.0% |
State Street SPDR Portfolio Short Term Corporate Bond ETF |
4.0% |
SPDR Bloomberg Enhanced Roll Yield Commodity Strategy No. K-1 ETF |
3.5% |
State Street Small/Mid Cap Equity Index Portfolio |
1.6% | |
| Material Fund Change [Text Block] |
|
| C000192374 |
|
| Shareholder Report [Line Items] |
|
| Fund Name |
State Street Treasury Obligations Money Market Fund
|
| Trading Symbol |
TAQXX
|
| Annual or Semi-Annual Statement [Text Block] |
This annual shareholder report contains important information about the State Street Treasury Obligations Money Market Fund (the "Fund") for the period of January 1, 2025 through December 31, 2025.
|
| Additional Information [Text Block] |
You can request additional information about the Fund, including the Prospectus, Statement of Additional Information, financial statements and other information by contacting us at 1-866-392-0869.
|
| Additional Information Phone Number |
1-866-392-0869
|
| Expenses [Text Block] |
What were the Fund costs for the last year? (based on a hypothetical $10,000 Investment)
Fund Name |
Costs of a $10,000 investment |
Costs paid as a percentage of a $10,000 investment |
State Street Treasury Obligations Money Market Fund |
$8 |
0.08% | The expense table reflects the proportionate share of expenses allocated to the Fund by the affiliated Portfolio, in which the Fund invests. |
| Expenses Paid, Amount |
$ 8
|
| Expense Ratio, Percent |
0.08%
|
| Expenses Represent Both Master and Feeder [Text] |
The expense table reflects the proportionate share of expenses allocated to the Fund by the affiliated Portfolio, in which the Fund invests.
|
| AssetsNet |
$ 6,378,123,847
|
| Holdings Count | Holding |
105
|
| Advisory Fees Paid, Amount |
$ 0
|
| Additional Fund Statistics [Text Block] |
Key Fund Statistics as of 12/31/2025- Total Net Assets$6,378,123,847
- Number of Portfolio Holdings105
- Total Advisory Fees Paid$0
Reflects holdings of the Portfolio, in which the Fund invests. Advisory fees are paid by the Portfolio, in which the Fund invests. |
| Holdings [Text Block] |
Assets |
% |
Treasury Debt |
56.0% |
Treasury Repurchase Agreements |
37.6% | |
| Largest Holdings [Text Block] |
Holdings |
% |
FICCBA TRI PARTY REPO A, 3.83%, due 01/02/26 |
7.1% |
JP MORGAN SEC LLC TPR A, 3.82%, due 01/02/26 |
6.3% |
FICCMS TRI PARTY REPO A, 3.85%, due 01/02/26 |
4.1% |
FICCJP TRI PARTY REPO A, 3.82%, due 01/02/26 |
3.9% |
U.S. Treasury Bills, 4.10%, due 01/02/26 |
3.7% |
FICCUB BI PARTY REPO, 3.85%, due 01/02/26 |
2.9% |
U.S. Treasury Floating Rate Notes, 3.70%, due 01/31/27 |
2.8% |
U.S. Treasury Floating Rate Notes, 3.81%, due 10/31/26 |
2.6% |
U.S. Treasury Floating Rate Notes, 3.78%, due 07/31/26 |
2.3% |
U.S. Treasury Bills, 4.15%, due 01/08/26 |
2.2% | |