Shareholder Report
|
12 Months Ended |
|
Dec. 31, 2025
USD ($)
Holding
|
|---|
| Shareholder Report [Line Items] |
|
| Document Type |
N-CSR
|
| Amendment Flag |
false
|
| Registrant Name |
VanEck ETF Trust
|
| Entity Central Index Key |
0001137360
|
| Entity Investment Company Type |
N-1A
|
| Document Period End Date |
Dec. 31, 2025
|
| C000253738 |
|
| Shareholder Report [Line Items] |
|
| Fund Name |
VanEck AA-BB CLO ETF
|
| Class Name |
VanEck AA-BB CLO ETF
|
| Trading Symbol |
CLOB
|
| Security Exchange Name |
NYSEArca
|
| Annual or Semi-Annual Statement [Text Block] |
This annual shareholder report contains important information about the VanEck AA-BB CLO ETF (the "Fund") for the period January 1, 2025 to December 31, 2025.
|
| Shareholder Report Annual or Semi-Annual |
Annual Shareholder Report
|
| Additional Information [Text Block] |
You can find additional information about the Fund at https://www.vaneck.com/us/en/etf-mutual-fund-finder/etfs/documents/. You can also request this information by contacting us at 800.826.2333 or info@vaneck.com.
|
| Additional Information Phone Number |
800.826.2333
|
| Additional Information Email |
<span style="box-sizing: border-box; color: rgb(0, 0, 0); display: inline; flex-wrap: nowrap; font-size: 10.6667px; font-weight: 400; grid-area: auto; line-height: 16px; margin: 0px; overflow: visible; text-align: left; text-align-last: auto; white-space-collapse: preserve-breaks;">info@vaneck.com</span>
|
| Additional Information Website |
<span style="box-sizing: border-box; color: rgb(0, 0, 0); display: inline; flex-wrap: nowrap; font-size: 10.6667px; font-weight: 400; grid-area: auto; line-height: 16px; margin: 0px; overflow: visible; text-align: left; text-align-last: auto; white-space-collapse: preserve-breaks;">https://www.vaneck.com/us/en/etf-mutual-fund-finder/etfs/documents/</span>
|
| Expenses [Text Block] |
What were the Fund costs for the last year?(based on a hypothetical $10,000 investment) Fund Name | Costs of a $10,000 investment | Costs paid as a % of a $10,000 investment |
|---|
VanEck AA-BB CLO ETF | $47 | 0.45% |
|---|
|
| Expenses Paid, Amount |
$ 47
|
| Expense Ratio, Percent |
0.45%
|
| Factors Affecting Performance [Text Block] |
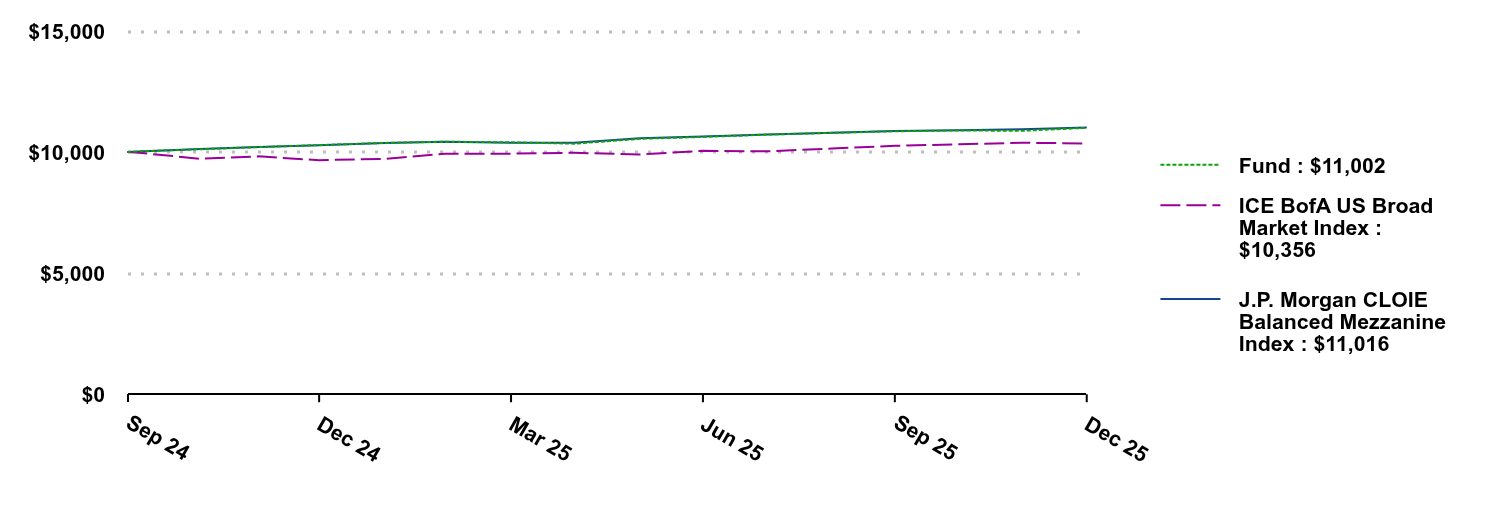
How did the Fund perform last year?Strong collateralized loan obligation total returns were driven by high interest rates, even as the Federal Reserve restarted its easing cycle in September, and benefited from spread tightening. The Fund slightly underperformed its benchmark, the J.P. Morgan CLO Balanced Mezzanine Index, and most of the underperformance occurred in April. The Fund largely made up for this underperformance through the rest of the period. Single-A rated CLOs contributed positively to returns relative to the benchmark, while AA, BBB and BB rated CLOs detracted from relative performance.
|
| Performance Past Does Not Indicate Future [Text] |
The performance data quoted represents past performance. Past performance is no guarantee of future results.
|
| Line Graph [Table Text Block] |
| Fund | ICE BofA US Broad Market Index | J.P. Morgan CLOIE Balanced Mezzanine Index |
|---|
Sep 24 | $10,000 | $10,000 | $10,000 |
|---|
Sep 24 | $10,031 | $9,970 | $10,025 |
|---|
Oct 24 | $10,116 | $9,726 | $10,123 |
|---|
Nov 24 | $10,205 | $9,824 | $10,205 |
|---|
Dec 24 | $10,288 | $9,665 | $10,285 |
|---|
Jan 25 | $10,379 | $9,721 | $10,376 |
|---|
Feb 25 | $10,428 | $9,931 | $10,427 |
|---|
Mar 25 | $10,404 | $9,935 | $10,390 |
|---|
Apr 25 | $10,346 | $9,971 | $10,385 |
|---|
May 25 | $10,549 | $9,900 | $10,566 |
|---|
Jun 25 | $10,625 | $10,051 | $10,638 |
|---|
Jul 25 | $10,722 | $10,030 | $10,724 |
|---|
Aug 25 | $10,793 | $10,148 | $10,796 |
|---|
Sep 25 | $10,860 | $10,258 | $10,870 |
|---|
Oct 25 | $10,893 | $10,323 | $10,904 |
|---|
Nov 25 | $10,878 | $10,386 | $10,938 |
|---|
Dec 25 | $11,002 | $10,356 | $11,016 |
|---|
|
| Average Annual Return [Table Text Block] |
Average Annual Total Returns . | 1 Year | Life* |
|---|
VanEck AA-BB CLO ETF | 6.94% | 7.82% |
|---|
J.P. Morgan CLOIE Balanced Mezzanine Index | 7.10% | 7.92% |
|---|
ICE BofA US Broad Market Index | 7.15% | 2.80% |
|---|
* Inception of Fund: 09/24/2024. The performance data quoted represents past performance. Past performance is no guarantee of future results. Performance information for the Fund may reflect temporary fee waivers, if applicable. These returns do not reflect the deduction of taxes that a shareholder would pay on Fund dividends and distributions or the sale of Fund shares. Visit vaneck.com for more recent performance information. |
| Performance Inception Date |
Sep. 24, 2024
|
| No Deduction of Taxes [Text Block] |
|
| Performance Table Market Index Changed [Text Block] |
|
| Material Change Description [Text Block] |
|
| Updated Performance Information Location [Text Block] |
|
| AssetsNet |
$ 151,981,350
|
| Holdings Count | Holding |
50
|
| Advisory Fees Paid, Amount |
$ 505,803
|
| InvestmentCompanyPortfolioTurnover |
47.00%
|
| Additional Fund Statistics [Text Block] |
- Total Net Assets$151,981,350
- Number of Portfolio Holdings50
- Portfolio Turnover Rate47%
- Advisory Fees Paid$505,803
|
| Additional Fund Statistics Significance or Limits [Text Block] |
|
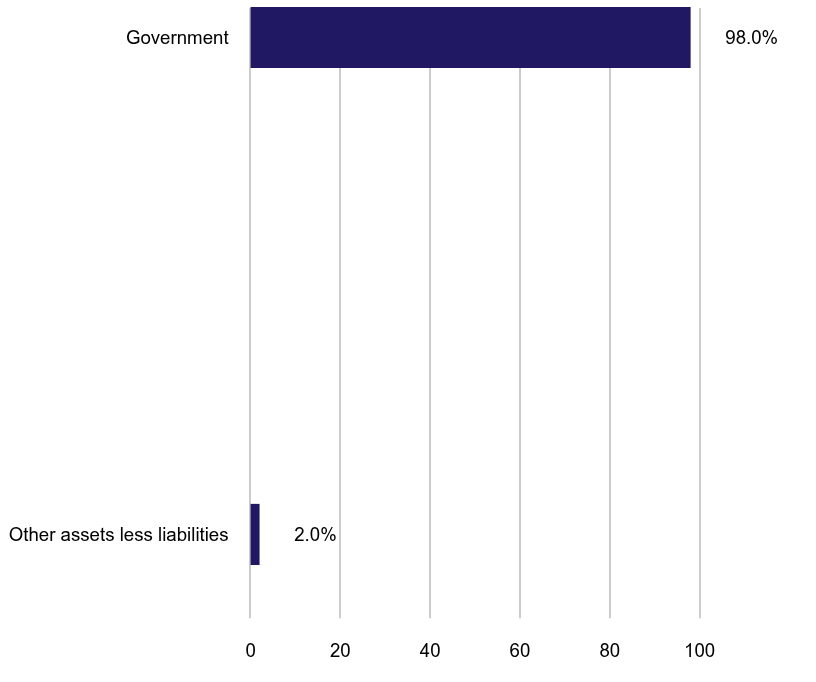
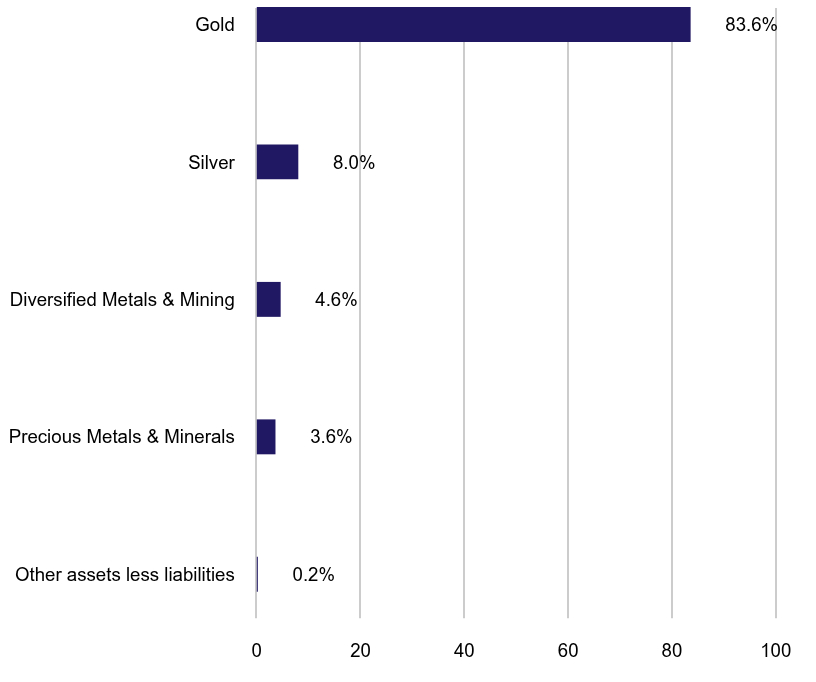
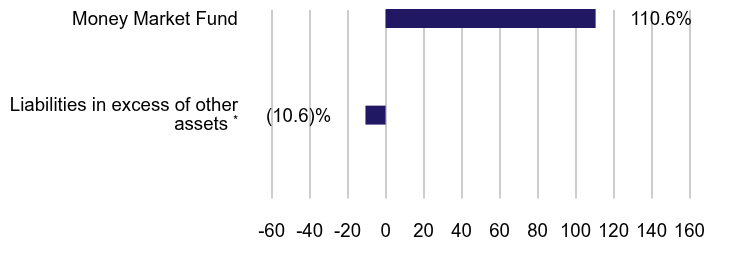
| Holdings [Text Block] |
Portfolio Composition (% of Total Net Assets)Value | Value | Value |
|---|
Other assets less liabilities | | 1.4% | Government | | 4.6% | Collateralized Loan Obligations | | 94.0% |
|
| Largest Holdings [Text Block] |
Top Ten Holdings Footnote Reference* (% of Total Net Assets)Octagon 64 Ltd., 5.57%, 7/21/2037 | | 6.6% |
|---|
Rockford Tower CLO 2022-1 Ltd., 5.58%, 7/20/2035 | | 4.6% |
|---|
Dryden 95 CLO Ltd., 6.94%, 8/20/2034 | | 4.6% |
|---|
Rockford Tower CLO 2021-2 Ltd., 5.58%, 7/20/2034 | | 4.3% |
|---|
Capital Four US CLO III Ltd., 6.07%, 4/21/2038 | | 3.3% |
|---|
Signal Peak CLO 4 Ltd., 5.51%, 10/26/2034 | | 3.3% |
|---|
Brant Point CLO 2025-8 Ltd., 5.66%, 3/31/2038 | | 3.3% |
|---|
KKR CLO 36 Ltd., 5.65%, 10/15/2034 | | 3.3% |
|---|
Neuberger Berman Loan Advisers CLO 38 Ltd., 5.28%, 10/20/2036 | | 3.3% |
|---|
Sound Point CLO XXIX Ltd., 5.50%, 4/25/2034 | | 3.3% |
|---|
| Footnote | Description | Footnote* | Excludes short-term investments |
|
| Material Fund Change [Text Block] |
|
| Summary of Change Legend [Text Block] |
|
| Updated Prospectus Web Address |
<span style="box-sizing: border-box; color: rgb(0, 0, 0); display: inline; flex-wrap: nowrap; font-size: 10.6667px; font-weight: 400; grid-area: auto; line-height: 16px; margin: 0px; overflow: visible; text-align: left; text-align-last: auto; white-space-collapse: preserve-breaks;">https://www.vaneck.com/us/en/etf-mutual-fund-finder/etfs/documents/</span>
|
| Accountant Change Statement [Text Block] |
|
| Accountant Change Disagreements [Text Block] |
|
| C000066393 |
|
| Shareholder Report [Line Items] |
|
| Fund Name |
VanEck Africa Index ETF
|
| Class Name |
VanEck Africa Index ETF
|
| Trading Symbol |
AFK
|
| Security Exchange Name |
NYSEArca
|
| Annual or Semi-Annual Statement [Text Block] |
This annual shareholder report contains important information about the VanEck Africa Index ETF (the "Fund") for the period January 1, 2025 to December 31, 2025.
|
| Shareholder Report Annual or Semi-Annual |
Annual Shareholder Report
|
| Additional Information [Text Block] |
You can find additional information about the Fund at https://www.vaneck.com/us/en/etf-mutual-fund-finder/etfs/documents/. You can also request this information by contacting us at 800.826.2333 or info@vaneck.com.
|
| Material Fund Change Notice [Text Block] |
This report describes material changes to the Fund that occurred during the reporting period.
|
| Additional Information Phone Number |
800.826.2333
|
| Additional Information Email |
<span style="box-sizing: border-box; color: rgb(0, 0, 0); display: inline; flex-wrap: nowrap; font-size: 10.6667px; font-weight: 400; grid-area: auto; line-height: 16px; margin: 0px; overflow: visible; text-align: left; text-align-last: auto; white-space-collapse: preserve-breaks;">info@vaneck.com</span>
|
| Additional Information Website |
<span style="box-sizing: border-box; color: rgb(0, 0, 0); display: inline; flex-wrap: nowrap; font-size: 10.6667px; font-weight: 400; grid-area: auto; line-height: 16px; margin: 0px; overflow: visible; text-align: left; text-align-last: auto; white-space-collapse: preserve-breaks;">https://www.vaneck.com/us/en/etf-mutual-fund-finder/etfs/documents/</span>
|
| Expenses [Text Block] |
What were the Fund costs for the last year?(based on a hypothetical $10,000 investment) Fund Name | Costs of a $10,000 investment | Costs paid as a % of a $10,000 investment |
|---|
VanEck Africa Index ETF | $101 | 0.76% |
|---|
|
| Expenses Paid, Amount |
$ 101
|
| Expense Ratio, Percent |
0.76%
|
| Factors Affecting Performance [Text Block] |
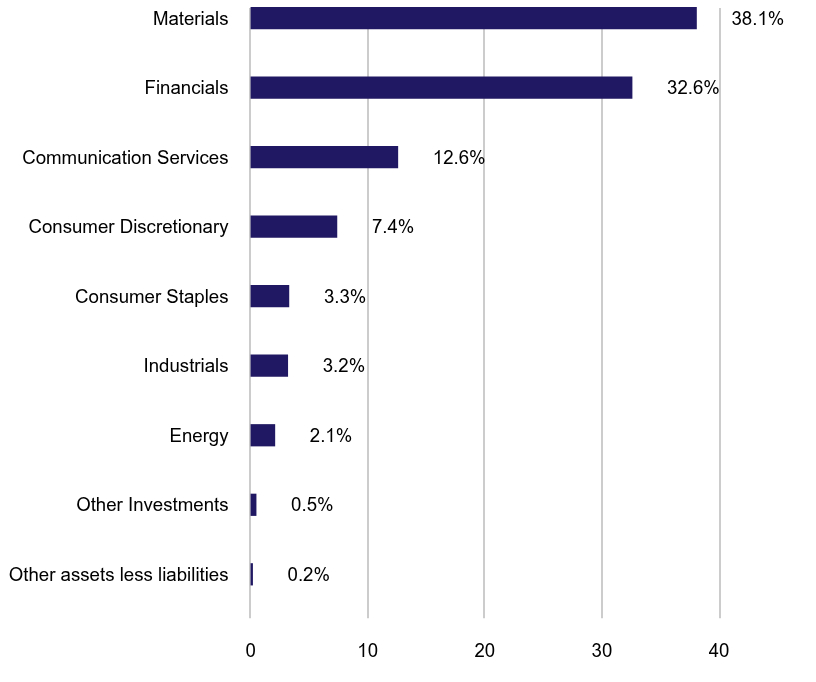
How did the Fund perform last year?The Fund posted a positive return over the period as improving economic growth, firm commodity prices and increased investor interest contributed to broader regional equity gains. From a country of risk perspective, South Africa contributed the most to the Fund’s performance during the period, followed by the United Kingdom and Morocco. India was the only detractor during the period. In terms of sectors, the Materials sector contributed the most to the Fund’s performance during the period, followed by Financials and Communication Services. The Energy sector detracted the most from the Fund’s performance during the period, followed by Health Care. The leading individual contributors to performance were Airtel Africa Plc, Barrick Mining Corporation and Anglogold Ashanti PLC. The leading individual detractors to performance were Kosmos Energy Ltd., MakeMyTrip Ltd. and Ivanhoe Mines Ltd. Class A.
|
| Performance Past Does Not Indicate Future [Text] |
The performance data quoted represents past performance. Past performance is no guarantee of future results.
|
| Line Graph [Table Text Block] |
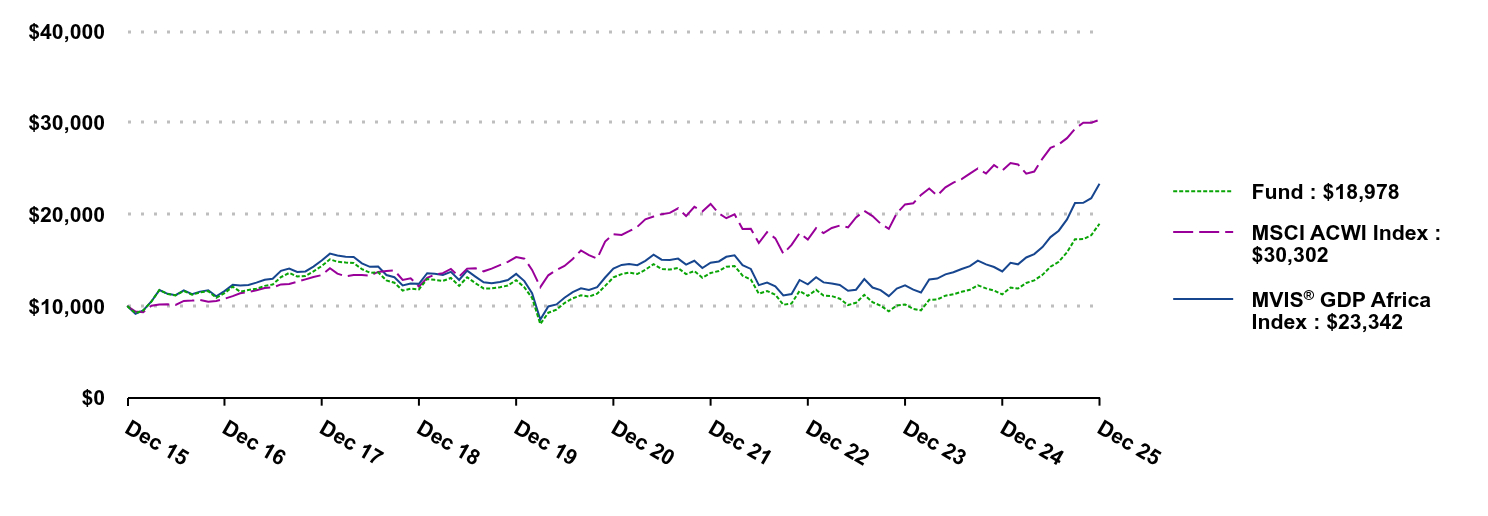 | Fund | MSCI ACWI Index | MVIS® GDP Africa Index |
|---|
Dec 15 | $10,000 | $10,000 | $10,000 |
|---|
Jan 16 | $9,216 | $9,397 | $9,148 |
|---|
Feb 16 | $9,503 | $9,332 | $9,509 |
|---|
Mar 16 | $10,491 | $10,024 | $10,496 |
|---|
Apr 16 | $11,745 | $10,172 | $11,738 |
|---|
May 16 | $11,309 | $10,185 | $11,326 |
|---|
Jun 16 | $11,165 | $10,123 | $11,179 |
|---|
Jul 16 | $11,645 | $10,559 | $11,712 |
|---|
Aug 16 | $11,231 | $10,595 | $11,292 |
|---|
Sep 16 | $11,491 | $10,660 | $11,572 |
|---|
Oct 16 | $11,623 | $10,479 | $11,719 |
|---|
Nov 16 | $10,889 | $10,558 | $11,060 |
|---|
Dec 16 | $11,394 | $10,786 | $11,630 |
|---|
Jan 17 | $12,114 | $11,081 | $12,310 |
|---|
Feb 17 | $11,564 | $11,392 | $12,240 |
|---|
Mar 17 | $11,751 | $11,532 | $12,291 |
|---|
Apr 17 | $11,881 | $11,711 | $12,553 |
|---|
May 17 | $12,199 | $11,970 | $12,858 |
|---|
Jun 17 | $12,352 | $12,024 | $12,971 |
|---|
Jul 17 | $13,146 | $12,360 | $13,840 |
|---|
Aug 17 | $13,611 | $12,408 | $14,085 |
|---|
Sep 17 | $13,220 | $12,647 | $13,708 |
|---|
Oct 17 | $13,276 | $12,910 | $13,774 |
|---|
Nov 17 | $13,770 | $13,160 | $14,302 |
|---|
Dec 17 | $14,358 | $13,372 | $14,964 |
|---|
Jan 18 | $15,093 | $14,127 | $15,715 |
|---|
Feb 18 | $14,827 | $13,533 | $15,506 |
|---|
Mar 18 | $14,746 | $13,244 | $15,384 |
|---|
Apr 18 | $14,688 | $13,370 | $15,341 |
|---|
May 18 | $14,022 | $13,387 | $14,648 |
|---|
Jun 18 | $13,634 | $13,314 | $14,272 |
|---|
Jul 18 | $13,669 | $13,716 | $14,307 |
|---|
Aug 18 | $12,790 | $13,824 | $13,379 |
|---|
Sep 18 | $12,541 | $13,884 | $13,146 |
|---|
Oct 18 | $11,684 | $12,843 | $12,251 |
|---|
Nov 18 | $11,893 | $13,031 | $12,458 |
|---|
Dec 18 | $11,817 | $12,113 | $12,416 |
|---|
Jan 19 | $12,952 | $13,070 | $13,578 |
|---|
Feb 19 | $12,858 | $13,419 | $13,518 |
|---|
Mar 19 | $12,740 | $13,588 | $13,390 |
|---|
Apr 19 | $13,058 | $14,047 | $13,724 |
|---|
May 19 | $12,193 | $13,214 | $12,843 |
|---|
Jun 19 | $13,141 | $14,079 | $13,856 |
|---|
Jul 19 | $12,494 | $14,120 | $13,210 |
|---|
Aug 19 | $11,919 | $13,785 | $12,584 |
|---|
Sep 19 | $11,922 | $14,075 | $12,486 |
|---|
Oct 19 | $12,052 | $14,460 | $12,629 |
|---|
Nov 19 | $12,230 | $14,813 | $12,830 |
|---|
Dec 19 | $12,823 | $15,335 | $13,504 |
|---|
Jan 20 | $12,035 | $15,166 | $12,716 |
|---|
Feb 20 | $10,886 | $13,941 | $11,407 |
|---|
Mar 20 | $8,036 | $12,059 | $8,519 |
|---|
Apr 20 | $9,270 | $13,350 | $9,951 |
|---|
May 20 | $9,602 | $13,931 | $10,174 |
|---|
Jun 20 | $10,328 | $14,376 | $10,899 |
|---|
Jul 20 | $10,839 | $15,137 | $11,522 |
|---|
Aug 20 | $11,172 | $16,063 | $11,927 |
|---|
Sep 20 | $11,031 | $15,545 | $11,755 |
|---|
Oct 20 | $11,338 | $15,167 | $12,062 |
|---|
Nov 20 | $12,192 | $17,037 | $13,107 |
|---|
Dec 20 | $13,117 | $17,828 | $14,072 |
|---|
Jan 21 | $13,482 | $17,747 | $14,480 |
|---|
Feb 21 | $13,651 | $18,158 | $14,576 |
|---|
Mar 21 | $13,491 | $18,643 | $14,459 |
|---|
Apr 21 | $13,950 | $19,458 | $14,934 |
|---|
May 21 | $14,573 | $19,761 | $15,598 |
|---|
Jun 21 | $14,026 | $20,021 | $15,051 |
|---|
Jul 21 | $13,973 | $20,159 | $15,012 |
|---|
Aug 21 | $14,150 | $20,664 | $15,173 |
|---|
Sep 21 | $13,475 | $19,810 | $14,515 |
|---|
Oct 21 | $13,815 | $20,821 | $14,932 |
|---|
Nov 21 | $13,082 | $20,320 | $14,139 |
|---|
Dec 21 | $13,601 | $21,133 | $14,724 |
|---|
Jan 22 | $13,824 | $20,095 | $14,860 |
|---|
Feb 22 | $14,278 | $19,576 | $15,366 |
|---|
Mar 22 | $14,363 | $20,000 | $15,532 |
|---|
Apr 22 | $13,317 | $18,399 | $14,460 |
|---|
May 22 | $12,895 | $18,420 | $14,044 |
|---|
Jun 22 | $11,347 | $16,868 | $12,281 |
|---|
Jul 22 | $11,634 | $18,046 | $12,556 |
|---|
Aug 22 | $11,236 | $17,381 | $12,159 |
|---|
Sep 22 | $10,136 | $15,717 | $11,152 |
|---|
Oct 22 | $10,283 | $16,666 | $11,309 |
|---|
Nov 22 | $11,645 | $17,958 | $12,839 |
|---|
Dec 22 | $11,106 | $17,252 | $12,369 |
|---|
Jan 23 | $11,767 | $18,488 | $13,138 |
|---|
Feb 23 | $11,139 | $17,958 | $12,578 |
|---|
Mar 23 | $11,080 | $18,512 | $12,449 |
|---|
Apr 23 | $10,799 | $18,778 | $12,304 |
|---|
May 23 | $10,107 | $18,577 | $11,665 |
|---|
Jun 23 | $10,351 | $19,656 | $11,778 |
|---|
Jul 23 | $11,216 | $20,375 | $12,944 |
|---|
Aug 23 | $10,412 | $19,806 | $12,016 |
|---|
Sep 23 | $10,044 | $18,987 | $11,738 |
|---|
Oct 23 | $9,424 | $18,416 | $11,073 |
|---|
Nov 23 | $10,055 | $20,116 | $11,907 |
|---|
Dec 23 | $10,169 | $21,082 | $12,250 |
|---|
Jan 24 | $9,688 | $21,206 | $11,780 |
|---|
Feb 24 | $9,528 | $22,116 | $11,483 |
|---|
Mar 24 | $10,672 | $22,810 | $12,887 |
|---|
Apr 24 | $10,711 | $22,057 | $12,998 |
|---|
May 24 | $11,129 | $22,953 | $13,454 |
|---|
Jun 24 | $11,275 | $23,464 | $13,680 |
|---|
Jul 24 | $11,553 | $23,843 | $14,036 |
|---|
Aug 24 | $11,780 | $24,448 | $14,344 |
|---|
Sep 24 | $12,253 | $25,016 | $14,954 |
|---|
Oct 24 | $11,924 | $24,455 | $14,547 |
|---|
Nov 24 | $11,688 | $25,369 | $14,252 |
|---|
Dec 24 | $11,263 | $24,769 | $13,766 |
|---|
Jan 25 | $12,012 | $25,600 | $14,713 |
|---|
Feb 25 | $11,909 | $25,446 | $14,550 |
|---|
Mar 25 | $12,517 | $24,441 | $15,296 |
|---|
Apr 25 | $12,792 | $24,669 | $15,661 |
|---|
May 25 | $13,401 | $26,087 | $16,429 |
|---|
Jun 25 | $14,289 | $27,258 | $17,519 |
|---|
Jul 25 | $14,823 | $27,628 | $18,216 |
|---|
Aug 25 | $15,851 | $28,310 | $19,443 |
|---|
Sep 25 | $17,294 | $29,336 | $21,234 |
|---|
Oct 25 | $17,297 | $29,992 | $21,257 |
|---|
Nov 25 | $17,722 | $29,989 | $21,764 |
|---|
Dec 25 | $18,978 | $30,302 | $23,342 |
|---|
|
| Average Annual Return [Table Text Block] |
Average Annual Total Returns . | 1 Year | 5 Years | 10 Years |
|---|
VanEck Africa Index ETF | 68.50% | 7.67% | 6.62% |
|---|
MVIS® GDP Africa Index | 69.57% | 10.65% | 8.85% |
|---|
MSCI ACWI Index | 22.34% | 11.19% | 11.72% |
|---|
The performance data quoted represents past performance. Past performance is no guarantee of future results. Performance information for the Fund may reflect temporary fee waivers, if applicable. These returns do not reflect the deduction of taxes that a shareholder would pay on Fund dividends and distributions or the sale of Fund shares. Visit vaneck.com for more recent performance information. |
| No Deduction of Taxes [Text Block] |
|
| Performance Table Market Index Changed [Text Block] |
|
| Material Change Description [Text Block] |
|
| Material Change Date |
Dec. 31, 2025
|
| Updated Performance Information Location [Text Block] |
|
| AssetsNet |
$ 107,286,040
|
| Holdings Count | Holding |
71
|
| Advisory Fees Paid, Amount |
$ 308,288
|
| InvestmentCompanyPortfolioTurnover |
36.00%
|
| Additional Fund Statistics [Text Block] |
- Total Net Assets$107,286,040
- Number of Portfolio Holdings71
- Portfolio Turnover Rate36%
- Advisory Fees Paid$308,288
|
| Additional Fund Statistics Significance or Limits [Text Block] |
|
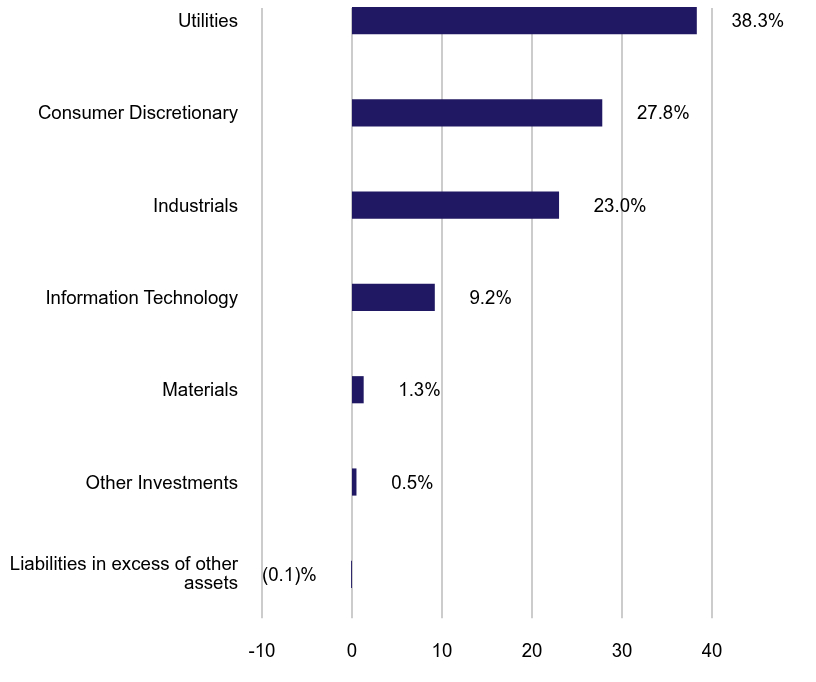
| Holdings [Text Block] |
Portfolio Composition (% of Total Net Assets)Value | Value | Value |
|---|
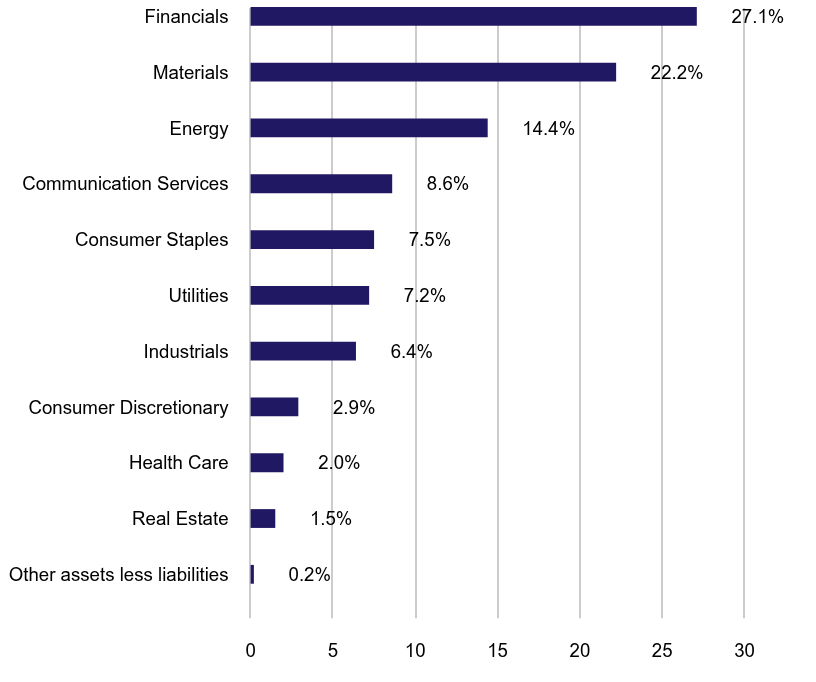
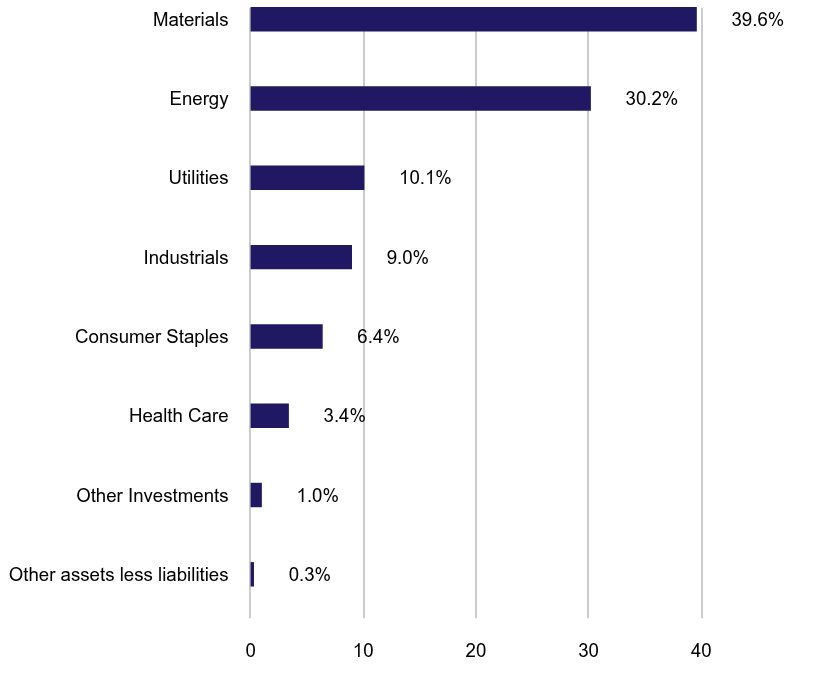
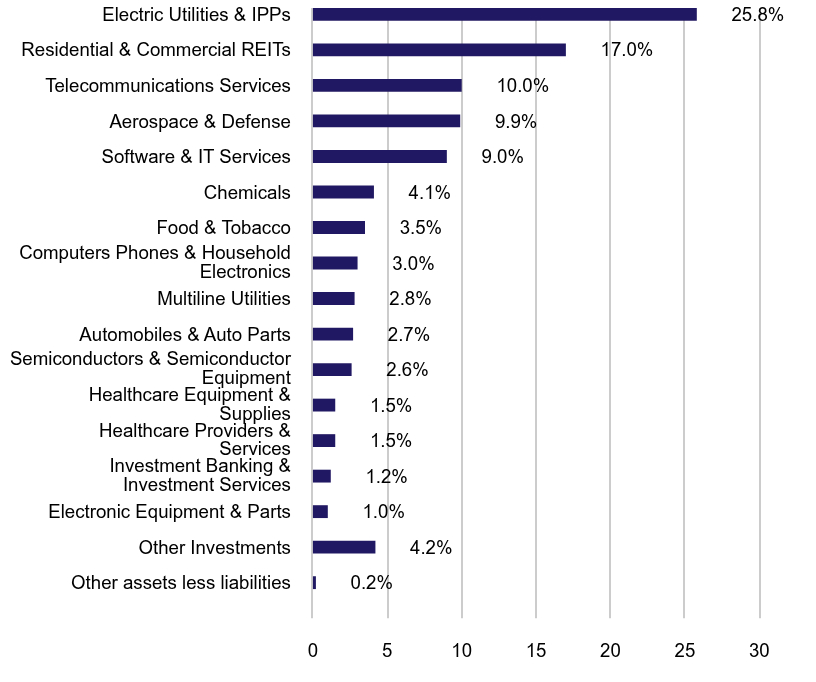
Other assets less liabilities | | 0.2% | Other Investments | | 0.5% | Energy | | 2.1% | Industrials | | 3.2% | Consumer Staples | | 3.3% | Consumer Discretionary | | 7.4% | Communication Services | | 12.6% | Financials | | 32.6% | Materials | | 38.1% |
|
| Largest Holdings [Text Block] |
Top Ten Holdings (% of Total Net Assets)Attijariwafa Bank | | 6.2% |
|---|
Airtel Africa PLC | | 4.9% |
|---|
Endeavour Mining PLC | | 4.8% |
|---|
Naspers Ltd. | | 4.5% |
|---|
Anglo American PLC | | 4.2% |
|---|
Ivanhoe Mines Ltd. | | 3.9% |
|---|
Banque Centrale Populaire | | 3.3% |
|---|
Perseus Mining Ltd. | | 3.3% |
|---|
Gold Fields Ltd. | | 3.2% |
|---|
Guaranty Trust Holding Co. PLC | | 3.0% |
|---|
|
| Material Fund Change [Text Block] |
The following material fund change occurred during the period ended December 31, 2025: The Fund's net expense ratio decreased to 0.76% for the year ended December 31, 2025 from 0.88% for the year ended December 31, 2024 primarily resulting from lower interest expense and an increase in average net assets. |
| Material Fund Change Expenses [Text Block] |
The Fund's net expense ratio decreased to 0.76% for the year ended December 31, 2025 from 0.88% for the year ended December 31, 2024 primarily resulting from lower interest expense and an increase in average net assets.
|
| Summary of Change Legend [Text Block] |
The following material fund change occurred during the period ended December 31, 2025:
|
| Updated Prospectus Web Address |
<span style="box-sizing: border-box; color: rgb(0, 0, 0); display: inline; flex-wrap: nowrap; font-size: 10.6667px; font-weight: 400; grid-area: auto; line-height: 16px; margin: 0px; overflow: visible; text-align: left; text-align-last: auto; white-space-collapse: preserve-breaks;">https://www.vaneck.com/us/en/etf-mutual-fund-finder/etfs/documents/</span>
|
| Accountant Change Statement [Text Block] |
|
| Accountant Change Disagreements [Text Block] |
|
| C000051120 |
|
| Shareholder Report [Line Items] |
|
| Fund Name |
VanEck Agribusiness ETF
|
| Class Name |
VanEck Agribusiness ETF
|
| Trading Symbol |
MOO
|
| Security Exchange Name |
NYSEArca
|
| Annual or Semi-Annual Statement [Text Block] |
This annual shareholder report contains important information about the VanEck Agribusiness ETF (the "Fund") for the period January 1, 2025 to December 31, 2025.
|
| Shareholder Report Annual or Semi-Annual |
Annual Shareholder Report
|
| Additional Information [Text Block] |
You can find additional information about the Fund at https://www.vaneck.com/us/en/etf-mutual-fund-finder/etfs/documents/. You can also request this information by contacting us at 800.826.2333 or info@vaneck.com.
|
| Additional Information Phone Number |
800.826.2333
|
| Additional Information Email |
<span style="box-sizing: border-box; color: rgb(0, 0, 0); display: inline; flex-wrap: nowrap; font-size: 10.6667px; font-weight: 400; grid-area: auto; line-height: 16px; margin: 0px; overflow: visible; text-align: left; text-align-last: auto; white-space-collapse: preserve-breaks;">info@vaneck.com</span>
|
| Additional Information Website |
<span style="box-sizing: border-box; color: rgb(0, 0, 0); display: inline; flex-wrap: nowrap; font-size: 10.6667px; font-weight: 400; grid-area: auto; line-height: 16px; margin: 0px; overflow: visible; text-align: left; text-align-last: auto; white-space-collapse: preserve-breaks;">https://www.vaneck.com/us/en/etf-mutual-fund-finder/etfs/documents/</span>
|
| Expenses [Text Block] |
What were the Fund costs for the last year?(based on a hypothetical $10,000 investment) Fund Name | Costs of a $10,000 investment | Costs paid as a % of a $10,000 investment |
|---|
VanEck Agribusiness ETF | $60 | 0.56% |
|---|
|
| Expenses Paid, Amount |
$ 60
|
| Expense Ratio, Percent |
0.56%
|
| Factors Affecting Performance [Text Block] |
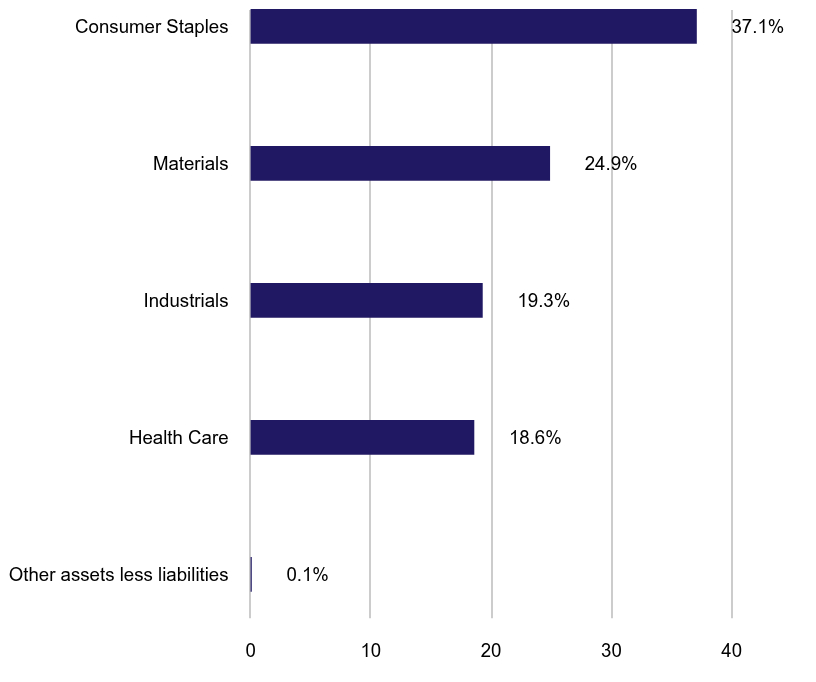
How did the Fund perform last year?During the period, performance reflected improving global agribusiness fundamentals amid easing cost pressures and stabilizing supply-demand dynamics. The health care sector, which includes Bayer as a result its 2018 acquisition of Monsanto, rebounded from the prior-year’s detraction and ended the period as the Fund’s largest contributor. Materials, consumer staples, and industrials all contributed positively to performance. From a country perspective, Germany was the largest contributor due to strong performance from select holdings, while the United States detracted modestly as a result of its higher portfolio weighting and lower relative returns. The leading individual contributors to performance were Bayer and Nutrien. The leading detractors were Zoetis and FMC.
|
| Performance Past Does Not Indicate Future [Text] |
The performance data quoted represents past performance. Past performance is no guarantee of future results.
|
| Line Graph [Table Text Block] |
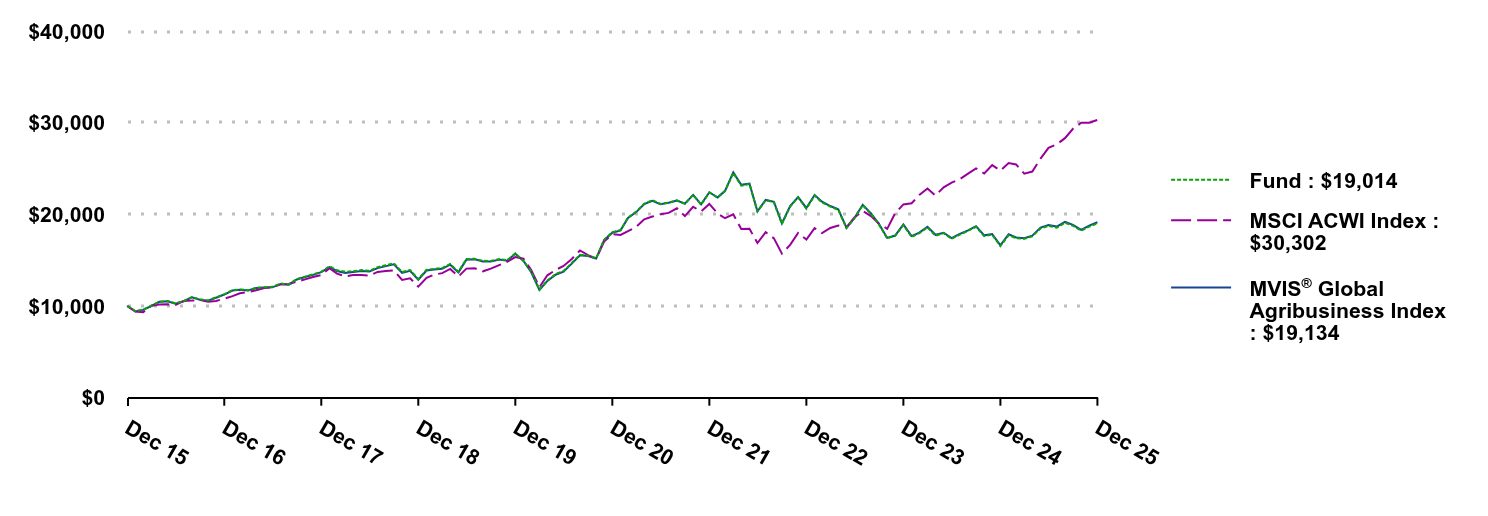 | Fund | MSCI ACWI Index | MVIS® Global Agribusiness Index |
|---|
Dec 15 | $10,000 | $10,000 | $10,000 |
|---|
Jan 16 | $9,456 | $9,397 | $9,401 |
|---|
Feb 16 | $9,598 | $9,332 | $9,577 |
|---|
Mar 16 | $10,028 | $10,024 | $10,002 |
|---|
Apr 16 | $10,445 | $10,172 | $10,464 |
|---|
May 16 | $10,548 | $10,185 | $10,526 |
|---|
Jun 16 | $10,307 | $10,123 | $10,250 |
|---|
Jul 16 | $10,537 | $10,559 | $10,517 |
|---|
Aug 16 | $10,971 | $10,595 | $10,938 |
|---|
Sep 16 | $10,730 | $10,660 | $10,682 |
|---|
Oct 16 | $10,610 | $10,479 | $10,583 |
|---|
Nov 16 | $10,945 | $10,558 | $10,902 |
|---|
Dec 16 | $11,274 | $10,786 | $11,251 |
|---|
Jan 17 | $11,724 | $11,081 | $11,694 |
|---|
Feb 17 | $11,808 | $11,392 | $11,778 |
|---|
Mar 17 | $11,720 | $11,532 | $11,693 |
|---|
Apr 17 | $11,974 | $11,711 | $11,957 |
|---|
May 17 | $12,038 | $11,970 | $12,009 |
|---|
Jun 17 | $12,091 | $12,024 | $12,041 |
|---|
Jul 17 | $12,446 | $12,360 | $12,411 |
|---|
Aug 17 | $12,367 | $12,408 | $12,327 |
|---|
Sep 17 | $12,933 | $12,647 | $12,889 |
|---|
Oct 17 | $13,208 | $12,910 | $13,161 |
|---|
Nov 17 | $13,449 | $13,160 | $13,397 |
|---|
Dec 17 | $13,719 | $13,372 | $13,695 |
|---|
Jan 18 | $14,349 | $14,127 | $14,236 |
|---|
Feb 18 | $13,897 | $13,533 | $13,819 |
|---|
Mar 18 | $13,736 | $13,244 | $13,615 |
|---|
Apr 18 | $13,794 | $13,370 | $13,714 |
|---|
May 18 | $13,915 | $13,387 | $13,825 |
|---|
Jun 18 | $13,841 | $13,314 | $13,758 |
|---|
Jul 18 | $14,235 | $13,716 | $14,138 |
|---|
Aug 18 | $14,447 | $13,824 | $14,354 |
|---|
Sep 18 | $14,645 | $13,884 | $14,556 |
|---|
Oct 18 | $13,703 | $12,843 | $13,622 |
|---|
Nov 18 | $13,923 | $13,031 | $13,834 |
|---|
Dec 18 | $12,929 | $12,113 | $12,861 |
|---|
Jan 19 | $13,954 | $13,070 | $13,868 |
|---|
Feb 19 | $14,045 | $13,419 | $13,972 |
|---|
Mar 19 | $14,142 | $13,588 | $14,057 |
|---|
Apr 19 | $14,591 | $14,047 | $14,504 |
|---|
May 19 | $13,733 | $13,214 | $13,668 |
|---|
Jun 19 | $15,132 | $14,079 | $15,043 |
|---|
Jul 19 | $15,146 | $14,120 | $15,097 |
|---|
Aug 19 | $14,933 | $13,785 | $14,862 |
|---|
Sep 19 | $14,912 | $14,075 | $14,844 |
|---|
Oct 19 | $15,113 | $14,460 | $15,062 |
|---|
Nov 19 | $14,998 | $14,813 | $14,942 |
|---|
Dec 19 | $15,734 | $15,335 | $15,690 |
|---|
Jan 20 | $14,905 | $15,166 | $14,908 |
|---|
Feb 20 | $13,770 | $13,941 | $13,687 |
|---|
Mar 20 | $11,776 | $12,059 | $11,762 |
|---|
Apr 20 | $12,774 | $13,350 | $12,739 |
|---|
May 20 | $13,493 | $13,931 | $13,410 |
|---|
Jun 20 | $13,818 | $14,376 | $13,741 |
|---|
Jul 20 | $14,699 | $15,137 | $14,628 |
|---|
Aug 20 | $15,586 | $16,063 | $15,531 |
|---|
Sep 20 | $15,496 | $15,545 | $15,446 |
|---|
Oct 20 | $15,222 | $15,167 | $15,171 |
|---|
Nov 20 | $17,222 | $17,037 | $17,180 |
|---|
Dec 20 | $18,051 | $17,828 | $17,996 |
|---|
Jan 21 | $18,286 | $17,747 | $18,254 |
|---|
Feb 21 | $19,649 | $18,158 | $19,599 |
|---|
Mar 21 | $20,298 | $18,643 | $20,245 |
|---|
Apr 21 | $21,164 | $19,458 | $21,128 |
|---|
May 21 | $21,544 | $19,761 | $21,486 |
|---|
Jun 21 | $21,132 | $20,021 | $21,092 |
|---|
Jul 21 | $21,288 | $20,159 | $21,256 |
|---|
Aug 21 | $21,535 | $20,664 | $21,515 |
|---|
Sep 21 | $21,147 | $19,810 | $21,170 |
|---|
Oct 21 | $22,127 | $20,821 | $22,120 |
|---|
Nov 21 | $21,068 | $20,320 | $21,089 |
|---|
Dec 21 | $22,383 | $21,133 | $22,407 |
|---|
Jan 22 | $21,833 | $20,095 | $21,825 |
|---|
Feb 22 | $22,538 | $19,576 | $22,567 |
|---|
Mar 22 | $24,507 | $20,000 | $24,584 |
|---|
Apr 22 | $23,128 | $18,399 | $23,221 |
|---|
May 22 | $23,303 | $18,420 | $23,344 |
|---|
Jun 22 | $20,318 | $16,868 | $20,336 |
|---|
Jul 22 | $21,548 | $18,046 | $21,572 |
|---|
Aug 22 | $21,301 | $17,381 | $21,366 |
|---|
Sep 22 | $18,954 | $15,717 | $19,017 |
|---|
Oct 22 | $20,854 | $16,666 | $20,914 |
|---|
Nov 22 | $21,864 | $17,958 | $21,879 |
|---|
Dec 22 | $20,604 | $17,252 | $20,695 |
|---|
Jan 23 | $22,058 | $18,488 | $22,106 |
|---|
Feb 23 | $21,291 | $17,958 | $21,375 |
|---|
Mar 23 | $20,853 | $18,512 | $20,907 |
|---|
Apr 23 | $20,493 | $18,778 | $20,543 |
|---|
May 23 | $18,502 | $18,577 | $18,539 |
|---|
Jun 23 | $19,570 | $19,656 | $19,600 |
|---|
Jul 23 | $20,995 | $20,375 | $21,037 |
|---|
Aug 23 | $20,045 | $19,806 | $20,100 |
|---|
Sep 23 | $18,889 | $18,987 | $18,954 |
|---|
Oct 23 | $17,395 | $18,416 | $17,431 |
|---|
Nov 23 | $17,642 | $20,116 | $17,685 |
|---|
Dec 23 | $18,835 | $21,082 | $18,903 |
|---|
Jan 24 | $17,534 | $21,206 | $17,626 |
|---|
Feb 24 | $17,937 | $22,116 | $18,006 |
|---|
Mar 24 | $18,572 | $22,810 | $18,647 |
|---|
Apr 24 | $17,672 | $22,057 | $17,771 |
|---|
May 24 | $17,948 | $22,953 | $17,989 |
|---|
Jun 24 | $17,339 | $23,464 | $17,401 |
|---|
Jul 24 | $17,789 | $23,843 | $17,863 |
|---|
Aug 24 | $18,201 | $24,448 | $18,260 |
|---|
Sep 24 | $18,642 | $25,016 | $18,714 |
|---|
Oct 24 | $17,623 | $24,455 | $17,713 |
|---|
Nov 24 | $17,782 | $25,369 | $17,849 |
|---|
Dec 24 | $16,530 | $24,769 | $16,616 |
|---|
Jan 25 | $17,723 | $25,600 | $17,826 |
|---|
Feb 25 | $17,412 | $25,446 | $17,483 |
|---|
Mar 25 | $17,339 | $24,441 | $17,403 |
|---|
Apr 25 | $17,603 | $24,669 | $17,672 |
|---|
May 25 | $18,457 | $26,087 | $18,554 |
|---|
Jun 25 | $18,754 | $27,258 | $18,840 |
|---|
Jul 25 | $18,546 | $27,628 | $18,663 |
|---|
Aug 25 | $19,076 | $28,310 | $19,178 |
|---|
Sep 25 | $18,758 | $29,336 | $18,846 |
|---|
Oct 25 | $18,217 | $29,992 | $18,317 |
|---|
Nov 25 | $18,668 | $29,989 | $18,766 |
|---|
Dec 25 | $19,014 | $30,302 | $19,134 |
|---|
|
| Average Annual Return [Table Text Block] |
Average Annual Total Returns . | 1 Year | 5 Years | 10 Years |
|---|
VanEck Agribusiness ETF | 15.03% | 1.04% | 6.64% |
|---|
MVIS® Global Agribusiness Index | 15.15% | 1.23% | 6.70% |
|---|
MSCI ACWI Index | 22.34% | 11.19% | 11.72% |
|---|
The performance data quoted represents past performance. Past performance is no guarantee of future results. Performance information for the Fund may reflect temporary fee waivers, if applicable. These returns do not reflect the deduction of taxes that a shareholder would pay on Fund dividends and distributions or the sale of Fund shares. Visit vaneck.com for more recent performance information. |
| No Deduction of Taxes [Text Block] |
|
| Performance Table Market Index Changed [Text Block] |
|
| Material Change Description [Text Block] |
|
| Updated Performance Information Location [Text Block] |
|
| AssetsNet |
$ 574,540,696
|
| Holdings Count | Holding |
51
|
| Advisory Fees Paid, Amount |
$ 2,979,225
|
| InvestmentCompanyPortfolioTurnover |
17.00%
|
| Additional Fund Statistics [Text Block] |
- Total Net Assets$574,540,696
- Number of Portfolio Holdings51
- Portfolio Turnover Rate17%
- Advisory Fees Paid$2,979,225
|
| Additional Fund Statistics Significance or Limits [Text Block] |
|
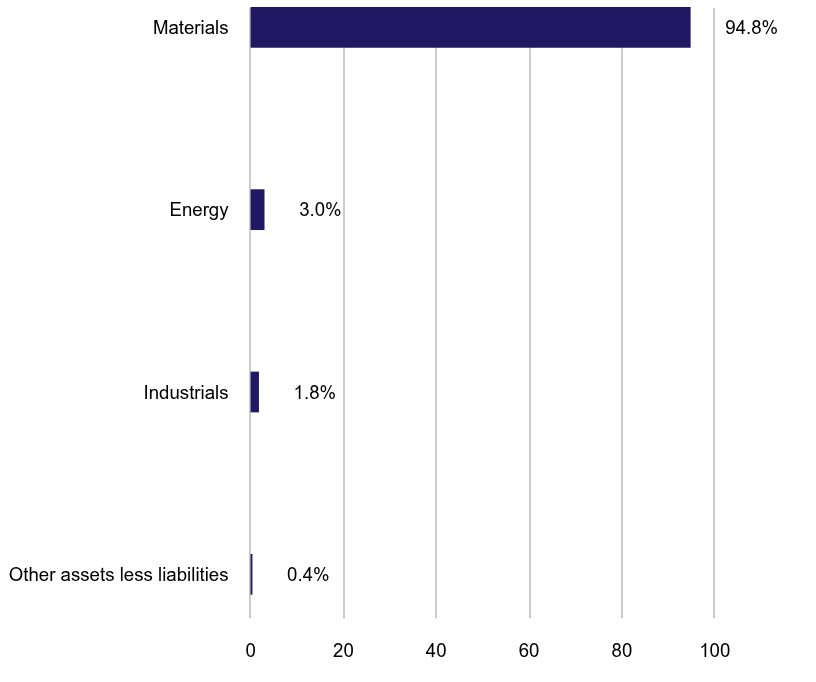
| Holdings [Text Block] |
Portfolio Composition (% of Total Net Assets)Value | Value | Value |
|---|
Other assets less liabilities | | 0.1% | Health Care | | 18.6% | Industrials | | 19.3% | Materials | | 24.9% | Consumer Staples | | 37.1% |
|
| Largest Holdings [Text Block] |
Top Ten Holdings (% of Total Net Assets)Zoetis, Inc. | | 8.4% |
|---|
Deere & Co. | | 7.8% |
|---|
Bayer AG | | 7.0% |
|---|
Corteva, Inc. | | 6.6% |
|---|
Nutrien Ltd. | | 6.1% |
|---|
Archer-Daniels-Midland Co. | | 5.3% |
|---|
Tyson Foods, Inc. | | 5.0% |
|---|
CF Industries Holdings, Inc. | | 3.8% |
|---|
Mowi ASA | | 3.7% |
|---|
Kubota Corp. | | 3.7% |
|---|
|
| Material Fund Change [Text Block] |
|
| Summary of Change Legend [Text Block] |
|
| Updated Prospectus Web Address |
<span style="box-sizing: border-box; color: rgb(0, 0, 0); display: inline; flex-wrap: nowrap; font-size: 10.6667px; font-weight: 400; grid-area: auto; line-height: 16px; margin: 0px; overflow: visible; text-align: left; text-align-last: auto; white-space-collapse: preserve-breaks;">https://www.vaneck.com/us/en/etf-mutual-fund-finder/etfs/documents/</span>
|
| Accountant Change Statement [Text Block] |
|
| Accountant Change Disagreements [Text Block] |
|
| C000102898 |
|
| Shareholder Report [Line Items] |
|
| Fund Name |
VanEck BDC Income ETF
|
| Class Name |
VanEck BDC Income ETF
|
| Trading Symbol |
BIZD
|
| Security Exchange Name |
NYSEArca
|
| Annual or Semi-Annual Statement [Text Block] |
This annual shareholder report contains important information about the VanEck BDC Income ETF (the "Fund") for the period January 1, 2025 to December 31, 2025.
|
| Shareholder Report Annual or Semi-Annual |
Annual Shareholder Report
|
| Additional Information [Text Block] |
You can find additional information about the Fund at https://www.vaneck.com/us/en/etf-mutual-fund-finder/etfs/documents/. You can also request this information by contacting us at 800.826.2333 or info@vaneck.com.
|
| Additional Information Phone Number |
800.826.2333
|
| Additional Information Email |
<span style="box-sizing: border-box; color: rgb(0, 0, 0); display: inline; flex-wrap: nowrap; font-size: 10.6667px; font-weight: 400; grid-area: auto; line-height: 16px; margin: 0px; overflow: visible; text-align: left; text-align-last: auto; white-space-collapse: preserve-breaks;">info@vaneck.com</span>
|
| Additional Information Website |
<span style="box-sizing: border-box; color: rgb(0, 0, 0); display: inline; flex-wrap: nowrap; font-size: 10.6667px; font-weight: 400; grid-area: auto; line-height: 16px; margin: 0px; overflow: visible; text-align: left; text-align-last: auto; white-space-collapse: preserve-breaks;">https://www.vaneck.com/us/en/etf-mutual-fund-finder/etfs/documents/</span>
|
| Expenses [Text Block] |
What were the Fund costs for the last year?(based on a hypothetical $10,000 investment) Fund Name | Costs of a $10,000 investment | Costs paid as a % of a $10,000 investmentFootnote Reference(a) |
|---|
VanEck BDC Income ETF | $41 | 0.42% |
|---|
| Footnote | Description | Footnote(a) | Excludes fees and expenses incurred indirectly as a result of investments in underlying funds. |
|
| Expenses Paid, Amount |
$ 41
|
| Expense Ratio, Percent |
0.42%
|
| Factors Affecting Performance [Text Block] |
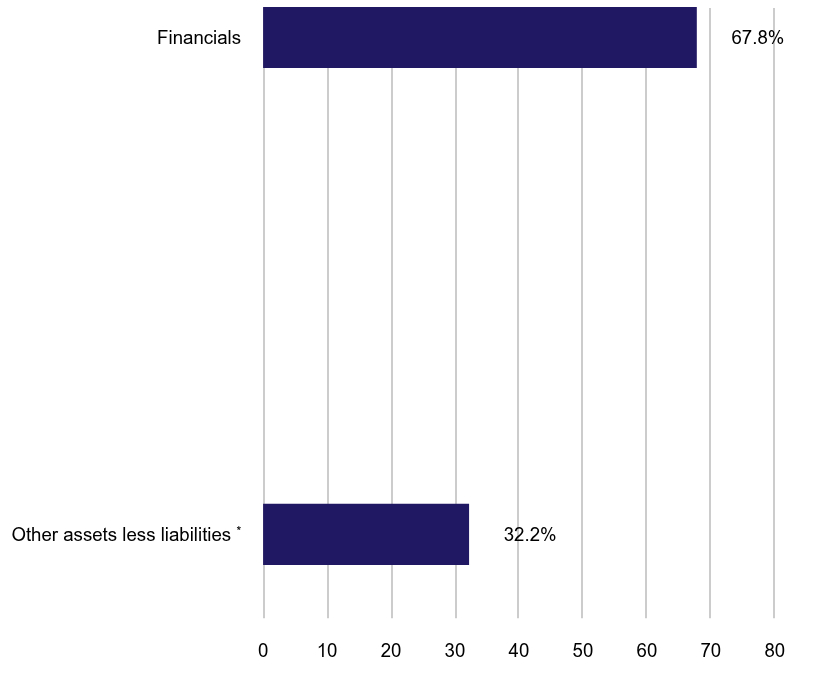
How did the Fund perform last year?Business development company equities were pressured during the period as discounts to NAV widened amid changing rate expectations and a shift in sentiment following select idiosyncratic credit events in the direct lending market. Sixth Street Specialty Lending, Inc. was the top contributor to Fund performance during the period, while Blackstone Secured Lending Fund was the greatest detractor. The Fund utilized index-linked swaps to achieve its investment objective of replicating as closely as possible, before fees and expenses, the price and yield performance of the MVIS US Business Development Companies Index.
|
| Performance Past Does Not Indicate Future [Text] |
The performance data quoted represents past performance. Past performance is no guarantee of future results.
|
| Line Graph [Table Text Block] |
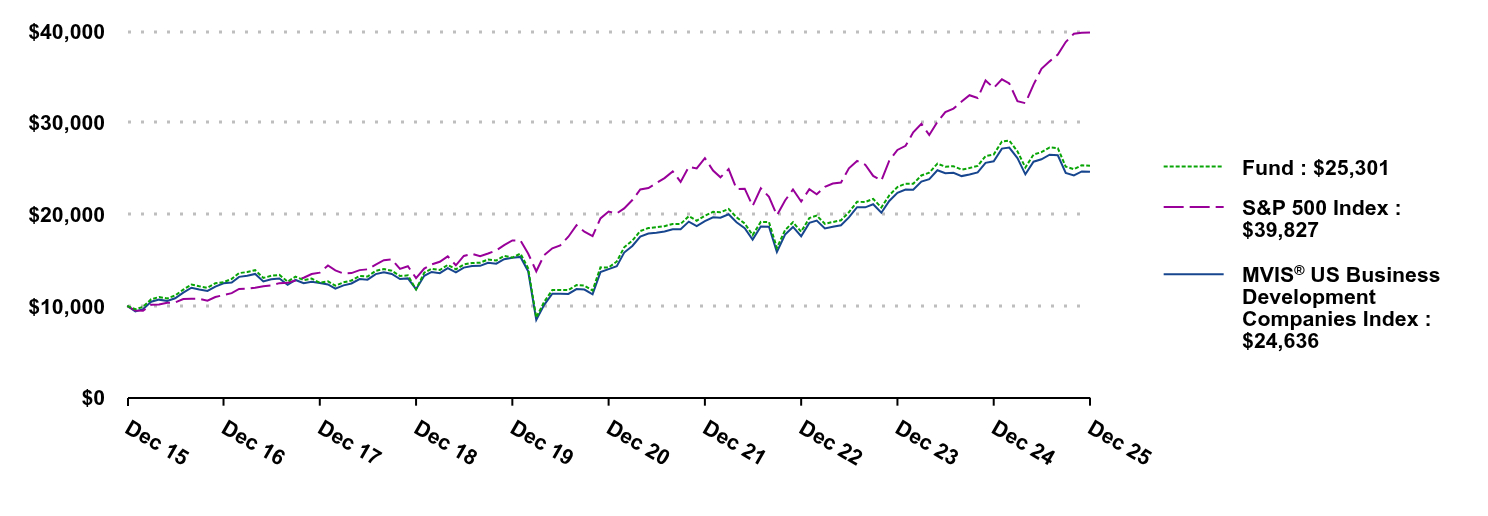 | Fund | S&P 500 Index | MVIS® US Business Development Companies Index |
|---|
Dec 15 | $10,000 | $10,000 | $10,000 |
|---|
Jan 16 | $9,649 | $9,504 | $9,412 |
|---|
Feb 16 | $9,903 | $9,491 | $9,661 |
|---|
Mar 16 | $10,737 | $10,135 | $10,469 |
|---|
Apr 16 | $10,979 | $10,174 | $10,695 |
|---|
May 16 | $10,832 | $10,357 | $10,541 |
|---|
Jun 16 | $11,146 | $10,384 | $10,841 |
|---|
Jul 16 | $11,791 | $10,766 | $11,465 |
|---|
Aug 16 | $12,338 | $10,782 | $11,991 |
|---|
Sep 16 | $12,153 | $10,784 | $11,811 |
|---|
Oct 16 | $11,987 | $10,587 | $11,648 |
|---|
Nov 16 | $12,476 | $10,979 | $12,116 |
|---|
Dec 16 | $12,595 | $11,196 | $12,484 |
|---|
Jan 17 | $12,957 | $11,408 | $12,570 |
|---|
Feb 17 | $13,591 | $11,861 | $13,183 |
|---|
Mar 17 | $13,705 | $11,875 | $13,301 |
|---|
Apr 17 | $13,907 | $11,997 | $13,498 |
|---|
May 17 | $13,065 | $12,166 | $12,683 |
|---|
Jun 17 | $13,297 | $12,242 | $12,913 |
|---|
Jul 17 | $13,393 | $12,494 | $13,010 |
|---|
Aug 17 | $12,660 | $12,532 | $12,304 |
|---|
Sep 17 | $13,201 | $12,790 | $12,839 |
|---|
Oct 17 | $12,833 | $13,089 | $12,489 |
|---|
Nov 17 | $12,984 | $13,490 | $12,634 |
|---|
Dec 17 | $12,530 | $13,640 | $12,509 |
|---|
Jan 18 | $12,687 | $14,421 | $12,353 |
|---|
Feb 18 | $12,222 | $13,890 | $11,899 |
|---|
Mar 18 | $12,586 | $13,537 | $12,255 |
|---|
Apr 18 | $12,784 | $13,589 | $12,456 |
|---|
May 18 | $13,276 | $13,916 | $12,933 |
|---|
Jun 18 | $13,212 | $14,002 | $12,875 |
|---|
Jul 18 | $13,840 | $14,523 | $13,485 |
|---|
Aug 18 | $14,034 | $14,996 | $13,680 |
|---|
Sep 18 | $13,840 | $15,081 | $13,490 |
|---|
Oct 18 | $13,271 | $14,050 | $12,942 |
|---|
Nov 18 | $13,345 | $14,337 | $13,011 |
|---|
Dec 18 | $11,802 | $13,042 | $11,835 |
|---|
Jan 19 | $13,637 | $14,087 | $13,302 |
|---|
Feb 19 | $14,063 | $14,540 | $13,717 |
|---|
Mar 19 | $13,927 | $14,822 | $13,588 |
|---|
Apr 19 | $14,480 | $15,422 | $14,128 |
|---|
May 19 | $14,007 | $14,442 | $13,669 |
|---|
Jun 19 | $14,532 | $15,460 | $14,186 |
|---|
Jul 19 | $14,695 | $15,682 | $14,352 |
|---|
Aug 19 | $14,725 | $15,434 | $14,382 |
|---|
Sep 19 | $15,073 | $15,723 | $14,723 |
|---|
Oct 19 | $14,962 | $16,063 | $14,611 |
|---|
Nov 19 | $15,458 | $16,646 | $15,101 |
|---|
Dec 19 | $15,286 | $17,149 | $15,264 |
|---|
Jan 20 | $15,712 | $17,142 | $15,355 |
|---|
Feb 20 | $14,121 | $15,731 | $13,800 |
|---|
Mar 20 | $8,747 | $13,788 | $8,482 |
|---|
Apr 20 | $10,459 | $15,555 | $10,127 |
|---|
May 20 | $11,742 | $16,296 | $11,350 |
|---|
Jun 20 | $11,751 | $16,620 | $11,348 |
|---|
Jul 20 | $11,731 | $17,558 | $11,315 |
|---|
Aug 20 | $12,286 | $18,820 | $11,852 |
|---|
Sep 20 | $12,222 | $18,105 | $11,792 |
|---|
Oct 20 | $11,696 | $17,623 | $11,280 |
|---|
Nov 20 | $14,214 | $19,552 | $13,704 |
|---|
Dec 20 | $14,197 | $20,304 | $14,022 |
|---|
Jan 21 | $14,861 | $20,099 | $14,341 |
|---|
Feb 21 | $16,401 | $20,653 | $15,832 |
|---|
Mar 21 | $17,132 | $21,558 | $16,546 |
|---|
Apr 21 | $18,180 | $22,708 | $17,581 |
|---|
May 21 | $18,507 | $22,867 | $17,900 |
|---|
Jun 21 | $18,587 | $23,401 | $17,999 |
|---|
Jul 21 | $18,710 | $23,956 | $18,124 |
|---|
Aug 21 | $18,951 | $24,685 | $18,365 |
|---|
Sep 21 | $18,952 | $23,537 | $18,370 |
|---|
Oct 21 | $19,800 | $25,186 | $19,204 |
|---|
Nov 21 | $19,302 | $25,011 | $18,727 |
|---|
Dec 21 | $19,850 | $26,132 | $19,265 |
|---|
Jan 22 | $20,272 | $24,780 | $19,681 |
|---|
Feb 22 | $20,225 | $24,038 | $19,641 |
|---|
Mar 22 | $20,582 | $24,931 | $20,007 |
|---|
Apr 22 | $19,676 | $22,757 | $19,133 |
|---|
May 22 | $19,002 | $22,798 | $18,481 |
|---|
Jun 22 | $17,738 | $20,916 | $17,244 |
|---|
Jul 22 | $19,178 | $22,845 | $18,668 |
|---|
Aug 22 | $19,150 | $21,913 | $18,641 |
|---|
Sep 22 | $16,343 | $19,895 | $15,888 |
|---|
Oct 22 | $18,281 | $21,506 | $17,785 |
|---|
Nov 22 | $19,146 | $22,708 | $18,625 |
|---|
Dec 22 | $18,107 | $21,399 | $17,615 |
|---|
Jan 23 | $19,598 | $22,744 | $19,064 |
|---|
Feb 23 | $19,862 | $22,189 | $19,323 |
|---|
Mar 23 | $18,965 | $23,004 | $18,457 |
|---|
Apr 23 | $19,164 | $23,363 | $18,636 |
|---|
May 23 | $19,352 | $23,464 | $18,814 |
|---|
Jun 23 | $20,231 | $25,015 | $19,672 |
|---|
Jul 23 | $21,370 | $25,818 | $20,784 |
|---|
Aug 23 | $21,347 | $25,407 | $20,762 |
|---|
Sep 23 | $21,685 | $24,196 | $21,097 |
|---|
Oct 23 | $20,750 | $23,687 | $20,171 |
|---|
Nov 23 | $22,072 | $25,850 | $21,456 |
|---|
Dec 23 | $22,984 | $27,025 | $22,350 |
|---|
Jan 24 | $23,344 | $27,479 | $22,702 |
|---|
Feb 24 | $23,337 | $28,946 | $22,695 |
|---|
Mar 24 | $24,240 | $29,878 | $23,570 |
|---|
Apr 24 | $24,536 | $28,657 | $23,845 |
|---|
May 24 | $25,528 | $30,078 | $24,809 |
|---|
Jun 24 | $25,203 | $31,157 | $24,485 |
|---|
Jul 24 | $25,247 | $31,537 | $24,533 |
|---|
Aug 24 | $24,876 | $32,302 | $24,171 |
|---|
Sep 24 | $25,046 | $32,992 | $24,337 |
|---|
Oct 24 | $25,288 | $32,692 | $24,575 |
|---|
Nov 24 | $26,357 | $34,612 | $25,615 |
|---|
Dec 24 | $26,526 | $33,786 | $25,784 |
|---|
Jan 25 | $27,940 | $34,727 | $27,173 |
|---|
Feb 25 | $28,053 | $34,274 | $27,285 |
|---|
Mar 25 | $26,873 | $32,343 | $26,140 |
|---|
Apr 25 | $25,111 | $32,124 | $24,364 |
|---|
May 25 | $26,521 | $34,146 | $25,744 |
|---|
Jun 25 | $26,789 | $35,882 | $26,004 |
|---|
Jul 25 | $27,301 | $36,687 | $26,512 |
|---|
Aug 25 | $27,221 | $37,431 | $26,447 |
|---|
Sep 25 | $25,206 | $38,797 | $24,514 |
|---|
Oct 25 | $24,926 | $39,706 | $24,251 |
|---|
Nov 25 | $25,355 | $39,803 | $24,677 |
|---|
Dec 25 | $25,301 | $39,827 | $24,636 |
|---|
|
| Average Annual Return [Table Text Block] |
Average Annual Total Returns . | 1 Year | 5 Years | 10 Years |
|---|
VanEck BDC Income ETF | (4.62)% | 12.25% | 9.73% |
|---|
MVIS® US Business Development Companies Index | (4.45)% | 11.93% | 9.44% |
|---|
S&P 500 Index | 17.88% | 14.42% | 14.82% |
|---|
MVBDCTRG replaced the MVIS® US Business Development Companies Index (MVBIZDTG) effective June 19, 2023. Index history prior to June 19, 2023 reflects the performance of the MVIS® US Business Development Companies Index. The performance data quoted represents past performance. Past performance is no guarantee of future results. Performance information for the Fund may reflect temporary fee waivers, if applicable. These returns do not reflect the deduction of taxes that a shareholder would pay on Fund dividends and distributions or the sale of Fund shares. Visit vaneck.com for more recent performance information. |
| No Deduction of Taxes [Text Block] |
|
| Performance Table Market Index Changed [Text Block] |
|
| Material Change Description [Text Block] |
|
| Updated Performance Information Location [Text Block] |
|
| AssetsNet |
$ 1,606,047,024
|
| Holdings Count | Holding |
33
|
| Advisory Fees Paid, Amount |
$ 6,190,323
|
| InvestmentCompanyPortfolioTurnover |
28.00%
|
| Additional Fund Statistics [Text Block] |
- Total Net Assets$1,606,047,024
- Number of Portfolio Holdings33
- Portfolio Turnover Rate28%
- Advisory Fees Paid$6,190,323
|
| Additional Fund Statistics Significance or Limits [Text Block] |
|
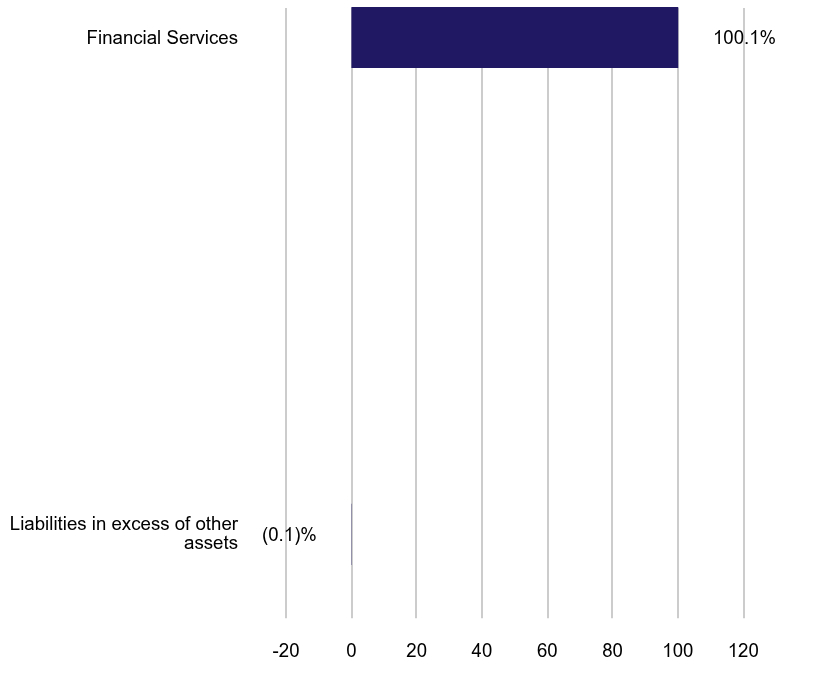
| Holdings [Text Block] |
Portfolio Composition (% of Total Net Assets)Value | Value | Value |
|---|
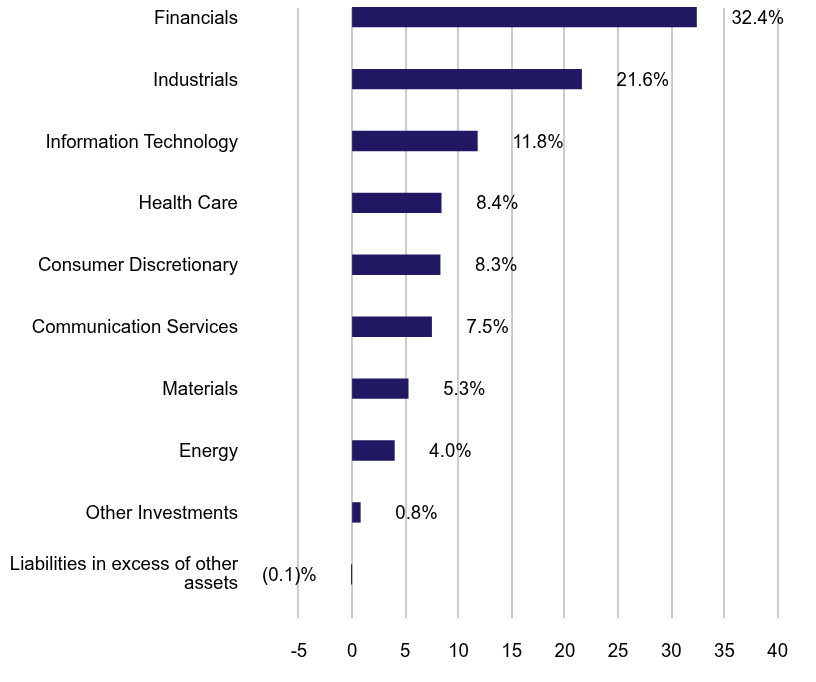
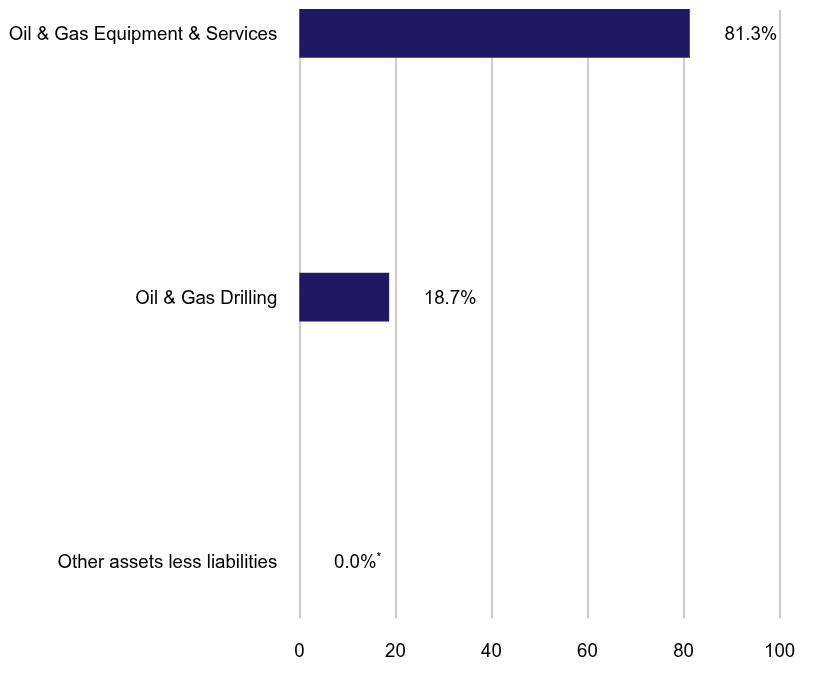
Other assets less liabilitiesFootnote Reference* | | 32.2% | Financials | | 67.8% |
| Footnote | Description | Footnote* | Includes net unrealized appreciation (depreciation) on total return swap contracts of (0.4)% |
|
| Exposure Basis Explanation [Text Block] |
Includes net unrealized appreciation (depreciation) on total return swap contracts of (0.4)%
|
| Largest Holdings [Text Block] |
Top Ten Holdings Footnote Reference* (% of Total Net Assets)Ares Capital Corp. | | 15.5% |
|---|
Blue Owl Capital Corp. | | 9.1% |
|---|
Blackstone Secured Lending Fund | | 7.7% |
|---|
Hercules Capital, Inc. | | 3.3% |
|---|
Main Street Capital Corp. | | 3.2% |
|---|
Golub Capital BDC, Inc. | | 3.1% |
|---|
FS KKR Capital Corp. | | 3.1% |
|---|
Sixth Street Specialty Lending, Inc. | | 2.5% |
|---|
Capital Southwest Corp. | | 1.6% |
|---|
Morgan Stanley Direct Lending Fund | | 1.5% |
|---|
| Footnote | Description | Footnote* | Excludes short-term investments |
|
| Material Fund Change [Text Block] |
|
| Summary of Change Legend [Text Block] |
|
| Updated Prospectus Web Address |
<span style="box-sizing: border-box; color: rgb(0, 0, 0); display: inline; flex-wrap: nowrap; font-size: 10.6667px; font-weight: 400; grid-area: auto; line-height: 16px; margin: 0px; overflow: visible; text-align: left; text-align-last: auto; white-space-collapse: preserve-breaks;">https://www.vaneck.com/us/en/etf-mutual-fund-finder/etfs/documents/</span>
|
| Accountant Change Statement [Text Block] |
|
| Accountant Change Disagreements [Text Block] |
|
| C000076451 |
|
| Shareholder Report [Line Items] |
|
| Fund Name |
VanEck Brazil Small-Cap ETF
|
| Class Name |
VanEck Brazil Small-Cap ETF
|
| Trading Symbol |
BRF
|
| Security Exchange Name |
NYSEArca
|
| Annual or Semi-Annual Statement [Text Block] |
This annual shareholder report contains important information about the VanEck Brazil Small-Cap ETF (the "Fund") for the period January 1, 2025 to December 31, 2025.
|
| Shareholder Report Annual or Semi-Annual |
Annual Shareholder Report
|
| Additional Information [Text Block] |
You can find additional information about the Fund at https://www.vaneck.com/us/en/etf-mutual-fund-finder/etfs/documents/. You can also request this information by contacting us at 800.826.2333 or info@vaneck.com.
|
| Additional Information Phone Number |
800.826.2333
|
| Additional Information Email |
<span style="box-sizing: border-box; color: rgb(0, 0, 0); display: inline; flex-wrap: nowrap; font-size: 10.6667px; font-weight: 400; grid-area: auto; line-height: 16px; margin: 0px; overflow: visible; text-align: left; text-align-last: auto; white-space-collapse: preserve-breaks;">info@vaneck.com</span>
|
| Additional Information Website |
<span style="box-sizing: border-box; color: rgb(0, 0, 0); display: inline; flex-wrap: nowrap; font-size: 10.6667px; font-weight: 400; grid-area: auto; line-height: 16px; margin: 0px; overflow: visible; text-align: left; text-align-last: auto; white-space-collapse: preserve-breaks;">https://www.vaneck.com/us/en/etf-mutual-fund-finder/etfs/documents/</span>
|
| Expenses [Text Block] |
What were the Fund costs for the last year?(based on a hypothetical $10,000 investment) Fund Name | Costs of a $10,000 investment | Costs paid as a % of a $10,000 investment |
|---|
VanEck Brazil Small-Cap ETF | $76 | 0.60% |
|---|
|
| Expenses Paid, Amount |
$ 76
|
| Expense Ratio, Percent |
0.60%
|
| Factors Affecting Performance [Text Block] |
How did the Fund perform last year?The Fund posted a positive return over the period as improving domestic economic activity, resilient export demand and broad equity market strength lifted valuations, despite headwinds from high interest rates and trade tensions. The Consumer Discretionary sector contributed the most to the Fund’s performance during the period, followed by Utilities and Financials. The leading individual contributors to performance were Modec, Inc., Inter & Co., Inc. and Cyrela Brazil Realty SA Empreendimentos e Participacoes. There were no negative detractors to the Fund’s performance during the period from a sector-level perspective. The leading individual detractors to performance were Brava Energia SA, Raizen SA and Sao Martinho S.A.
|
| Performance Past Does Not Indicate Future [Text] |
The performance data quoted represents past performance. Past performance is no guarantee of future results.
|
| Line Graph [Table Text Block] |
 | Fund | MSCI ACWI Index | MVIS® Brazil Small-Cap Index | S&P 500 Index |
|---|
Dec 15 | $10,000 | $10,000 | $10,000 | $10,000 |
|---|
Jan 16 | $9,109 | $9,397 | $9,044 | $9,504 |
|---|
Feb 16 | $9,607 | $9,332 | $9,666 | $9,491 |
|---|
Mar 16 | $11,887 | $10,024 | $12,030 | $10,135 |
|---|
Apr 16 | $13,027 | $10,172 | $12,973 | $10,174 |
|---|
May 16 | $12,002 | $10,185 | $12,040 | $10,357 |
|---|
Jun 16 | $14,492 | $10,123 | $14,519 | $10,384 |
|---|
Jul 16 | $16,398 | $10,559 | $16,451 | $10,766 |
|---|
Aug 16 | $16,648 | $10,595 | $16,635 | $10,782 |
|---|
Sep 16 | $16,312 | $10,660 | $16,346 | $10,784 |
|---|
Oct 16 | $17,893 | $10,479 | $18,055 | $10,587 |
|---|
Nov 16 | $15,575 | $10,558 | $15,603 | $10,979 |
|---|
Dec 16 | $16,092 | $10,786 | $16,164 | $11,196 |
|---|
Jan 17 | $18,301 | $11,081 | $18,425 | $11,408 |
|---|
Feb 17 | $20,000 | $11,392 | $20,105 | $11,861 |
|---|
Mar 17 | $19,900 | $11,532 | $19,755 | $11,875 |
|---|
Apr 17 | $20,300 | $11,711 | $20,278 | $11,997 |
|---|
May 17 | $19,570 | $11,970 | $19,661 | $12,166 |
|---|
Jun 17 | $19,510 | $12,024 | $19,663 | $12,242 |
|---|
Jul 17 | $22,089 | $12,360 | $22,221 | $12,494 |
|---|
Aug 17 | $23,658 | $12,408 | $23,867 | $12,532 |
|---|
Sep 17 | $24,728 | $12,647 | $24,981 | $12,790 |
|---|
Oct 17 | $23,948 | $12,910 | $24,186 | $13,089 |
|---|
Nov 17 | $23,238 | $13,160 | $23,517 | $13,490 |
|---|
Dec 17 | $24,414 | $13,372 | $24,712 | $13,640 |
|---|
Jan 18 | $26,506 | $14,127 | $26,981 | $14,421 |
|---|
Feb 18 | $25,805 | $13,533 | $26,130 | $13,890 |
|---|
Mar 18 | $25,136 | $13,244 | $25,350 | $13,537 |
|---|
Apr 18 | $23,932 | $13,370 | $24,410 | $13,589 |
|---|
May 18 | $20,542 | $13,387 | $20,886 | $13,916 |
|---|
Jun 18 | $18,815 | $13,314 | $19,264 | $14,002 |
|---|
Jul 18 | $20,249 | $13,716 | $20,434 | $14,523 |
|---|
Aug 18 | $18,124 | $13,824 | $18,101 | $14,996 |
|---|
Sep 18 | $17,779 | $13,884 | $18,136 | $15,081 |
|---|
Oct 18 | $21,452 | $12,843 | $21,725 | $14,050 |
|---|
Nov 18 | $21,222 | $13,031 | $21,436 | $14,337 |
|---|
Dec 18 | $21,568 | $12,113 | $21,913 | $13,042 |
|---|
Jan 19 | $24,987 | $13,070 | $25,312 | $14,087 |
|---|
Feb 19 | $24,448 | $13,419 | $24,808 | $14,540 |
|---|
Mar 19 | $23,123 | $13,588 | $23,592 | $14,822 |
|---|
Apr 19 | $23,802 | $14,047 | $24,052 | $15,422 |
|---|
May 19 | $23,500 | $13,214 | $23,940 | $14,442 |
|---|
Jun 19 | $25,794 | $14,079 | $26,271 | $15,460 |
|---|
Jul 19 | $26,875 | $14,120 | $27,674 | $15,682 |
|---|
Aug 19 | $25,066 | $13,785 | $25,578 | $15,434 |
|---|
Sep 19 | $25,095 | $14,075 | $25,552 | $15,723 |
|---|
Oct 19 | $26,252 | $14,460 | $26,779 | $16,063 |
|---|
Nov 19 | $25,950 | $14,813 | $26,561 | $16,646 |
|---|
Dec 19 | $30,370 | $15,335 | $30,990 | $17,149 |
|---|
Jan 20 | $28,954 | $15,166 | $29,710 | $17,142 |
|---|
Feb 20 | $25,599 | $13,941 | $26,021 | $15,731 |
|---|
Mar 20 | $14,537 | $12,059 | $14,968 | $13,788 |
|---|
Apr 20 | $15,928 | $13,350 | $16,445 | $15,555 |
|---|
May 20 | $16,810 | $13,931 | $17,031 | $16,296 |
|---|
Jun 20 | $18,453 | $14,376 | $18,818 | $16,620 |
|---|
Jul 20 | $20,445 | $15,137 | $21,036 | $17,558 |
|---|
Aug 20 | $19,612 | $16,063 | $20,154 | $18,820 |
|---|
Sep 20 | $18,406 | $15,545 | $18,892 | $18,105 |
|---|
Oct 20 | $17,597 | $15,167 | $18,058 | $17,623 |
|---|
Nov 20 | $21,795 | $17,037 | $22,369 | $19,552 |
|---|
Dec 20 | $24,067 | $17,828 | $24,759 | $20,304 |
|---|
Jan 21 | $22,189 | $17,747 | $22,940 | $20,099 |
|---|
Feb 21 | $21,182 | $18,158 | $21,949 | $20,653 |
|---|
Mar 21 | $22,050 | $18,643 | $22,707 | $21,558 |
|---|
Apr 21 | $23,854 | $19,458 | $24,650 | $22,708 |
|---|
May 21 | $26,278 | $19,761 | $27,066 | $22,867 |
|---|
Jun 21 | $27,757 | $20,021 | $28,468 | $23,401 |
|---|
Jul 21 | $25,221 | $20,159 | $26,313 | $23,956 |
|---|
Aug 21 | $24,298 | $20,664 | $25,325 | $24,685 |
|---|
Sep 21 | $21,521 | $19,810 | $22,282 | $23,537 |
|---|
Oct 21 | $18,432 | $20,821 | $19,126 | $25,186 |
|---|
Nov 21 | $17,970 | $20,320 | $18,555 | $25,011 |
|---|
Dec 21 | $18,922 | $21,133 | $19,691 | $26,132 |
|---|
Jan 22 | $20,479 | $20,095 | $21,259 | $24,780 |
|---|
Feb 22 | $19,892 | $19,576 | $20,743 | $24,038 |
|---|
Mar 22 | $23,226 | $20,000 | $24,051 | $24,931 |
|---|
Apr 22 | $20,513 | $18,399 | $21,200 | $22,757 |
|---|
May 22 | $20,928 | $18,420 | $21,719 | $22,798 |
|---|
Jun 22 | $16,179 | $16,868 | $16,768 | $20,916 |
|---|
Jul 22 | $17,137 | $18,046 | $17,685 | $22,845 |
|---|
Aug 22 | $18,571 | $17,381 | $19,335 | $21,913 |
|---|
Sep 22 | $17,690 | $15,717 | $18,318 | $19,895 |
|---|
Oct 22 | $19,405 | $16,666 | $19,878 | $21,506 |
|---|
Nov 22 | $17,217 | $17,958 | $17,661 | $22,708 |
|---|
Dec 22 | $16,404 | $17,252 | $17,114 | $21,399 |
|---|
Jan 23 | $17,827 | $18,488 | $18,544 | $22,744 |
|---|
Feb 23 | $15,875 | $17,958 | $16,618 | $22,189 |
|---|
Mar 23 | $16,047 | $18,512 | $16,750 | $23,004 |
|---|
Apr 23 | $16,795 | $18,778 | $17,490 | $23,363 |
|---|
May 23 | $18,914 | $18,577 | $19,605 | $23,464 |
|---|
Jun 23 | $21,872 | $19,656 | $22,729 | $25,015 |
|---|
Jul 23 | $23,003 | $20,375 | $23,944 | $25,818 |
|---|
Aug 23 | $20,641 | $19,806 | $21,601 | $25,407 |
|---|
Sep 23 | $19,800 | $18,987 | $20,828 | $24,196 |
|---|
Oct 23 | $17,885 | $18,416 | $18,746 | $23,687 |
|---|
Nov 23 | $20,438 | $20,116 | $21,422 | $25,850 |
|---|
Dec 23 | $22,332 | $21,082 | $23,525 | $27,025 |
|---|
Jan 24 | $20,717 | $21,206 | $21,875 | $27,479 |
|---|
Feb 24 | $20,860 | $22,116 | $21,979 | $28,946 |
|---|
Mar 24 | $21,254 | $22,810 | $22,436 | $29,878 |
|---|
Apr 24 | $18,972 | $22,057 | $20,049 | $28,657 |
|---|
May 24 | $18,361 | $22,953 | $19,354 | $30,078 |
|---|
Jun 24 | $17,424 | $23,464 | $18,505 | $31,157 |
|---|
Jul 24 | $17,662 | $23,843 | $18,679 | $31,537 |
|---|
Aug 24 | $18,584 | $24,448 | $19,594 | $32,302 |
|---|
Sep 24 | $18,832 | $25,016 | $19,948 | $32,992 |
|---|
Oct 24 | $17,444 | $24,455 | $18,474 | $32,692 |
|---|
Nov 24 | $16,173 | $25,369 | $17,144 | $34,612 |
|---|
Dec 24 | $14,574 | $24,769 | $15,442 | $33,786 |
|---|
Jan 25 | $16,158 | $25,600 | $17,140 | $34,727 |
|---|
Feb 25 | $15,486 | $25,446 | $16,447 | $34,274 |
|---|
Mar 25 | $16,774 | $24,441 | $17,722 | $32,343 |
|---|
Apr 25 | $17,943 | $24,669 | $19,047 | $32,124 |
|---|
May 25 | $19,003 | $26,087 | $20,109 | $34,146 |
|---|
Jun 25 | $20,266 | $27,258 | $21,438 | $35,882 |
|---|
Jul 25 | $18,684 | $27,628 | $19,860 | $36,687 |
|---|
Aug 25 | $20,673 | $28,310 | $21,974 | $37,431 |
|---|
Sep 25 | $21,449 | $29,336 | $22,806 | $38,797 |
|---|
Oct 25 | $21,551 | $29,992 | $22,896 | $39,706 |
|---|
Nov 25 | $23,148 | $29,989 | $24,597 | $39,803 |
|---|
Dec 25 | $22,419 | $30,302 | $23,933 | $39,827 |
|---|
|
| Average Annual Return [Table Text Block] |
Average Annual Total Returns . | 1 Year | 5 Years | 10 Years |
|---|
VanEck Brazil Small-Cap ETF | 53.82% | (1.41)% | 8.41% |
|---|
MVIS® Brazil Small-Cap Index | 54.99% | (0.68)% | 9.12% |
|---|
MSCI ACWI Index | 22.34% | 11.19% | 11.72% |
|---|
S&P 500 Index | 17.88% | 14.42% | 14.82% |
|---|
The performance data quoted represents past performance. Past performance is no guarantee of future results. Performance information for the Fund may reflect temporary fee waivers, if applicable. These returns do not reflect the deduction of taxes that a shareholder would pay on Fund dividends and distributions or the sale of Fund shares. Visit vaneck.com for more recent performance information. |
| No Deduction of Taxes [Text Block] |
|
| Performance Table Market Index Changed [Text Block] |
|
| Material Change Description [Text Block] |
|
| Updated Performance Information Location [Text Block] |
|
| AssetsNet |
$ 21,798,792
|
| Holdings Count | Holding |
93
|
| Advisory Fees Paid, Amount |
$ 0
|
| InvestmentCompanyPortfolioTurnover |
43.00%
|
| Additional Fund Statistics [Text Block] |
- Total Net Assets$21,798,792
- Number of Portfolio Holdings93
- Portfolio Turnover Rate43%
- Advisory Fees Paid$-
|
| Additional Fund Statistics Significance or Limits [Text Block] |
|
| Holdings [Text Block] |
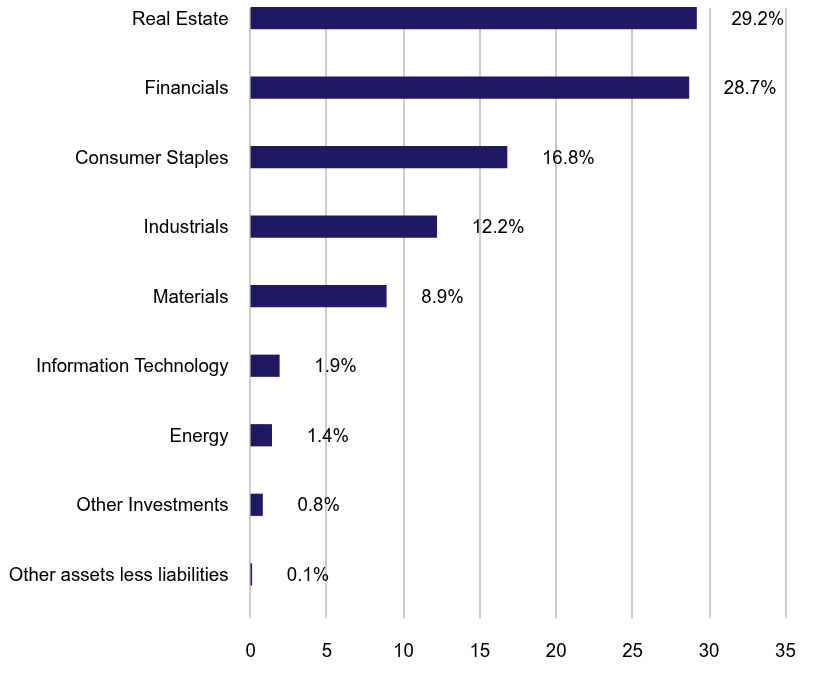
Portfolio Composition (% of Total Net Assets)Value | Value | Value |
|---|
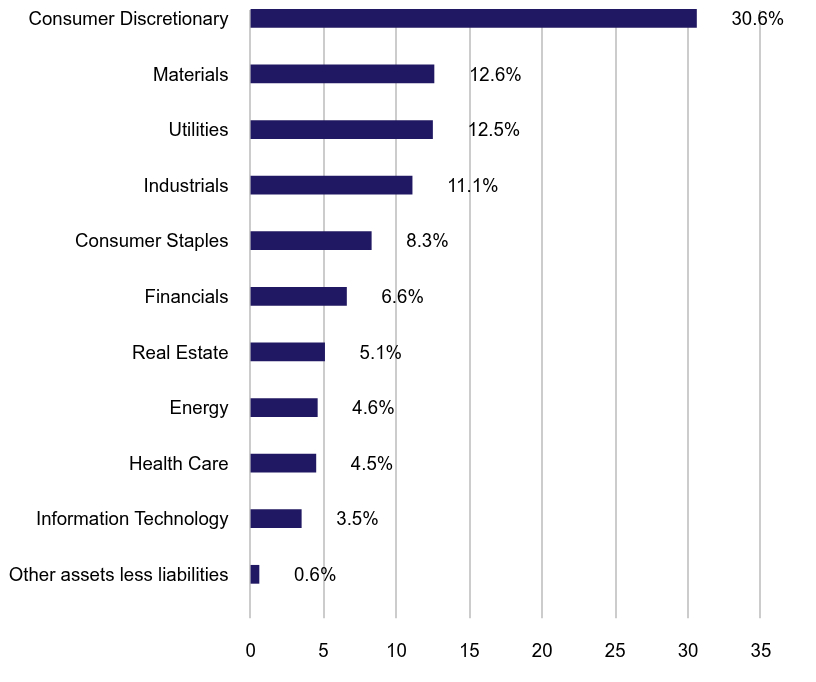
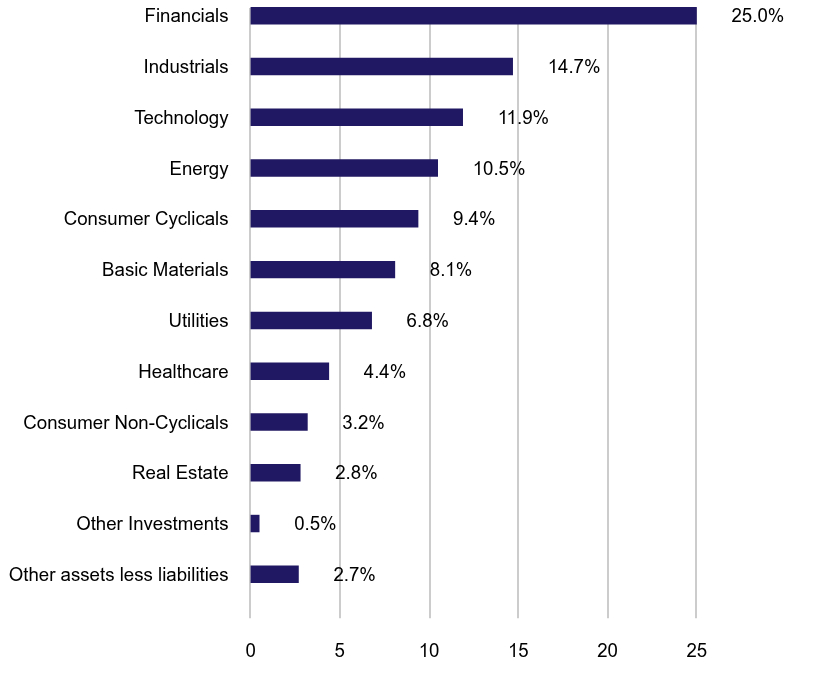
Other assets less liabilities | | 0.6% | Information Technology | | 3.5% | Health Care | | 4.5% | Energy | | 4.6% | Real Estate | | 5.1% | Financials | | 6.6% | Consumer Staples | | 8.3% | Industrials | | 11.1% | Utilities | | 12.5% | Materials | | 12.6% | Consumer Discretionary | | 30.6% |
|
| Largest Holdings [Text Block] |
Top Ten Holdings (% of Total Net Assets)ERO Copper Corp. | | 5.1% |
|---|
Cyrela Brazil Realty SA Empreendimentos e Participacoes | | 3.8% |
|---|
Cia de Saneamento de Minas Gerais Copasa MG | | 3.7% |
|---|
Alupar Investimento SA | | 3.5% |
|---|
Cia De Sanena Do Parana | | 3.1% |
|---|
Iguatemi SA | | 2.8% |
|---|
Cogna Educacao SA | | 2.7% |
|---|
Brava Energia SA | | 2.5% |
|---|
Cury Construtora e Incorporadora SA | | 2.3% |
|---|
Fleury SA | | 2.2% |
|---|
|
| Material Fund Change [Text Block] |
|
| Summary of Change Legend [Text Block] |
|
| Updated Prospectus Web Address |
<span style="box-sizing: border-box; color: rgb(0, 0, 0); display: inline; flex-wrap: nowrap; font-size: 10.6667px; font-weight: 400; grid-area: auto; line-height: 16px; margin: 0px; overflow: visible; text-align: left; text-align-last: auto; white-space-collapse: preserve-breaks;">https://www.vaneck.com/us/en/etf-mutual-fund-finder/etfs/documents/</span>
|
| Accountant Change Statement [Text Block] |
|
| Accountant Change Disagreements [Text Block] |
|
| C000146000 |
|
| Shareholder Report [Line Items] |
|
| Fund Name |
VanEck China Bond ETF
|
| Class Name |
VanEck China Bond ETF
|
| Trading Symbol |
CBON
|
| Security Exchange Name |
NYSEArca
|
| Annual or Semi-Annual Statement [Text Block] |
This annual shareholder report contains important information about the VanEck China Bond ETF (the "Fund") for the period January 1, 2025 to December 31, 2025.
|
| Shareholder Report Annual or Semi-Annual |
Annual Shareholder Report
|
| Additional Information [Text Block] |
You can find additional information about the Fund at https://www.vaneck.com/us/en/etf-mutual-fund-finder/etfs/documents/. You can also request this information by contacting us at 800.826.2333 or info@vaneck.com.
|
| Additional Information Phone Number |
800.826.2333
|
| Additional Information Email |
<span style="box-sizing: border-box; color: rgb(0, 0, 0); display: inline; flex-wrap: nowrap; font-size: 10.6667px; font-weight: 400; grid-area: auto; line-height: 16px; margin: 0px; overflow: visible; text-align: left; text-align-last: auto; white-space-collapse: preserve-breaks;">info@vaneck.com</span>
|
| Additional Information Website |
<span style="box-sizing: border-box; color: rgb(0, 0, 0); display: inline; flex-wrap: nowrap; font-size: 10.6667px; font-weight: 400; grid-area: auto; line-height: 16px; margin: 0px; overflow: visible; text-align: left; text-align-last: auto; white-space-collapse: preserve-breaks;">https://www.vaneck.com/us/en/etf-mutual-fund-finder/etfs/documents/</span>
|
| Expenses [Text Block] |
What were the Fund costs for the last year?(based on a hypothetical $10,000 investment) Fund Name | Costs of a $10,000 investment | Costs paid as a % of a $10,000 investment |
|---|
VanEck China Bond ETF | $52 | 0.50% |
|---|
|
| Expenses Paid, Amount |
$ 52
|
| Expense Ratio, Percent |
0.50%
|
| Factors Affecting Performance [Text Block] |
How did the Fund perform last year?The Fund had a positive return over the period, benefiting primarily from Chinese Renminbi appreciation as the central bank allowed for larger adjustments through the year. Policy banks, sovereign, and corporate bonds all contributed positively to returns over the period. Currency appreciation contributed the most to performance during the period, while movements in local interest rates detracted from performance slightly.
|
| Performance Past Does Not Indicate Future [Text] |
The performance data quoted represents past performance. Past performance is no guarantee of future results.
|
| Line Graph [Table Text Block] |
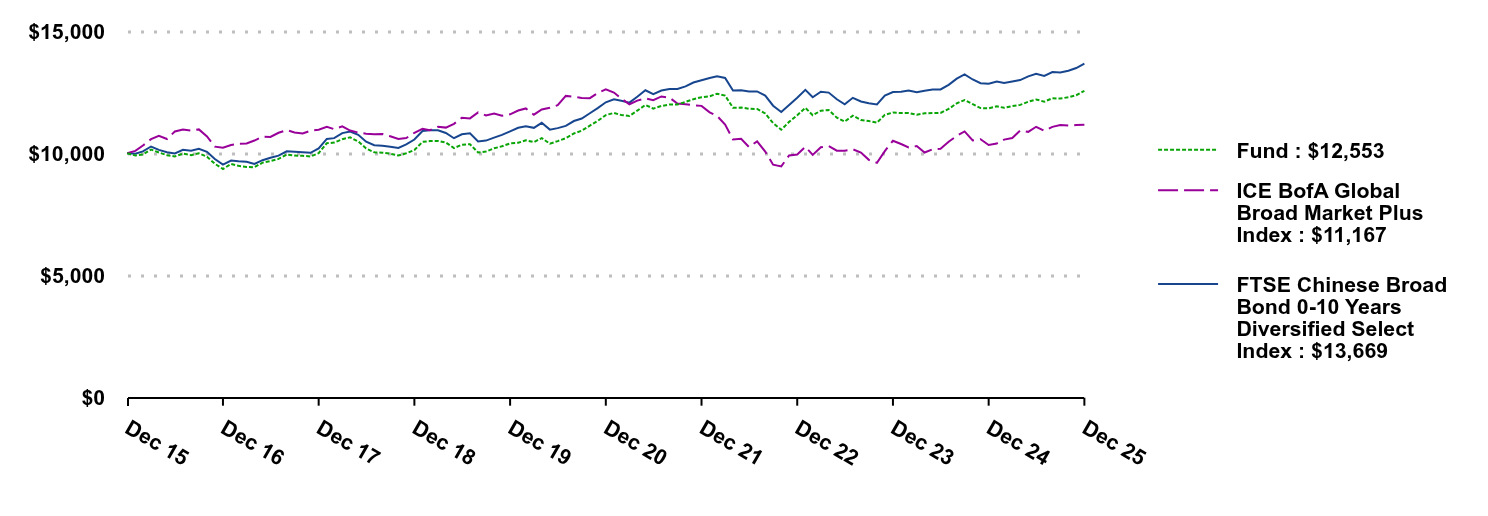 | Fund | ICE BofA Global Broad Market Plus Index | FTSE Chinese Broad Bond 0-10 Years Diversified Select Index |
|---|
Dec 15 | $10,000 | $10,000 | $10,000 |
|---|
Jan 16 | $9,906 | $10,097 | $9,977 |
|---|
Feb 16 | $9,949 | $10,314 | $10,073 |
|---|
Mar 16 | $10,151 | $10,578 | $10,275 |
|---|
Apr 16 | $10,029 | $10,713 | $10,135 |
|---|
May 16 | $9,920 | $10,581 | $10,040 |
|---|
Jun 16 | $9,870 | $10,889 | $9,994 |
|---|
Jul 16 | $9,984 | $10,972 | $10,141 |
|---|
Aug 16 | $9,923 | $10,922 | $10,103 |
|---|
Sep 16 | $9,997 | $10,975 | $10,182 |
|---|
Oct 16 | $9,855 | $10,685 | $10,058 |
|---|
Nov 16 | $9,567 | $10,268 | $9,766 |
|---|
Dec 16 | $9,357 | $10,225 | $9,533 |
|---|
Jan 17 | $9,562 | $10,336 | $9,700 |
|---|
Feb 17 | $9,485 | $10,389 | $9,668 |
|---|
Mar 17 | $9,441 | $10,402 | $9,650 |
|---|
Apr 17 | $9,428 | $10,518 | $9,561 |
|---|
May 17 | $9,615 | $10,673 | $9,716 |
|---|
Jun 17 | $9,678 | $10,664 | $9,813 |
|---|
Jul 17 | $9,768 | $10,838 | $9,901 |
|---|
Aug 17 | $9,945 | $10,947 | $10,081 |
|---|
Sep 17 | $9,902 | $10,851 | $10,063 |
|---|
Oct 17 | $9,895 | $10,808 | $10,037 |
|---|
Nov 17 | $9,866 | $10,921 | $10,016 |
|---|
Dec 17 | $10,004 | $10,961 | $10,195 |
|---|
Jan 18 | $10,411 | $11,082 | $10,584 |
|---|
Feb 18 | $10,434 | $10,984 | $10,617 |
|---|
Mar 18 | $10,575 | $11,101 | $10,822 |
|---|
Apr 18 | $10,648 | $10,929 | $10,883 |
|---|
May 18 | $10,481 | $10,845 | $10,756 |
|---|
Jun 18 | $10,193 | $10,797 | $10,474 |
|---|
Jul 18 | $10,039 | $10,780 | $10,327 |
|---|
Aug 18 | $10,023 | $10,784 | $10,303 |
|---|
Sep 18 | $9,981 | $10,695 | $10,263 |
|---|
Oct 18 | $9,907 | $10,583 | $10,217 |
|---|
Nov 18 | $9,999 | $10,622 | $10,358 |
|---|
Dec 18 | $10,130 | $10,836 | $10,561 |
|---|
Jan 19 | $10,465 | $11,001 | $10,907 |
|---|
Feb 19 | $10,497 | $10,940 | $10,938 |
|---|
Mar 19 | $10,505 | $11,079 | $10,941 |
|---|
Apr 19 | $10,438 | $11,048 | $10,829 |
|---|
May 19 | $10,210 | $11,204 | $10,614 |
|---|
Jun 19 | $10,350 | $11,451 | $10,773 |
|---|
Jul 19 | $10,369 | $11,425 | $10,815 |
|---|
Aug 19 | $10,031 | $11,671 | $10,482 |
|---|
Sep 19 | $10,071 | $11,548 | $10,517 |
|---|
Oct 19 | $10,201 | $11,624 | $10,636 |
|---|
Nov 19 | $10,284 | $11,532 | $10,749 |
|---|
Dec 19 | $10,402 | $11,591 | $10,893 |
|---|
Jan 20 | $10,428 | $11,746 | $11,042 |
|---|
Feb 20 | $10,531 | $11,833 | $11,106 |
|---|
Mar 20 | $10,454 | $11,576 | $11,039 |
|---|
Apr 20 | $10,621 | $11,792 | $11,244 |
|---|
May 20 | $10,391 | $11,857 | $10,966 |
|---|
Jun 20 | $10,496 | $11,963 | $11,027 |
|---|
Jul 20 | $10,613 | $12,344 | $11,119 |
|---|
Aug 20 | $10,808 | $12,304 | $11,317 |
|---|
Sep 20 | $10,922 | $12,263 | $11,422 |
|---|
Oct 20 | $11,130 | $12,251 | $11,636 |
|---|
Nov 20 | $11,322 | $12,463 | $11,843 |
|---|
Dec 20 | $11,560 | $12,617 | $12,083 |
|---|
Jan 21 | $11,650 | $12,483 | $12,204 |
|---|
Feb 21 | $11,561 | $12,235 | $12,144 |
|---|
Mar 21 | $11,524 | $12,004 | $12,070 |
|---|
Apr 21 | $11,742 | $12,153 | $12,313 |
|---|
May 21 | $11,976 | $12,249 | $12,575 |
|---|
Jun 21 | $11,826 | $12,169 | $12,421 |
|---|
Jul 21 | $11,933 | $12,323 | $12,566 |
|---|
Aug 21 | $11,994 | $12,272 | $12,630 |
|---|
Sep 21 | $11,996 | $12,036 | $12,630 |
|---|
Oct 21 | $12,099 | $12,003 | $12,733 |
|---|
Nov 21 | $12,211 | $11,966 | $12,892 |
|---|
Dec 21 | $12,292 | $11,937 | $12,988 |
|---|
Jan 22 | $12,328 | $11,675 | $13,078 |
|---|
Feb 22 | $12,433 | $11,530 | $13,152 |
|---|
Mar 22 | $12,356 | $11,173 | $13,080 |
|---|
Apr 22 | $11,862 | $10,564 | $12,568 |
|---|
May 22 | $11,866 | $10,593 | $12,574 |
|---|
Jun 22 | $11,821 | $10,256 | $12,526 |
|---|
Jul 22 | $11,810 | $10,486 | $12,527 |
|---|
Aug 22 | $11,626 | $10,067 | $12,355 |
|---|
Sep 22 | $11,233 | $9,531 | $11,945 |
|---|
Oct 22 | $10,960 | $9,461 | $11,688 |
|---|
Nov 22 | $11,283 | $9,907 | $11,976 |
|---|
Dec 22 | $11,554 | $9,949 | $12,271 |
|---|
Jan 23 | $11,858 | $10,265 | $12,592 |
|---|
Feb 23 | $11,553 | $9,932 | $12,288 |
|---|
Mar 23 | $11,740 | $10,245 | $12,516 |
|---|
Apr 23 | $11,768 | $10,297 | $12,480 |
|---|
May 23 | $11,455 | $10,102 | $12,206 |
|---|
Jun 23 | $11,295 | $10,104 | $12,001 |
|---|
Jul 23 | $11,540 | $10,161 | $12,267 |
|---|
Aug 23 | $11,359 | $10,029 | $12,117 |
|---|
Sep 23 | $11,318 | $9,730 | $12,045 |
|---|
Oct 23 | $11,248 | $9,607 | $11,998 |
|---|
Nov 23 | $11,572 | $10,088 | $12,355 |
|---|
Dec 23 | $11,664 | $10,509 | $12,504 |
|---|
Jan 24 | $11,642 | $10,376 | $12,519 |
|---|
Feb 24 | $11,646 | $10,238 | $12,563 |
|---|
Mar 24 | $11,576 | $10,295 | $12,497 |
|---|
Apr 24 | $11,631 | $10,029 | $12,560 |
|---|
May 24 | $11,646 | $10,165 | $12,603 |
|---|
Jun 24 | $11,648 | $10,185 | $12,609 |
|---|
Jul 24 | $11,813 | $10,469 | $12,797 |
|---|
Aug 24 | $12,041 | $10,712 | $13,050 |
|---|
Sep 24 | $12,178 | $10,893 | $13,224 |
|---|
Oct 24 | $12,006 | $10,526 | $13,017 |
|---|
Nov 24 | $11,847 | $10,571 | $12,865 |
|---|
Dec 24 | $11,838 | $10,335 | $12,839 |
|---|
Jan 25 | $11,921 | $10,397 | $12,931 |
|---|
Feb 25 | $11,857 | $10,558 | $12,875 |
|---|
Mar 25 | $11,926 | $10,622 | $12,935 |
|---|
Apr 25 | $11,977 | $10,926 | $12,994 |
|---|
May 25 | $12,104 | $10,875 | $13,143 |
|---|
Jun 25 | $12,201 | $11,082 | $13,253 |
|---|
Jul 25 | $12,108 | $10,919 | $13,164 |
|---|
Aug 25 | $12,250 | $11,078 | $13,320 |
|---|
Sep 25 | $12,236 | $11,154 | $13,299 |
|---|
Oct 25 | $12,292 | $11,129 | $13,375 |
|---|
Nov 25 | $12,372 | $11,156 | $13,485 |
|---|
Dec 25 | $12,553 | $11,167 | $13,669 |
|---|
|
| Average Annual Return [Table Text Block] |
Average Annual Total Returns . | 1 Year | 5 Years | 10 Years |
|---|
VanEck China Bond ETF | 6.04% | 1.66% | 2.30% |
|---|
FTSE Chinese Broad Bond 0-10 Years Diversified Select Index | 6.46% | 2.50% | 3.17% |
|---|
ICE BofA Global Broad Market Plus Index | 8.05% | (2.41)% | 1.11% |
|---|
FTSE Chinese Broad Bond 0-10 Years Diversified Select Index replaced the ChinaBond China High Quality Bond Index effective May 31, 2024. Index history prior to May 31, 2024 reflects the performance of the ChinaBond China High Quality Bond Index. The performance data quoted represents past performance. Past performance is no guarantee of future results. Performance information for the Fund may reflect temporary fee waivers, if applicable. These returns do not reflect the deduction of taxes that a shareholder would pay on Fund dividends and distributions or the sale of Fund shares. Visit vaneck.com for more recent performance information. Effective May 31, 2024, the index that the Fund seeks to track changed from the ChinaBond China High Quality Bond Index to the FTSE Chinese Broad Bond 0 – 10 Diversified Select Index. |
| No Deduction of Taxes [Text Block] |
|
| Performance Table Market Index Changed [Text Block] |
Effective May 31, 2024, the index that the Fund seeks to track changed from the ChinaBond China High Quality Bond Index to the FTSE Chinese Broad Bond 0 – 10 Diversified Select Index.
|
| Material Change Description [Text Block] |
|
| Updated Performance Information Location [Text Block] |
|
| AssetsNet |
$ 18,344,486
|
| Holdings Count | Holding |
29
|
| Advisory Fees Paid, Amount |
$ 0
|
| InvestmentCompanyPortfolioTurnover |
48.00%
|
| Additional Fund Statistics [Text Block] |
- Total Net Assets$18,344,486
- Number of Portfolio Holdings29
- Portfolio Turnover Rate48%
- Advisory Fees Paid$-
|
| Additional Fund Statistics Significance or Limits [Text Block] |
|
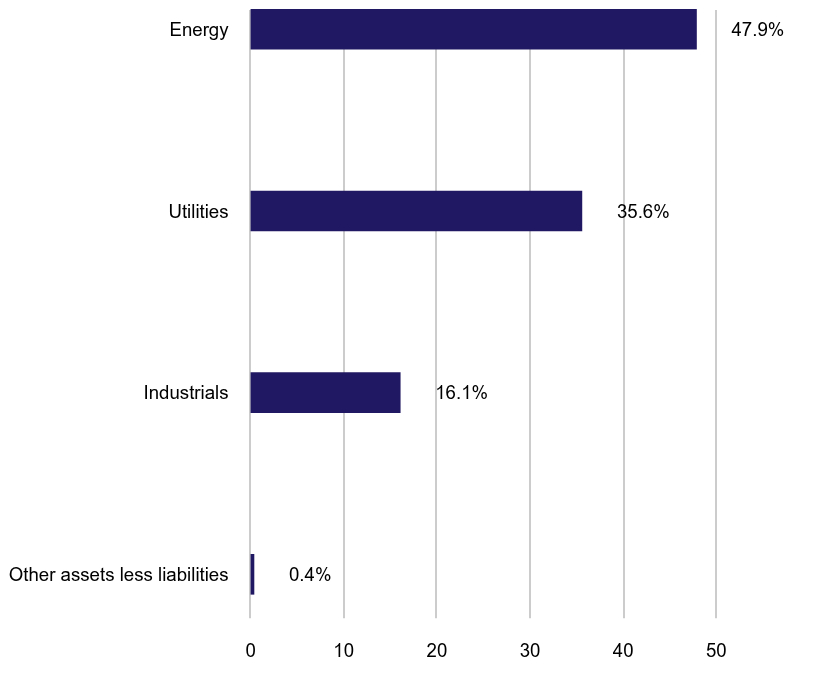
| Holdings [Text Block] |
Portfolio Composition (% of Total Net Assets)Value | Value | Value |
|---|
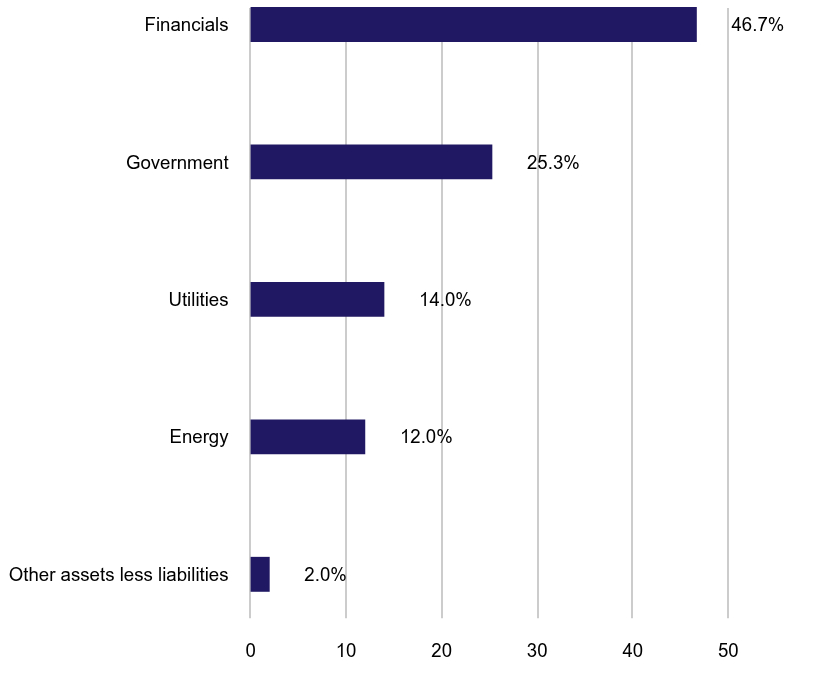
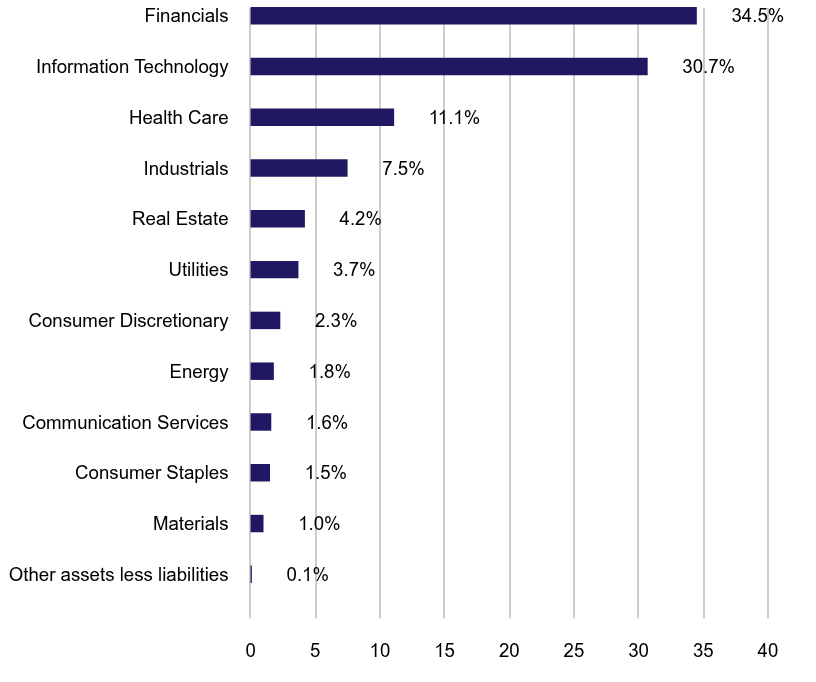
Other assets less liabilities | | 2.0% | Energy | | 12.0% | Utilities | | 14.0% | Government | | 25.3% | Financials | | 46.7% |
|
| Largest Holdings [Text Block] |
Top Ten Holdings (% of Total Net Assets)China Petrochemical Corp., 2.00%, 8/9/2029 | | 7.8% |
|---|
Agricultural Development Bank of China, 2.96%, 4/17/2030 | | 6.6% |
|---|
China Government Bond, 2.67%, 11/25/2033 | | 5.8% |
|---|
China Government Bond, 1.62%, 8/15/2027 | | 5.6% |
|---|
China Everbright Bank Co. Ltd., 2.72%, 9/25/2026 | | 4.6% |
|---|
Bank of Communications Co. Ltd., 2.70%, 9/26/2026 | | 4.6% |
|---|
State Grid Corp. of China, 2.88%, 8/30/2027 | | 4.4% |
|---|
China Petroleum & Chemical Corp., 3.20%, 7/27/2026 | | 4.1% |
|---|
China Development Bank, 3.45%, 9/20/2029 | | 4.0% |
|---|
China Development Bank, 3.48%, 1/8/2029 | | 3.7% |
|---|
|
| Material Fund Change [Text Block] |
|
| Summary of Change Legend [Text Block] |
|
| Updated Prospectus Web Address |
<span style="box-sizing: border-box; color: rgb(0, 0, 0); display: inline; flex-wrap: nowrap; font-size: 10.6667px; font-weight: 400; grid-area: auto; line-height: 16px; margin: 0px; overflow: visible; text-align: left; text-align-last: auto; white-space-collapse: preserve-breaks;">https://www.vaneck.com/us/en/etf-mutual-fund-finder/etfs/documents/</span>
|
| Accountant Change Statement [Text Block] |
|
| Accountant Change Disagreements [Text Block] |
|
| C000138289 |
|
| Shareholder Report [Line Items] |
|
| Fund Name |
VanEck ChiNext ETF
|
| Class Name |
VanEck ChiNext ETF
|
| Trading Symbol |
CNXT
|
| Security Exchange Name |
NYSEArca
|
| Annual or Semi-Annual Statement [Text Block] |
This annual shareholder report contains important information about the VanEck ChiNext ETF (the "Fund") for the period January 1, 2025 to December 31, 2025.
|
| Shareholder Report Annual or Semi-Annual |
Annual Shareholder Report
|
| Additional Information [Text Block] |
You can find additional information about the Fund at https://www.vaneck.com/us/en/etf-mutual-fund-finder/etfs/documents/. You can also request this information by contacting us at 800.826.2333 or info@vaneck.com.
|
| Additional Information Phone Number |
800.826.2333
|
| Additional Information Email |
<span style="box-sizing: border-box; color: rgb(0, 0, 0); display: inline; flex-wrap: nowrap; font-size: 10.6667px; font-weight: 400; grid-area: auto; line-height: 16px; margin: 0px; overflow: visible; text-align: left; text-align-last: auto; white-space-collapse: preserve-breaks;">info@vaneck.com</span>
|
| Additional Information Website |
<span style="box-sizing: border-box; color: rgb(0, 0, 0); display: inline; flex-wrap: nowrap; font-size: 10.6667px; font-weight: 400; grid-area: auto; line-height: 16px; margin: 0px; overflow: visible; text-align: left; text-align-last: auto; white-space-collapse: preserve-breaks;">https://www.vaneck.com/us/en/etf-mutual-fund-finder/etfs/documents/</span>
|
| Expenses [Text Block] |
What were the Fund costs for the last year?(based on a hypothetical $10,000 investment) Fund Name | Costs of a $10,000 investment | Costs paid as a % of a $10,000 investment |
|---|
VanEck ChiNext ETF | $84 | 0.65% |
|---|
|
| Expenses Paid, Amount |
$ 84
|
| Expense Ratio, Percent |
0.65%
|
| Factors Affecting Performance [Text Block] |
How did the Fund perform last year?The Fund posted a positive return over the period, supported by a sharp rebound in Chinese technology and innovation-oriented companies as policy support improved, valuations recovered from depressed levels and investor sentiment strengthened. The Information Technology sector contributed the most to the Fund’s performance during the period, followed by Industrials and Materials. The leading individual contributors to performance were Zhongji Innolight Co., Ltd., Eoptolink Technology Inc., Ltd. and Contemporary Amperex Technology Co., Ltd. The Healthcare sector detracted the most from the Fund’s performance during the period, followed by Consumer Discretionary. The leading individual detractors from performance were Shenzhen Mindray Bio-Medical Electronics Co., Ltd., East Money Information Co., Ltd and Chongqing Zhifei Biological Products Co., Ltd.
|
| Performance Past Does Not Indicate Future [Text] |
The performance data quoted represents past performance. Past performance is no guarantee of future results.
|
| Line Graph [Table Text Block] |
 | Fund | MSCI ACWI Index | ChiNext Index |
|---|
Dec 15 | $10,000 | $10,000 | $10,000 |
|---|
Jan 16 | $7,175 | $9,397 | $7,524 |
|---|
Feb 16 | $6,715 | $9,332 | $7,170 |
|---|
Mar 16 | $8,170 | $10,024 | $8,424 |
|---|
Apr 16 | $7,856 | $10,172 | $8,195 |
|---|
May 16 | $7,832 | $10,185 | $8,141 |
|---|
Jun 16 | $8,115 | $10,123 | $8,263 |
|---|
Jul 16 | $7,904 | $10,559 | $8,044 |
|---|
Aug 16 | $8,071 | $10,595 | $8,260 |
|---|
Sep 16 | $7,851 | $10,660 | $8,012 |
|---|
Oct 16 | $7,779 | $10,479 | $8,032 |
|---|
Nov 16 | $7,714 | $10,558 | $8,008 |
|---|
Dec 16 | $6,996 | $10,786 | $7,277 |
|---|
Jan 17 | $6,981 | $11,081 | $7,271 |
|---|
Feb 17 | $7,209 | $11,392 | $7,495 |
|---|
Mar 17 | $7,223 | $11,532 | $7,505 |
|---|
Apr 17 | $7,080 | $11,711 | $7,388 |
|---|
May 17 | $7,053 | $11,970 | $7,347 |
|---|
Jun 17 | $7,511 | $12,024 | $7,830 |
|---|
Jul 17 | $7,520 | $12,360 | $7,852 |
|---|
Aug 17 | $8,103 | $12,408 | $8,421 |
|---|
Sep 17 | $8,201 | $12,647 | $8,526 |
|---|
Oct 17 | $8,524 | $12,910 | $8,888 |
|---|
Nov 17 | $8,237 | $13,160 | $8,626 |
|---|
Dec 17 | $8,350 | $13,372 | $8,758 |
|---|
Jan 18 | $8,475 | $14,127 | $8,993 |
|---|
Feb 18 | $8,362 | $13,533 | $8,974 |
|---|
Mar 18 | $8,473 | $13,244 | $9,171 |
|---|
Apr 18 | $7,926 | $13,370 | $8,485 |
|---|
May 18 | $7,940 | $13,387 | $8,543 |
|---|
Jun 18 | $7,023 | $13,314 | $7,578 |
|---|
Jul 18 | $6,754 | $13,716 | $7,237 |
|---|
Aug 18 | $6,169 | $13,824 | $6,631 |
|---|
Sep 18 | $6,039 | $13,884 | $6,514 |
|---|
Oct 18 | $5,233 | $12,843 | $5,639 |
|---|
Nov 18 | $5,398 | $13,031 | $5,817 |
|---|
Dec 18 | $5,033 | $12,113 | $5,443 |
|---|
Jan 19 | $5,276 | $13,070 | $5,687 |
|---|
Feb 19 | $6,457 | $13,419 | $7,018 |
|---|
Mar 19 | $6,990 | $13,588 | $7,603 |
|---|
Apr 19 | $6,649 | $14,047 | $7,219 |
|---|
May 19 | $5,902 | $13,214 | $6,447 |
|---|
Jun 19 | $6,205 | $14,079 | $6,754 |
|---|
Jul 19 | $6,360 | $14,120 | $6,984 |
|---|
Aug 19 | $6,267 | $13,785 | $6,842 |
|---|
Sep 19 | $6,338 | $14,075 | $6,925 |
|---|
Oct 19 | $6,651 | $14,460 | $7,294 |
|---|
Nov 19 | $6,601 | $14,813 | $7,213 |
|---|
Dec 19 | $7,188 | $15,335 | $7,848 |
|---|
Jan 20 | $7,339 | $15,166 | $8,323 |
|---|
Feb 20 | $7,744 | $13,941 | $8,635 |
|---|
Mar 20 | $6,760 | $12,059 | $7,754 |
|---|
Apr 20 | $7,408 | $13,350 | $8,554 |
|---|
May 20 | $7,337 | $13,931 | $8,328 |
|---|
Jun 20 | $8,684 | $14,376 | $9,867 |
|---|
Jul 20 | $10,164 | $15,137 | $11,585 |
|---|
Aug 20 | $10,257 | $16,063 | $11,706 |
|---|
Sep 20 | $9,884 | $15,545 | $11,186 |
|---|
Oct 20 | $10,446 | $15,167 | $11,922 |
|---|
Nov 20 | $10,586 | $17,037 | $12,113 |
|---|
Dec 20 | $11,804 | $17,828 | $13,476 |
|---|
Jan 21 | $12,358 | $17,747 | $14,269 |
|---|
Feb 21 | $11,837 | $18,158 | $13,643 |
|---|
Mar 21 | $10,790 | $18,643 | $12,407 |
|---|
Apr 21 | $11,780 | $19,458 | $13,703 |
|---|
May 21 | $12,483 | $19,761 | $14,678 |
|---|
Jun 21 | $13,114 | $20,021 | $15,201 |
|---|
Jul 21 | $12,692 | $20,159 | $14,648 |
|---|
Aug 21 | $12,216 | $20,664 | $14,090 |
|---|
Sep 21 | $12,244 | $19,810 | $14,194 |
|---|
Oct 21 | $12,899 | $20,821 | $14,915 |
|---|
Nov 21 | $13,104 | $20,320 | $15,112 |
|---|
Dec 21 | $12,773 | $21,133 | $14,705 |
|---|
Jan 22 | $11,348 | $20,095 | $12,887 |
|---|
Feb 22 | $11,247 | $19,576 | $12,869 |
|---|
Mar 22 | $10,175 | $20,000 | $11,809 |
|---|
Apr 22 | $8,431 | $18,399 | $9,872 |
|---|
May 22 | $8,770 | $18,420 | $10,194 |
|---|
Jun 22 | $10,278 | $16,868 | $11,879 |
|---|
Jul 22 | $9,694 | $18,046 | $11,214 |
|---|
Aug 22 | $9,051 | $17,381 | $10,548 |
|---|
Sep 22 | $7,798 | $15,717 | $9,144 |
|---|
Oct 22 | $7,526 | $16,666 | $8,795 |
|---|
Nov 22 | $8,165 | $17,958 | $9,290 |
|---|
Dec 22 | $8,240 | $17,252 | $9,545 |
|---|
Jan 23 | $9,347 | $18,488 | $10,821 |
|---|
Feb 23 | $8,478 | $17,958 | $9,894 |
|---|
Mar 23 | $8,479 | $18,512 | $9,905 |
|---|
Apr 23 | $8,184 | $18,778 | $9,524 |
|---|
May 23 | $7,500 | $18,577 | $8,768 |
|---|
Jun 23 | $7,468 | $19,656 | $8,698 |
|---|
Jul 23 | $7,678 | $20,375 | $8,926 |
|---|
Aug 23 | $7,068 | $19,806 | $8,219 |
|---|
Sep 23 | $6,747 | $18,987 | $7,825 |
|---|
Oct 23 | $6,553 | $18,416 | $7,660 |
|---|
Nov 23 | $6,567 | $20,116 | $7,700 |
|---|
Dec 23 | $6,484 | $21,082 | $7,615 |
|---|
Jan 24 | $5,363 | $21,206 | $6,250 |
|---|
Feb 24 | $6,116 | $22,116 | $7,159 |
|---|
Mar 24 | $6,073 | $22,810 | $7,158 |
|---|
Apr 24 | $6,254 | $22,057 | $7,354 |
|---|
May 24 | $6,097 | $22,953 | $7,163 |
|---|
Jun 24 | $5,659 | $23,464 | $6,662 |
|---|
Jul 24 | $5,753 | $23,843 | $6,748 |
|---|
Aug 24 | $5,479 | $24,448 | $6,447 |
|---|
Sep 24 | $7,567 | $25,016 | $8,995 |
|---|
Oct 24 | $7,629 | $24,455 | $8,785 |
|---|
Nov 24 | $7,777 | $25,369 | $8,901 |
|---|
Dec 24 | $7,330 | $24,769 | $8,470 |
|---|
Jan 25 | $7,164 | $25,600 | $8,228 |
|---|
Feb 25 | $7,536 | $25,446 | $8,626 |
|---|
Mar 25 | $7,315 | $24,441 | $8,408 |
|---|
Apr 25 | $6,785 | $24,669 | $7,810 |
|---|
May 25 | $6,971 | $26,087 | $8,098 |
|---|
Jun 25 | $7,620 | $27,258 | $8,805 |
|---|
Jul 25 | $8,141 | $27,628 | $9,474 |
|---|
Aug 25 | $10,274 | $28,310 | $11,879 |
|---|
Sep 25 | $11,585 | $29,336 | $13,317 |
|---|
Oct 25 | $11,362 | $29,992 | $13,142 |
|---|
Nov 25 | $11,033 | $29,989 | $12,664 |
|---|
Dec 25 | $11,650 | $30,302 | $13,459 |
|---|
|
| Average Annual Return [Table Text Block] |
Average Annual Total Returns . | 1 Year | 5 Years | 10 Years |
|---|
VanEck ChiNext ETF | 58.93% | (0.26)% | 1.54% |
|---|
ChiNext Index | 58.91% | (0.03)% | 3.02% |
|---|
MSCI ACWI Index | 22.34% | 11.19% | 11.72% |
|---|
ChiNext Index replaced the SME-ChiNext Index effective December 10, 2021. Index history prior to December 10, 2021 reflects the performance of the SME-ChiNext Index. The performance data quoted represents past performance. Past performance is no guarantee of future results. Performance information for the Fund may reflect temporary fee waivers, if applicable. These returns do not reflect the deduction of taxes that a shareholder would pay on Fund dividends and distributions or the sale of Fund shares. Visit vaneck.com for more recent performance information. |
| No Deduction of Taxes [Text Block] |
|
| Performance Table Market Index Changed [Text Block] |
|
| Material Change Description [Text Block] |
|
| Updated Performance Information Location [Text Block] |
|
| AssetsNet |
$ 52,882,300
|
| Holdings Count | Holding |
98
|
| Advisory Fees Paid, Amount |
$ 50,778
|
| InvestmentCompanyPortfolioTurnover |
48.00%
|
| Additional Fund Statistics [Text Block] |
- Total Net Assets$52,882,300
- Number of Portfolio Holdings98
- Portfolio Turnover Rate48%
- Advisory Fees Paid$50,778
|
| Additional Fund Statistics Significance or Limits [Text Block] |
|
| Holdings [Text Block] |
Portfolio Composition (% of Total Net Assets)Value | Value | Value |
|---|
Other assets less liabilities | | 0.1% | Consumer Discretionary | | 1.2% | Communication Services | | 2.2% | Consumer Staples | | 3.0% | Materials | | 3.4% | Financials | | 7.9% | Health Care | | 8.8% | Industrials | | 33.0% | Information Technology | | 40.4% |
|
| Largest Holdings [Text Block] |
Top Ten Holdings (% of Total Net Assets)Contemporary Amperex Technology Co. Ltd. | | 18.1% |
|---|
Zhongji Innolight Co. Ltd. | | 10.0% |
|---|
Eoptolink Technology, Inc. Ltd. | | 7.3% |
|---|
East Money Information Co. Ltd. | | 5.7% |
|---|
Sungrow Power Supply Co. Ltd. | | 4.9% |
|---|
Victory Giant Technology Huizhou Co. Ltd. | | 3.3% |
|---|
Shenzhen Inovance Technology Co. Ltd. | | 2.8% |
|---|
Shenzhen Mindray Bio-Medical Electronics Co. Ltd. | | 2.2% |
|---|
Wens Foodstuff Group Co. Ltd. | | 1.8% |
|---|
Suzhou TFC Optical Communication Co. Ltd. | | 1.7% |
|---|
|
| Material Fund Change [Text Block] |
|
| Summary of Change Legend [Text Block] |
|
| Updated Prospectus Web Address |
<span style="box-sizing: border-box; color: rgb(0, 0, 0); display: inline; flex-wrap: nowrap; font-size: 10.6667px; font-weight: 400; grid-area: auto; line-height: 16px; margin: 0px; overflow: visible; text-align: left; text-align-last: auto; white-space-collapse: preserve-breaks;">https://www.vaneck.com/us/en/etf-mutual-fund-finder/etfs/documents/</span>
|
| Accountant Change Statement [Text Block] |
|
| Accountant Change Disagreements [Text Block] |
|
| C000236336 |
|
| Shareholder Report [Line Items] |
|
| Fund Name |
VanEck CLO ETF
|
| Class Name |
VanEck CLO ETF
|
| Trading Symbol |
CLOI
|
| Security Exchange Name |
NYSEArca
|
| Annual or Semi-Annual Statement [Text Block] |
This annual shareholder report contains important information about the VanEck CLO ETF (the "Fund") for the period January 1, 2025 to December 31, 2025.
|
| Shareholder Report Annual or Semi-Annual |
Annual Shareholder Report
|
| Additional Information [Text Block] |
You can find additional information about the Fund at https://www.vaneck.com/us/en/etf-mutual-fund-finder/etfs/documents/. You can also request this information by contacting us at 800.826.2333 or info@vaneck.com.
|
| Material Fund Change Notice [Text Block] |
This report describes material changes to the Fund that occurred during the reporting period.
|
| Additional Information Phone Number |
800.826.2333
|
| Additional Information Email |
<span style="box-sizing: border-box; color: rgb(0, 0, 0); display: inline; flex-wrap: nowrap; font-size: 10.6667px; font-weight: 400; grid-area: auto; line-height: 16px; margin: 0px; overflow: visible; text-align: left; text-align-last: auto; white-space-collapse: preserve-breaks;">info@vaneck.com</span>
|
| Additional Information Website |
<span style="box-sizing: border-box; color: rgb(0, 0, 0); display: inline; flex-wrap: nowrap; font-size: 10.6667px; font-weight: 400; grid-area: auto; line-height: 16px; margin: 0px; overflow: visible; text-align: left; text-align-last: auto; white-space-collapse: preserve-breaks;">https://www.vaneck.com/us/en/etf-mutual-fund-finder/etfs/documents/</span>
|
| Expenses [Text Block] |
What were the Fund costs for the last year?(based on a hypothetical $10,000 investment) Fund Name | Costs of a $10,000 investment | Costs paid as a % of a $10,000 investment |
|---|
VanEck CLO ETF | $40 | 0.39% |
|---|
|
| Expenses Paid, Amount |
$ 40
|
| Expense Ratio, Percent |
0.39%
|
| Factors Affecting Performance [Text Block] |
How did the Fund perform last year?Strong collateralized loan obligation total returns were driven by high interest rates, even as the Federal Reserve restarted its easing cycle in September, and benefited from spread tightening. The Fund outperformed its benchmark, the J.P. Morgan CLO Index, over the period. AAA, single-A and BB rated CLOs contributed positively to returns relative to the benchmark, while AA and BBB rated CLOs detracted from relative performance.
|
| Performance Past Does Not Indicate Future [Text] |
The performance data quoted represents past performance. Past performance is no guarantee of future results.
|
| Line Graph [Table Text Block] |
 | Fund | ICE BofA US Broad Market Index | J.P. Morgan CLO IG Index | J.P. Morgan Collateralized Loan Obligation Index |
|---|
Jun 22 | $10,000 | $10,000 | $10,000 | $10,000 |
|---|
Jun 22 | $10,008 | $10,186 | $9,982 | $9,978 |
|---|
Jul 22 | $10,072 | $10,422 | $10,036 | $10,035 |
|---|
Aug 22 | $10,171 | $10,139 | $10,116 | $10,126 |
|---|
Sep 22 | $10,010 | $9,692 | $9,983 | $9,967 |
|---|
Oct 22 | $10,024 | $9,559 | $10,016 | $10,000 |
|---|
Nov 22 | $10,218 | $9,906 | $10,191 | $10,186 |
|---|
Dec 22 | $10,326 | $9,864 | $10,271 | $10,269 |
|---|
Jan 23 | $10,500 | $10,161 | $10,425 | $10,436 |
|---|
Feb 23 | $10,588 | $9,906 | $10,488 | $10,496 |
|---|
Mar 23 | $10,579 | $10,157 | $10,466 | $10,472 |
|---|
Apr 23 | $10,662 | $10,222 | $10,559 | $10,571 |
|---|
May 23 | $10,703 | $10,110 | $10,611 | $10,621 |
|---|
Jun 23 | $10,798 | $10,074 | $10,709 | $10,726 |
|---|
Jul 23 | $10,919 | $10,065 | $10,871 | $10,901 |
|---|
Aug 23 | $10,990 | $10,003 | $10,950 | $10,988 |
|---|
Sep 23 | $11,066 | $9,754 | $11,016 | $11,054 |
|---|
Oct 23 | $11,103 | $9,603 | $11,054 | $11,090 |
|---|
Nov 23 | $11,203 | $10,024 | $11,175 | $11,229 |
|---|
Dec 23 | $11,293 | $10,396 | $11,287 | $11,352 |
|---|
Jan 24 | $11,381 | $10,384 | $11,382 | $11,459 |
|---|
Feb 24 | $11,449 | $10,241 | $11,451 | $11,531 |
|---|
Mar 24 | $11,550 | $10,328 | $11,523 | $11,614 |
|---|
Apr 24 | $11,621 | $10,078 | $11,601 | $11,697 |
|---|
May 24 | $11,728 | $10,249 | $11,690 | $11,797 |
|---|
Jun 24 | $11,786 | $10,347 | $11,745 | $11,855 |
|---|
Jul 24 | $11,857 | $10,587 | $11,819 | $11,933 |
|---|
Aug 24 | $11,930 | $10,737 | $11,880 | $11,991 |
|---|
Sep 24 | $12,001 | $10,882 | $11,955 | $12,073 |
|---|
Oct 24 | $12,068 | $10,616 | $12,026 | $12,152 |
|---|
Nov 24 | $12,146 | $10,722 | $12,093 | $12,225 |
|---|
Dec 24 | $12,212 | $10,549 | $12,158 | $12,294 |
|---|
Jan 25 | $12,306 | $10,610 | $12,236 | $12,378 |
|---|
Feb 25 | $12,346 | $10,840 | $12,274 | $12,420 |
|---|
Mar 25 | $12,356 | $10,843 | $12,290 | $12,426 |
|---|
Apr 25 | $12,366 | $10,883 | $12,321 | $12,455 |
|---|
May 25 | $12,491 | $10,805 | $12,429 | $12,577 |
|---|
Jun 25 | $12,550 | $10,970 | $12,499 | $12,650 |
|---|
Jul 25 | $12,621 | $10,947 | $12,562 | $12,720 |
|---|
Aug 25 | $12,688 | $11,076 | $12,624 | $12,785 |
|---|
Sep 25 | $12,749 | $11,196 | $12,688 | $12,853 |
|---|
Oct 25 | $12,802 | $11,267 | $12,736 | $12,900 |
|---|
Nov 25 | $12,801 | $11,336 | $12,788 | $12,949 |
|---|
Dec 25 | $12,916 | $11,303 | $12,851 | $13,016 |
|---|
|
| Average Annual Return [Table Text Block] |
Average Annual Total Returns . | 1 Year | Life* |
|---|
VanEck CLO ETF | 5.76% | 7.52% |
|---|
J.P. Morgan CLO IG Index | 5.70% | 7.37% |
|---|
ICE BofA US Broad Market Index | 7.15% | 3.53% |
|---|
J.P. Morgan Collateralized Loan Obligation Index | 5.87% | 7.75% |
|---|
* Inception of Fund: 06/21/2022. The performance data quoted represents past performance. Past performance is no guarantee of future results. Performance information for the Fund may reflect temporary fee waivers, if applicable. These returns do not reflect the deduction of taxes that a shareholder would pay on Fund dividends and distributions or the sale of Fund shares. Visit vaneck.com for more recent performance information. |
| Performance Inception Date |
Jun. 21, 2022
|
| No Deduction of Taxes [Text Block] |
|
| Performance Table Market Index Changed [Text Block] |
|
| Material Change Description [Text Block] |
|
| Material Change Date |
Dec. 31, 2025
|
| Updated Performance Information Location [Text Block] |
|
| AssetsNet |
$ 1,324,486,229
|
| Holdings Count | Holding |
160
|
| Advisory Fees Paid, Amount |
$ 4,178,564
|
| InvestmentCompanyPortfolioTurnover |
39.00%
|
| Additional Fund Statistics [Text Block] |
- Total Net Assets$1,324,486,229
- Number of Portfolio Holdings160
- Portfolio Turnover Rate39%
- Advisory Fees Paid$4,178,564
|
| Additional Fund Statistics Significance or Limits [Text Block] |
|
| Holdings [Text Block] |
Portfolio Composition (% of Total Net Assets)Value | Value | Value |
|---|
Other assets less liabilities | | 1.4% | Government | | 6.6% | Collateralized Loan Obligations | | 92.0% |
|
| Largest Holdings [Text Block] |
Top Ten Holdings Footnote Reference* (% of Total Net Assets)Signal Peak CLO 4 Ltd., 5.81%, 10/26/2034 | | 2.8% |
|---|
Regatta VI Funding Ltd., 5.21%, 10/20/2038 | | 2.8% |
|---|
Neuberger Berman Loan Advisers CLO 38 Ltd., 5.28%, 10/20/2036 | | 2.0% |
|---|
Trinitas CLO XIX Ltd., 4.99%, 10/20/2033 | | 2.0% |
|---|
Octagon 64 Ltd., 5.57%, 7/21/2037 | | 1.9% |
|---|
Neuberger Berman Loan Advisers CLO 42 Ltd., 5.29%, 7/16/2036 | | 1.7% |
|---|
Sagard-Halseypoint CLO 10 Ltd., 5.63%, 10/20/2038 | | 1.7% |
|---|
KKR CLO 36 Ltd., 5.92%, 10/15/2034 | | 1.7% |
|---|
RR 20 Ltd., 5.45%, 7/15/2037 | | 1.7% |
|---|
Silver Rock CLO II Ltd., 5.48%, 1/20/2035 | | 1.6% |
|---|
| Footnote | Description | Footnote* | Excludes short-term investments |
|
| Material Fund Change [Text Block] |
The following material fund change occurred during the period ended December 31, 2025: Effective September 8, 2025, the Fund's contractual management fee rate was reduced from 0.40% to 0.36%. |
| Material Fund Change Expenses [Text Block] |
Effective September 8, 2025, the Fund's contractual management fee rate was reduced from 0.40% to 0.36%.
|
| Summary of Change Legend [Text Block] |
The following material fund change occurred during the period ended December 31, 2025:
|
| Updated Prospectus Web Address |
<span style="box-sizing: border-box; color: rgb(0, 0, 0); display: inline; flex-wrap: nowrap; font-size: 10.6667px; font-weight: 400; grid-area: auto; line-height: 16px; margin: 0px; overflow: visible; text-align: left; text-align-last: auto; white-space-collapse: preserve-breaks;">https://www.vaneck.com/us/en/etf-mutual-fund-finder/etfs/documents/</span>
|
| Accountant Change Statement [Text Block] |
|
| Accountant Change Disagreements [Text Block] |
|
| C000240390 |
|
| Shareholder Report [Line Items] |
|
| Fund Name |
VanEck CMCI Commodity Strategy ETF
|
| Class Name |
VanEck CMCI Commodity Strategy ETF
|
| Trading Symbol |
CMCI
|
| Security Exchange Name |
CboeBZX
|
| Annual or Semi-Annual Statement [Text Block] |
This annual shareholder report contains important information about the VanEck CMCI Commodity Strategy ETF (the "Fund") for the period January 1, 2025 to December 31, 2025.
|
| Shareholder Report Annual or Semi-Annual |
Annual Shareholder Report
|
| Additional Information [Text Block] |
You can find additional information about the Fund at https://www.vaneck.com/us/en/etf-mutual-fund-finder/etfs/documents/. You can also request this information by contacting us at 800.826.2333 or info@vaneck.com.
|
| Additional Information Phone Number |
800.826.2333
|
| Additional Information Email |
<span style="box-sizing: border-box; color: rgb(0, 0, 0); display: inline; flex-wrap: nowrap; font-size: 10.6667px; font-weight: 400; grid-area: auto; line-height: 16px; margin: 0px; overflow: visible; text-align: left; text-align-last: auto; white-space-collapse: preserve-breaks;">info@vaneck.com</span>
|
| Additional Information Website |
<span style="box-sizing: border-box; color: rgb(0, 0, 0); display: inline; flex-wrap: nowrap; font-size: 10.6667px; font-weight: 400; grid-area: auto; line-height: 16px; margin: 0px; overflow: visible; text-align: left; text-align-last: auto; white-space-collapse: preserve-breaks;">https://www.vaneck.com/us/en/etf-mutual-fund-finder/etfs/documents/</span>
|
| Expenses [Text Block] |
What were the Fund costs for the last year?(based on a hypothetical $10,000 investment) Fund Name | Costs of a $10,000 investment | Costs paid as a % of a $10,000 investment |
|---|
VanEck CMCI Commodity Strategy ETF | $70 | 0.67% |
|---|
|
| Expenses Paid, Amount |
$ 70
|
| Expense Ratio, Percent |
0.67%
|
| Factors Affecting Performance [Text Block] |
How did the Fund perform last year?The Fund utilized commodity index-linked swaps as an effective means of gaining exposure to the UBS Constant Maturity Commodity Total Return Index. Commodities showed mixed performance with metals standing out on the upside and some energy and agricultural commodities lagging. Inflationary pressures, demand, and geopolitical risks supported prices, while weaker-than-expected economic conditions in China and softer global growth expectations weighed on certain commodity markets at points during the period. Industrial metals and precious metals were the Fund’s largest contributors, particularly copper and aluminum, while gold and silver also contributed meaningfully. Energy and agricultural commodities were the Fund’s largest detractors, as declining oil prices and weakness in key crops reflected ample global supply and favorable growing conditions.
|
| Performance Past Does Not Indicate Future [Text] |
The performance data quoted represents past performance. Past performance is no guarantee of future results.
|
| Line Graph [Table Text Block] |
How did the Fund perform since inception?This chart shows the value of a hypothetical $10,000 investment in the Fund at NAV since inception (8/21/2023). Cumulative Performance Based on $10,000 Investment  | Fund | S&P 500 Index | Bloomberg Commodity Index Total Return | UBS CM Commodity Index |
|---|
Aug 23 | $10,000 | $10,000 | $10,000 | $10,000 |
|---|
Aug 23 | $10,167 | $10,252 | $10,185 | $10,173 |
|---|
Sep 23 | $10,195 | $9,763 | $10,114 | $10,208 |
|---|
Oct 23 | $10,107 | $9,558 | $10,141 | $10,129 |
|---|
Nov 23 | $9,998 | $10,430 | $9,913 | $10,029 |
|---|
Dec 23 | $9,768 | $10,904 | $9,646 | $9,803 |
|---|
Jan 24 | $9,920 | $11,087 | $9,684 | $9,966 |
|---|
Feb 24 | $9,826 | $11,680 | $9,542 | $9,880 |
|---|
Mar 24 | $10,246 | $12,055 | $9,857 | $10,310 |
|---|
Apr 24 | $10,520 | $11,563 | $10,123 | $10,600 |
|---|
May 24 | $10,553 | $12,136 | $10,300 | $10,634 |
|---|
Jun 24 | $10,412 | $12,572 | $10,142 | $10,505 |
|---|
Jul 24 | $10,012 | $12,725 | $9,733 | $10,109 |
|---|
Aug 24 | $9,969 | $13,033 | $9,737 | $10,071 |
|---|
Sep 24 | $10,308 | $13,312 | $10,211 | $10,415 |
|---|
Oct 24 | $10,191 | $13,191 | $10,022 | $10,311 |
|---|
Nov 24 | $10,158 | $13,965 | $10,062 | $10,285 |
|---|
Dec 24 | $10,248 | $13,632 | $10,165 | $10,384 |
|---|
Jan 25 | $10,514 | $14,012 | $10,567 | $10,662 |
|---|
Feb 25 | $10,494 | $13,829 | $10,649 | $10,651 |
|---|
Mar 25 | $10,742 | $13,050 | $11,068 | $10,915 |
|---|
Apr 25 | $10,140 | $12,962 | $10,535 | $10,314 |
|---|
May 25 | $10,230 | $13,777 | $10,475 | $10,415 |
|---|
Jun 25 | $10,524 | $14,478 | $10,727 | $10,723 |
|---|
Jul 25 | $10,596 | $14,803 | $10,678 | $10,807 |
|---|
Aug 25 | $10,738 | $15,103 | $10,884 | $10,957 |
|---|
Sep 25 | $10,795 | $15,654 | $11,118 | $11,025 |
|---|
Oct 25 | $10,950 | $16,021 | $11,440 | $11,194 |
|---|
Nov 25 | $10,993 | $16,060 | $11,806 | $11,250 |
|---|
Dec 25 | $11,112 | $16,070 | $11,768 | $11,376 |
|---|
|
| Performance Inception Date |
Aug. 21, 2023
|
| No Deduction of Taxes [Text Block] |
|
| Performance Table Market Index Changed [Text Block] |
|
| Material Change Description [Text Block] |
|
| Updated Performance Information Location [Text Block] |
|
| AssetsNet |
$ 2,391,210
|
| Holdings Count | Holding |
18
|
| Advisory Fees Paid, Amount |
$ 0
|
| InvestmentCompanyPortfolioTurnover |
0.00%
|
| Additional Fund Statistics [Text Block] |
- Total Net Assets$2,391,210
- Number of Portfolio Holdings18
- Portfolio Turnover Rate-%
- Advisory Fees Paid$-
|
| Additional Fund Statistics Significance or Limits [Text Block] |
|
| Holdings [Text Block] |
Portfolio Composition (% of Total Net Assets)Value | Value | Value |
|---|
Liabilities in excess of other assetsFootnote Reference* | | (5.7)% | Money Market Fund | | 12.4% | United States Treasuries | | 93.3% |
| Footnote | Description | Footnote* | Includes net unrealized appreciation (depreciation) on total return swap contracts of 0.5% |
|
| Exposure Basis Explanation [Text Block] |
Includes net unrealized appreciation (depreciation) on total return swap contracts of 0.5%
|
| Material Fund Change [Text Block] |
|
| Summary of Change Legend [Text Block] |
|
| Updated Prospectus Web Address |
<span style="box-sizing: border-box; color: rgb(0, 0, 0); display: inline; flex-wrap: nowrap; font-size: 10.6667px; font-weight: 400; grid-area: auto; line-height: 16px; margin: 0px; overflow: visible; text-align: left; text-align-last: auto; white-space-collapse: preserve-breaks;">https://www.vaneck.com/us/en/etf-mutual-fund-finder/etfs/documents/</span>
|
| Accountant Change Statement [Text Block] |
|
| Accountant Change Disagreements [Text Block] |
|
| C000232971 |
|
| Shareholder Report [Line Items] |
|
| Fund Name |
VanEck Digital India ETF
|
| Class Name |
VanEck Digital India ETF
|
| Trading Symbol |
DGIN
|
| Security Exchange Name |
NYSEArca
|
| Annual or Semi-Annual Statement [Text Block] |
This annual shareholder report contains important information about the VanEck Digital India ETF (the "Fund") for the period January 1, 2025 to December 31, 2025.
|
| Shareholder Report Annual or Semi-Annual |
Annual Shareholder Report
|
| Additional Information [Text Block] |
You can find additional information about the Fund at https://www.vaneck.com/us/en/etf-mutual-fund-finder/etfs/documents/. You can also request this information by contacting us at 800.826.2333 or info@vaneck.com.
|
| Additional Information Phone Number |
800.826.2333
|
| Additional Information Email |
<span style="box-sizing: border-box; color: rgb(0, 0, 0); display: inline; flex-wrap: nowrap; font-size: 10.6667px; font-weight: 400; grid-area: auto; line-height: 16px; margin: 0px; overflow: visible; text-align: left; text-align-last: auto; white-space-collapse: preserve-breaks;">info@vaneck.com</span>
|
| Additional Information Website |
<span style="box-sizing: border-box; color: rgb(0, 0, 0); display: inline; flex-wrap: nowrap; font-size: 10.6667px; font-weight: 400; grid-area: auto; line-height: 16px; margin: 0px; overflow: visible; text-align: left; text-align-last: auto; white-space-collapse: preserve-breaks;">https://www.vaneck.com/us/en/etf-mutual-fund-finder/etfs/documents/</span>
|
| Expenses [Text Block] |
What were the Fund costs for the last year?(based on a hypothetical $10,000 investment) Fund Name | Costs of a $10,000 investment | Costs paid as a % of a $10,000 investment |
|---|
VanEck Digital India ETF | $68 | 0.70% |
|---|
|
| Expenses Paid, Amount |
$ 68
|
| Expense Ratio, Percent |
0.70%
|
| Factors Affecting Performance [Text Block] |
How did the Fund perform last year?The Fund posted a negative return over the period, as Indian technology companies faced persistent headwinds from weak global IT spending, slower corporate technology budgets, foreign investor outflows and margin pressure across the IT services sector. The Energy sector contributed the most to the Fund’s performance during the period, followed by Communication Services and Financials. The leading individual contributors to performance were Bharti Airtel Ltd., Reliance Industries Ltd. and Multi Commodity Exchange of India Ltd. The Information Technology sector detracted the most from the Fund’s performance during the period, followed by Consumer Discretionary. The leading individual detractors from performance were Tata Consultancy Services Ltd., Infosys Ltd. and Dixon Technologies (India) Ltd.
|
| Performance Past Does Not Indicate Future [Text] |
The performance data quoted represents past performance. Past performance is no guarantee of future results.
|
| Line Graph [Table Text Block] |
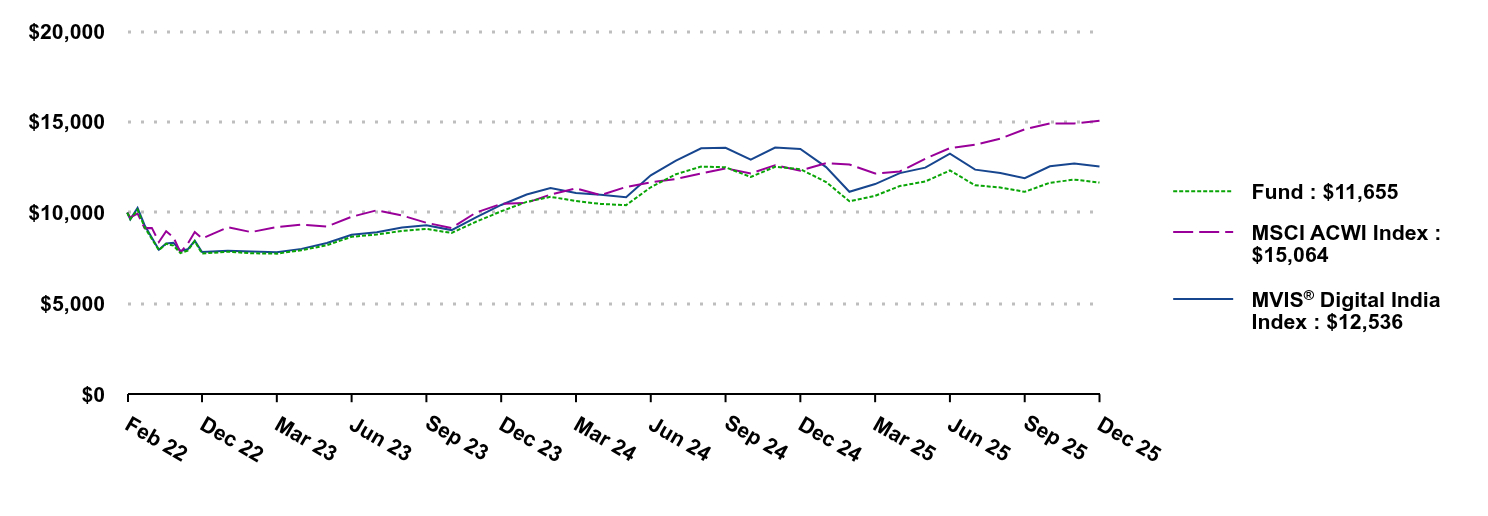 | Fund | MSCI ACWI Index | MVIS® Digital India Index |
|---|
Feb 22 | $10,000 | $10,000 | $10,000 |
|---|
Feb 22 | $9,648 | $9,732 | $9,626 |
|---|
Mar 22 | $10,154 | $9,942 | $10,255 |
|---|
Apr 22 | $9,197 | $9,146 | $9,307 |
|---|
May 22 | $8,547 | $9,157 | $8,612 |
|---|
Jun 22 | $7,936 | $8,385 | $7,951 |
|---|
Jul 22 | $8,281 | $8,971 | $8,302 |
|---|
Aug 22 | $8,187 | $8,641 | $8,344 |
|---|
Sep 22 | $7,770 | $7,813 | $7,894 |
|---|
Oct 22 | $7,911 | $8,285 | $7,980 |
|---|
Nov 22 | $8,427 | $8,928 | $8,448 |
|---|
Dec 22 | $7,744 | $8,576 | $7,833 |
|---|
Jan 23 | $7,849 | $9,191 | $7,898 |
|---|
Feb 23 | $7,763 | $8,928 | $7,861 |
|---|
Mar 23 | $7,741 | $9,203 | $7,813 |
|---|
Apr 23 | $7,929 | $9,335 | $8,003 |
|---|
May 23 | $8,206 | $9,235 | $8,330 |
|---|
Jun 23 | $8,668 | $9,771 | $8,777 |
|---|
Jul 23 | $8,792 | $10,129 | $8,923 |
|---|
Aug 23 | $8,994 | $9,846 | $9,185 |
|---|
Sep 23 | $9,105 | $9,439 | $9,308 |
|---|
Oct 23 | $8,878 | $9,155 | $9,038 |
|---|
Nov 23 | $9,496 | $10,000 | $9,736 |
|---|
Dec 23 | $10,072 | $10,480 | $10,421 |
|---|
Jan 24 | $10,591 | $10,542 | $10,997 |
|---|
Feb 24 | $10,869 | $10,994 | $11,348 |
|---|
Mar 24 | $10,640 | $11,339 | $11,074 |
|---|
Apr 24 | $10,478 | $10,965 | $10,983 |
|---|
May 24 | $10,412 | $11,411 | $10,850 |
|---|
Jun 24 | $11,396 | $11,665 | $12,055 |
|---|
Jul 24 | $12,112 | $11,853 | $12,864 |
|---|
Aug 24 | $12,532 | $12,154 | $13,542 |
|---|
Sep 24 | $12,497 | $12,436 | $13,568 |
|---|
Oct 24 | $11,961 | $12,157 | $12,921 |
|---|
Nov 24 | $12,525 | $12,612 | $13,581 |
|---|
Dec 24 | $12,392 | $12,313 | $13,508 |
|---|
Jan 25 | $11,684 | $12,727 | $12,508 |
|---|
Feb 25 | $10,625 | $12,650 | $11,148 |
|---|
Mar 25 | $10,926 | $12,150 | $11,571 |
|---|
Apr 25 | $11,463 | $12,263 | $12,174 |
|---|
May 25 | $11,711 | $12,968 | $12,477 |
|---|
Jun 25 | $12,319 | $13,551 | $13,241 |
|---|
Jul 25 | $11,506 | $13,734 | $12,366 |
|---|
Aug 25 | $11,383 | $14,074 | $12,179 |
|---|
Sep 25 | $11,144 | $14,584 | $11,898 |
|---|
Oct 25 | $11,645 | $14,910 | $12,548 |
|---|
Nov 25 | $11,816 | $14,908 | $12,704 |
|---|
Dec 25 | $11,655 | $15,064 | $12,536 |
|---|
|
| Average Annual Return [Table Text Block] |
Average Annual Total Returns . | 1 Year | Life* |
|---|
VanEck Digital India ETF | (5.95)% | 4.03% |
|---|
MVIS® Digital India Index | (7.20)% | 6.01% |
|---|
MSCI ACWI Index | 22.34% | 11.16% |
|---|
* Inception of Fund: 02/15/2022. The performance data quoted represents past performance. Past performance is no guarantee of future results. Performance information for the Fund may reflect temporary fee waivers, if applicable. These returns do not reflect the deduction of taxes that a shareholder would pay on Fund dividends and distributions or the sale of Fund shares. Visit vaneck.com for more recent performance information. |
| Performance Inception Date |
Feb. 15, 2022
|
| No Deduction of Taxes [Text Block] |
|
| Performance Table Market Index Changed [Text Block] |
|
| Material Change Description [Text Block] |
|
| Updated Performance Information Location [Text Block] |
|
| AssetsNet |
$ 18,431,900
|
| Holdings Count | Holding |
49
|
| Advisory Fees Paid, Amount |
$ 151,275
|
| InvestmentCompanyPortfolioTurnover |
22.00%
|
| Additional Fund Statistics [Text Block] |
- Total Net Assets$18,431,900
- Number of Portfolio Holdings49
- Portfolio Turnover Rate22%
- Advisory Fees Paid$151,275
|
| Additional Fund Statistics Significance or Limits [Text Block] |
|
| Holdings [Text Block] |
Portfolio Composition (% of Total Net Assets)Value | Value | Value |
|---|
Other assets less liabilities | | 0.3% | Other Investments | | 0.5% | Industrials | | 3.3% | Energy | | 8.2% | Financials | | 12.6% | Consumer Discretionary | | 13.7% | Communication Services | | 17.9% | Information Technology | | 43.5% |
|
| Largest Holdings [Text Block] |
Top Ten Holdings (% of Total Net Assets)Reliance Industries Ltd. | | 8.2% |
|---|
Bharti Airtel Ltd. | | 8.1% |
|---|
Infosys Ltd. | | 6.9% |
|---|
Tata Consultancy Services Ltd. | | 6.5% |
|---|
HCL Technologies Ltd. | | 5.8% |
|---|
Eternal Ltd. | | 5.4% |
|---|
Jio Financial Services Ltd. | | 4.5% |
|---|
Tech Mahindra Ltd. | | 4.4% |
|---|
PB Fintech Ltd. | | 3.8% |
|---|
Wipro Ltd. | | 3.7% |
|---|
|
| Material Fund Change [Text Block] |
|
| Summary of Change Legend [Text Block] |
|
| Updated Prospectus Web Address |
<span style="box-sizing: border-box; color: rgb(0, 0, 0); display: inline; flex-wrap: nowrap; font-size: 10.6667px; font-weight: 400; grid-area: auto; line-height: 16px; margin: 0px; overflow: visible; text-align: left; text-align-last: auto; white-space-collapse: preserve-breaks;">https://www.vaneck.com/us/en/etf-mutual-fund-finder/etfs/documents/</span>
|
| Accountant Change Statement [Text Block] |
|
| Accountant Change Disagreements [Text Block] |
|
| C000024980 |
|
| Shareholder Report [Line Items] |
|
| Fund Name |
VanEck Gold Miners ETF
|
| Class Name |
VanEck Gold Miners ETF
|
| Trading Symbol |
GDX
|
| Security Exchange Name |
NYSEArca
|
| Annual or Semi-Annual Statement [Text Block] |
This annual shareholder report contains important information about the VanEck Gold Miners ETF (the "Fund") for the period January 1, 2025 to December 31, 2025.
|
| Shareholder Report Annual or Semi-Annual |
Annual Shareholder Report
|
| Additional Information [Text Block] |
You can find additional information about the Fund at https://www.vaneck.com/us/en/etf-mutual-fund-finder/etfs/documents/. You can also request this information by contacting us at 800.826.2333 or info@vaneck.com.
|
| Material Fund Change Notice [Text Block] |
This report describes material changes to the Fund that occurred during the reporting period.
|
| Additional Information Phone Number |
800.826.2333
|
| Additional Information Email |
<span style="box-sizing: border-box; color: rgb(0, 0, 0); display: inline; flex-wrap: nowrap; font-size: 10.6667px; font-weight: 400; grid-area: auto; line-height: 16px; margin: 0px; overflow: visible; text-align: left; text-align-last: auto; white-space-collapse: preserve-breaks;">info@vaneck.com</span>
|
| Additional Information Website |
<span style="box-sizing: border-box; color: rgb(0, 0, 0); display: inline; flex-wrap: nowrap; font-size: 10.6667px; font-weight: 400; grid-area: auto; line-height: 16px; margin: 0px; overflow: visible; text-align: left; text-align-last: auto; white-space-collapse: preserve-breaks;">https://www.vaneck.com/us/en/etf-mutual-fund-finder/etfs/documents/</span>
|
| Expenses [Text Block] |
What were the Fund costs for the last year?(based on a hypothetical $10,000 investment) Fund Name | Costs of a $10,000 investment | Costs paid as a % of a $10,000 investment |
|---|
VanEck Gold Miners ETF | $91 | 0.51% |
|---|
|
| Expenses Paid, Amount |
$ 91
|
| Expense Ratio, Percent |
0.51%
|
| Factors Affecting Performance [Text Block] |
How did the Fund perform last year?During the period, gold prices remained well supported, reflecting continued central bank demand, easing monetary policy expectations and persistent geopolitical uncertainty. Gold mining equities benefited from higher realized gold prices and disciplined cost management, which supported cash flow generation and balance sheet strength across much of the industry. The Fund’s exposure to Canada, the United States and South Africa were the largest positive contributors to performance for the period. The leading individual contributors to performance were Newmont, Agnico Eagle Mines and Barrick Gold. There were no detractors at the country level. Countries with the lowest contributions included Indonesia, Columbia and Kyrgyzstan. The only individual detractors from performance were Amman Mineral, Equinox Gold Corp. and Bellevue Gold.
|
| Performance Past Does Not Indicate Future [Text] |
The performance data quoted represents past performance. Past performance is no guarantee of future results.
|
| Line Graph [Table Text Block] |
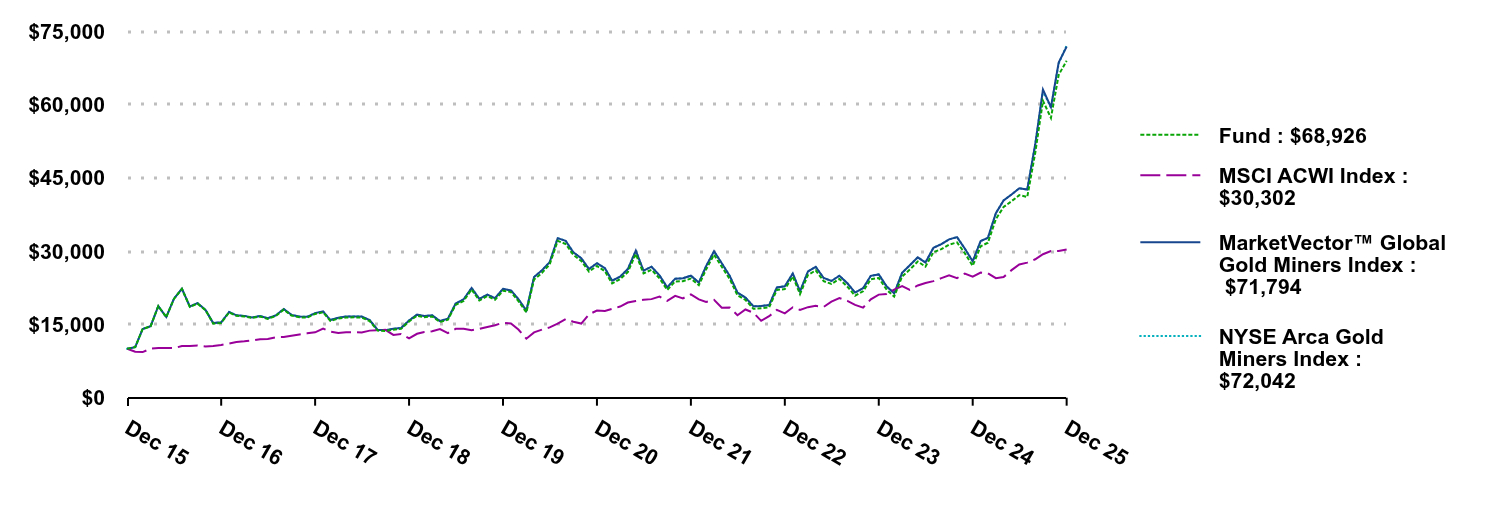 | Fund | MSCI ACWI Index | MarketVector™ Global Gold Miners Index | NYSE Arca Gold Miners Index |
|---|
Dec 15 | $10,000 | $10,000 | $10,000 | $10,000 |
|---|
Jan 16 | $10,350 | $9,397 | $10,333 | $10,333 |
|---|
Feb 16 | $14,052 | $9,332 | $14,061 | $14,061 |
|---|
Mar 16 | $14,585 | $10,024 | $14,621 | $14,621 |
|---|
Apr 16 | $18,717 | $10,172 | $18,726 | $18,726 |
|---|
May 16 | $16,465 | $10,185 | $16,490 | $16,490 |
|---|
Jun 16 | $20,204 | $10,123 | $20,240 | $20,240 |
|---|
Jul 16 | $22,259 | $10,559 | $22,276 | $22,276 |
|---|
Aug 16 | $18,564 | $10,595 | $18,643 | $18,643 |
|---|
Sep 16 | $19,242 | $10,660 | $19,344 | $19,344 |
|---|
Oct 16 | $17,901 | $10,479 | $17,930 | $17,930 |
|---|
Nov 16 | $15,146 | $10,558 | $15,256 | $15,256 |
|---|
Dec 16 | $15,291 | $10,786 | $15,424 | $15,424 |
|---|
Jan 17 | $17,440 | $11,081 | $17,535 | $17,535 |
|---|
Feb 17 | $16,738 | $11,392 | $16,846 | $16,846 |
|---|
Mar 17 | $16,629 | $11,532 | $16,734 | $16,734 |
|---|
Apr 17 | $16,329 | $11,711 | $16,408 | $16,408 |
|---|
May 17 | $16,600 | $11,970 | $16,715 | $16,715 |
|---|
Jun 17 | $16,117 | $12,024 | $16,236 | $16,236 |
|---|
Jul 17 | $16,702 | $12,360 | $16,813 | $16,813 |
|---|
Aug 17 | $18,010 | $12,408 | $18,128 | $18,128 |
|---|
Sep 17 | $16,797 | $12,647 | $16,937 | $16,937 |
|---|
Oct 17 | $16,439 | $12,910 | $16,585 | $16,585 |
|---|
Nov 17 | $16,388 | $13,160 | $16,543 | $16,543 |
|---|
Dec 17 | $17,125 | $13,372 | $17,297 | $17,297 |
|---|
Jan 18 | $17,464 | $14,127 | $17,635 | $17,635 |
|---|
Feb 18 | $15,696 | $13,533 | $15,884 | $15,884 |
|---|
Mar 18 | $16,175 | $13,244 | $16,330 | $16,330 |
|---|
Apr 18 | $16,403 | $13,370 | $16,606 | $16,606 |
|---|
May 18 | $16,433 | $13,387 | $16,630 | $16,630 |
|---|
Jun 18 | $16,403 | $13,314 | $16,585 | $16,585 |
|---|
Jul 18 | $15,659 | $13,716 | $15,854 | $15,854 |
|---|
Aug 18 | $13,715 | $13,824 | $13,863 | $13,863 |
|---|
Sep 18 | $13,641 | $13,884 | $13,820 | $13,820 |
|---|
Oct 18 | $13,906 | $12,843 | $14,088 | $14,088 |
|---|
Nov 18 | $14,068 | $13,031 | $14,260 | $14,260 |
|---|
Dec 18 | $15,597 | $12,113 | $15,797 | $15,797 |
|---|
Jan 19 | $16,767 | $13,070 | $16,978 | $16,978 |
|---|
Feb 19 | $16,470 | $13,419 | $16,705 | $16,705 |
|---|
Mar 19 | $16,604 | $13,588 | $16,830 | $16,830 |
|---|
Apr 19 | $15,471 | $14,047 | $15,679 | $15,679 |
|---|
May 19 | $15,952 | $13,214 | $16,161 | $16,161 |
|---|
Jun 19 | $18,972 | $14,079 | $19,243 | $19,243 |
|---|
Jul 19 | $19,787 | $14,120 | $20,122 | $20,122 |
|---|
Aug 19 | $22,131 | $13,785 | $22,456 | $22,456 |
|---|
Sep 19 | $19,872 | $14,075 | $20,207 | $20,207 |
|---|
Oct 19 | $20,771 | $14,460 | $21,082 | $21,082 |
|---|
Nov 19 | $20,026 | $14,813 | $20,351 | $20,351 |
|---|
Dec 19 | $21,859 | $15,335 | $22,256 | $22,256 |
|---|
Jan 20 | $21,605 | $15,166 | $21,937 | $21,937 |
|---|
Feb 20 | $19,747 | $13,941 | $20,153 | $20,153 |
|---|
Mar 20 | $17,452 | $12,059 | $17,802 | $17,802 |
|---|
Apr 20 | $24,168 | $13,350 | $24,681 | $24,681 |
|---|
May 20 | $25,525 | $13,931 | $26,068 | $26,068 |
|---|
Jun 20 | $27,277 | $14,376 | $27,733 | $27,733 |
|---|
Jul 20 | $32,074 | $15,137 | $32,627 | $32,627 |
|---|
Aug 20 | $31,444 | $16,063 | $32,091 | $32,091 |
|---|
Sep 20 | $29,214 | $15,545 | $29,756 | $29,756 |
|---|
Oct 20 | $27,956 | $15,167 | $28,506 | $28,506 |
|---|
Nov 20 | $25,780 | $17,037 | $26,325 | $26,325 |
|---|
Dec 20 | $26,951 | $17,828 | $27,527 | $27,527 |
|---|
Jan 21 | $25,851 | $17,747 | $26,476 | $26,476 |
|---|
Feb 21 | $23,368 | $18,158 | $23,930 | $23,930 |
|---|
Mar 21 | $24,255 | $18,643 | $24,762 | $24,763 |
|---|
Apr 21 | $25,695 | $19,458 | $26,308 | $26,309 |
|---|
May 21 | $29,381 | $19,761 | $30,074 | $30,074 |
|---|
Jun 21 | $25,410 | $20,021 | $25,987 | $25,987 |
|---|
Jul 21 | $26,160 | $20,159 | $26,788 | $26,788 |
|---|
Aug 21 | $24,425 | $20,664 | $25,006 | $25,006 |
|---|
Sep 21 | $22,051 | $19,810 | $22,560 | $22,561 |
|---|
Oct 21 | $23,775 | $20,821 | $24,337 | $24,337 |
|---|
Nov 21 | $23,826 | $20,320 | $24,416 | $24,416 |
|---|
Dec 21 | $24,375 | $21,133 | $24,948 | $24,948 |
|---|
Jan 22 | $23,024 | $20,095 | $23,534 | $23,535 |
|---|
Feb 22 | $26,228 | $19,576 | $26,878 | $26,878 |
|---|
Mar 22 | $29,239 | $20,000 | $29,934 | $29,934 |
|---|
Apr 22 | $26,776 | $18,399 | $27,484 | $27,484 |
|---|
May 22 | $24,258 | $18,420 | $24,917 | $24,917 |
|---|
Jun 22 | $20,933 | $16,868 | $21,478 | $21,478 |
|---|
Jul 22 | $19,986 | $18,046 | $20,483 | $20,483 |
|---|
Aug 22 | $18,179 | $17,381 | $18,683 | $18,684 |
|---|
Sep 22 | $18,308 | $15,717 | $18,765 | $18,765 |
|---|
Oct 22 | $18,459 | $16,666 | $18,937 | $18,937 |
|---|
Nov 22 | $22,042 | $17,958 | $22,541 | $22,541 |
|---|
Dec 22 | $22,212 | $17,252 | $22,794 | $22,795 |
|---|
Jan 23 | $24,760 | $18,488 | $25,390 | $25,391 |
|---|
Feb 23 | $21,195 | $17,958 | $21,762 | $21,762 |
|---|
Mar 23 | $25,109 | $18,512 | $25,828 | $25,828 |
|---|
Apr 23 | $26,037 | $18,778 | $26,767 | $26,767 |
|---|
May 23 | $23,832 | $18,577 | $24,477 | $24,477 |
|---|
Jun 23 | $23,259 | $19,656 | $23,870 | $23,870 |
|---|
Jul 23 | $24,289 | $20,375 | $24,954 | $24,954 |
|---|
Aug 23 | $22,698 | $19,806 | $23,399 | $23,399 |
|---|
Sep 23 | $20,851 | $18,987 | $21,497 | $21,497 |
|---|
Oct 23 | $21,752 | $18,416 | $22,392 | $22,392 |
|---|
Nov 23 | $24,211 | $20,116 | $24,921 | $24,921 |
|---|
Dec 23 | $24,481 | $21,082 | $25,211 | $25,211 |
|---|
Jan 24 | $22,059 | $21,206 | $22,733 | $22,733 |
|---|
Feb 24 | $20,697 | $22,116 | $21,346 | $21,346 |
|---|
Mar 24 | $24,786 | $22,810 | $25,532 | $25,532 |
|---|
Apr 24 | $26,194 | $22,057 | $27,093 | $27,093 |
|---|
May 24 | $27,858 | $22,953 | $28,714 | $28,714 |
|---|
Jun 24 | $26,803 | $23,464 | $27,650 | $27,650 |
|---|
Jul 24 | $29,736 | $23,843 | $30,666 | $30,667 |
|---|
Aug 24 | $30,389 | $24,448 | $31,415 | $31,415 |
|---|
Sep 24 | $31,311 | $25,016 | $32,381 | $32,381 |
|---|
Oct 24 | $31,755 | $24,455 | $32,840 | $32,840 |
|---|
Nov 24 | $29,570 | $25,369 | $30,512 | $30,512 |
|---|
Dec 24 | $26,970 | $24,769 | $27,893 | $27,893 |
|---|
Jan 25 | $30,962 | $25,600 | $32,052 | $32,053 |
|---|
Feb 25 | $31,689 | $25,446 | $32,697 | $32,697 |
|---|
Mar 25 | $36,520 | $24,441 | $37,733 | $37,734 |
|---|
Apr 25 | $38,991 | $24,669 | $40,352 | $40,352 |
|---|
May 25 | $40,189 | $26,087 | $41,569 | $41,569 |
|---|
Jun 25 | $41,428 | $27,258 | $42,827 | $42,827 |
|---|
Jul 25 | $41,052 | $27,628 | $42,577 | $42,577 |
|---|
Aug 25 | $50,088 | $28,310 | $51,829 | $51,829 |
|---|
Sep 25 | $60,716 | $29,336 | $63,001 | $62,709 |
|---|
Oct 25 | $57,223 | $29,992 | $59,408 | $59,323 |
|---|
Nov 25 | $66,011 | $29,989 | $68,540 | $68,330 |
|---|
Dec 25 | $68,926 | $30,302 | $71,794 | $72,042 |
|---|
|
| Average Annual Return [Table Text Block] |
Average Annual Total Returns . | 1 Year | 5 Years | 10 Years |
|---|
VanEck Gold Miners ETF | 155.57% | 20.66% | 21.29% |
|---|
MarketVector™ Global Gold Miners Index | 157.39% | 21.13% | 21.79% |
|---|
MSCI ACWI Index | 22.34% | 11.19% | 11.72% |
|---|
NYSE Arca Gold Miners Index | 158.28% | 21.22% | 21.83% |
|---|
Index data prior to September 22, 2025 reflects that of the NYSE Arca Gold Miners Index. From September 22, 2025 forward, the index data reflects that of the Fund's underlying index, MarketVector Global Gold Miners Index. The performance data quoted represents past performance. Past performance is no guarantee of future results. Performance information for the Fund may reflect temporary fee waivers, if applicable. These returns do not reflect the deduction of taxes that a shareholder would pay on Fund dividends and distributions or the sale of Fund shares. Visit vaneck.com for more recent performance information. |
| No Deduction of Taxes [Text Block] |
|
| Performance Table Market Index Changed [Text Block] |
|
| Material Change Description [Text Block] |
|
| Material Change Date |
Dec. 31, 2025
|
| Updated Performance Information Location [Text Block] |
|
| AssetsNet |
$ 25,801,227,773
|
| Holdings Count | Holding |
49
|
| Advisory Fees Paid, Amount |
$ 88,063,011
|
| InvestmentCompanyPortfolioTurnover |
50.00%
|
| Additional Fund Statistics [Text Block] |
- Total Net Assets$25,801,227,773
- Number of Portfolio Holdings49
- Portfolio Turnover Rate50%
- Advisory Fees Paid$88,063,011
|
| Additional Fund Statistics Significance or Limits [Text Block] |
|
| Holdings [Text Block] |
Portfolio Composition (% of Total Net Assets)Value | Value | Value |
|---|
Other assets less liabilities | | 0.1% | Copper | | 1.1% | Precious Metals & Minerals | | 1.9% | Diversified Metals & Mining | | 1.9% | Silver | | 5.4% | Gold | | 89.6% |
|
| Largest Holdings [Text Block] |
Top Ten Holdings (% of Total Net Assets)Agnico Eagle Mines Ltd. | | 8.9% |
|---|
Newmont Corp. | | 8.8% |
|---|
Barrick Mining Corp. | | 7.2% |
|---|
Wheaton Precious Metals Corp. | | 5.0% |
|---|
Anglogold Ashanti PLC | | 4.9% |
|---|
Gold Fields Ltd. | | 4.8% |
|---|
Franco-Nevada Corp. | | 4.8% |
|---|
Kinross Gold Corp. | | 4.4% |
|---|
Pan American Silver Corp. | | 4.0% |
|---|
Northern Star Resources Ltd. | | 3.5% |
|---|
|
| Material Fund Change [Text Block] |
The following material fund change occurred during the period ended December 31, 2025: Effective after the close of trading on the NYSE Arca, Inc., on September 19, 2025, the Fund’s benchmark index became the MarketVector Global Gold Miners Index and the Fund’s investment objective and principal investment strategy changed in connection therewith. |
| Material Fund Change Objectives [Text Block] |
Effective after the close of trading on the NYSE Arca, Inc., on September 19, 2025, the Fund’s benchmark index became the MarketVector Global Gold Miners Index and the Fund’s investment objective and principal investment strategy changed in connection therewith.
|
| Summary of Change Legend [Text Block] |
The following material fund change occurred during the period ended December 31, 2025:
|
| Updated Prospectus Web Address |
<span style="box-sizing: border-box; color: rgb(0, 0, 0); display: inline; flex-wrap: nowrap; font-size: 10.6667px; font-weight: 400; grid-area: auto; line-height: 16px; margin: 0px; overflow: visible; text-align: left; text-align-last: auto; white-space-collapse: preserve-breaks;">https://www.vaneck.com/us/en/etf-mutual-fund-finder/etfs/documents/</span>
|
| Accountant Change Statement [Text Block] |
|
| Accountant Change Disagreements [Text Block] |
|
| C000231316 |
|
| Shareholder Report [Line Items] |
|
| Fund Name |
VanEck Copper and Green Metals ETF
|
| Class Name |
VanEck Copper and Green Metals ETF
|
| Trading Symbol |
EMET
|
| Security Exchange Name |
NYSEArca
|
| Annual or Semi-Annual Statement [Text Block] |
This annual shareholder report contains important information about the VanEck Copper and Green Metals ETF (the "Fund") (formerly known as VanEck Green Metals ETF) for the period January 1, 2025 to December 31, 2025.
|
| Shareholder Report Annual or Semi-Annual |
Annual Shareholder Report
|
| Additional Information [Text Block] |
You can find additional information about the Fund at https://www.vaneck.com/us/en/etf-mutual-fund-finder/etfs/documents/. You can also request this information by contacting us at 800.826.2333 or info@vaneck.com.
|
| Material Fund Change Notice [Text Block] |
This report describes material changes to the Fund that occurred during the reporting period.
|
| Additional Information Phone Number |
800.826.2333
|
| Additional Information Email |
<span style="box-sizing: border-box; color: rgb(0, 0, 0); display: inline; flex-wrap: nowrap; font-size: 10.6667px; font-weight: 400; grid-area: auto; line-height: 16px; margin: 0px; overflow: visible; text-align: left; text-align-last: auto; white-space-collapse: preserve-breaks;">info@vaneck.com</span>
|
| Additional Information Website |
<span style="box-sizing: border-box; color: rgb(0, 0, 0); display: inline; flex-wrap: nowrap; font-size: 10.6667px; font-weight: 400; grid-area: auto; line-height: 16px; margin: 0px; overflow: visible; text-align: left; text-align-last: auto; white-space-collapse: preserve-breaks;">https://www.vaneck.com/us/en/etf-mutual-fund-finder/etfs/documents/</span>
|
| Expenses [Text Block] |
What were the Fund costs for the last year?(based on a hypothetical $10,000 investment) Fund Name | Costs of a $10,000 investment | Costs paid as a % of a $10,000 investment |
|---|
VanEck Copper and Green Metals ETF | $86 | 0.62% |
|---|
|
| Expenses Paid, Amount |
$ 86
|
| Expense Ratio, Percent |
0.62%
|
| Factors Affecting Performance [Text Block] |
How did the Fund perform last year?During the period, performance reflected improving global green and industrial metals fundamentals, supported by stronger metal prices and energy transition–related demand. Copper, diversified metals and mining, and platinum group metals companies contributed the most to performance. The Fund’s exposure to South Africa and China were by far the leading contributors to performance for the period. At the holdings level, Grupo Mexico, Antofagasta, Valterra Platinum, Impala Platinum, and Sibanye Stillwater were among the top contributors to performance. PT Amman Mineral Internasional Tbk was the leading detractor among the few companies that detracted from performance for the period.
|
| Performance Past Does Not Indicate Future [Text] |
The performance data quoted represents past performance. Past performance is no guarantee of future results.
|
| Line Graph [Table Text Block] |
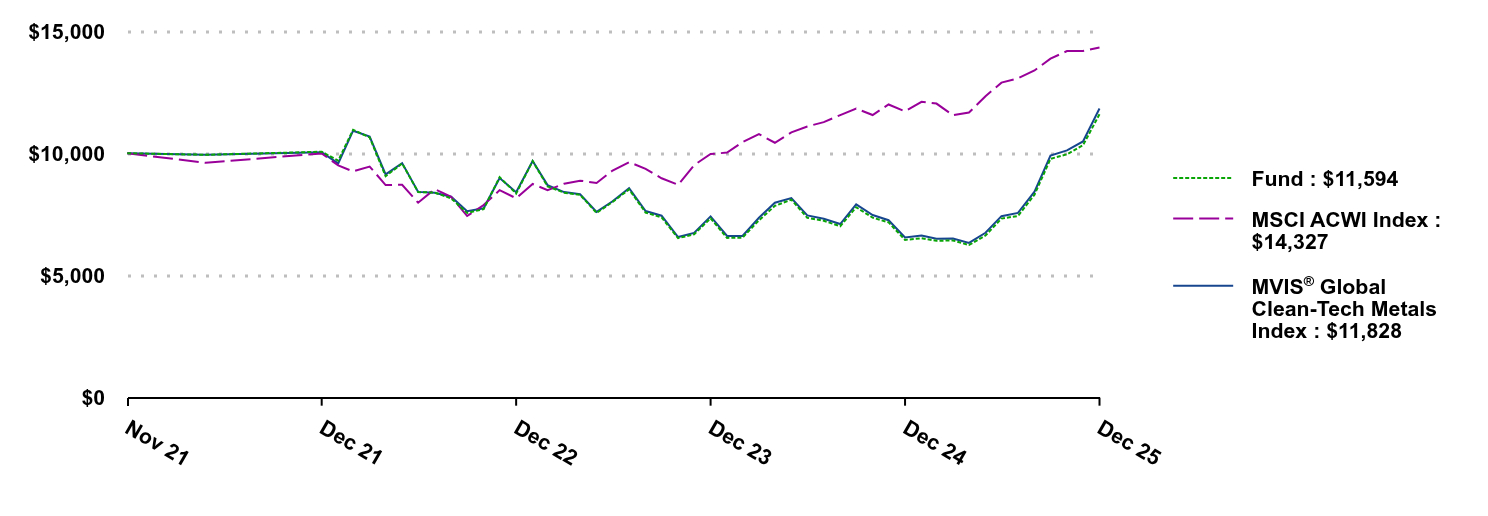 | Fund | MSCI ACWI Index | MVIS® Global Clean-Tech Metals Index |
|---|
Nov 21 | $10,000 | $10,000 | $10,000 |
|---|
Nov 21 | $9,936 | $9,607 | $9,937 |
|---|
Dec 21 | $10,061 | $9,992 | $10,035 |
|---|
Jan 22 | $9,699 | $9,501 | $9,583 |
|---|
Feb 22 | $10,958 | $9,256 | $10,922 |
|---|
Mar 22 | $10,647 | $9,456 | $10,684 |
|---|
Apr 22 | $9,060 | $8,699 | $9,132 |
|---|
May 22 | $9,580 | $8,709 | $9,595 |
|---|
Jun 22 | $8,412 | $7,975 | $8,419 |
|---|
Jul 22 | $8,390 | $8,532 | $8,382 |
|---|
Aug 22 | $8,154 | $8,218 | $8,222 |
|---|
Sep 22 | $7,555 | $7,431 | $7,625 |
|---|
Oct 22 | $7,718 | $7,880 | $7,746 |
|---|
Nov 22 | $9,021 | $8,491 | $8,985 |
|---|
Dec 22 | $8,352 | $8,157 | $8,405 |
|---|
Jan 23 | $9,681 | $8,741 | $9,681 |
|---|
Feb 23 | $8,645 | $8,491 | $8,695 |
|---|
Mar 23 | $8,387 | $8,753 | $8,410 |
|---|
Apr 23 | $8,300 | $8,878 | $8,324 |
|---|
May 23 | $7,560 | $8,783 | $7,602 |
|---|
Jun 23 | $8,006 | $9,293 | $8,034 |
|---|
Jul 23 | $8,522 | $9,634 | $8,567 |
|---|
Aug 23 | $7,573 | $9,364 | $7,636 |
|---|
Sep 23 | $7,373 | $8,977 | $7,443 |
|---|
Oct 23 | $6,528 | $8,707 | $6,572 |
|---|
Nov 23 | $6,682 | $9,511 | $6,738 |
|---|
Dec 23 | $7,339 | $9,968 | $7,417 |
|---|
Jan 24 | $6,536 | $10,026 | $6,618 |
|---|
Feb 24 | $6,548 | $10,456 | $6,614 |
|---|
Mar 24 | $7,255 | $10,785 | $7,359 |
|---|
Apr 24 | $7,847 | $10,429 | $7,974 |
|---|
May 24 | $8,099 | $10,852 | $8,168 |
|---|
Jun 24 | $7,358 | $11,094 | $7,455 |
|---|
Jul 24 | $7,238 | $11,273 | $7,319 |
|---|
Aug 24 | $7,014 | $11,559 | $7,104 |
|---|
Sep 24 | $7,792 | $11,828 | $7,907 |
|---|
Oct 24 | $7,364 | $11,562 | $7,471 |
|---|
Nov 24 | $7,170 | $11,995 | $7,259 |
|---|
Dec 24 | $6,455 | $11,711 | $6,555 |
|---|
Jan 25 | $6,521 | $12,104 | $6,632 |
|---|
Feb 25 | $6,419 | $12,031 | $6,500 |
|---|
Mar 25 | $6,432 | $11,556 | $6,507 |
|---|
Apr 25 | $6,244 | $11,664 | $6,329 |
|---|
May 25 | $6,634 | $12,334 | $6,747 |
|---|
Jun 25 | $7,327 | $12,888 | $7,425 |
|---|
Jul 25 | $7,433 | $13,063 | $7,559 |
|---|
Aug 25 | $8,304 | $13,385 | $8,426 |
|---|
Sep 25 | $9,771 | $13,870 | $9,908 |
|---|
Oct 25 | $9,958 | $14,180 | $10,118 |
|---|
Nov 25 | $10,327 | $14,179 | $10,480 |
|---|
Dec 25 | $11,594 | $14,327 | $11,828 |
|---|
|
| Average Annual Return [Table Text Block] |
Average Annual Total Returns . | 1 Year | Life* |
|---|
VanEck Copper and Green Metals ETF | 79.63% | 3.63% |
|---|
MVIS® Global Clean-Tech Metals Index | 80.44% | 4.14% |
|---|
MSCI ACWI Index | 22.34% | 9.07% |
|---|
* Inception of Fund: 11/09/2021. The performance data quoted represents past performance. Past performance is no guarantee of future results. Performance information for the Fund may reflect temporary fee waivers, if applicable. These returns do not reflect the deduction of taxes that a shareholder would pay on Fund dividends and distributions or the sale of Fund shares. Visit vaneck.com for more recent performance information. |
| Performance Inception Date |
Nov. 09, 2021
|
| No Deduction of Taxes [Text Block] |
|
| Performance Table Market Index Changed [Text Block] |
|
| Material Change Description [Text Block] |
|
| Material Change Date |
Dec. 31, 2025
|
| Updated Performance Information Location [Text Block] |
|
| AssetsNet |
$ 31,493,177
|
| Holdings Count | Holding |
57
|
| Advisory Fees Paid, Amount |
$ 120,547
|
| InvestmentCompanyPortfolioTurnover |
21.00%
|
| Additional Fund Statistics [Text Block] |
- Total Net Assets$31,493,177
- Number of Portfolio Holdings57
- Portfolio Turnover Rate21%
- Advisory Fees Paid$120,547
|
| Additional Fund Statistics Significance or Limits [Text Block] |
|
| Holdings [Text Block] |
Portfolio Composition (% of Total Net Assets)Value | Value | Value |
|---|
Other assets less liabilities | | 0.1% | Fertilizers & Agricultural Chemicals | | 1.4% | Electrical Components & Equipment | | 2.1% | Specialty Chemicals | | 6.3% | Precious Metals & Minerals | | 9.9% | Copper | | 32.0% | Diversified Metals & Mining | | 48.2% |
|
| Largest Holdings [Text Block] |
Top Ten Holdings (% of Total Net Assets)Freeport-McMoRan, Inc. | | 8.1% |
|---|
Glencore PLC | | 7.9% |
|---|
Anglo American PLC | | 6.9% |
|---|
Grupo Mexico SAB de CV | | 6.2% |
|---|
Teck Resources Ltd. | | 5.4% |
|---|
Antofagasta PLC | | 4.2% |
|---|
Valterra Platinum Ltd. | | 4.0% |
|---|
First Quantum Minerals Ltd. | | 3.9% |
|---|
Southern Copper Corp. | | 3.2% |
|---|
Boliden AB | | 3.2% |
|---|
|
| Material Fund Change [Text Block] |
The following material fund change occurred during the period ended December 31, 2025: On February 13, 2026 (the "Effective Date"), i) the Fund’s name changed to the “VanEck Copper and Green Metals ETF” and ii) its ticker changed to "EMET." Additionally, on the Effective Date, the definition of "green metals" as set forth in the Fund's Principal Investment Strategies has been amended to reflect that copper is a type of green metal. |
| Material Fund Change Name [Text Block] |
On February 13, 2026 (the "Effective Date"), i) the Fund’s name changed to the “VanEck Copper and Green Metals ETF” and ii) its ticker changed to "EMET." Additionally, on the Effective Date, the definition of "green metals" as set forth in the Fund's Principal Investment Strategies has been amended to reflect that copper is a type of green metal.
|
| Summary of Change Legend [Text Block] |
The following material fund change occurred during the period ended December 31, 2025:
|
| Updated Prospectus Web Address |
<span style="box-sizing: border-box; color: rgb(0, 0, 0); display: inline; flex-wrap: nowrap; font-size: 10.6667px; font-weight: 400; grid-area: auto; line-height: 16px; margin: 0px; overflow: visible; text-align: left; text-align-last: auto; white-space-collapse: preserve-breaks;">https://www.vaneck.com/us/en/etf-mutual-fund-finder/etfs/documents/</span>
|
| Accountant Change Statement [Text Block] |
|
| Accountant Change Disagreements [Text Block] |
|
| C000082390 |
|
| Shareholder Report [Line Items] |
|
| Fund Name |
VanEck India Growth Leaders ETF
|
| Class Name |
VanEck India Growth Leaders ETF
|
| Trading Symbol |
GLIN
|
| Security Exchange Name |
NYSEArca
|
| Annual or Semi-Annual Statement [Text Block] |
This annual shareholder report contains important information about the VanEck India Growth Leaders ETF (the "Fund") for the period January 1, 2025 to December 31, 2025.
|
| Shareholder Report Annual or Semi-Annual |
Annual Shareholder Report
|
| Additional Information [Text Block] |
You can find additional information about the Fund at https://www.vaneck.com/us/en/etf-mutual-fund-finder/etfs/documents/. You can also request this information by contacting us at 800.826.2333 or info@vaneck.com.
|
| Additional Information Phone Number |
800.826.2333
|
| Additional Information Email |
<span style="box-sizing: border-box; color: rgb(0, 0, 0); display: inline; flex-wrap: nowrap; font-size: 10.6667px; font-weight: 400; grid-area: auto; line-height: 16px; margin: 0px; overflow: visible; text-align: left; text-align-last: auto; white-space-collapse: preserve-breaks;">info@vaneck.com</span>
|
| Additional Information Website |
<span style="box-sizing: border-box; color: rgb(0, 0, 0); display: inline; flex-wrap: nowrap; font-size: 10.6667px; font-weight: 400; grid-area: auto; line-height: 16px; margin: 0px; overflow: visible; text-align: left; text-align-last: auto; white-space-collapse: preserve-breaks;">https://www.vaneck.com/us/en/etf-mutual-fund-finder/etfs/documents/</span>
|
| Expenses [Text Block] |
What were the Fund costs for the last year?(based on a hypothetical $10,000 investment) Fund Name | Costs of a $10,000 investment | Costs paid as a % of a $10,000 investment |
|---|
VanEck India Growth Leaders ETF | $70 | 0.72% |
|---|
|
| Expenses Paid, Amount |
$ 70
|
| Expense Ratio, Percent |
0.72%
|
| Factors Affecting Performance [Text Block] |
How did the Fund perform last year?The Fund posted a negative return over the period, as broad Indian equities faced sustained pressure for much of the period from slowing corporate earnings growth, elevated valuations, foreign investor outflows and mixed economic indicators. The Financials sector contributed the most to the Fund’s performance during the period, followed by Industrials and Communication Services. The leading individual contributors to performance were Eicher Motors Ltd., Bharat Electronics Ltd. and State Bank of India. The Information Technology sector detracted the most from the Fund’s performance during the period, followed by Healthcare and Consumer Discretionary. The leading individual detractors from performance were Trent Ltd., HCL Technologies Ltd. and IndusInd Bank Ltd.
|
| Performance Past Does Not Indicate Future [Text] |
The performance data quoted represents past performance. Past performance is no guarantee of future results.
|
| Line Graph [Table Text Block] |
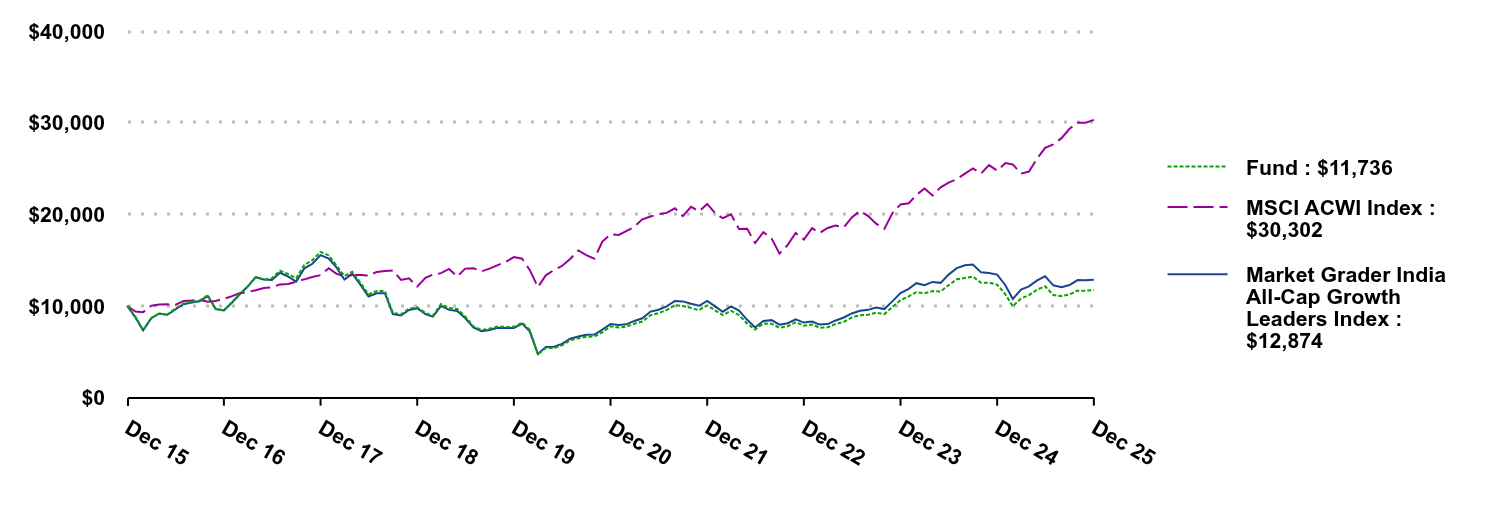 | Fund | MSCI ACWI Index | Market Grader India All-Cap Growth Leaders Index |
|---|
Dec 15 | $10,000 | $10,000 | $10,000 |
|---|
Jan 16 | $8,848 | $9,397 | $8,748 |
|---|
Feb 16 | $7,368 | $9,332 | $7,347 |
|---|
Mar 16 | $8,690 | $10,024 | $8,677 |
|---|
Apr 16 | $9,166 | $10,172 | $9,182 |
|---|
May 16 | $9,043 | $10,185 | $9,049 |
|---|
Jun 16 | $9,725 | $10,123 | $9,620 |
|---|
Jul 16 | $10,289 | $10,559 | $10,202 |
|---|
Aug 16 | $10,440 | $10,595 | $10,378 |
|---|
Sep 16 | $10,602 | $10,660 | $10,519 |
|---|
Oct 16 | $11,164 | $10,479 | $11,084 |
|---|
Nov 16 | $9,691 | $10,558 | $9,663 |
|---|
Dec 16 | $9,530 | $10,786 | $9,518 |
|---|
Jan 17 | $10,438 | $11,081 | $10,389 |
|---|
Feb 17 | $11,281 | $11,392 | $11,257 |
|---|
Mar 17 | $12,145 | $11,532 | $12,121 |
|---|
Apr 17 | $13,158 | $11,711 | $13,145 |
|---|
May 17 | $12,886 | $11,970 | $12,883 |
|---|
Jun 17 | $13,039 | $12,024 | $12,841 |
|---|
Jul 17 | $13,848 | $12,360 | $13,628 |
|---|
Aug 17 | $13,490 | $12,408 | $13,197 |
|---|
Sep 17 | $13,030 | $12,647 | $12,668 |
|---|
Oct 17 | $14,496 | $12,910 | $14,110 |
|---|
Nov 17 | $15,004 | $13,160 | $14,608 |
|---|
Dec 17 | $15,904 | $13,372 | $15,545 |
|---|
Jan 18 | $15,515 | $14,127 | $15,182 |
|---|
Feb 18 | $14,462 | $13,533 | $14,251 |
|---|
Mar 18 | $13,276 | $13,244 | $12,884 |
|---|
Apr 18 | $13,730 | $13,370 | $13,517 |
|---|
May 18 | $12,528 | $13,387 | $12,298 |
|---|
Jun 18 | $11,267 | $13,314 | $11,047 |
|---|
Jul 18 | $11,632 | $13,716 | $11,390 |
|---|
Aug 18 | $11,623 | $13,824 | $11,398 |
|---|
Sep 18 | $9,242 | $13,884 | $9,112 |
|---|
Oct 18 | $9,093 | $12,843 | $8,967 |
|---|
Nov 18 | $9,707 | $13,031 | $9,565 |
|---|
Dec 18 | $9,861 | $12,113 | $9,759 |
|---|
Jan 19 | $9,237 | $13,070 | $9,115 |
|---|
Feb 19 | $8,939 | $13,419 | $8,845 |
|---|
Mar 19 | $10,207 | $13,588 | $10,008 |
|---|
Apr 19 | $9,786 | $14,047 | $9,578 |
|---|
May 19 | $9,677 | $13,214 | $9,458 |
|---|
Jun 19 | $8,869 | $14,079 | $8,695 |
|---|
Jul 19 | $7,777 | $14,120 | $7,670 |
|---|
Aug 19 | $7,379 | $13,785 | $7,254 |
|---|
Sep 19 | $7,534 | $14,075 | $7,389 |
|---|
Oct 19 | $7,757 | $14,460 | $7,622 |
|---|
Nov 19 | $7,718 | $14,813 | $7,588 |
|---|
Dec 19 | $7,726 | $15,335 | $7,593 |
|---|
Jan 20 | $8,190 | $15,166 | $8,079 |
|---|
Feb 20 | $7,396 | $13,941 | $7,237 |
|---|
Mar 20 | $4,752 | $12,059 | $4,758 |
|---|
Apr 20 | $5,425 | $13,350 | $5,523 |
|---|
May 20 | $5,416 | $13,931 | $5,552 |
|---|
Jun 20 | $5,719 | $14,376 | $5,862 |
|---|
Jul 20 | $6,258 | $15,137 | $6,433 |
|---|
Aug 20 | $6,478 | $16,063 | $6,674 |
|---|
Sep 20 | $6,642 | $15,545 | $6,870 |
|---|
Oct 20 | $6,696 | $15,167 | $6,893 |
|---|
Nov 20 | $7,134 | $17,037 | $7,429 |
|---|
Dec 20 | $7,788 | $17,828 | $8,043 |
|---|
Jan 21 | $7,647 | $17,747 | $7,929 |
|---|
Feb 21 | $7,743 | $18,158 | $8,000 |
|---|
Mar 21 | $8,075 | $18,643 | $8,371 |
|---|
Apr 21 | $8,306 | $19,458 | $8,660 |
|---|
May 21 | $9,008 | $19,761 | $9,392 |
|---|
Jun 21 | $9,216 | $20,021 | $9,591 |
|---|
Jul 21 | $9,559 | $20,159 | $9,960 |
|---|
Aug 21 | $10,092 | $20,664 | $10,547 |
|---|
Sep 21 | $10,003 | $19,810 | $10,505 |
|---|
Oct 21 | $9,800 | $20,821 | $10,243 |
|---|
Nov 21 | $9,536 | $20,320 | $10,026 |
|---|
Dec 21 | $10,057 | $21,133 | $10,552 |
|---|
Jan 22 | $9,502 | $20,095 | $9,927 |
|---|
Feb 22 | $9,011 | $19,576 | $9,379 |
|---|
Mar 22 | $9,474 | $20,000 | $9,950 |
|---|
Apr 22 | $9,015 | $18,399 | $9,506 |
|---|
May 22 | $8,074 | $18,420 | $8,491 |
|---|
Jun 22 | $7,438 | $16,868 | $7,659 |
|---|
Jul 22 | $8,090 | $18,046 | $8,362 |
|---|
Aug 22 | $8,062 | $17,381 | $8,458 |
|---|
Sep 22 | $7,627 | $15,717 | $7,969 |
|---|
Oct 22 | $7,794 | $16,666 | $8,120 |
|---|
Nov 22 | $8,229 | $17,958 | $8,545 |
|---|
Dec 22 | $7,846 | $17,252 | $8,191 |
|---|
Jan 23 | $7,986 | $18,488 | $8,311 |
|---|
Feb 23 | $7,635 | $17,958 | $7,977 |
|---|
Mar 23 | $7,675 | $18,512 | $8,028 |
|---|
Apr 23 | $8,033 | $18,778 | $8,425 |
|---|
May 23 | $8,285 | $18,577 | $8,747 |
|---|
Jun 23 | $8,751 | $19,656 | $9,190 |
|---|
Jul 23 | $8,992 | $20,375 | $9,475 |
|---|
Aug 23 | $9,044 | $19,806 | $9,580 |
|---|
Sep 23 | $9,276 | $18,987 | $9,845 |
|---|
Oct 23 | $9,117 | $18,416 | $9,667 |
|---|
Nov 23 | $9,888 | $20,116 | $10,509 |
|---|
Dec 23 | $10,631 | $21,082 | $11,405 |
|---|
Jan 24 | $11,057 | $21,206 | $11,878 |
|---|
Feb 24 | $11,510 | $22,116 | $12,492 |
|---|
Mar 24 | $11,404 | $22,810 | $12,260 |
|---|
Apr 24 | $11,626 | $22,057 | $12,625 |
|---|
May 24 | $11,577 | $22,953 | $12,528 |
|---|
Jun 24 | $12,273 | $23,464 | $13,428 |
|---|
Jul 24 | $12,915 | $23,843 | $14,128 |
|---|
Aug 24 | $13,066 | $24,448 | $14,444 |
|---|
Sep 24 | $13,209 | $25,016 | $14,537 |
|---|
Oct 24 | $12,532 | $24,455 | $13,671 |
|---|
Nov 24 | $12,551 | $25,369 | $13,594 |
|---|
Dec 24 | $12,343 | $24,769 | $13,424 |
|---|
Jan 25 | $11,276 | $25,600 | $12,272 |
|---|
Feb 25 | $9,964 | $25,446 | $10,773 |
|---|
Mar 25 | $10,815 | $24,441 | $11,796 |
|---|
Apr 25 | $11,194 | $24,669 | $12,145 |
|---|
May 25 | $11,793 | $26,087 | $12,792 |
|---|
Jun 25 | $12,150 | $27,258 | $13,241 |
|---|
Jul 25 | $11,201 | $27,628 | $12,255 |
|---|
Aug 25 | $11,080 | $28,310 | $12,057 |
|---|
Sep 25 | $11,263 | $29,336 | $12,286 |
|---|
Oct 25 | $11,679 | $29,992 | $12,830 |
|---|
Nov 25 | $11,672 | $29,989 | $12,820 |
|---|
Dec 25 | $11,736 | $30,302 | $12,874 |
|---|
|
| Average Annual Return [Table Text Block] |
Average Annual Total Returns . | 1 Year | 5 Years | 10 Years |
|---|
VanEck India Growth Leaders ETF | (4.92)% | 8.55% | 1.61% |
|---|
Market Grader India All-Cap Growth Leaders Index | (4.10)% | 9.87% | 2.56% |
|---|
MSCI ACWI Index | 22.34% | 11.19% | 11.72% |
|---|
Market Grader India All-Cap Growth Leaders Index replaced the MVIS® India Small-Cap Index effective May 1, 2020. Index history prior to May 1, 2020 reflects the performance of the MVIS® India Small-Cap Index. The performance data quoted represents past performance. Past performance is no guarantee of future results. Performance information for the Fund may reflect temporary fee waivers, if applicable. These returns do not reflect the deduction of taxes that a shareholder would pay on Fund dividends and distributions or the sale of Fund shares. Visit vaneck.com for more recent performance information. |
| No Deduction of Taxes [Text Block] |
|
| Performance Table Market Index Changed [Text Block] |
|
| Material Change Description [Text Block] |
|
| Updated Performance Information Location [Text Block] |
|
| AssetsNet |
$ 118,976,683
|
| Holdings Count | Holding |
80
|
| Advisory Fees Paid, Amount |
$ 545,533
|
| InvestmentCompanyPortfolioTurnover |
66.00%
|
| Additional Fund Statistics [Text Block] |
- Total Net Assets$118,976,683
- Number of Portfolio Holdings80
- Portfolio Turnover Rate66%
- Advisory Fees Paid$545,533
|
| Additional Fund Statistics Significance or Limits [Text Block] |
|
| Holdings [Text Block] |
Portfolio Composition (% of Total Net Assets)Value | Value | Value |
|---|
Liabilities in excess of other assets | | (0.1)% | Other Investments | | 0.8% | Energy | | 4.0% | Materials | | 5.3% | Communication Services | | 7.5% | Consumer Discretionary | | 8.3% | Health Care | | 8.4% | Information Technology | | 11.8% | Industrials | | 21.6% | Financials | | 32.4% |
|
| Largest Holdings [Text Block] |
Top Ten Holdings (% of Total Net Assets)State Bank of India | | 5.7% |
|---|
Bharti Airtel Ltd. | | 5.2% |
|---|
Bharat Electronics Ltd. | | 5.1% |
|---|
Infosys Ltd. | | 5.0% |
|---|
Tata Consultancy Services Ltd. | | 5.0% |
|---|
ICICI Bank Ltd. | | 4.5% |
|---|
Eicher Motors Ltd. | | 4.0% |
|---|
Coal India Ltd. | | 4.0% |
|---|
Trent Ltd. | | 3.9% |
|---|
Hindustan Aeronautics Ltd. | | 3.7% |
|---|
|
| Material Fund Change [Text Block] |
|
| Summary of Change Legend [Text Block] |
|
| Updated Prospectus Web Address |
<span style="box-sizing: border-box; color: rgb(0, 0, 0); display: inline; flex-wrap: nowrap; font-size: 10.6667px; font-weight: 400; grid-area: auto; line-height: 16px; margin: 0px; overflow: visible; text-align: left; text-align-last: auto; white-space-collapse: preserve-breaks;">https://www.vaneck.com/us/en/etf-mutual-fund-finder/etfs/documents/</span>
|
| Accountant Change Statement [Text Block] |
|
| Accountant Change Disagreements [Text Block] |
|
| C000070695 |
|
| Shareholder Report [Line Items] |
|
| Fund Name |
VanEck Indonesia Index ETF
|
| Class Name |
VanEck Indonesia Index ETF
|
| Trading Symbol |
IDX
|
| Security Exchange Name |
NYSEArca
|
| Annual or Semi-Annual Statement [Text Block] |
This annual shareholder report contains important information about the VanEck Indonesia Index ETF (the "Fund") for the period January 1, 2025 to December 31, 2025.
|
| Shareholder Report Annual or Semi-Annual |
Annual Shareholder Report
|
| Additional Information [Text Block] |
You can find additional information about the Fund at https://www.vaneck.com/us/en/etf-mutual-fund-finder/etfs/documents/. You can also request this information by contacting us at 800.826.2333 or info@vaneck.com.
|
| Additional Information Phone Number |
800.826.2333
|
| Additional Information Email |
<span style="box-sizing: border-box; color: rgb(0, 0, 0); display: inline; flex-wrap: nowrap; font-size: 10.6667px; font-weight: 400; grid-area: auto; line-height: 16px; margin: 0px; overflow: visible; text-align: left; text-align-last: auto; white-space-collapse: preserve-breaks;">info@vaneck.com</span>
|
| Additional Information Website |
<span style="box-sizing: border-box; color: rgb(0, 0, 0); display: inline; flex-wrap: nowrap; font-size: 10.6667px; font-weight: 400; grid-area: auto; line-height: 16px; margin: 0px; overflow: visible; text-align: left; text-align-last: auto; white-space-collapse: preserve-breaks;">https://www.vaneck.com/us/en/etf-mutual-fund-finder/etfs/documents/</span>
|
| Expenses [Text Block] |
What were the Fund costs for the last year?(based on a hypothetical $10,000 investment) Fund Name | Costs of a $10,000 investment | Costs paid as a % of a $10,000 investment |
|---|
VanEck Indonesia Index ETF | $61 | 0.57% |
|---|
|
| Expenses Paid, Amount |
$ 61
|
| Expense Ratio, Percent |
0.57%
|
| Factors Affecting Performance [Text Block] |
How did the Fund perform last year?The Fund posted a positive return over the period, supported by resilient domestic consumption and selective strength in Indonesian equities, despite ongoing headwinds from foreign investor outflows, currency volatility and policy uncertainty that pressured markets for much of the period. The Energy sector contributed the most to the Fund’s performance during the period, followed by Materials and Communication Services. The leading individual contributors to performance were PT Dian Swastatika Sentosa Tbk, PT Barito Pacific Tbk and PT Telkom Indonesia (Persero) Tbk. The Consumer Staples sector detracted the most from the Fund’s performance during the period, followed by Consumer Discretionary and Real Estate. The leading individual detractors from performance were PT Amman Mineral Internasional Tbk, PT Bank Central Asia Tbk and PT Sumber Alfaria Trijaya.
|
| Performance Past Does Not Indicate Future [Text] |
The performance data quoted represents past performance. Past performance is no guarantee of future results.
|
| Line Graph [Table Text Block] |
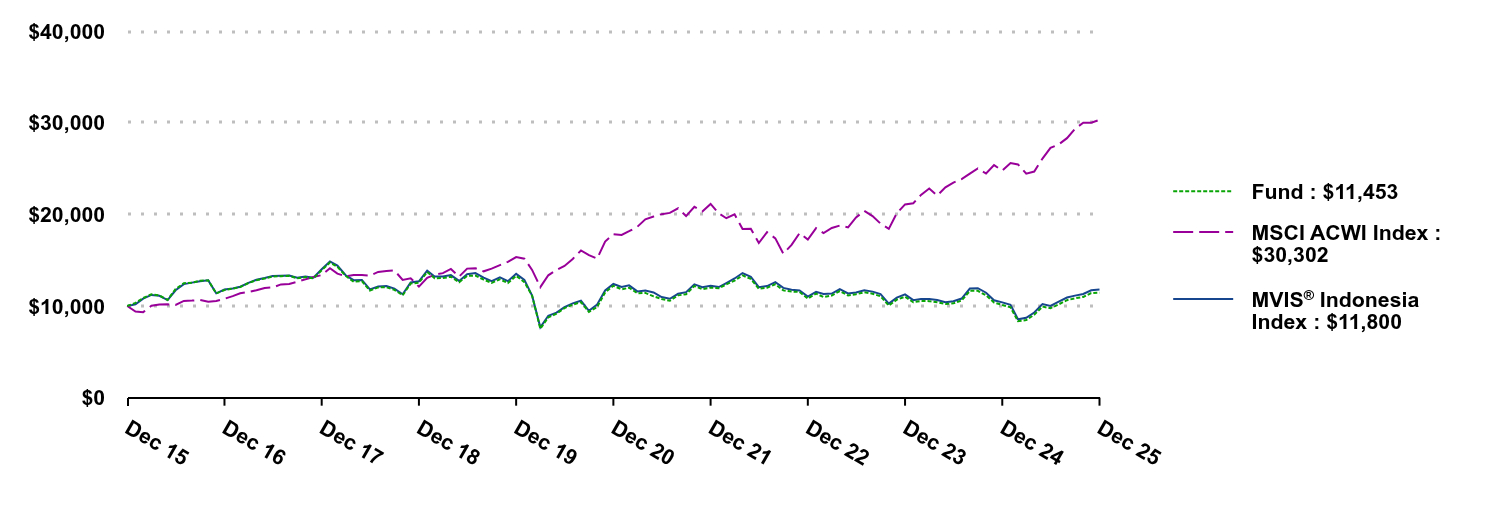 | Fund | MSCI ACWI Index | MVIS® Indonesia Index |
|---|
Dec 15 | $10,000 | $10,000 | $10,000 |
|---|
Jan 16 | $10,343 | $9,397 | $10,174 |
|---|
Feb 16 | $10,866 | $9,332 | $10,803 |
|---|
Mar 16 | $11,280 | $10,024 | $11,210 |
|---|
Apr 16 | $11,149 | $10,172 | $11,114 |
|---|
May 16 | $10,670 | $10,185 | $10,649 |
|---|
Jun 16 | $11,846 | $10,123 | $11,720 |
|---|
Jul 16 | $12,489 | $10,559 | $12,388 |
|---|
Aug 16 | $12,549 | $10,595 | $12,551 |
|---|
Sep 16 | $12,761 | $10,660 | $12,713 |
|---|
Oct 16 | $12,794 | $10,479 | $12,798 |
|---|
Nov 16 | $11,373 | $10,558 | $11,385 |
|---|
Dec 16 | $11,749 | $10,786 | $11,796 |
|---|
Jan 17 | $11,903 | $11,081 | $11,913 |
|---|
Feb 17 | $12,063 | $11,392 | $12,107 |
|---|
Mar 17 | $12,509 | $11,532 | $12,531 |
|---|
Apr 17 | $12,813 | $11,711 | $12,859 |
|---|
May 17 | $13,006 | $11,970 | $13,053 |
|---|
Jun 17 | $13,215 | $12,024 | $13,269 |
|---|
Jul 17 | $13,254 | $12,360 | $13,309 |
|---|
Aug 17 | $13,292 | $12,408 | $13,336 |
|---|
Sep 17 | $13,028 | $12,647 | $13,080 |
|---|
Oct 17 | $13,154 | $12,910 | $13,222 |
|---|
Nov 17 | $13,022 | $13,160 | $13,084 |
|---|
Dec 17 | $13,904 | $13,372 | $14,004 |
|---|
Jan 18 | $14,747 | $14,127 | $14,858 |
|---|
Feb 18 | $14,269 | $13,533 | $14,411 |
|---|
Mar 18 | $13,292 | $13,244 | $13,357 |
|---|
Apr 18 | $12,651 | $13,370 | $12,817 |
|---|
May 18 | $12,707 | $13,387 | $12,848 |
|---|
Jun 18 | $11,691 | $13,314 | $11,816 |
|---|
Jul 18 | $12,028 | $13,716 | $12,130 |
|---|
Aug 18 | $12,050 | $13,824 | $12,177 |
|---|
Sep 18 | $11,764 | $13,884 | $11,900 |
|---|
Oct 18 | $11,168 | $12,843 | $11,288 |
|---|
Nov 18 | $12,449 | $13,031 | $12,570 |
|---|
Dec 18 | $12,543 | $12,113 | $12,694 |
|---|
Jan 19 | $13,714 | $13,070 | $13,859 |
|---|
Feb 19 | $13,026 | $13,419 | $13,219 |
|---|
Mar 19 | $13,049 | $13,588 | $13,214 |
|---|
Apr 19 | $13,198 | $14,047 | $13,373 |
|---|
May 19 | $12,601 | $13,214 | $12,737 |
|---|
Jun 19 | $13,278 | $14,079 | $13,458 |
|---|
Jul 19 | $13,328 | $14,120 | $13,595 |
|---|
Aug 19 | $12,879 | $13,785 | $13,088 |
|---|
Sep 19 | $12,521 | $14,075 | $12,709 |
|---|
Oct 19 | $12,908 | $14,460 | $13,118 |
|---|
Nov 19 | $12,501 | $14,813 | $12,708 |
|---|
Dec 19 | $13,293 | $15,335 | $13,506 |
|---|
Jan 20 | $12,601 | $15,166 | $12,857 |
|---|
Feb 20 | $11,139 | $13,941 | $11,140 |
|---|
Mar 20 | $7,531 | $12,059 | $7,677 |
|---|
Apr 20 | $8,758 | $13,350 | $8,939 |
|---|
May 20 | $9,161 | $13,931 | $9,275 |
|---|
Jun 20 | $9,772 | $14,376 | $9,872 |
|---|
Jul 20 | $10,154 | $15,137 | $10,290 |
|---|
Aug 20 | $10,415 | $16,063 | $10,582 |
|---|
Sep 20 | $9,358 | $15,545 | $9,477 |
|---|
Oct 20 | $9,897 | $15,167 | $10,170 |
|---|
Nov 20 | $11,484 | $17,037 | $11,691 |
|---|
Dec 20 | $12,203 | $17,828 | $12,406 |
|---|
Jan 21 | $11,823 | $17,747 | $12,076 |
|---|
Feb 21 | $11,992 | $18,158 | $12,255 |
|---|
Mar 21 | $11,394 | $18,643 | $11,597 |
|---|
Apr 21 | $11,429 | $19,458 | $11,680 |
|---|
May 21 | $11,048 | $19,761 | $11,484 |
|---|
Jun 21 | $10,773 | $20,021 | $10,975 |
|---|
Jul 21 | $10,572 | $20,159 | $10,788 |
|---|
Aug 21 | $11,163 | $20,664 | $11,335 |
|---|
Sep 21 | $11,287 | $19,810 | $11,516 |
|---|
Oct 21 | $12,184 | $20,821 | $12,363 |
|---|
Nov 21 | $11,840 | $20,320 | $12,041 |
|---|
Dec 21 | $12,003 | $21,133 | $12,199 |
|---|
Jan 22 | $11,936 | $20,095 | $12,066 |
|---|
Feb 22 | $12,366 | $19,576 | $12,500 |
|---|
Mar 22 | $12,768 | $20,000 | $13,003 |
|---|
Apr 22 | $13,339 | $18,399 | $13,597 |
|---|
May 22 | $12,956 | $18,420 | $13,181 |
|---|
Jun 22 | $11,879 | $16,868 | $12,058 |
|---|
Jul 22 | $11,999 | $18,046 | $12,177 |
|---|
Aug 22 | $12,375 | $17,381 | $12,611 |
|---|
Sep 22 | $11,705 | $15,717 | $11,978 |
|---|
Oct 22 | $11,573 | $16,666 | $11,782 |
|---|
Nov 22 | $11,537 | $17,958 | $11,698 |
|---|
Dec 22 | $10,817 | $17,252 | $11,035 |
|---|
Jan 23 | $11,354 | $18,488 | $11,543 |
|---|
Feb 23 | $10,978 | $17,958 | $11,313 |
|---|
Mar 23 | $11,143 | $18,512 | $11,353 |
|---|
Apr 23 | $11,631 | $18,778 | $11,847 |
|---|
May 23 | $11,157 | $18,577 | $11,373 |
|---|
Jun 23 | $11,293 | $19,656 | $11,467 |
|---|
Jul 23 | $11,499 | $20,375 | $11,715 |
|---|
Aug 23 | $11,341 | $19,806 | $11,571 |
|---|
Sep 23 | $11,054 | $18,987 | $11,297 |
|---|
Oct 23 | $10,052 | $18,416 | $10,257 |
|---|
Nov 23 | $10,691 | $20,116 | $10,909 |
|---|
Dec 23 | $11,023 | $21,082 | $11,268 |
|---|
Jan 24 | $10,409 | $21,206 | $10,637 |
|---|
Feb 24 | $10,555 | $22,116 | $10,767 |
|---|
Mar 24 | $10,533 | $22,810 | $10,762 |
|---|
Apr 24 | $10,409 | $22,057 | $10,661 |
|---|
May 24 | $10,228 | $22,953 | $10,420 |
|---|
Jun 24 | $10,289 | $23,464 | $10,516 |
|---|
Jul 24 | $10,603 | $23,843 | $10,816 |
|---|
Aug 24 | $11,652 | $24,448 | $11,900 |
|---|
Sep 24 | $11,659 | $25,016 | $11,942 |
|---|
Oct 24 | $11,158 | $24,455 | $11,450 |
|---|
Nov 24 | $10,384 | $25,369 | $10,629 |
|---|
Dec 24 | $10,118 | $24,769 | $10,396 |
|---|
Jan 25 | $9,854 | $25,600 | $10,123 |
|---|
Feb 25 | $8,359 | $25,446 | $8,549 |
|---|
Mar 25 | $8,462 | $24,441 | $8,720 |
|---|
Apr 25 | $9,050 | $24,669 | $9,290 |
|---|
May 25 | $9,939 | $26,087 | $10,215 |
|---|
Jun 25 | $9,754 | $27,258 | $10,003 |
|---|
Jul 25 | $10,182 | $27,628 | $10,487 |
|---|
Aug 25 | $10,636 | $28,310 | $10,924 |
|---|
Sep 25 | $10,841 | $29,336 | $11,134 |
|---|
Oct 25 | $10,991 | $29,992 | $11,310 |
|---|
Nov 25 | $11,410 | $29,989 | $11,717 |
|---|
Dec 25 | $11,453 | $30,302 | $11,800 |
|---|
|
| Average Annual Return [Table Text Block] |
Average Annual Total Returns . | 1 Year | 5 Years | 10 Years |
|---|
VanEck Indonesia Index ETF | 13.19% | (1.26)% | 1.37% |
|---|
MVIS® Indonesia Index | 13.50% | (1.00)% | 1.67% |
|---|
MSCI ACWI Index | 22.34% | 11.19% | 11.72% |
|---|
The performance data quoted represents past performance. Past performance is no guarantee of future results. Performance information for the Fund may reflect temporary fee waivers, if applicable. These returns do not reflect the deduction of taxes that a shareholder would pay on Fund dividends and distributions or the sale of Fund shares. Visit vaneck.com for more recent performance information. |
| No Deduction of Taxes [Text Block] |
|
| Performance Table Market Index Changed [Text Block] |
|
| Material Change Description [Text Block] |
|
| Updated Performance Information Location [Text Block] |
|
| AssetsNet |
$ 59,226,465
|
| Holdings Count | Holding |
59
|
| Advisory Fees Paid, Amount |
$ 71,536
|
| InvestmentCompanyPortfolioTurnover |
23.00%
|
| Additional Fund Statistics [Text Block] |
- Total Net Assets$59,226,465
- Number of Portfolio Holdings59
- Portfolio Turnover Rate23%
- Advisory Fees Paid$71,536
|
| Additional Fund Statistics Significance or Limits [Text Block] |
|
| Holdings [Text Block] |
Portfolio Composition (% of Total Net Assets)Value | Value | Value |
|---|
Other assets less liabilities | | 0.2% | Real Estate | | 1.5% | Health Care | | 2.0% | Consumer Discretionary | | 2.9% | Industrials | | 6.4% | Utilities | | 7.2% | Consumer Staples | | 7.5% | Communication Services | | 8.6% | Energy | | 14.4% | Materials | | 22.2% | Financials | | 27.1% |
|
| Largest Holdings [Text Block] |
Top Ten Holdings (% of Total Net Assets)Bank Rakyat Indonesia Persero Tbk PT | | 8.0% |
|---|
Bank Central Asia Tbk PT | | 8.0% |
|---|
Bank Mandiri Persero Tbk PT | | 7.2% |
|---|
Telkom Indonesia Persero Tbk PT | | 6.2% |
|---|
Barito Renewables Energy Tbk PT | | 5.6% |
|---|
Dian Swastatika Sentosa Tbk PT | | 5.6% |
|---|
Astra International Tbk PT | | 5.1% |
|---|
Amman Mineral Internasional PT | | 3.7% |
|---|
Chandra Asri Pacific Tbk PT | | 3.6% |
|---|
Barito Pacific Tbk PT | | 3.5% |
|---|
|
| Material Fund Change [Text Block] |
|
| Summary of Change Legend [Text Block] |
|
| Updated Prospectus Web Address |
<span style="box-sizing: border-box; color: rgb(0, 0, 0); display: inline; flex-wrap: nowrap; font-size: 10.6667px; font-weight: 400; grid-area: auto; line-height: 16px; margin: 0px; overflow: visible; text-align: left; text-align-last: auto; white-space-collapse: preserve-breaks;">https://www.vaneck.com/us/en/etf-mutual-fund-finder/etfs/documents/</span>
|
| Accountant Change Statement [Text Block] |
|
| Accountant Change Disagreements [Text Block] |
|
| C000102897 |
|
| Shareholder Report [Line Items] |
|
| Fund Name |
VanEck International High Yield Bond ETF
|
| Class Name |
VanEck International High Yield Bond ETF
|
| Trading Symbol |
IHY
|
| Security Exchange Name |
NYSEArca
|
| Annual or Semi-Annual Statement [Text Block] |
This annual shareholder report contains important information about the VanEck International High Yield Bond ETF (the "Fund") for the period January 1, 2025 to December 31, 2025.
|
| Shareholder Report Annual or Semi-Annual |
Annual Shareholder Report
|
| Additional Information [Text Block] |
You can find additional information about the Fund at https://www.vaneck.com/us/en/etf-mutual-fund-finder/etfs/documents/. You can also request this information by contacting us at 800.826.2333 or info@vaneck.com.
|
| Additional Information Phone Number |
800.826.2333
|
| Additional Information Email |
<span style="box-sizing: border-box; color: rgb(0, 0, 0); display: inline; flex-wrap: nowrap; font-size: 10.6667px; font-weight: 400; grid-area: auto; line-height: 16px; margin: 0px; overflow: visible; text-align: left; text-align-last: auto; white-space-collapse: preserve-breaks;">info@vaneck.com</span>
|
| Additional Information Website |
<span style="box-sizing: border-box; color: rgb(0, 0, 0); display: inline; flex-wrap: nowrap; font-size: 10.6667px; font-weight: 400; grid-area: auto; line-height: 16px; margin: 0px; overflow: visible; text-align: left; text-align-last: auto; white-space-collapse: preserve-breaks;">https://www.vaneck.com/us/en/etf-mutual-fund-finder/etfs/documents/</span>
|
| Expenses [Text Block] |
What were the Fund costs for the last year?(based on a hypothetical $10,000 investment) Fund Name | Costs of a $10,000 investment | Costs paid as a % of a $10,000 investment |
|---|
VanEck International High Yield Bond ETF | $43 | 0.40% |
|---|
|
| Expenses Paid, Amount |
$ 43
|
| Expense Ratio, Percent |
0.40%
|
| Factors Affecting Performance [Text Block] |
How did the Fund perform last year?The Fund had a positive return over the period, benefitting from high income and foreign currency appreciation. Issuers in the Telecom, Energy and Banking sectors contributed the most to performance. There were no sectors with negative returns during the period. In terms of country of risk, France, UK and Germany had the highest contribution to performance while Puerto Rico, China, and Ghana issuers detracted.
|
| Performance Past Does Not Indicate Future [Text] |
The performance data quoted represents past performance. Past performance is no guarantee of future results.
|
| Line Graph [Table Text Block] |
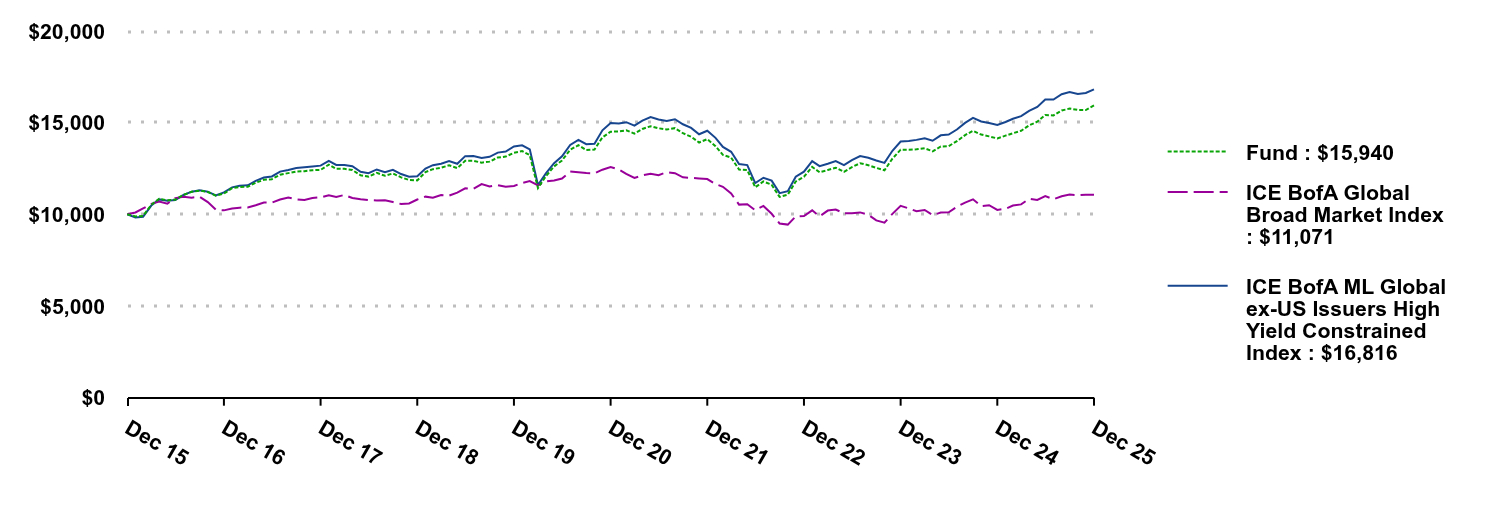 | Fund | ICE BofA Global Broad Market Index | ICE BofA ML Global ex-US Issuers High Yield Constrained Index |
|---|
Dec 15 | $10,000 | $10,000 | $10,000 |
|---|
Jan 16 | $9,889 | $10,101 | $9,831 |
|---|
Feb 16 | $9,914 | $10,323 | $9,864 |
|---|
Mar 16 | $10,518 | $10,569 | $10,479 |
|---|
Apr 16 | $10,851 | $10,704 | $10,814 |
|---|
May 16 | $10,766 | $10,585 | $10,742 |
|---|
Jun 16 | $10,801 | $10,885 | $10,779 |
|---|
Jul 16 | $11,062 | $10,963 | $11,057 |
|---|
Aug 16 | $11,228 | $10,911 | $11,237 |
|---|
Sep 16 | $11,296 | $10,962 | $11,308 |
|---|
Oct 16 | $11,218 | $10,668 | $11,237 |
|---|
Nov 16 | $11,023 | $10,261 | $11,035 |
|---|
Dec 16 | $11,130 | $10,217 | $11,199 |
|---|
Jan 17 | $11,429 | $10,319 | $11,472 |
|---|
Feb 17 | $11,493 | $10,365 | $11,559 |
|---|
Mar 17 | $11,510 | $10,375 | $11,586 |
|---|
Apr 17 | $11,724 | $10,494 | $11,826 |
|---|
May 17 | $11,883 | $10,647 | $12,007 |
|---|
Jun 17 | $11,917 | $10,637 | $12,068 |
|---|
Jul 17 | $12,162 | $10,807 | $12,329 |
|---|
Aug 17 | $12,248 | $10,917 | $12,422 |
|---|
Sep 17 | $12,332 | $10,820 | $12,523 |
|---|
Oct 17 | $12,355 | $10,783 | $12,562 |
|---|
Nov 17 | $12,409 | $10,891 | $12,605 |
|---|
Dec 17 | $12,423 | $10,927 | $12,656 |
|---|
Jan 18 | $12,712 | $11,039 | $12,915 |
|---|
Feb 18 | $12,482 | $10,943 | $12,695 |
|---|
Mar 18 | $12,483 | $11,058 | $12,696 |
|---|
Apr 18 | $12,417 | $10,889 | $12,626 |
|---|
May 18 | $12,131 | $10,818 | $12,320 |
|---|
Jun 18 | $12,059 | $10,778 | $12,243 |
|---|
Jul 18 | $12,259 | $10,754 | $12,448 |
|---|
Aug 18 | $12,102 | $10,770 | $12,298 |
|---|
Sep 18 | $12,233 | $10,671 | $12,431 |
|---|
Oct 18 | $12,015 | $10,562 | $12,197 |
|---|
Nov 18 | $11,875 | $10,591 | $12,052 |
|---|
Dec 18 | $11,850 | $10,808 | $12,076 |
|---|
Jan 19 | $12,307 | $10,965 | $12,497 |
|---|
Feb 19 | $12,465 | $10,905 | $12,681 |
|---|
Mar 19 | $12,543 | $11,051 | $12,760 |
|---|
Apr 19 | $12,675 | $11,023 | $12,904 |
|---|
May 19 | $12,525 | $11,186 | $12,758 |
|---|
Jun 19 | $12,917 | $11,422 | $13,174 |
|---|
Jul 19 | $12,921 | $11,390 | $13,187 |
|---|
Aug 19 | $12,819 | $11,652 | $13,077 |
|---|
Sep 19 | $12,875 | $11,522 | $13,137 |
|---|
Oct 19 | $13,101 | $11,592 | $13,366 |
|---|
Nov 19 | $13,150 | $11,500 | $13,424 |
|---|
Dec 19 | $13,360 | $11,549 | $13,706 |
|---|
Jan 20 | $13,452 | $11,714 | $13,764 |
|---|
Feb 20 | $13,226 | $11,812 | $13,543 |
|---|
Mar 20 | $11,431 | $11,581 | $11,598 |
|---|
Apr 20 | $12,082 | $11,793 | $12,231 |
|---|
May 20 | $12,612 | $11,849 | $12,789 |
|---|
Jun 20 | $12,939 | $11,951 | $13,170 |
|---|
Jul 20 | $13,524 | $12,334 | $13,785 |
|---|
Aug 20 | $13,769 | $12,293 | $14,058 |
|---|
Sep 20 | $13,508 | $12,253 | $13,824 |
|---|
Oct 20 | $13,537 | $12,235 | $13,854 |
|---|
Nov 20 | $14,200 | $12,436 | $14,581 |
|---|
Dec 20 | $14,507 | $12,581 | $14,978 |
|---|
Jan 21 | $14,524 | $12,452 | $14,949 |
|---|
Feb 21 | $14,583 | $12,207 | $15,027 |
|---|
Mar 21 | $14,403 | $11,982 | $14,836 |
|---|
Apr 21 | $14,655 | $12,125 | $15,112 |
|---|
May 21 | $14,808 | $12,217 | $15,306 |
|---|
Jun 21 | $14,695 | $12,139 | $15,178 |
|---|
Jul 21 | $14,625 | $12,301 | $15,097 |
|---|
Aug 21 | $14,701 | $12,245 | $15,190 |
|---|
Sep 21 | $14,424 | $12,019 | $14,914 |
|---|
Oct 21 | $14,233 | $11,989 | $14,713 |
|---|
Nov 21 | $13,917 | $11,957 | $14,369 |
|---|
Dec 21 | $14,103 | $11,922 | $14,561 |
|---|
Jan 22 | $13,721 | $11,654 | $14,173 |
|---|
Feb 22 | $13,243 | $11,504 | $13,675 |
|---|
Mar 22 | $13,096 | $11,138 | $13,412 |
|---|
Apr 22 | $12,446 | $10,531 | $12,744 |
|---|
May 22 | $12,412 | $10,553 | $12,684 |
|---|
Jun 22 | $11,477 | $10,228 | $11,704 |
|---|
Jul 22 | $11,793 | $10,459 | $11,995 |
|---|
Aug 22 | $11,614 | $10,031 | $11,838 |
|---|
Sep 22 | $10,949 | $9,501 | $11,157 |
|---|
Oct 22 | $11,073 | $9,440 | $11,261 |
|---|
Nov 22 | $11,798 | $9,888 | $12,056 |
|---|
Dec 22 | $12,056 | $9,911 | $12,328 |
|---|
Jan 23 | $12,584 | $10,219 | $12,906 |
|---|
Feb 23 | $12,298 | $9,889 | $12,631 |
|---|
Mar 23 | $12,418 | $10,206 | $12,758 |
|---|
Apr 23 | $12,544 | $10,262 | $12,902 |
|---|
May 23 | $12,316 | $10,061 | $12,685 |
|---|
Jun 23 | $12,576 | $10,066 | $12,959 |
|---|
Jul 23 | $12,788 | $10,106 | $13,183 |
|---|
Aug 23 | $12,680 | $9,980 | $13,086 |
|---|
Sep 23 | $12,534 | $9,671 | $12,934 |
|---|
Oct 23 | $12,406 | $9,544 | $12,808 |
|---|
Nov 23 | $13,038 | $10,028 | $13,468 |
|---|
Dec 23 | $13,527 | $10,462 | $13,974 |
|---|
Jan 24 | $13,520 | $10,326 | $14,000 |
|---|
Feb 24 | $13,547 | $10,172 | $14,062 |
|---|
Mar 24 | $13,600 | $10,236 | $14,151 |
|---|
Apr 24 | $13,438 | $9,958 | $14,016 |
|---|
May 24 | $13,700 | $10,096 | $14,311 |
|---|
Jun 24 | $13,724 | $10,114 | $14,350 |
|---|
Jul 24 | $13,988 | $10,408 | $14,628 |
|---|
Aug 24 | $14,323 | $10,644 | $14,987 |
|---|
Sep 24 | $14,556 | $10,821 | $15,260 |
|---|
Oct 24 | $14,350 | $10,448 | $15,068 |
|---|
Nov 24 | $14,252 | $10,499 | $14,984 |
|---|
Dec 24 | $14,141 | $10,244 | $14,871 |
|---|
Jan 25 | $14,293 | $10,299 | $15,035 |
|---|
Feb 25 | $14,426 | $10,478 | $15,214 |
|---|
Mar 25 | $14,559 | $10,543 | $15,355 |
|---|
Apr 25 | $14,850 | $10,850 | $15,643 |
|---|
May 25 | $15,051 | $10,783 | $15,857 |
|---|
Jun 25 | $15,421 | $10,993 | $16,263 |
|---|
Jul 25 | $15,393 | $10,825 | $16,262 |
|---|
Aug 25 | $15,662 | $10,989 | $16,552 |
|---|
Sep 25 | $15,769 | $11,076 | $16,666 |
|---|
Oct 25 | $15,698 | $11,044 | $16,566 |
|---|
Nov 25 | $15,688 | $11,074 | $16,619 |
|---|
Dec 25 | $15,940 | $11,071 | $16,816 |
|---|
|
| Average Annual Return [Table Text Block] |
Average Annual Total Returns . | 1 Year | 5 Years | 10 Years |
|---|
VanEck International High Yield Bond ETF | 12.72% | 1.90% | 4.77% |
|---|
ICE BofA ML Global ex-US Issuers High Yield Constrained Index | 13.08% | 2.34% | 5.33% |
|---|
ICE BofA Global Broad Market Index | 8.08% | (2.52)% | 1.02% |
|---|
The performance data quoted represents past performance. Past performance is no guarantee of future results. Performance information for the Fund may reflect temporary fee waivers, if applicable. These returns do not reflect the deduction of taxes that a shareholder would pay on Fund dividends and distributions or the sale of Fund shares. Visit vaneck.com for more recent performance information. |
| No Deduction of Taxes [Text Block] |
|
| Performance Table Market Index Changed [Text Block] |
|
| Material Change Description [Text Block] |
|
| Updated Performance Information Location [Text Block] |
|
| AssetsNet |
$ 48,316,251
|
| Holdings Count | Holding |
567
|
| Advisory Fees Paid, Amount |
$ 145,593
|
| InvestmentCompanyPortfolioTurnover |
36.00%
|
| Additional Fund Statistics [Text Block] |
- Total Net Assets$48,316,251
- Number of Portfolio Holdings567
- Portfolio Turnover Rate36%
- Advisory Fees Paid$145,593
|
| Additional Fund Statistics Significance or Limits [Text Block] |
|
| Holdings [Text Block] |
Portfolio Composition (% of Total Net Assets)Value | Value | Value |
|---|
Other assets less liabilities | | 2.7% | Other Investments | | 0.5% | Real Estate | | 2.8% | Consumer Non-Cyclicals | | 3.2% | Healthcare | | 4.4% | Utilities | | 6.8% | Basic Materials | | 8.1% | Consumer Cyclicals | | 9.4% | Energy | | 10.5% | Technology | | 11.9% | Industrials | | 14.7% | Financials | | 25.0% |
|
| Largest Holdings [Text Block] |
Top Ten Holdings (% of Total Net Assets)Petroleos Mexicanos, 6.70%, 2/16/2032 | | 0.6% |
|---|
Petroleos Mexicanos, 7.69%, 1/23/2050 | | 0.5% |
|---|
WEPA Hygieneprodukte GmbH, 5.62%, 1/15/2031 | | 0.5% |
|---|
British Telecommunications PLC, 5.12%, 10/3/2054 | | 0.5% |
|---|
Banco BPM SpA, 4.50%, 11/26/2036 | | 0.5% |
|---|
Teva Pharmaceutical Finance Netherlands II BV, 4.38%, 5/9/2030 | | 0.5% |
|---|
InPost SA, 4.00%, 4/1/2031 | | 0.5% |
|---|
Mundys SpA, 1.88%, 2/12/2028 | | 0.5% |
|---|
Electricite de France SA, 3.38% (Perpetual maturity) | | 0.5% |
|---|
VZ Vendor Financing II BV, 2.88%, 1/15/2029 | | 0.5% |
|---|
|
| Material Fund Change [Text Block] |
|
| Summary of Change Legend [Text Block] |
|
| Updated Prospectus Web Address |
<span style="box-sizing: border-box; color: rgb(0, 0, 0); display: inline; flex-wrap: nowrap; font-size: 10.6667px; font-weight: 400; grid-area: auto; line-height: 16px; margin: 0px; overflow: visible; text-align: left; text-align-last: auto; white-space-collapse: preserve-breaks;">https://www.vaneck.com/us/en/etf-mutual-fund-finder/etfs/documents/</span>
|
| Accountant Change Statement [Text Block] |
|
| Accountant Change Disagreements [Text Block] |
|
| C000127738 |
|
| Shareholder Report [Line Items] |
|
| Fund Name |
VanEck Israel ETF
|
| Class Name |
VanEck Israel ETF
|
| Trading Symbol |
ISRA
|
| Security Exchange Name |
NYSEArca
|
| Annual or Semi-Annual Statement [Text Block] |
This annual shareholder report contains important information about the VanEck Israel ETF (the "Fund") for the period January 1, 2025 to December 31, 2025.
|
| Shareholder Report Annual or Semi-Annual |
Annual Shareholder Report
|
| Additional Information [Text Block] |
You can find additional information about the Fund at https://www.vaneck.com/us/en/etf-mutual-fund-finder/etfs/documents/. You can also request this information by contacting us at 800.826.2333 or info@vaneck.com.
|
| Additional Information Phone Number |
800.826.2333
|
| Additional Information Email |
<span style="box-sizing: border-box; color: rgb(0, 0, 0); display: inline; flex-wrap: nowrap; font-size: 10.6667px; font-weight: 400; grid-area: auto; line-height: 16px; margin: 0px; overflow: visible; text-align: left; text-align-last: auto; white-space-collapse: preserve-breaks;">info@vaneck.com</span>
|
| Additional Information Website |
<span style="box-sizing: border-box; color: rgb(0, 0, 0); display: inline; flex-wrap: nowrap; font-size: 10.6667px; font-weight: 400; grid-area: auto; line-height: 16px; margin: 0px; overflow: visible; text-align: left; text-align-last: auto; white-space-collapse: preserve-breaks;">https://www.vaneck.com/us/en/etf-mutual-fund-finder/etfs/documents/</span>
|
| Expenses [Text Block] |
What were the Fund costs for the last year?(based on a hypothetical $10,000 investment) Fund Name | Costs of a $10,000 investment | Costs paid as a % of a $10,000 investment |
|---|
VanEck Israel ETF | $70 | 0.59% |
|---|
|
| Expenses Paid, Amount |
$ 70
|
| Expense Ratio, Percent |
0.59%
|
| Factors Affecting Performance [Text Block] |
How did the Fund perform last year?The Fund posted a positive return over the period, supported by solid corporate balance sheets and continued innovation activity, despite persistent geopolitical tensions and heightened regional uncertainty that weighed on investor sentiment at various points during the year. The Financials sector contributed the most to the Fund’s performance during the period, followed by Information Technology and Industrials. The leading individual contributors to performance were Bank Leumi Le-Israel B.M., Bank Hapoalim BM and Elbit Systems Ltd. The Consumer Discretionary sector detracted the most from the Fund’s performance during the period, followed by Communication Services. The leading individual detractors from performance were Wix.com Ltd., NICE Ltd. and Monday.com Ltd.
|
| Performance Past Does Not Indicate Future [Text] |
The performance data quoted represents past performance. Past performance is no guarantee of future results.
|
| Line Graph [Table Text Block] |
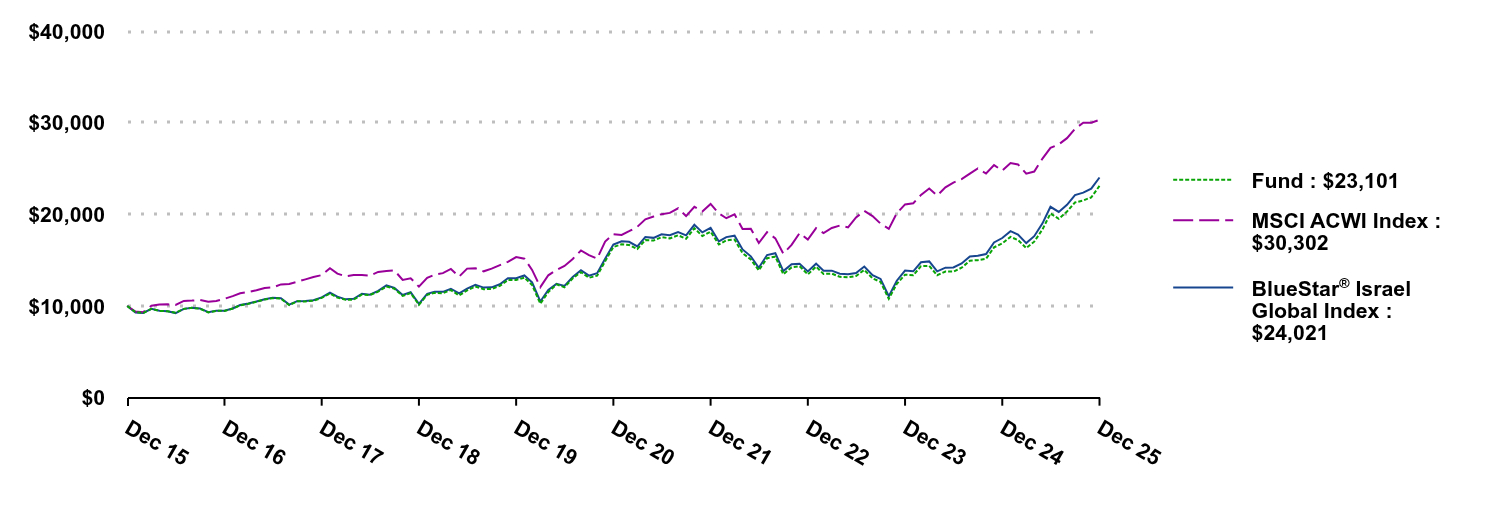 | Fund | MSCI ACWI Index | BlueStar® Israel Global Index |
|---|
Dec 15 | $10,000 | $10,000 | $10,000 |
|---|
Jan 16 | $9,337 | $9,397 | $9,281 |
|---|
Feb 16 | $9,233 | $9,332 | $9,244 |
|---|
Mar 16 | $9,701 | $10,024 | $9,700 |
|---|
Apr 16 | $9,469 | $10,172 | $9,491 |
|---|
May 16 | $9,431 | $10,185 | $9,434 |
|---|
Jun 16 | $9,257 | $10,123 | $9,229 |
|---|
Jul 16 | $9,687 | $10,559 | $9,691 |
|---|
Aug 16 | $9,802 | $10,595 | $9,806 |
|---|
Sep 16 | $9,698 | $10,660 | $9,739 |
|---|
Oct 16 | $9,306 | $10,479 | $9,321 |
|---|
Nov 16 | $9,476 | $10,558 | $9,493 |
|---|
Dec 16 | $9,469 | $10,786 | $9,488 |
|---|
Jan 17 | $9,720 | $11,081 | $9,728 |
|---|
Feb 17 | $10,083 | $11,392 | $10,109 |
|---|
Mar 17 | $10,238 | $11,532 | $10,267 |
|---|
Apr 17 | $10,457 | $11,711 | $10,489 |
|---|
May 17 | $10,714 | $11,970 | $10,742 |
|---|
Jun 17 | $10,856 | $12,024 | $10,907 |
|---|
Jul 17 | $10,806 | $12,360 | $10,852 |
|---|
Aug 17 | $10,101 | $12,408 | $10,155 |
|---|
Sep 17 | $10,513 | $12,647 | $10,529 |
|---|
Oct 17 | $10,499 | $12,910 | $10,534 |
|---|
Nov 17 | $10,587 | $13,160 | $10,632 |
|---|
Dec 17 | $10,885 | $13,372 | $10,937 |
|---|
Jan 18 | $11,358 | $14,127 | $11,448 |
|---|
Feb 18 | $10,910 | $13,533 | $11,026 |
|---|
Mar 18 | $10,688 | $13,244 | $10,729 |
|---|
Apr 18 | $10,699 | $13,370 | $10,782 |
|---|
May 18 | $11,254 | $13,387 | $11,340 |
|---|
Jun 18 | $11,197 | $13,314 | $11,242 |
|---|
Jul 18 | $11,573 | $13,716 | $11,652 |
|---|
Aug 18 | $12,125 | $13,824 | $12,243 |
|---|
Sep 18 | $11,892 | $13,884 | $11,979 |
|---|
Oct 18 | $11,100 | $12,843 | $11,200 |
|---|
Nov 18 | $11,416 | $13,031 | $11,517 |
|---|
Dec 18 | $10,130 | $12,113 | $10,241 |
|---|
Jan 19 | $11,225 | $13,070 | $11,333 |
|---|
Feb 19 | $11,434 | $13,419 | $11,562 |
|---|
Mar 19 | $11,394 | $13,588 | $11,546 |
|---|
Apr 19 | $11,741 | $14,047 | $11,883 |
|---|
May 19 | $11,160 | $13,214 | $11,379 |
|---|
Jun 19 | $11,701 | $14,079 | $11,890 |
|---|
Jul 19 | $12,119 | $14,120 | $12,311 |
|---|
Aug 19 | $11,837 | $13,785 | $12,008 |
|---|
Sep 19 | $11,862 | $14,075 | $12,034 |
|---|
Oct 19 | $12,193 | $14,460 | $12,368 |
|---|
Nov 19 | $12,835 | $14,813 | $13,031 |
|---|
Dec 19 | $12,829 | $15,335 | $13,033 |
|---|
Jan 20 | $13,100 | $15,166 | $13,329 |
|---|
Feb 20 | $12,297 | $13,941 | $12,583 |
|---|
Mar 20 | $10,258 | $12,059 | $10,492 |
|---|
Apr 20 | $11,517 | $13,350 | $11,743 |
|---|
May 20 | $12,362 | $13,931 | $12,417 |
|---|
Jun 20 | $12,048 | $14,376 | $12,193 |
|---|
Jul 20 | $13,019 | $15,137 | $13,161 |
|---|
Aug 20 | $13,694 | $16,063 | $13,908 |
|---|
Sep 20 | $13,082 | $15,545 | $13,312 |
|---|
Oct 20 | $13,313 | $15,167 | $13,579 |
|---|
Nov 20 | $14,878 | $17,037 | $15,146 |
|---|
Dec 20 | $16,439 | $17,828 | $16,704 |
|---|
Jan 21 | $16,731 | $17,747 | $17,052 |
|---|
Feb 21 | $16,655 | $18,158 | $17,008 |
|---|
Mar 21 | $16,217 | $18,643 | $16,499 |
|---|
Apr 21 | $17,187 | $19,458 | $17,523 |
|---|
May 21 | $17,135 | $19,761 | $17,435 |
|---|
Jun 21 | $17,511 | $20,021 | $17,832 |
|---|
Jul 21 | $17,380 | $20,159 | $17,725 |
|---|
Aug 21 | $17,716 | $20,664 | $18,058 |
|---|
Sep 21 | $17,337 | $19,810 | $17,713 |
|---|
Oct 21 | $18,485 | $20,821 | $18,856 |
|---|
Nov 21 | $17,633 | $20,320 | $18,034 |
|---|
Dec 21 | $18,115 | $21,133 | $18,522 |
|---|
Jan 22 | $16,714 | $20,095 | $17,041 |
|---|
Feb 22 | $17,151 | $19,576 | $17,519 |
|---|
Mar 22 | $17,250 | $20,000 | $17,668 |
|---|
Apr 22 | $15,766 | $18,399 | $16,173 |
|---|
May 22 | $15,082 | $18,420 | $15,420 |
|---|
Jun 22 | $13,882 | $16,868 | $14,169 |
|---|
Jul 22 | $15,217 | $18,046 | $15,558 |
|---|
Aug 22 | $15,382 | $17,381 | $15,765 |
|---|
Sep 22 | $13,466 | $15,717 | $13,807 |
|---|
Oct 22 | $14,216 | $16,666 | $14,562 |
|---|
Nov 22 | $14,339 | $17,958 | $14,600 |
|---|
Dec 22 | $13,444 | $17,252 | $13,779 |
|---|
Jan 23 | $14,296 | $18,488 | $14,621 |
|---|
Feb 23 | $13,497 | $17,958 | $13,838 |
|---|
Mar 23 | $13,533 | $18,512 | $13,855 |
|---|
Apr 23 | $13,181 | $18,778 | $13,531 |
|---|
May 23 | $13,134 | $18,577 | $13,472 |
|---|
Jun 23 | $13,276 | $19,656 | $13,601 |
|---|
Jul 23 | $13,940 | $20,375 | $14,312 |
|---|
Aug 23 | $13,014 | $19,806 | $13,371 |
|---|
Sep 23 | $12,628 | $18,987 | $12,959 |
|---|
Oct 23 | $10,779 | $18,416 | $11,074 |
|---|
Nov 23 | $12,413 | $20,116 | $12,763 |
|---|
Dec 23 | $13,414 | $21,082 | $13,863 |
|---|
Jan 24 | $13,366 | $21,206 | $13,785 |
|---|
Feb 24 | $14,343 | $22,116 | $14,770 |
|---|
Mar 24 | $14,377 | $22,810 | $14,868 |
|---|
Apr 24 | $13,353 | $22,057 | $13,784 |
|---|
May 24 | $13,768 | $22,953 | $14,185 |
|---|
Jun 24 | $13,753 | $23,464 | $14,208 |
|---|
Jul 24 | $14,177 | $23,843 | $14,637 |
|---|
Aug 24 | $14,939 | $24,448 | $15,402 |
|---|
Sep 24 | $15,005 | $25,016 | $15,489 |
|---|
Oct 24 | $15,151 | $24,455 | $15,673 |
|---|
Nov 24 | $16,398 | $25,369 | $16,936 |
|---|
Dec 24 | $16,828 | $24,769 | $17,415 |
|---|
Jan 25 | $17,545 | $25,600 | $18,160 |
|---|
Feb 25 | $17,194 | $25,446 | $17,792 |
|---|
Mar 25 | $16,322 | $24,441 | $16,863 |
|---|
Apr 25 | $17,020 | $24,669 | $17,618 |
|---|
May 25 | $18,363 | $26,087 | $19,021 |
|---|
Jun 25 | $20,099 | $27,258 | $20,824 |
|---|
Jul 25 | $19,510 | $27,628 | $20,265 |
|---|
Aug 25 | $20,302 | $28,310 | $21,033 |
|---|
Sep 25 | $21,294 | $29,336 | $22,106 |
|---|
Oct 25 | $21,517 | $29,992 | $22,365 |
|---|
Nov 25 | $21,851 | $29,989 | $22,808 |
|---|
Dec 25 | $23,101 | $30,302 | $24,021 |
|---|
|
| Average Annual Return [Table Text Block] |
Average Annual Total Returns . | 1 Year | 5 Years | 10 Years |
|---|
VanEck Israel ETF | 37.28% | 7.04% | 8.73% |
|---|
BlueStar® Israel Global Index | 37.93% | 7.54% | 9.16% |
|---|
MSCI ACWI Index | 22.34% | 11.19% | 11.72% |
|---|
The performance data quoted represents past performance. Past performance is no guarantee of future results. Performance information for the Fund may reflect temporary fee waivers, if applicable. These returns do not reflect the deduction of taxes that a shareholder would pay on Fund dividends and distributions or the sale of Fund shares. Visit vaneck.com for more recent performance information. |
| No Deduction of Taxes [Text Block] |
|
| Performance Table Market Index Changed [Text Block] |
|
| Material Change Description [Text Block] |
|
| Updated Performance Information Location [Text Block] |
|
| AssetsNet |
$ 120,216,659
|
| Holdings Count | Holding |
81
|
| Advisory Fees Paid, Amount |
$ 469,551
|
| InvestmentCompanyPortfolioTurnover |
8.00%
|
| Additional Fund Statistics [Text Block] |
- Total Net Assets$120,216,659
- Number of Portfolio Holdings81
- Portfolio Turnover Rate8%
- Advisory Fees Paid$469,551
|
| Additional Fund Statistics Significance or Limits [Text Block] |
|
| Holdings [Text Block] |
Portfolio Composition (% of Total Net Assets)Value | Value | Value |
|---|
Other assets less liabilities | | 0.1% | Materials | | 1.0% | Consumer Staples | | 1.5% | Communication Services | | 1.6% | Energy | | 1.8% | Consumer Discretionary | | 2.3% | Utilities | | 3.7% | Real Estate | | 4.2% | Industrials | | 7.5% | Health Care | | 11.1% | Information Technology | | 30.7% | Financials | | 34.5% |
|
| Largest Holdings [Text Block] |
Top Ten Holdings (% of Total Net Assets)Teva Pharmaceutical Industries Ltd. | | 10.5% |
|---|
Bank Leumi Le-Israel BM | | 8.4% |
|---|
Bank Hapoalim BM | | 7.2% |
|---|
CyberArk Software Ltd. | | 6.1% |
|---|
Elbit Systems Ltd. | | 4.9% |
|---|
Check Point Software Technologies Ltd. | | 4.4% |
|---|
Israel Discount Bank Ltd. | | 3.2% |
|---|
Mizrahi Tefahot Bank Ltd. | | 3.0% |
|---|
Phoenix Financial Ltd. | | 2.5% |
|---|
Tower Semiconductor Ltd. | | 2.5% |
|---|
|
| Material Fund Change [Text Block] |
|
| Summary of Change Legend [Text Block] |
|
| Updated Prospectus Web Address |
<span style="box-sizing: border-box; color: rgb(0, 0, 0); display: inline; flex-wrap: nowrap; font-size: 10.6667px; font-weight: 400; grid-area: auto; line-height: 16px; margin: 0px; overflow: visible; text-align: left; text-align-last: auto; white-space-collapse: preserve-breaks;">https://www.vaneck.com/us/en/etf-mutual-fund-finder/etfs/documents/</span>
|
| Accountant Change Statement [Text Block] |
|
| Accountant Change Disagreements [Text Block] |
|
| C000088891 |
|
| Shareholder Report [Line Items] |
|
| Fund Name |
VanEck J.P. Morgan EM Local Currency Bond ETF
|
| Class Name |
VanEck J.P. Morgan EM Local Currency Bond ETF
|
| Trading Symbol |
EMLC
|
| Security Exchange Name |
NYSEArca
|
| Annual or Semi-Annual Statement [Text Block] |
This annual shareholder report contains important information about the VanEck J.P. Morgan EM Local Currency Bond ETF (the "Fund") for the period January 1, 2025 to December 31, 2025.
|
| Shareholder Report Annual or Semi-Annual |
Annual Shareholder Report
|
| Additional Information [Text Block] |
You can find additional information about the Fund at https://www.vaneck.com/us/en/etf-mutual-fund-finder/etfs/documents/. You can also request this information by contacting us at 800.826.2333 or info@vaneck.com.
|
| Additional Information Phone Number |
800.826.2333
|
| Additional Information Email |
<span style="box-sizing: border-box; color: rgb(0, 0, 0); display: inline; flex-wrap: nowrap; font-size: 10.6667px; font-weight: 400; grid-area: auto; line-height: 16px; margin: 0px; overflow: visible; text-align: left; text-align-last: auto; white-space-collapse: preserve-breaks;">info@vaneck.com</span>
|
| Additional Information Website |
<span style="box-sizing: border-box; color: rgb(0, 0, 0); display: inline; flex-wrap: nowrap; font-size: 10.6667px; font-weight: 400; grid-area: auto; line-height: 16px; margin: 0px; overflow: visible; text-align: left; text-align-last: auto; white-space-collapse: preserve-breaks;">https://www.vaneck.com/us/en/etf-mutual-fund-finder/etfs/documents/</span>
|
| Expenses [Text Block] |
What were the Fund costs for the last year?(based on a hypothetical $10,000 investment) Fund Name | Costs of a $10,000 investment | Costs paid as a % of a $10,000 investment |
|---|
VanEck J.P. Morgan EM Local Currency Bond ETF | $33 | 0.30% |
|---|
|
| Expenses Paid, Amount |
$ 33
|
| Expense Ratio, Percent |
0.30%
|
| Factors Affecting Performance [Text Block] |
How did the Fund perform last year?The Fund generated a strong return over the period amid trade tensions and rising geopolitical risks, as strong fundamentals kept emerging markets local currency and real yields attractive. Bonds denominated in Mexican Peso, South African Rand, and Brazilian Real were the largest contributors to performance, while bonds denominated in Dominican Pesos detracted slightly during the period. Currency appreciation and high carry contributed the most to performance during the period.
|
| Performance Past Does Not Indicate Future [Text] |
The performance data quoted represents past performance. Past performance is no guarantee of future results.
|
| Line Graph [Table Text Block] |
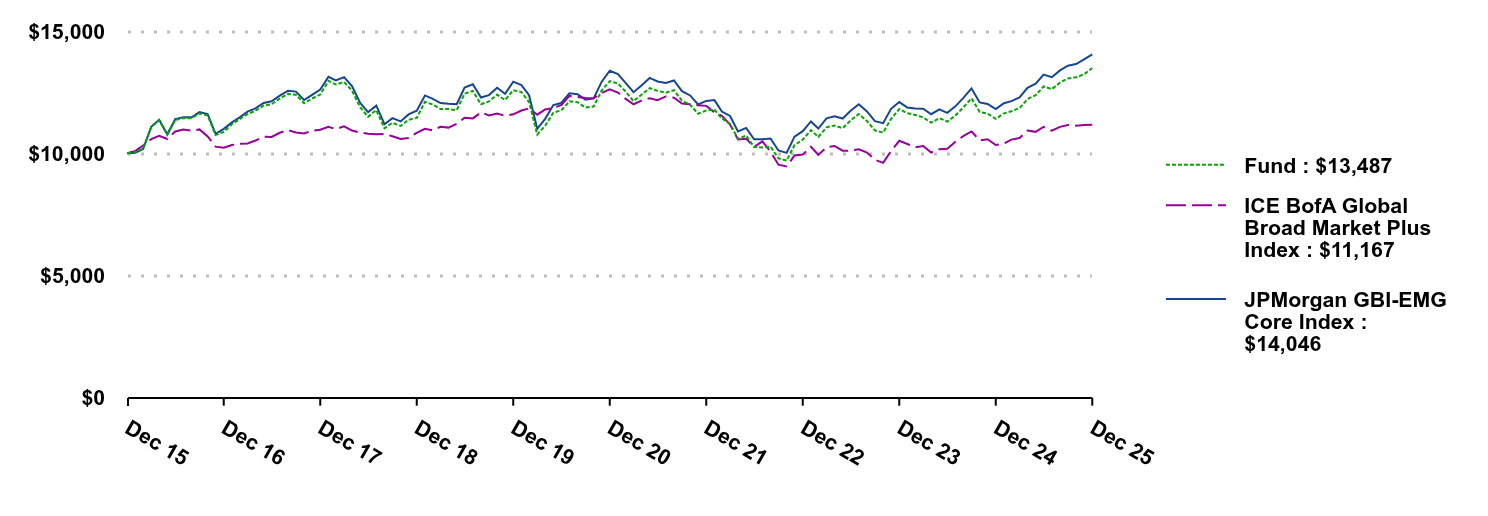 | Fund | ICE BofA Global Broad Market Plus Index | JPMorgan GBI-EMG Core Index |
|---|
Dec 15 | $10,000 | $10,000 | $10,000 |
|---|
Jan 16 | $10,050 | $10,097 | $10,019 |
|---|
Feb 16 | $10,183 | $10,314 | $10,167 |
|---|
Mar 16 | $11,073 | $10,578 | $11,080 |
|---|
Apr 16 | $11,350 | $10,713 | $11,368 |
|---|
May 16 | $10,761 | $10,581 | $10,773 |
|---|
Jun 16 | $11,363 | $10,889 | $11,391 |
|---|
Jul 16 | $11,436 | $10,972 | $11,476 |
|---|
Aug 16 | $11,434 | $10,922 | $11,472 |
|---|
Sep 16 | $11,628 | $10,975 | $11,682 |
|---|
Oct 16 | $11,543 | $10,685 | $11,603 |
|---|
Nov 16 | $10,743 | $10,268 | $10,795 |
|---|
Dec 16 | $10,876 | $10,225 | $10,995 |
|---|
Jan 17 | $11,188 | $10,336 | $11,261 |
|---|
Feb 17 | $11,387 | $10,389 | $11,455 |
|---|
Mar 17 | $11,598 | $10,402 | $11,700 |
|---|
Apr 17 | $11,737 | $10,518 | $11,835 |
|---|
May 17 | $11,947 | $10,673 | $12,057 |
|---|
Jun 17 | $12,004 | $10,664 | $12,122 |
|---|
Jul 17 | $12,237 | $10,838 | $12,355 |
|---|
Aug 17 | $12,427 | $10,947 | $12,556 |
|---|
Sep 17 | $12,391 | $10,851 | $12,520 |
|---|
Oct 17 | $12,048 | $10,808 | $12,176 |
|---|
Nov 17 | $12,238 | $10,921 | $12,390 |
|---|
Dec 17 | $12,399 | $10,961 | $12,608 |
|---|
Jan 18 | $12,959 | $11,082 | $13,128 |
|---|
Feb 18 | $12,812 | $10,984 | $12,980 |
|---|
Mar 18 | $12,916 | $11,101 | $13,112 |
|---|
Apr 18 | $12,565 | $10,929 | $12,744 |
|---|
May 18 | $11,883 | $10,845 | $12,056 |
|---|
Jun 18 | $11,490 | $10,797 | $11,685 |
|---|
Jul 18 | $11,766 | $10,780 | $11,945 |
|---|
Aug 18 | $11,020 | $10,784 | $11,187 |
|---|
Sep 18 | $11,244 | $10,695 | $11,435 |
|---|
Oct 18 | $11,115 | $10,583 | $11,302 |
|---|
Nov 18 | $11,370 | $10,622 | $11,589 |
|---|
Dec 18 | $11,446 | $10,836 | $11,737 |
|---|
Jan 19 | $12,102 | $11,001 | $12,364 |
|---|
Feb 19 | $12,001 | $10,940 | $12,235 |
|---|
Mar 19 | $11,806 | $11,079 | $12,053 |
|---|
Apr 19 | $11,806 | $11,048 | $12,020 |
|---|
May 19 | $11,764 | $11,204 | $12,003 |
|---|
Jun 19 | $12,438 | $11,451 | $12,690 |
|---|
Jul 19 | $12,551 | $11,425 | $12,821 |
|---|
Aug 19 | $12,002 | $11,671 | $12,279 |
|---|
Sep 19 | $12,119 | $11,548 | $12,378 |
|---|
Oct 19 | $12,399 | $11,624 | $12,678 |
|---|
Nov 19 | $12,174 | $11,532 | $12,434 |
|---|
Dec 19 | $12,579 | $11,591 | $12,928 |
|---|
Jan 20 | $12,501 | $11,746 | $12,787 |
|---|
Feb 20 | $12,094 | $11,833 | $12,375 |
|---|
Mar 20 | $10,762 | $11,576 | $11,000 |
|---|
Apr 20 | $11,121 | $11,792 | $11,408 |
|---|
May 20 | $11,657 | $11,857 | $11,971 |
|---|
Jun 20 | $11,753 | $11,963 | $12,054 |
|---|
Jul 20 | $12,122 | $12,344 | $12,450 |
|---|
Aug 20 | $12,088 | $12,304 | $12,414 |
|---|
Sep 20 | $11,868 | $12,263 | $12,191 |
|---|
Oct 20 | $11,909 | $12,251 | $12,243 |
|---|
Nov 20 | $12,559 | $12,463 | $12,917 |
|---|
Dec 20 | $12,953 | $12,617 | $13,374 |
|---|
Jan 21 | $12,849 | $12,483 | $13,234 |
|---|
Feb 21 | $12,536 | $12,235 | $12,892 |
|---|
Mar 21 | $12,127 | $12,004 | $12,496 |
|---|
Apr 21 | $12,391 | $12,153 | $12,770 |
|---|
May 21 | $12,661 | $12,249 | $13,081 |
|---|
Jun 21 | $12,550 | $12,169 | $12,937 |
|---|
Jul 21 | $12,477 | $12,323 | $12,876 |
|---|
Aug 21 | $12,580 | $12,272 | $12,977 |
|---|
Sep 21 | $12,146 | $12,036 | $12,540 |
|---|
Oct 21 | $11,983 | $12,003 | $12,363 |
|---|
Nov 21 | $11,617 | $11,966 | $11,994 |
|---|
Dec 21 | $11,745 | $11,937 | $12,139 |
|---|
Jan 22 | $11,783 | $11,675 | $12,173 |
|---|
Feb 22 | $11,419 | $11,530 | $11,703 |
|---|
Mar 22 | $11,200 | $11,173 | $11,524 |
|---|
Apr 22 | $10,591 | $10,564 | $10,892 |
|---|
May 22 | $10,720 | $10,593 | $11,036 |
|---|
Jun 22 | $10,250 | $10,256 | $10,567 |
|---|
Jul 22 | $10,236 | $10,486 | $10,569 |
|---|
Aug 22 | $10,273 | $10,067 | $10,602 |
|---|
Sep 22 | $9,792 | $9,531 | $10,111 |
|---|
Oct 22 | $9,699 | $9,461 | $10,013 |
|---|
Nov 22 | $10,335 | $9,907 | $10,677 |
|---|
Dec 22 | $10,553 | $9,949 | $10,904 |
|---|
Jan 23 | $10,945 | $10,265 | $11,301 |
|---|
Feb 23 | $10,665 | $9,932 | $11,009 |
|---|
Mar 23 | $11,059 | $10,245 | $11,430 |
|---|
Apr 23 | $11,134 | $10,297 | $11,516 |
|---|
May 23 | $11,025 | $10,102 | $11,420 |
|---|
Jun 23 | $11,339 | $10,104 | $11,737 |
|---|
Jul 23 | $11,603 | $10,161 | $12,003 |
|---|
Aug 23 | $11,314 | $10,029 | $11,711 |
|---|
Sep 23 | $10,931 | $9,730 | $11,309 |
|---|
Oct 23 | $10,849 | $9,607 | $11,231 |
|---|
Nov 23 | $11,406 | $10,088 | $11,816 |
|---|
Dec 23 | $11,807 | $10,509 | $12,093 |
|---|
Jan 24 | $11,634 | $10,376 | $11,867 |
|---|
Feb 24 | $11,568 | $10,238 | $11,828 |
|---|
Mar 24 | $11,462 | $10,295 | $11,822 |
|---|
Apr 24 | $11,249 | $10,029 | $11,596 |
|---|
May 24 | $11,436 | $10,165 | $11,796 |
|---|
Jun 24 | $11,295 | $10,185 | $11,653 |
|---|
Jul 24 | $11,543 | $10,469 | $11,917 |
|---|
Aug 24 | $11,887 | $10,712 | $12,272 |
|---|
Sep 24 | $12,246 | $10,893 | $12,651 |
|---|
Oct 24 | $11,690 | $10,526 | $12,079 |
|---|
Nov 24 | $11,617 | $10,571 | $12,016 |
|---|
Dec 24 | $11,409 | $10,335 | $11,803 |
|---|
Jan 25 | $11,630 | $10,397 | $12,043 |
|---|
Feb 25 | $11,716 | $10,558 | $12,133 |
|---|
Mar 25 | $11,847 | $10,622 | $12,287 |
|---|
Apr 25 | $12,215 | $10,926 | $12,677 |
|---|
May 25 | $12,374 | $10,875 | $12,845 |
|---|
Jun 25 | $12,731 | $11,082 | $13,215 |
|---|
Jul 25 | $12,621 | $10,919 | $13,110 |
|---|
Aug 25 | $12,891 | $11,078 | $13,387 |
|---|
Sep 25 | $13,060 | $11,154 | $13,579 |
|---|
Oct 25 | $13,112 | $11,129 | $13,647 |
|---|
Nov 25 | $13,229 | $11,156 | $13,836 |
|---|
Dec 25 | $13,487 | $11,167 | $14,046 |
|---|
|
| Average Annual Return [Table Text Block] |
Average Annual Total Returns . | 1 Year | 5 Years | 10 Years |
|---|
VanEck J.P. Morgan EM Local Currency Bond ETF | 18.21% | 0.81% | 3.04% |
|---|
JPMorgan GBI-EMG Core Index | 19.00% | 0.98% | 3.46% |
|---|
ICE BofA Global Broad Market Plus Index | 8.05% | (2.41)% | 1.11% |
|---|
The performance data quoted represents past performance. Past performance is no guarantee of future results. Performance information for the Fund may reflect temporary fee waivers, if applicable. These returns do not reflect the deduction of taxes that a shareholder would pay on Fund dividends and distributions or the sale of Fund shares. Visit vaneck.com for more recent performance information. |
| No Deduction of Taxes [Text Block] |
|
| Performance Table Market Index Changed [Text Block] |
|
| Material Change Description [Text Block] |
|
| Updated Performance Information Location [Text Block] |
|
| AssetsNet |
$ 4,207,214,001
|
| Holdings Count | Holding |
489
|
| Advisory Fees Paid, Amount |
$ 8,645,611
|
| InvestmentCompanyPortfolioTurnover |
26.00%
|
| Additional Fund Statistics [Text Block] |
- Total Net Assets$4,207,214,001
- Number of Portfolio Holdings489
- Portfolio Turnover Rate26%
- Advisory Fees Paid$8,645,611
|
| Additional Fund Statistics Significance or Limits [Text Block] |
|
| Holdings [Text Block] |
Portfolio Composition (% of Total Net Assets)Value | Value | Value |
|---|
Other assets less liabilities | | 2.0% | Government | | 98.0% |
|
| Largest Holdings [Text Block] |
Top Ten Holdings (% of Total Net Assets)Mexican Bonos, 7.75%, 5/29/2031 | | 0.8% |
|---|
Republic of South Africa Government Bond, 8.75%, 2/28/2048 | | 0.8% |
|---|
Brazil Notas do Tesouro Nacional, 10.00%, 1/1/2031 | | 0.8% |
|---|
Turkiye Government Bond, 30.00%, 9/12/2029 | | 0.7% |
|---|
Brazil Letras do Tesouro Nacional, 0.00%, 1/1/2029 | | 0.7% |
|---|
Republic of South Africa Government Bond, 8.88%, 2/28/2035 | | 0.7% |
|---|
Republic of South Africa Government Bond, 8.25%, 3/31/2032 | | 0.7% |
|---|
Mexican Bonos, 7.75%, 11/23/2034 | | 0.7% |
|---|
Brazil Notas do Tesouro Nacional, 10.00%, 1/1/2027 | | 0.7% |
|---|
Republic of South Africa Government Bond, 8.00%, 1/31/2030 | | 0.7% |
|---|
|
| Material Fund Change [Text Block] |
|
| Summary of Change Legend [Text Block] |
|
| Updated Prospectus Web Address |
<span style="box-sizing: border-box; color: rgb(0, 0, 0); display: inline; flex-wrap: nowrap; font-size: 10.6667px; font-weight: 400; grid-area: auto; line-height: 16px; margin: 0px; overflow: visible; text-align: left; text-align-last: auto; white-space-collapse: preserve-breaks;">https://www.vaneck.com/us/en/etf-mutual-fund-finder/etfs/documents/</span>
|
| Accountant Change Statement [Text Block] |
|
| Accountant Change Disagreements [Text Block] |
|
| C000081187 |
|
| Shareholder Report [Line Items] |
|
| Fund Name |
VanEck Junior Gold Miners ETF
|
| Class Name |
VanEck Junior Gold Miners ETF
|
| Trading Symbol |
GDXJ
|
| Security Exchange Name |
NYSEArca
|
| Annual or Semi-Annual Statement [Text Block] |
This annual shareholder report contains important information about the VanEck Junior Gold Miners ETF (the "Fund") for the period January 1, 2025 to December 31, 2025.
|
| Shareholder Report Annual or Semi-Annual |
Annual Shareholder Report
|
| Additional Information [Text Block] |
You can find additional information about the Fund at https://www.vaneck.com/us/en/etf-mutual-fund-finder/etfs/documents/. You can also request this information by contacting us at 800.826.2333 or info@vaneck.com.
|
| Additional Information Phone Number |
800.826.2333
|
| Additional Information Email |
<span style="box-sizing: border-box; color: rgb(0, 0, 0); display: inline; flex-wrap: nowrap; font-size: 10.6667px; font-weight: 400; grid-area: auto; line-height: 16px; margin: 0px; overflow: visible; text-align: left; text-align-last: auto; white-space-collapse: preserve-breaks;">info@vaneck.com</span>
|
| Additional Information Website |
<span style="box-sizing: border-box; color: rgb(0, 0, 0); display: inline; flex-wrap: nowrap; font-size: 10.6667px; font-weight: 400; grid-area: auto; line-height: 16px; margin: 0px; overflow: visible; text-align: left; text-align-last: auto; white-space-collapse: preserve-breaks;">https://www.vaneck.com/us/en/etf-mutual-fund-finder/etfs/documents/</span>
|
| Expenses [Text Block] |
What were the Fund costs for the last year?(based on a hypothetical $10,000 investment) Fund Name | Costs of a $10,000 investment | Costs paid as a % of a $10,000 investment |
|---|
VanEck Junior Gold Miners ETF | $97 | 0.52% |
|---|
|
| Expenses Paid, Amount |
$ 97
|
| Expense Ratio, Percent |
0.52%
|
| Factors Affecting Performance [Text Block] |
How did the Fund perform last year?During the period, gold prices remained well supported, reflecting continued central bank demand, easing monetary policy expectations and persistent geopolitical uncertainty. Gold mining equities benefited from higher realized gold prices and disciplined cost management, which supported cash flow generation and balance sheet strength across much of the industry. The Fund’s exposure to Canada, Australia and United States were the largest positive contributors to performance for the period. The leading individual contributors to performance were Harmony Gold, Evolution Mining and Pan American Silver. There were no detractors at the country level. Countries with the lowest contributions included Turkey, Indonesia and Peru. The leading individual detractors were Arizona Metals Corp, Pantoro Gold and Catalyst Metals.
|
| Performance Past Does Not Indicate Future [Text] |
The performance data quoted represents past performance. Past performance is no guarantee of future results.
|
| Line Graph [Table Text Block] |
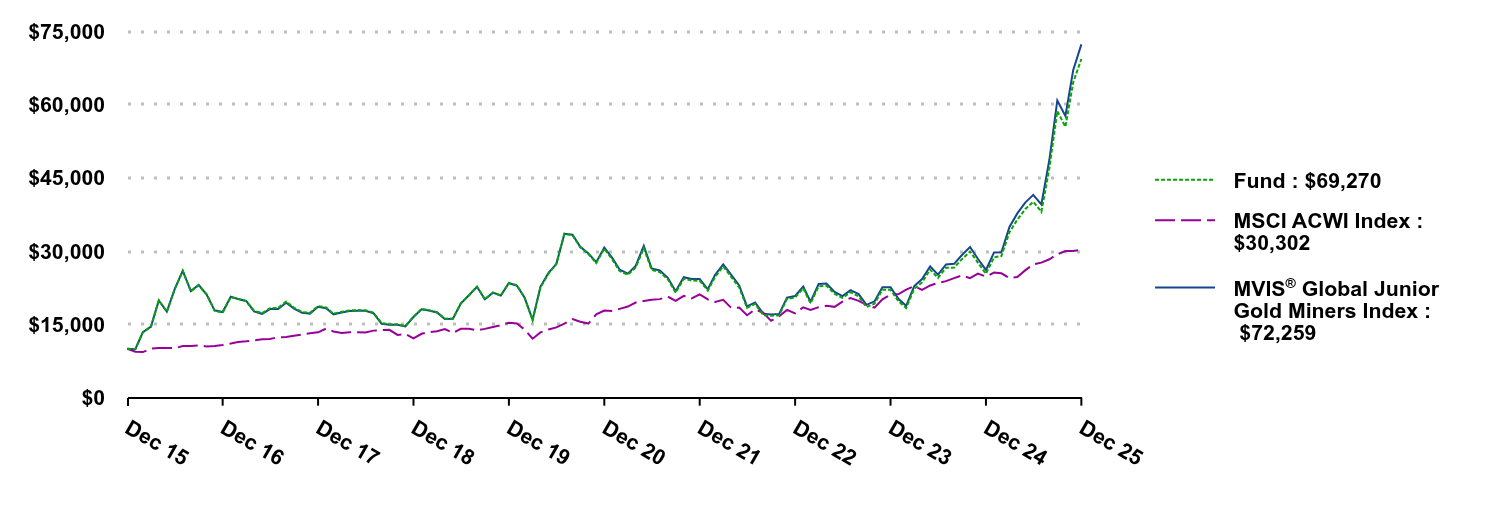 | Fund | MSCI ACWI Index | MVIS® Global Junior Gold Miners Index |
|---|
Dec 15 | $10,000 | $10,000 | $10,000 |
|---|
Jan 16 | $9,922 | $9,397 | $9,921 |
|---|
Feb 16 | $13,392 | $9,332 | $13,394 |
|---|
Mar 16 | $14,521 | $10,024 | $14,543 |
|---|
Apr 16 | $19,886 | $10,172 | $19,894 |
|---|
May 16 | $17,601 | $10,185 | $17,606 |
|---|
Jun 16 | $22,175 | $10,123 | $22,197 |
|---|
Jul 16 | $25,942 | $10,559 | $25,928 |
|---|
Aug 16 | $21,785 | $10,595 | $21,806 |
|---|
Sep 16 | $22,986 | $10,660 | $23,073 |
|---|
Oct 16 | $21,150 | $10,479 | $21,046 |
|---|
Nov 16 | $17,810 | $10,558 | $17,863 |
|---|
Dec 16 | $17,375 | $10,786 | $17,509 |
|---|
Jan 17 | $20,591 | $11,081 | $20,642 |
|---|
Feb 17 | $20,207 | $11,392 | $20,194 |
|---|
Mar 17 | $19,747 | $11,532 | $19,774 |
|---|
Apr 17 | $17,808 | $11,711 | $17,636 |
|---|
May 17 | $17,288 | $11,970 | $17,157 |
|---|
Jun 17 | $18,312 | $12,024 | $18,116 |
|---|
Jul 17 | $18,356 | $12,360 | $18,156 |
|---|
Aug 17 | $19,660 | $12,408 | $19,437 |
|---|
Sep 17 | $18,400 | $12,647 | $18,227 |
|---|
Oct 17 | $17,512 | $12,910 | $17,361 |
|---|
Nov 17 | $17,337 | $13,160 | $17,196 |
|---|
Dec 17 | $18,746 | $13,372 | $18,592 |
|---|
Jan 18 | $18,444 | $14,127 | $18,288 |
|---|
Feb 18 | $17,167 | $13,533 | $17,055 |
|---|
Mar 18 | $17,578 | $13,244 | $17,431 |
|---|
Apr 18 | $17,836 | $13,370 | $17,743 |
|---|
May 18 | $17,918 | $13,387 | $17,806 |
|---|
Jun 18 | $17,896 | $13,314 | $17,767 |
|---|
Jul 18 | $17,370 | $13,716 | $17,273 |
|---|
Aug 18 | $15,266 | $13,824 | $15,116 |
|---|
Sep 18 | $14,992 | $13,884 | $14,916 |
|---|
Oct 18 | $15,008 | $12,843 | $14,925 |
|---|
Nov 18 | $14,658 | $13,031 | $14,585 |
|---|
Dec 18 | $16,574 | $12,113 | $16,501 |
|---|
Jan 19 | $18,143 | $13,070 | $18,073 |
|---|
Feb 19 | $17,890 | $13,419 | $17,850 |
|---|
Mar 19 | $17,483 | $13,588 | $17,441 |
|---|
Apr 19 | $16,162 | $14,047 | $16,110 |
|---|
May 19 | $16,211 | $13,214 | $16,144 |
|---|
Jun 19 | $19,294 | $14,079 | $19,253 |
|---|
Jul 19 | $20,905 | $14,120 | $20,941 |
|---|
Aug 19 | $22,725 | $13,785 | $22,680 |
|---|
Sep 19 | $20,142 | $14,075 | $20,138 |
|---|
Oct 19 | $21,507 | $14,460 | $21,489 |
|---|
Nov 19 | $20,896 | $14,813 | $20,890 |
|---|
Dec 19 | $23,422 | $15,335 | $23,461 |
|---|
Jan 20 | $22,987 | $15,166 | $22,901 |
|---|
Feb 20 | $20,474 | $13,941 | $20,517 |
|---|
Mar 20 | $15,879 | $12,059 | $15,922 |
|---|
Apr 20 | $22,518 | $13,350 | $22,687 |
|---|
May 20 | $25,387 | $13,931 | $25,537 |
|---|
Jun 20 | $27,358 | $14,376 | $27,325 |
|---|
Jul 20 | $33,549 | $15,137 | $33,526 |
|---|
Aug 20 | $33,193 | $16,063 | $33,334 |
|---|
Sep 20 | $30,766 | $15,545 | $30,851 |
|---|
Oct 20 | $29,389 | $15,167 | $29,512 |
|---|
Nov 20 | $27,565 | $17,037 | $27,724 |
|---|
Dec 20 | $30,464 | $17,828 | $30,708 |
|---|
Jan 21 | $28,222 | $17,747 | $28,548 |
|---|
Feb 21 | $25,881 | $18,158 | $26,172 |
|---|
Mar 21 | $25,142 | $18,643 | $25,372 |
|---|
Apr 21 | $26,638 | $19,458 | $26,947 |
|---|
May 21 | $30,572 | $19,761 | $31,070 |
|---|
Jun 21 | $26,164 | $20,021 | $26,454 |
|---|
Jul 21 | $25,701 | $20,159 | $26,026 |
|---|
Aug 21 | $24,217 | $20,664 | $24,510 |
|---|
Sep 21 | $21,491 | $19,810 | $21,768 |
|---|
Oct 21 | $24,314 | $20,821 | $24,644 |
|---|
Nov 21 | $23,950 | $20,320 | $24,285 |
|---|
Dec 21 | $23,932 | $21,133 | $24,261 |
|---|
Jan 22 | $21,905 | $20,095 | $22,175 |
|---|
Feb 22 | $24,738 | $19,576 | $25,121 |
|---|
Mar 22 | $26,854 | $20,000 | $27,274 |
|---|
Apr 22 | $24,725 | $18,399 | $25,171 |
|---|
May 22 | $22,560 | $18,420 | $22,960 |
|---|
Jun 22 | $18,369 | $16,868 | $18,673 |
|---|
Jul 22 | $19,185 | $18,046 | $19,474 |
|---|
Aug 22 | $16,898 | $17,381 | $17,177 |
|---|
Sep 22 | $16,742 | $15,717 | $17,010 |
|---|
Oct 22 | $16,875 | $16,666 | $17,136 |
|---|
Nov 22 | $20,221 | $17,958 | $20,458 |
|---|
Dec 22 | $20,466 | $17,252 | $20,799 |
|---|
Jan 23 | $22,365 | $18,488 | $22,738 |
|---|
Feb 23 | $19,303 | $17,958 | $19,660 |
|---|
Mar 23 | $22,783 | $18,512 | $23,235 |
|---|
Apr 23 | $22,886 | $18,778 | $23,329 |
|---|
May 23 | $21,221 | $18,577 | $21,622 |
|---|
Jun 23 | $20,405 | $19,656 | $20,774 |
|---|
Jul 23 | $21,569 | $20,375 | $21,991 |
|---|
Aug 23 | $20,715 | $19,806 | $21,180 |
|---|
Sep 23 | $18,537 | $18,987 | $18,990 |
|---|
Oct 23 | $19,232 | $18,416 | $19,708 |
|---|
Nov 23 | $22,068 | $20,116 | $22,601 |
|---|
Dec 23 | $22,057 | $21,082 | $22,586 |
|---|
Jan 24 | $19,681 | $21,206 | $20,182 |
|---|
Feb 24 | $18,338 | $22,116 | $18,802 |
|---|
Mar 24 | $22,292 | $22,810 | $22,844 |
|---|
Apr 24 | $23,579 | $22,057 | $24,272 |
|---|
May 24 | $26,206 | $22,953 | $26,849 |
|---|
Jun 24 | $24,510 | $23,464 | $25,149 |
|---|
Jul 24 | $26,580 | $23,843 | $27,257 |
|---|
Aug 24 | $26,612 | $24,448 | $27,371 |
|---|
Sep 24 | $28,342 | $25,016 | $29,184 |
|---|
Oct 24 | $29,894 | $24,455 | $30,825 |
|---|
Nov 24 | $27,635 | $25,369 | $28,423 |
|---|
Dec 24 | $25,351 | $24,769 | $26,133 |
|---|
Jan 25 | $28,723 | $25,600 | $29,712 |
|---|
Feb 25 | $28,958 | $25,446 | $29,758 |
|---|
Mar 25 | $33,851 | $24,441 | $34,934 |
|---|
Apr 25 | $36,401 | $24,669 | $37,696 |
|---|
May 25 | $38,604 | $26,087 | $39,962 |
|---|
Jun 25 | $40,083 | $27,258 | $41,481 |
|---|
Jul 25 | $38,015 | $27,628 | $39,533 |
|---|
Aug 25 | $47,071 | $28,310 | $48,765 |
|---|
Sep 25 | $58,596 | $29,336 | $60,800 |
|---|
Oct 25 | $55,428 | $29,992 | $57,616 |
|---|
Nov 25 | $64,536 | $29,989 | $67,048 |
|---|
Dec 25 | $69,270 | $30,302 | $72,259 |
|---|
|
| Average Annual Return [Table Text Block] |
Average Annual Total Returns . | 1 Year | 5 Years | 10 Years |
|---|
VanEck Junior Gold Miners ETF | 173.25% | 17.86% | 21.35% |
|---|
MVIS® Global Junior Gold Miners Index | 176.50% | 18.67% | 21.87% |
|---|
MSCI ACWI Index | 22.34% | 11.19% | 11.72% |
|---|
The performance data quoted represents past performance. Past performance is no guarantee of future results. Performance information for the Fund may reflect temporary fee waivers, if applicable. These returns do not reflect the deduction of taxes that a shareholder would pay on Fund dividends and distributions or the sale of Fund shares. Visit vaneck.com for more recent performance information. |
| No Deduction of Taxes [Text Block] |
|
| Performance Table Market Index Changed [Text Block] |
|
| Material Change Description [Text Block] |
|
| Updated Performance Information Location [Text Block] |
|
| AssetsNet |
$ 9,405,743,590
|
| Holdings Count | Holding |
92
|
| Advisory Fees Paid, Amount |
$ 31,712,302
|
| InvestmentCompanyPortfolioTurnover |
36.00%
|
| Additional Fund Statistics [Text Block] |
- Total Net Assets$9,405,743,590
- Number of Portfolio Holdings92
- Portfolio Turnover Rate36%
- Advisory Fees Paid$31,712,302
|
| Additional Fund Statistics Significance or Limits [Text Block] |
|
| Holdings [Text Block] |
Portfolio Composition (% of Total Net Assets)Value | Value | Value |
|---|
Other assets less liabilities | | 0.2% | Precious Metals & Minerals | | 3.6% | Diversified Metals & Mining | | 4.6% | Silver | | 8.0% | Gold | | 83.6% |
|
| Largest Holdings [Text Block] |
Top Ten Holdings (% of Total Net Assets)Pan American Silver Corp. | | 7.0% |
|---|
Alamos Gold, Inc. | | 6.3% |
|---|
Coeur Mining, Inc. | | 5.7% |
|---|
Equinox Gold Corp. | | 5.5% |
|---|
Royal Gold, Inc. | | 5.0% |
|---|
Industrias Penoles SAB de CV | | 3.1% |
|---|
Evolution Mining Ltd. | | 2.7% |
|---|
Endeavour Mining PLC | | 2.6% |
|---|
Hecla Mining Co. | | 2.5% |
|---|
IAMGOLD Corp. | | 2.5% |
|---|
|
| Material Fund Change [Text Block] |
|
| Summary of Change Legend [Text Block] |
|
| Updated Prospectus Web Address |
<span style="box-sizing: border-box; color: rgb(0, 0, 0); display: inline; flex-wrap: nowrap; font-size: 10.6667px; font-weight: 400; grid-area: auto; line-height: 16px; margin: 0px; overflow: visible; text-align: left; text-align-last: auto; white-space-collapse: preserve-breaks;">https://www.vaneck.com/us/en/etf-mutual-fund-finder/etfs/documents/</span>
|
| Accountant Change Statement [Text Block] |
|
| Accountant Change Disagreements [Text Block] |
|
| C000047031 |
|
| Shareholder Report [Line Items] |
|
| Fund Name |
VanEck Low Carbon Energy ETF
|
| Class Name |
VanEck Low Carbon Energy ETF
|
| Trading Symbol |
SMOG
|
| Security Exchange Name |
NYSEArca
|
| Annual or Semi-Annual Statement [Text Block] |
This annual shareholder report contains important information about the VanEck Low Carbon Energy ETF (the "Fund") for the period January 1, 2025 to December 31, 2025.
|
| Shareholder Report Annual or Semi-Annual |
Annual Shareholder Report
|
| Additional Information [Text Block] |
You can find additional information about the Fund at https://www.vaneck.com/us/en/etf-mutual-fund-finder/etfs/documents/. You can also request this information by contacting us at 800.826.2333 or info@vaneck.com.
|
| Additional Information Phone Number |
800.826.2333
|
| Additional Information Email |
<span style="box-sizing: border-box; color: rgb(0, 0, 0); display: inline; flex-wrap: nowrap; font-size: 10.6667px; font-weight: 400; grid-area: auto; line-height: 16px; margin: 0px; overflow: visible; text-align: left; text-align-last: auto; white-space-collapse: preserve-breaks;">info@vaneck.com</span>
|
| Additional Information Website |
<span style="box-sizing: border-box; color: rgb(0, 0, 0); display: inline; flex-wrap: nowrap; font-size: 10.6667px; font-weight: 400; grid-area: auto; line-height: 16px; margin: 0px; overflow: visible; text-align: left; text-align-last: auto; white-space-collapse: preserve-breaks;">https://www.vaneck.com/us/en/etf-mutual-fund-finder/etfs/documents/</span>
|
| Expenses [Text Block] |
What were the Fund costs for the last year?(based on a hypothetical $10,000 investment) Fund Name | Costs of a $10,000 investment | Costs paid as a % of a $10,000 investment |
|---|
VanEck Low Carbon Energy ETF | $74 | 0.64% |
|---|
|
| Expenses Paid, Amount |
$ 74
|
| Expense Ratio, Percent |
0.64%
|
| Factors Affecting Performance [Text Block] |
How did the Fund perform last year?During the period, performance reflected improving conditions across the global low-carbon and clean energy industry, supported by continued electrification trends and increased adoption of alternative energy technologies. At the industry level, consumer discretionary and utilities sectors, specifically, electric vehicle manufacturers and electric utilities were the leading contributors to performance. The Fund’s exposure to companies in the information technology sector, with select companies from China and the United States, led overall detractors. The leading individual contributors to performance were Iberdrola SA, Enel SpA, and Vestas Wind Systems. The leading individual detractors to performance were Enphase Energy and Owens Corning.
|
| Performance Past Does Not Indicate Future [Text] |
The performance data quoted represents past performance. Past performance is no guarantee of future results.
|
| Line Graph [Table Text Block] |
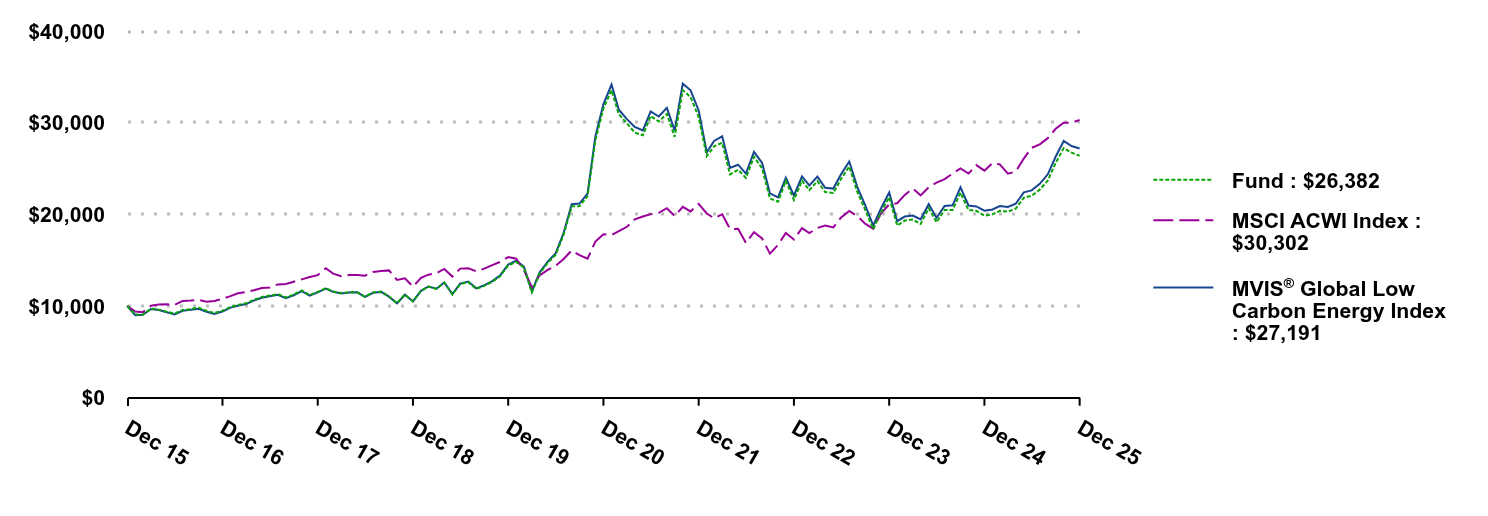 | Fund | MSCI ACWI Index | MVIS® Global Low Carbon Energy Index |
|---|
Dec 15 | $10,000 | $10,000 | $10,000 |
|---|
Jan 16 | $9,065 | $9,397 | $8,999 |
|---|
Feb 16 | $9,056 | $9,332 | $9,039 |
|---|
Mar 16 | $9,709 | $10,024 | $9,669 |
|---|
Apr 16 | $9,601 | $10,172 | $9,556 |
|---|
May 16 | $9,366 | $10,185 | $9,314 |
|---|
Jun 16 | $9,181 | $10,123 | $9,090 |
|---|
Jul 16 | $9,557 | $10,559 | $9,480 |
|---|
Aug 16 | $9,663 | $10,595 | $9,580 |
|---|
Sep 16 | $9,819 | $10,660 | $9,708 |
|---|
Oct 16 | $9,472 | $10,479 | $9,381 |
|---|
Nov 16 | $9,234 | $10,558 | $9,133 |
|---|
Dec 16 | $9,474 | $10,786 | $9,397 |
|---|
Jan 17 | $9,917 | $11,081 | $9,822 |
|---|
Feb 17 | $10,119 | $11,392 | $10,027 |
|---|
Mar 17 | $10,306 | $11,532 | $10,210 |
|---|
Apr 17 | $10,662 | $11,711 | $10,587 |
|---|
May 17 | $10,980 | $11,970 | $10,901 |
|---|
Jun 17 | $11,137 | $12,024 | $11,058 |
|---|
Jul 17 | $11,300 | $12,360 | $11,230 |
|---|
Aug 17 | $10,937 | $12,408 | $10,864 |
|---|
Sep 17 | $11,248 | $12,647 | $11,175 |
|---|
Oct 17 | $11,699 | $12,910 | $11,624 |
|---|
Nov 17 | $11,192 | $13,160 | $11,123 |
|---|
Dec 17 | $11,548 | $13,372 | $11,496 |
|---|
Jan 18 | $11,944 | $14,127 | $11,889 |
|---|
Feb 18 | $11,573 | $13,533 | $11,550 |
|---|
Mar 18 | $11,429 | $13,244 | $11,361 |
|---|
Apr 18 | $11,488 | $13,370 | $11,470 |
|---|
May 18 | $11,514 | $13,387 | $11,489 |
|---|
Jun 18 | $11,008 | $13,314 | $10,990 |
|---|
Jul 18 | $11,478 | $13,716 | $11,447 |
|---|
Aug 18 | $11,577 | $13,824 | $11,541 |
|---|
Sep 18 | $11,042 | $13,884 | $11,024 |
|---|
Oct 18 | $10,303 | $12,843 | $10,289 |
|---|
Nov 18 | $11,254 | $13,031 | $11,230 |
|---|
Dec 18 | $10,506 | $12,113 | $10,502 |
|---|
Jan 19 | $11,656 | $13,070 | $11,654 |
|---|
Feb 19 | $12,119 | $13,419 | $12,129 |
|---|
Mar 19 | $11,871 | $13,588 | $11,884 |
|---|
Apr 19 | $12,548 | $14,047 | $12,573 |
|---|
May 19 | $11,265 | $13,214 | $11,312 |
|---|
Jun 19 | $12,401 | $14,079 | $12,442 |
|---|
Jul 19 | $12,601 | $14,120 | $12,666 |
|---|
Aug 19 | $11,872 | $13,785 | $11,927 |
|---|
Sep 19 | $12,193 | $14,075 | $12,261 |
|---|
Oct 19 | $12,640 | $14,460 | $12,717 |
|---|
Nov 19 | $13,249 | $14,813 | $13,336 |
|---|
Dec 19 | $14,433 | $15,335 | $14,535 |
|---|
Jan 20 | $14,809 | $15,166 | $14,936 |
|---|
Feb 20 | $14,208 | $13,941 | $14,302 |
|---|
Mar 20 | $11,485 | $12,059 | $11,606 |
|---|
Apr 20 | $13,539 | $13,350 | $13,675 |
|---|
May 20 | $14,718 | $13,931 | $14,844 |
|---|
Jun 20 | $15,574 | $14,376 | $15,722 |
|---|
Jul 20 | $17,779 | $15,137 | $17,966 |
|---|
Aug 20 | $20,870 | $16,063 | $21,112 |
|---|
Sep 20 | $20,904 | $15,545 | $21,170 |
|---|
Oct 20 | $21,982 | $15,167 | $22,267 |
|---|
Nov 20 | $28,084 | $17,037 | $28,499 |
|---|
Dec 20 | $31,558 | $17,828 | $32,027 |
|---|
Jan 21 | $33,538 | $17,747 | $34,158 |
|---|
Feb 21 | $30,912 | $18,158 | $31,408 |
|---|
Mar 21 | $29,924 | $18,643 | $30,383 |
|---|
Apr 21 | $28,920 | $19,458 | $29,543 |
|---|
May 21 | $28,625 | $19,761 | $29,163 |
|---|
Jun 21 | $30,719 | $20,021 | $31,225 |
|---|
Jul 21 | $30,133 | $20,159 | $30,669 |
|---|
Aug 21 | $30,954 | $20,664 | $31,611 |
|---|
Sep 21 | $28,458 | $19,810 | $29,129 |
|---|
Oct 21 | $33,545 | $20,821 | $34,258 |
|---|
Nov 21 | $32,785 | $20,320 | $33,529 |
|---|
Dec 21 | $30,603 | $21,133 | $31,329 |
|---|
Jan 22 | $26,342 | $20,095 | $26,760 |
|---|
Feb 22 | $27,416 | $19,576 | $28,012 |
|---|
Mar 22 | $27,811 | $20,000 | $28,513 |
|---|
Apr 22 | $24,356 | $18,399 | $25,059 |
|---|
May 22 | $24,864 | $18,420 | $25,415 |
|---|
Jun 22 | $23,972 | $16,868 | $24,445 |
|---|
Jul 22 | $26,285 | $18,046 | $26,806 |
|---|
Aug 22 | $25,012 | $17,381 | $25,609 |
|---|
Sep 22 | $21,732 | $15,717 | $22,295 |
|---|
Oct 22 | $21,382 | $16,666 | $21,861 |
|---|
Nov 22 | $23,648 | $17,958 | $23,990 |
|---|
Dec 22 | $21,569 | $17,252 | $22,065 |
|---|
Jan 23 | $23,683 | $18,488 | $24,129 |
|---|
Feb 23 | $22,631 | $17,958 | $23,154 |
|---|
Mar 23 | $23,621 | $18,512 | $24,112 |
|---|
Apr 23 | $22,428 | $18,778 | $22,896 |
|---|
May 23 | $22,331 | $18,577 | $22,811 |
|---|
Jun 23 | $23,877 | $19,656 | $24,389 |
|---|
Jul 23 | $25,211 | $20,375 | $25,761 |
|---|
Aug 23 | $22,451 | $19,806 | $22,974 |
|---|
Sep 23 | $20,500 | $18,987 | $21,001 |
|---|
Oct 23 | $18,388 | $18,416 | $18,783 |
|---|
Nov 23 | $20,218 | $20,116 | $20,672 |
|---|
Dec 23 | $21,859 | $21,082 | $22,379 |
|---|
Jan 24 | $18,784 | $21,206 | $19,255 |
|---|
Feb 24 | $19,319 | $22,116 | $19,756 |
|---|
Mar 24 | $19,424 | $22,810 | $19,871 |
|---|
Apr 24 | $18,952 | $22,057 | $19,456 |
|---|
May 24 | $20,663 | $22,953 | $21,111 |
|---|
Jun 24 | $19,140 | $23,464 | $19,609 |
|---|
Jul 24 | $20,469 | $23,843 | $20,921 |
|---|
Aug 24 | $20,485 | $24,448 | $20,983 |
|---|
Sep 24 | $22,363 | $25,016 | $22,958 |
|---|
Oct 24 | $20,471 | $24,455 | $20,968 |
|---|
Nov 24 | $20,382 | $25,369 | $20,860 |
|---|
Dec 24 | $19,855 | $24,769 | $20,395 |
|---|
Jan 25 | $19,999 | $25,600 | $20,536 |
|---|
Feb 25 | $20,382 | $25,446 | $20,909 |
|---|
Mar 25 | $20,289 | $24,441 | $20,800 |
|---|
Apr 25 | $20,624 | $24,669 | $21,156 |
|---|
May 25 | $21,819 | $26,087 | $22,403 |
|---|
Jun 25 | $22,034 | $27,258 | $22,615 |
|---|
Jul 25 | $22,692 | $27,628 | $23,325 |
|---|
Aug 25 | $23,685 | $28,310 | $24,364 |
|---|
Sep 25 | $25,593 | $29,336 | $26,284 |
|---|
Oct 25 | $27,234 | $29,992 | $27,998 |
|---|
Nov 25 | $26,722 | $29,989 | $27,453 |
|---|
Dec 25 | $26,382 | $30,302 | $27,191 |
|---|
|
| Average Annual Return [Table Text Block] |
Average Annual Total Returns . | 1 Year | 5 Years | 10 Years |
|---|
VanEck Low Carbon Energy ETF | 32.88% | (3.52)% | 10.19% |
|---|
MVIS® Global Low Carbon Energy Index | 33.32% | (3.22)% | 10.52% |
|---|
MSCI ACWI Index | 22.34% | 11.19% | 11.72% |
|---|
MVIS Global Low Carbon Energy Index replaced the Ardour Global Index℠ (Extra Liquid) effective April 26, 2021. Index history prior to April 26, 2021 reflects the performance of the Ardour Global Index℠. The performance data quoted represents past performance. Past performance is no guarantee of future results. Performance information for the Fund may reflect temporary fee waivers, if applicable. These returns do not reflect the deduction of taxes that a shareholder would pay on Fund dividends and distributions or the sale of Fund shares. Visit vaneck.com for more recent performance information. |
| No Deduction of Taxes [Text Block] |
|
| Performance Table Market Index Changed [Text Block] |
|
| Material Change Description [Text Block] |
|
| Updated Performance Information Location [Text Block] |
|
| AssetsNet |
$ 127,498,779
|
| Holdings Count | Holding |
60
|
| Advisory Fees Paid, Amount |
$ 611,237
|
| InvestmentCompanyPortfolioTurnover |
21.00%
|
| Additional Fund Statistics [Text Block] |
- Total Net Assets$127,498,779
- Number of Portfolio Holdings60
- Portfolio Turnover Rate21%
- Advisory Fees Paid$611,237
|
| Additional Fund Statistics Significance or Limits [Text Block] |
|
| Holdings [Text Block] |
Portfolio Composition (% of Total Net Assets)Value | Value | Value |
|---|
Liabilities in excess of other assets | | (0.1)% | Other Investments | | 0.5% | Materials | | 1.3% | Information Technology | | 9.2% | Industrials | | 23.0% | Consumer Discretionary | | 27.8% | Utilities | | 38.3% |
|
| Largest Holdings [Text Block] |
Top Ten Holdings (% of Total Net Assets)Tesla, Inc. | | 8.1% |
|---|
NextEra Energy, Inc. | | 8.0% |
|---|
Iberdrola SA | | 7.4% |
|---|
Enel SpA | | 6.8% |
|---|
BYD Co. Ltd. | | 5.9% |
|---|
Vestas Wind Systems A/S | | 5.1% |
|---|
First Solar, Inc. | | 3.7% |
|---|
Rivian Automotive, Inc. | | 3.5% |
|---|
Bloom Energy Corp. | | 2.6% |
|---|
Kingspan Group PLC | | 2.4% |
|---|
|
| Material Fund Change [Text Block] |
|
| Summary of Change Legend [Text Block] |
|
| Updated Prospectus Web Address |
<span style="box-sizing: border-box; color: rgb(0, 0, 0); display: inline; flex-wrap: nowrap; font-size: 10.6667px; font-weight: 400; grid-area: auto; line-height: 16px; margin: 0px; overflow: visible; text-align: left; text-align-last: auto; white-space-collapse: preserve-breaks;">https://www.vaneck.com/us/en/etf-mutual-fund-finder/etfs/documents/</span>
|
| Accountant Change Statement [Text Block] |
|
| Accountant Change Disagreements [Text Block] |
|
| C000102386 |
|
| Shareholder Report [Line Items] |
|
| Fund Name |
VanEck Mortgage REIT Income ETF
|
| Class Name |
VanEck Mortgage REIT Income ETF
|
| Trading Symbol |
MORT
|
| Security Exchange Name |
NYSEArca
|
| Annual or Semi-Annual Statement [Text Block] |
This annual shareholder report contains important information about the VanEck Mortgage REIT Income ETF (the "Fund") for the period January 1, 2025 to December 31, 2025.
|
| Shareholder Report Annual or Semi-Annual |
Annual Shareholder Report
|
| Additional Information [Text Block] |
You can find additional information about the Fund at https://www.vaneck.com/us/en/etf-mutual-fund-finder/etfs/documents/. You can also request this information by contacting us at 800.826.2333 or info@vaneck.com.
|
| Additional Information Phone Number |
800.826.2333
|
| Additional Information Email |
<span style="box-sizing: border-box; color: rgb(0, 0, 0); display: inline; flex-wrap: nowrap; font-size: 10.6667px; font-weight: 400; grid-area: auto; line-height: 16px; margin: 0px; overflow: visible; text-align: left; text-align-last: auto; white-space-collapse: preserve-breaks;">info@vaneck.com</span>
|
| Additional Information Website |
<span style="box-sizing: border-box; color: rgb(0, 0, 0); display: inline; flex-wrap: nowrap; font-size: 10.6667px; font-weight: 400; grid-area: auto; line-height: 16px; margin: 0px; overflow: visible; text-align: left; text-align-last: auto; white-space-collapse: preserve-breaks;">https://www.vaneck.com/us/en/etf-mutual-fund-finder/etfs/documents/</span>
|
| Expenses [Text Block] |
What were the Fund costs for the last year?(based on a hypothetical $10,000 investment) Fund Name | Costs of a $10,000 investment | Costs paid as a % of a $10,000 investment |
|---|
VanEck Mortgage REIT Income ETF | $45 | 0.43% |
|---|
|
| Expenses Paid, Amount |
$ 45
|
| Expense Ratio, Percent |
0.43%
|
| Factors Affecting Performance [Text Block] |
How did the Fund perform last year?The Fund provided positive total return during the period as mortgage REITs (mREITs) benefited from improved spread dynamics driven by a steeping yield curve. Residential mREITs were the primary contributors to performance while the commercial and multi-type hybrid mREITs segments experienced more mixed outcomes. Annaly Capital Management, Inc. was the top contributor to Fund performance during the period, while Ready Capital Corp. was the greatest detractor.
|
| Performance Past Does Not Indicate Future [Text] |
The performance data quoted represents past performance. Past performance is no guarantee of future results.
|
| Line Graph [Table Text Block] |
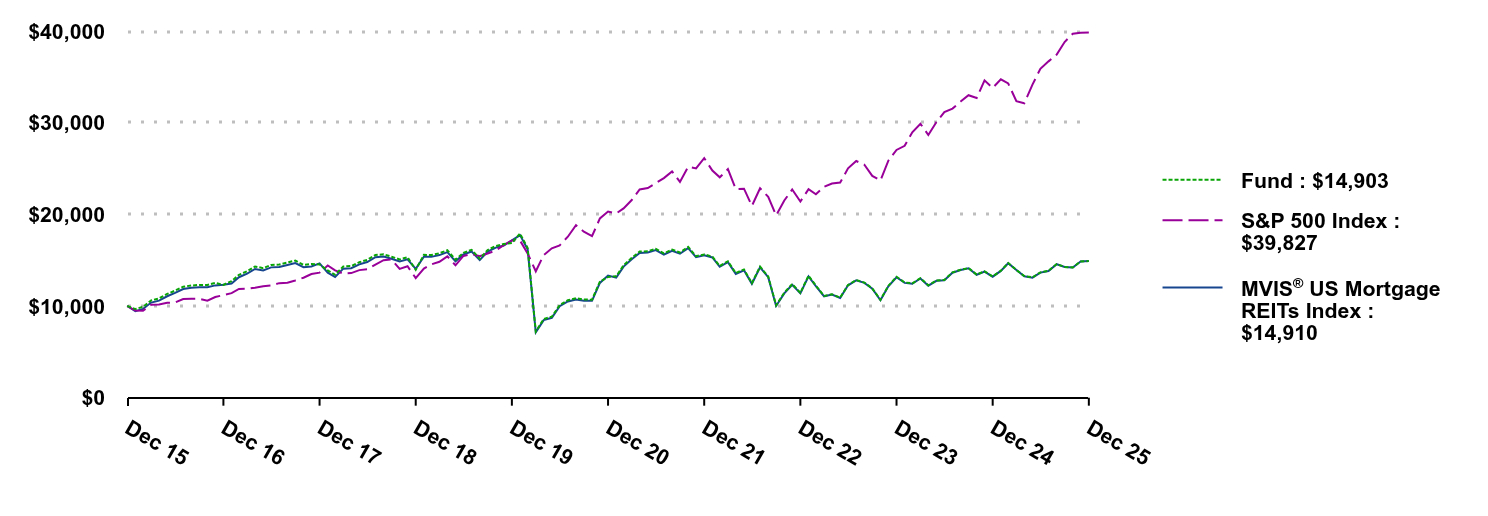 | Fund | S&P 500 Index | MVIS® US Mortgage REITs Index |
|---|
Dec 15 | $10,000 | $10,000 | $10,000 |
|---|
Jan 16 | $9,667 | $9,504 | $9,438 |
|---|
Feb 16 | $9,915 | $9,491 | $9,681 |
|---|
Mar 16 | $10,616 | $10,135 | $10,375 |
|---|
Apr 16 | $10,830 | $10,174 | $10,584 |
|---|
May 16 | $11,316 | $10,357 | $11,062 |
|---|
Jun 16 | $11,678 | $10,384 | $11,426 |
|---|
Jul 16 | $12,108 | $10,766 | $11,852 |
|---|
Aug 16 | $12,234 | $10,782 | $11,982 |
|---|
Sep 16 | $12,300 | $10,784 | $12,049 |
|---|
Oct 16 | $12,303 | $10,587 | $12,043 |
|---|
Nov 16 | $12,511 | $10,979 | $12,250 |
|---|
Dec 16 | $12,308 | $11,196 | $12,318 |
|---|
Jan 17 | $12,712 | $11,408 | $12,457 |
|---|
Feb 17 | $13,407 | $11,861 | $13,140 |
|---|
Mar 17 | $13,786 | $11,875 | $13,522 |
|---|
Apr 17 | $14,311 | $11,997 | $14,042 |
|---|
May 17 | $14,135 | $12,166 | $13,872 |
|---|
Jun 17 | $14,486 | $12,242 | $14,215 |
|---|
Jul 17 | $14,520 | $12,494 | $14,255 |
|---|
Aug 17 | $14,740 | $12,532 | $14,478 |
|---|
Sep 17 | $14,959 | $12,790 | $14,691 |
|---|
Oct 17 | $14,485 | $13,089 | $14,228 |
|---|
Nov 17 | $14,575 | $13,490 | $14,320 |
|---|
Dec 17 | $14,539 | $13,640 | $14,653 |
|---|
Jan 18 | $13,876 | $14,421 | $13,632 |
|---|
Feb 18 | $13,404 | $13,890 | $13,174 |
|---|
Mar 18 | $14,316 | $13,537 | $14,078 |
|---|
Apr 18 | $14,356 | $13,589 | $14,123 |
|---|
May 18 | $14,779 | $13,916 | $14,543 |
|---|
Jun 18 | $15,032 | $14,002 | $14,795 |
|---|
Jul 18 | $15,561 | $14,523 | $15,329 |
|---|
Aug 18 | $15,638 | $14,996 | $15,409 |
|---|
Sep 18 | $15,381 | $15,081 | $15,160 |
|---|
Oct 18 | $15,080 | $14,050 | $14,856 |
|---|
Nov 18 | $15,316 | $14,337 | $15,094 |
|---|
Dec 18 | $13,953 | $13,042 | $14,057 |
|---|
Jan 19 | $15,589 | $14,087 | $15,379 |
|---|
Feb 19 | $15,562 | $14,540 | $15,361 |
|---|
Mar 19 | $15,756 | $14,822 | $15,557 |
|---|
Apr 19 | $16,078 | $15,422 | $15,882 |
|---|
May 19 | $15,051 | $14,442 | $14,870 |
|---|
Jun 19 | $15,799 | $15,460 | $15,621 |
|---|
Jul 19 | $16,126 | $15,682 | $15,952 |
|---|
Aug 19 | $15,160 | $15,434 | $15,004 |
|---|
Sep 19 | $16,113 | $15,723 | $15,946 |
|---|
Oct 19 | $16,540 | $16,063 | $16,374 |
|---|
Nov 19 | $16,755 | $16,646 | $16,592 |
|---|
Dec 19 | $16,868 | $17,149 | $17,152 |
|---|
Jan 20 | $17,904 | $17,142 | $17,737 |
|---|
Feb 20 | $16,328 | $15,731 | $16,185 |
|---|
Mar 20 | $7,211 | $13,788 | $7,128 |
|---|
Apr 20 | $8,582 | $15,555 | $8,460 |
|---|
May 20 | $8,834 | $16,296 | $8,713 |
|---|
Jun 20 | $10,099 | $16,620 | $9,976 |
|---|
Jul 20 | $10,628 | $17,558 | $10,495 |
|---|
Aug 20 | $10,848 | $18,820 | $10,717 |
|---|
Sep 20 | $10,705 | $18,105 | $10,573 |
|---|
Oct 20 | $10,690 | $17,623 | $10,569 |
|---|
Nov 20 | $12,650 | $19,552 | $12,514 |
|---|
Dec 20 | $13,176 | $20,304 | $13,318 |
|---|
Jan 21 | $13,236 | $20,099 | $13,098 |
|---|
Feb 21 | $14,445 | $20,653 | $14,298 |
|---|
Mar 21 | $15,250 | $21,558 | $15,106 |
|---|
Apr 21 | $15,937 | $22,708 | $15,794 |
|---|
May 21 | $15,978 | $22,867 | $15,840 |
|---|
Jun 21 | $16,246 | $23,401 | $16,110 |
|---|
Jul 21 | $15,753 | $23,956 | $15,618 |
|---|
Aug 21 | $16,152 | $24,685 | $16,018 |
|---|
Sep 21 | $15,832 | $23,537 | $15,704 |
|---|
Oct 21 | $16,444 | $25,186 | $16,320 |
|---|
Nov 21 | $15,434 | $25,011 | $15,324 |
|---|
Dec 21 | $15,628 | $26,132 | $15,522 |
|---|
Jan 22 | $15,392 | $24,780 | $15,293 |
|---|
Feb 22 | $14,363 | $24,038 | $14,276 |
|---|
Mar 22 | $14,879 | $24,931 | $14,792 |
|---|
Apr 22 | $13,589 | $22,757 | $13,500 |
|---|
May 22 | $13,992 | $22,798 | $13,905 |
|---|
Jun 22 | $12,500 | $20,916 | $12,422 |
|---|
Jul 22 | $14,292 | $22,845 | $14,222 |
|---|
Aug 22 | $13,211 | $21,913 | $13,150 |
|---|
Sep 22 | $10,078 | $19,895 | $10,008 |
|---|
Oct 22 | $11,450 | $21,506 | $11,373 |
|---|
Nov 22 | $12,397 | $22,708 | $12,318 |
|---|
Dec 22 | $11,444 | $21,399 | $11,380 |
|---|
Jan 23 | $13,303 | $22,744 | $13,229 |
|---|
Feb 23 | $12,219 | $22,189 | $12,157 |
|---|
Mar 23 | $11,099 | $23,004 | $11,062 |
|---|
Apr 23 | $11,286 | $23,363 | $11,243 |
|---|
May 23 | $10,918 | $23,464 | $10,880 |
|---|
Jun 23 | $12,293 | $25,015 | $12,260 |
|---|
Jul 23 | $12,831 | $25,818 | $12,794 |
|---|
Aug 23 | $12,556 | $25,407 | $12,522 |
|---|
Sep 23 | $11,928 | $24,196 | $11,899 |
|---|
Oct 23 | $10,669 | $23,687 | $10,629 |
|---|
Nov 23 | $12,191 | $25,850 | $12,148 |
|---|
Dec 23 | $13,190 | $27,025 | $13,135 |
|---|
Jan 24 | $12,572 | $27,479 | $12,523 |
|---|
Feb 24 | $12,472 | $28,946 | $12,427 |
|---|
Mar 24 | $13,041 | $29,878 | $13,006 |
|---|
Apr 24 | $12,256 | $28,657 | $12,217 |
|---|
May 24 | $12,789 | $30,078 | $12,751 |
|---|
Jun 24 | $12,846 | $31,157 | $12,813 |
|---|
Jul 24 | $13,664 | $31,537 | $13,634 |
|---|
Aug 24 | $13,959 | $32,302 | $13,933 |
|---|
Sep 24 | $14,138 | $32,992 | $14,116 |
|---|
Oct 24 | $13,429 | $32,692 | $13,405 |
|---|
Nov 24 | $13,783 | $34,612 | $13,761 |
|---|
Dec 24 | $13,221 | $33,786 | $13,200 |
|---|
Jan 25 | $13,851 | $34,727 | $13,834 |
|---|
Feb 25 | $14,682 | $34,274 | $14,671 |
|---|
Mar 25 | $13,927 | $32,343 | $13,922 |
|---|
Apr 25 | $13,279 | $32,124 | $13,244 |
|---|
May 25 | $13,129 | $34,146 | $13,097 |
|---|
Jun 25 | $13,671 | $35,882 | $13,647 |
|---|
Jul 25 | $13,841 | $36,687 | $13,825 |
|---|
Aug 25 | $14,574 | $37,431 | $14,561 |
|---|
Sep 25 | $14,264 | $38,797 | $14,255 |
|---|
Oct 25 | $14,211 | $39,706 | $14,205 |
|---|
Nov 25 | $14,864 | $39,803 | $14,865 |
|---|
Dec 25 | $14,903 | $39,827 | $14,910 |
|---|
|
| Average Annual Return [Table Text Block] |
Average Annual Total Returns . | 1 Year | 5 Years | 10 Years |
|---|
VanEck Mortgage REIT Income ETF | 12.73% | 2.49% | 4.07% |
|---|
MVIS® US Mortgage REITs Index | 12.96% | 2.28% | 4.08% |
|---|
S&P 500 Index | 17.88% | 14.42% | 14.82% |
|---|
The performance data quoted represents past performance. Past performance is no guarantee of future results. Performance information for the Fund may reflect temporary fee waivers, if applicable. These returns do not reflect the deduction of taxes that a shareholder would pay on Fund dividends and distributions or the sale of Fund shares. Visit vaneck.com for more recent performance information. |
| No Deduction of Taxes [Text Block] |
|
| Performance Table Market Index Changed [Text Block] |
|
| Material Change Description [Text Block] |
|
| Updated Performance Information Location [Text Block] |
|
| AssetsNet |
$ 377,137,382
|
| Holdings Count | Holding |
26
|
| Advisory Fees Paid, Amount |
$ 1,253,276
|
| InvestmentCompanyPortfolioTurnover |
20.00%
|
| Additional Fund Statistics [Text Block] |
- Total Net Assets$377,137,382
- Number of Portfolio Holdings26
- Portfolio Turnover Rate20%
- Advisory Fees Paid$1,253,276
|
| Additional Fund Statistics Significance or Limits [Text Block] |
|
| Holdings [Text Block] |
Portfolio Composition (% of Total Net Assets)Value | Value | Value |
|---|
Liabilities in excess of other assets | | (0.1)% | Financial Services | | 100.1% |
|
| Largest Holdings [Text Block] |
Top Ten Holdings (% of Total Net Assets)Annaly Capital Management, Inc. | | 17.1% |
|---|
AGNC Investment Corp. | | 13.7% |
|---|
Starwood Property Trust, Inc. | | 7.7% |
|---|
Rithm Capital Corp. | | 7.1% |
|---|
ARMOUR Residential REIT, Inc. | | 4.8% |
|---|
Blackstone Mortgage Trust, Inc. | | 4.8% |
|---|
Dynex Capital, Inc. | | 4.7% |
|---|
Orchid Island Capital, Inc. | | 4.0% |
|---|
Arbor Realty Trust, Inc. | | 3.8% |
|---|
Ellington Financial, Inc. | | 3.8% |
|---|
|
| Material Fund Change [Text Block] |
|
| Summary of Change Legend [Text Block] |
|
| Updated Prospectus Web Address |
<span style="box-sizing: border-box; color: rgb(0, 0, 0); display: inline; flex-wrap: nowrap; font-size: 10.6667px; font-weight: 400; grid-area: auto; line-height: 16px; margin: 0px; overflow: visible; text-align: left; text-align-last: auto; white-space-collapse: preserve-breaks;">https://www.vaneck.com/us/en/etf-mutual-fund-finder/etfs/documents/</span>
|
| Accountant Change Statement [Text Block] |
|
| Accountant Change Disagreements [Text Block] |
|
| C000064328 |
|
| Shareholder Report [Line Items] |
|
| Fund Name |
VanEck Natural Resources ETF
|
| Class Name |
VanEck Natural Resources ETF
|
| Trading Symbol |
HAP
|
| Security Exchange Name |
NYSEArca
|
| Annual or Semi-Annual Statement [Text Block] |
This annual shareholder report contains important information about the VanEck Natural Resources ETF (the "Fund") for the period January 1, 2025 to December 31, 2025.
|
| Shareholder Report Annual or Semi-Annual |
Annual Shareholder Report
|
| Additional Information [Text Block] |
You can find additional information about the Fund at https://www.vaneck.com/us/en/etf-mutual-fund-finder/etfs/documents/. You can also request this information by contacting us at 800.826.2333 or info@vaneck.com.
|
| Additional Information Phone Number |
800.826.2333
|
| Additional Information Email |
<span style="box-sizing: border-box; color: rgb(0, 0, 0); display: inline; flex-wrap: nowrap; font-size: 10.6667px; font-weight: 400; grid-area: auto; line-height: 16px; margin: 0px; overflow: visible; text-align: left; text-align-last: auto; white-space-collapse: preserve-breaks;">info@vaneck.com</span>
|
| Additional Information Website |
<span style="box-sizing: border-box; color: rgb(0, 0, 0); display: inline; flex-wrap: nowrap; font-size: 10.6667px; font-weight: 400; grid-area: auto; line-height: 16px; margin: 0px; overflow: visible; text-align: left; text-align-last: auto; white-space-collapse: preserve-breaks;">https://www.vaneck.com/us/en/etf-mutual-fund-finder/etfs/documents/</span>
|
| Expenses [Text Block] |
What were the Fund costs for the last year?(based on a hypothetical $10,000 investment) Fund Name | Costs of a $10,000 investment | Costs paid as a % of a $10,000 investment |
|---|
VanEck Natural Resources ETF | $48 | 0.41% |
|---|
|
| Expenses Paid, Amount |
$ 48
|
| Expense Ratio, Percent |
0.41%
|
| Factors Affecting Performance [Text Block] |
How did the Fund perform last year?During the period, performance reflected improving conditions across global natural resource markets, supported by resilient energy demand and favorable commodity pricing, particularly in the metals segment. The Fund’s exposure to materials, led by gold, and energy, led by integrated oil & gas, were the leading contributors to performance, while modest positioning in real estate was the leading detractor. From a country perspective, the United States and Canada were the largest contributors to the Fund’s performance while contributions from Indonesia, Portugal, and Israel were more muted. The leading individual contributors to performance were Bayer, Newmont, Iberdrola, Agnico Eagle Mines, and Barrick Mining. The leading individual detractors were PT Amman Mineral Internasional Tbk, ONEOK, Ingredion, and Orsted.
|
| Performance Past Does Not Indicate Future [Text] |
The performance data quoted represents past performance. Past performance is no guarantee of future results.
|
| Line Graph [Table Text Block] |
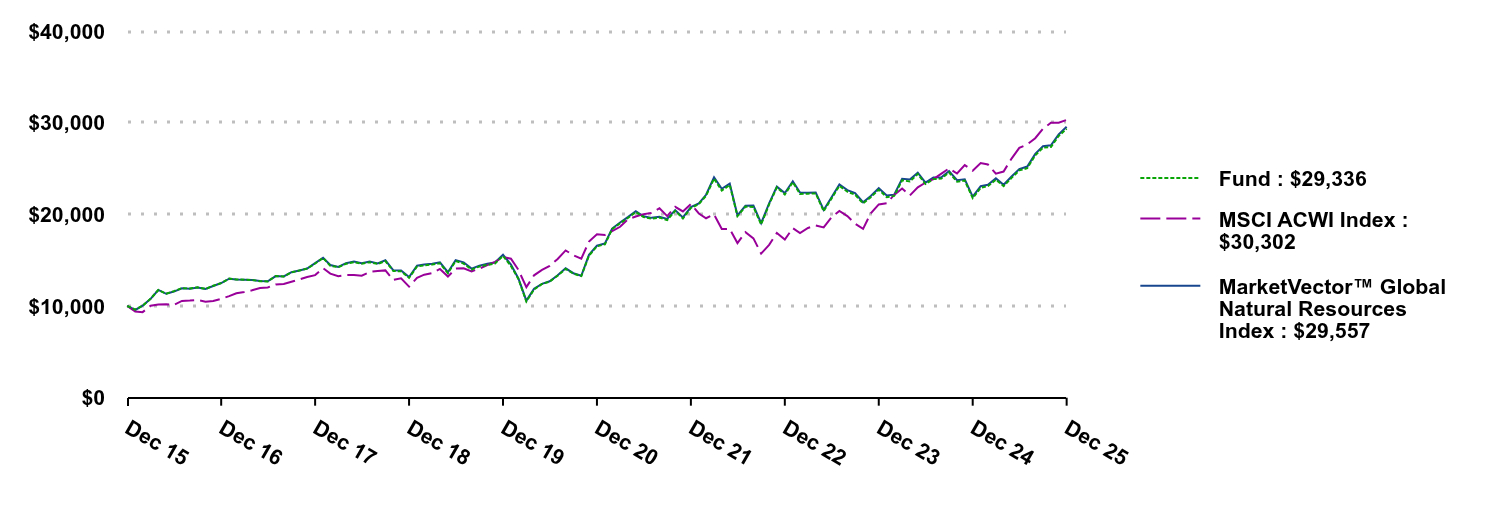 | Fund | MSCI ACWI Index | MarketVector™ Global Natural Resources Index |
|---|
Dec 15 | $10,000 | $10,000 | $10,000 |
|---|
Jan 16 | $9,610 | $9,397 | $9,566 |
|---|
Feb 16 | $10,034 | $9,332 | $10,031 |
|---|
Mar 16 | $10,788 | $10,024 | $10,787 |
|---|
Apr 16 | $11,748 | $10,172 | $11,750 |
|---|
May 16 | $11,338 | $10,185 | $11,333 |
|---|
Jun 16 | $11,619 | $10,123 | $11,576 |
|---|
Jul 16 | $11,956 | $10,559 | $11,941 |
|---|
Aug 16 | $11,907 | $10,595 | $11,896 |
|---|
Sep 16 | $12,036 | $10,660 | $12,009 |
|---|
Oct 16 | $11,857 | $10,479 | $11,852 |
|---|
Nov 16 | $12,210 | $10,558 | $12,178 |
|---|
Dec 16 | $12,493 | $10,786 | $12,504 |
|---|
Jan 17 | $13,000 | $11,081 | $12,981 |
|---|
Feb 17 | $12,903 | $11,392 | $12,896 |
|---|
Mar 17 | $12,864 | $11,532 | $12,860 |
|---|
Apr 17 | $12,834 | $11,711 | $12,840 |
|---|
May 17 | $12,714 | $11,970 | $12,717 |
|---|
Jun 17 | $12,687 | $12,024 | $12,694 |
|---|
Jul 17 | $13,263 | $12,360 | $13,269 |
|---|
Aug 17 | $13,220 | $12,408 | $13,227 |
|---|
Sep 17 | $13,673 | $12,647 | $13,684 |
|---|
Oct 17 | $13,870 | $12,910 | $13,883 |
|---|
Nov 17 | $14,075 | $13,160 | $14,084 |
|---|
Dec 17 | $14,635 | $13,372 | $14,682 |
|---|
Jan 18 | $15,242 | $14,127 | $15,273 |
|---|
Feb 18 | $14,390 | $13,533 | $14,473 |
|---|
Mar 18 | $14,240 | $13,244 | $14,261 |
|---|
Apr 18 | $14,607 | $13,370 | $14,669 |
|---|
May 18 | $14,784 | $13,387 | $14,842 |
|---|
Jun 18 | $14,607 | $13,314 | $14,677 |
|---|
Jul 18 | $14,784 | $13,716 | $14,850 |
|---|
Aug 18 | $14,587 | $13,824 | $14,649 |
|---|
Sep 18 | $14,907 | $13,884 | $14,989 |
|---|
Oct 18 | $13,818 | $12,843 | $13,897 |
|---|
Nov 18 | $13,794 | $13,031 | $13,869 |
|---|
Dec 18 | $13,070 | $12,113 | $13,151 |
|---|
Jan 19 | $14,308 | $13,070 | $14,391 |
|---|
Feb 19 | $14,438 | $13,419 | $14,536 |
|---|
Mar 19 | $14,523 | $13,588 | $14,610 |
|---|
Apr 19 | $14,669 | $14,047 | $14,759 |
|---|
May 19 | $13,582 | $13,214 | $13,685 |
|---|
Jun 19 | $14,913 | $14,079 | $15,004 |
|---|
Jul 19 | $14,629 | $14,120 | $14,769 |
|---|
Aug 19 | $13,983 | $13,785 | $14,078 |
|---|
Sep 19 | $14,309 | $14,075 | $14,405 |
|---|
Oct 19 | $14,487 | $14,460 | $14,599 |
|---|
Nov 19 | $14,639 | $14,813 | $14,743 |
|---|
Dec 19 | $15,467 | $15,335 | $15,589 |
|---|
Jan 20 | $14,358 | $15,166 | $14,521 |
|---|
Feb 20 | $12,951 | $13,941 | $13,005 |
|---|
Mar 20 | $10,492 | $12,059 | $10,584 |
|---|
Apr 20 | $11,806 | $13,350 | $11,897 |
|---|
May 20 | $12,402 | $13,931 | $12,418 |
|---|
Jun 20 | $12,670 | $14,376 | $12,695 |
|---|
Jul 20 | $13,311 | $15,137 | $13,347 |
|---|
Aug 20 | $14,050 | $16,063 | $14,108 |
|---|
Sep 20 | $13,537 | $15,545 | $13,578 |
|---|
Oct 20 | $13,262 | $15,167 | $13,304 |
|---|
Nov 20 | $15,500 | $17,037 | $15,587 |
|---|
Dec 20 | $16,508 | $17,828 | $16,579 |
|---|
Jan 21 | $16,734 | $17,747 | $16,832 |
|---|
Feb 21 | $18,385 | $18,158 | $18,449 |
|---|
Mar 21 | $19,035 | $18,643 | $19,106 |
|---|
Apr 21 | $19,600 | $19,458 | $19,702 |
|---|
May 21 | $20,251 | $19,761 | $20,349 |
|---|
Jun 21 | $19,711 | $20,021 | $19,783 |
|---|
Jul 21 | $19,538 | $20,159 | $19,616 |
|---|
Aug 21 | $19,642 | $20,664 | $19,725 |
|---|
Sep 21 | $19,377 | $19,810 | $19,499 |
|---|
Oct 21 | $20,375 | $20,821 | $20,459 |
|---|
Nov 21 | $19,558 | $20,320 | $19,665 |
|---|
Dec 21 | $20,698 | $21,133 | $20,798 |
|---|
Jan 22 | $21,127 | $20,095 | $21,188 |
|---|
Feb 22 | $22,035 | $19,576 | $22,134 |
|---|
Mar 22 | $23,889 | $20,000 | $24,046 |
|---|
Apr 22 | $22,596 | $18,399 | $22,795 |
|---|
May 22 | $23,200 | $18,420 | $23,348 |
|---|
Jun 22 | $19,804 | $16,868 | $19,895 |
|---|
Jul 22 | $20,852 | $18,046 | $20,926 |
|---|
Aug 22 | $20,803 | $17,381 | $20,952 |
|---|
Sep 22 | $18,902 | $15,717 | $19,037 |
|---|
Oct 22 | $21,087 | $16,666 | $21,196 |
|---|
Nov 22 | $22,947 | $17,958 | $23,020 |
|---|
Dec 22 | $22,167 | $17,252 | $22,314 |
|---|
Jan 23 | $23,504 | $18,488 | $23,613 |
|---|
Feb 23 | $22,227 | $17,958 | $22,382 |
|---|
Mar 23 | $22,255 | $18,512 | $22,368 |
|---|
Apr 23 | $22,284 | $18,778 | $22,394 |
|---|
May 23 | $20,347 | $18,577 | $20,480 |
|---|
Jun 23 | $21,712 | $19,656 | $21,843 |
|---|
Jul 23 | $23,112 | $20,375 | $23,260 |
|---|
Aug 23 | $22,466 | $19,806 | $22,639 |
|---|
Sep 23 | $22,148 | $18,987 | $22,323 |
|---|
Oct 23 | $21,189 | $18,416 | $21,316 |
|---|
Nov 23 | $21,876 | $20,116 | $22,012 |
|---|
Dec 23 | $22,683 | $21,082 | $22,855 |
|---|
Jan 24 | $21,878 | $21,206 | $22,068 |
|---|
Feb 24 | $22,005 | $22,116 | $22,148 |
|---|
Mar 24 | $23,708 | $22,810 | $23,877 |
|---|
Apr 24 | $23,594 | $22,057 | $23,795 |
|---|
May 24 | $24,400 | $22,953 | $24,550 |
|---|
Jun 24 | $23,306 | $23,464 | $23,468 |
|---|
Jul 24 | $23,846 | $23,843 | $24,009 |
|---|
Aug 24 | $23,898 | $24,448 | $24,052 |
|---|
Sep 24 | $24,567 | $25,016 | $24,727 |
|---|
Oct 24 | $23,565 | $24,455 | $23,726 |
|---|
Nov 24 | $23,686 | $25,369 | $23,829 |
|---|
Dec 24 | $21,776 | $24,769 | $21,928 |
|---|
Jan 25 | $22,891 | $25,600 | $23,070 |
|---|
Feb 25 | $23,081 | $25,446 | $23,223 |
|---|
Mar 25 | $23,781 | $24,441 | $23,922 |
|---|
Apr 25 | $23,083 | $24,669 | $23,226 |
|---|
May 25 | $23,976 | $26,087 | $24,126 |
|---|
Jun 25 | $24,794 | $27,258 | $24,945 |
|---|
Jul 25 | $25,041 | $27,628 | $25,213 |
|---|
Aug 25 | $26,444 | $28,310 | $26,599 |
|---|
Sep 25 | $27,264 | $29,336 | $27,424 |
|---|
Oct 25 | $27,353 | $29,992 | $27,525 |
|---|
Nov 25 | $28,554 | $29,989 | $28,720 |
|---|
Dec 25 | $29,336 | $30,302 | $29,557 |
|---|
|
| Average Annual Return [Table Text Block] |
Average Annual Total Returns . | 1 Year | 5 Years | 10 Years |
|---|
VanEck Natural Resources ETF | 34.72% | 12.19% | 11.36% |
|---|
MarketVector™ Global Natural Resources Index | 34.79% | 12.26% | 11.45% |
|---|
MSCI ACWI Index | 22.34% | 11.19% | 11.72% |
|---|
MarketVector™ Global Natural Resources Index replaced the VanEck® Natural Resources Index effective March 15, 2024. Index history prior to March 15, 2024 reflects the performance of the VanEck® Natural Resources Index. The performance data quoted represents past performance. Past performance is no guarantee of future results. Performance information for the Fund may reflect temporary fee waivers, if applicable. These returns do not reflect the deduction of taxes that a shareholder would pay on Fund dividends and distributions or the sale of Fund shares. Visit vaneck.com for more recent performance information. Effective March 15, 2024, the index that the Fund seeks to track changed from the VanEck® Natural Resources Index to the MarketVector™ Global Natural Resources Index. |
| No Deduction of Taxes [Text Block] |
|
| Performance Table Market Index Changed [Text Block] |
Effective March 15, 2024, the index that the Fund seeks to track changed from the VanEck® Natural Resources Index to the MarketVector™ Global Natural Resources Index.
|
| Material Change Description [Text Block] |
|
| Updated Performance Information Location [Text Block] |
|
| AssetsNet |
$ 204,217,447
|
| Holdings Count | Holding |
135
|
| Advisory Fees Paid, Amount |
$ 651,903
|
| InvestmentCompanyPortfolioTurnover |
21.00%
|
| Additional Fund Statistics [Text Block] |
- Total Net Assets$204,217,447
- Number of Portfolio Holdings135
- Portfolio Turnover Rate21%
- Advisory Fees Paid$651,903
|
| Additional Fund Statistics Significance or Limits [Text Block] |
|
| Holdings [Text Block] |
Portfolio Composition (% of Total Net Assets)Value | Value | Value |
|---|
Other assets less liabilities | | 0.3% | Other Investments | | 1.0% | Health Care | | 3.4% | Consumer Staples | | 6.4% | Industrials | | 9.0% | Utilities | | 10.1% | Energy | | 30.2% | Materials | | 39.6% |
|
| Largest Holdings [Text Block] |
Top Ten Holdings (% of Total Net Assets)Exxon Mobil Corp. | | 5.0% |
|---|
Chevron Corp. | | 5.0% |
|---|
Deere & Co. | | 4.9% |
|---|
NextEra Energy, Inc. | | 3.9% |
|---|
Iberdrola SA | | 3.9% |
|---|
Bayer AG | | 3.4% |
|---|
Corteva, Inc. | | 2.9% |
|---|
BHP Group Ltd. | | 2.6% |
|---|
Nutrien Ltd. | | 2.4% |
|---|
Shell PLC | | 2.3% |
|---|
|
| Material Fund Change [Text Block] |
|
| Summary of Change Legend [Text Block] |
|
| Updated Prospectus Web Address |
<span style="box-sizing: border-box; color: rgb(0, 0, 0); display: inline; flex-wrap: nowrap; font-size: 10.6667px; font-weight: 400; grid-area: auto; line-height: 16px; margin: 0px; overflow: visible; text-align: left; text-align-last: auto; white-space-collapse: preserve-breaks;">https://www.vaneck.com/us/en/etf-mutual-fund-finder/etfs/documents/</span>
|
| Accountant Change Statement [Text Block] |
|
| Accountant Change Disagreements [Text Block] |
|
| C000244874 |
|
| Shareholder Report [Line Items] |
|
| Fund Name |
VanEck Office and Commercial REIT ETF
|
| Class Name |
VanEck Office and Commercial REIT ETF
|
| Trading Symbol |
DESK
|
| Security Exchange Name |
NYSEArca
|
| Annual or Semi-Annual Statement [Text Block] |
This annual shareholder report contains important information about the VanEck Office and Commercial REIT ETF (the "Fund") for the period January 1, 2025 to December 31, 2025.
|
| Shareholder Report Annual or Semi-Annual |
Annual Shareholder Report
|
| Additional Information [Text Block] |
You can find additional information about the Fund at https://www.vaneck.com/us/en/etf-mutual-fund-finder/etfs/documents/. You can also request this information by contacting us at 800.826.2333 or info@vaneck.com.
|
| Additional Information Phone Number |
800.826.2333
|
| Additional Information Email |
<span style="box-sizing: border-box; color: rgb(0, 0, 0); display: inline; flex-wrap: nowrap; font-size: 10.6667px; font-weight: 400; grid-area: auto; line-height: 16px; margin: 0px; overflow: visible; text-align: left; text-align-last: auto; white-space-collapse: preserve-breaks;">info@vaneck.com</span>
|
| Additional Information Website |
<span style="box-sizing: border-box; color: rgb(0, 0, 0); display: inline; flex-wrap: nowrap; font-size: 10.6667px; font-weight: 400; grid-area: auto; line-height: 16px; margin: 0px; overflow: visible; text-align: left; text-align-last: auto; white-space-collapse: preserve-breaks;">https://www.vaneck.com/us/en/etf-mutual-fund-finder/etfs/documents/</span>
|
| Expenses [Text Block] |
What were the Fund costs for the last year?(based on a hypothetical $10,000 investment) Fund Name | Costs of a $10,000 investment | Costs paid as a % of a $10,000 investment |
|---|
VanEck Office and Commercial REIT ETF | $49 | 0.51% |
|---|
|
| Expenses Paid, Amount |
$ 49
|
| Expense Ratio, Percent |
0.51%
|
| Factors Affecting Performance [Text Block] |
How did the Fund perform last year?Office and commercial REITs were pressured during the period as refinancing concerns and elevated vacancies continued to weigh on the office real estate sector. Although select markets showed signs of stabilization, office REIT performance lagged amid ongoing uncertainty around long-term space demand. Paramount Group, Inc. was the top contributor to Fund performance during the period, while SL Green Realty Corp. was the greatest detractor.
|
| Performance Past Does Not Indicate Future [Text] |
The performance data quoted represents past performance. Past performance is no guarantee of future results.
|
| Line Graph [Table Text Block] |
| Fund | S&P 500 Index | MarketVector™ US Listed Office and Commercial REITs Index |
|---|
Sep 23 | $10,000 | $10,000 | $10,000 |
|---|
Sep 23 | $9,259 | $9,653 | $9,260 |
|---|
Oct 23 | $8,433 | $9,450 | $8,437 |
|---|
Nov 23 | $9,520 | $10,313 | $9,525 |
|---|
Dec 23 | $11,170 | $10,781 | $11,181 |
|---|
Jan 24 | $10,554 | $10,963 | $10,569 |
|---|
Feb 24 | $10,510 | $11,548 | $10,530 |
|---|
Mar 24 | $10,915 | $11,920 | $10,946 |
|---|
Apr 24 | $10,300 | $11,433 | $10,328 |
|---|
May 24 | $10,414 | $12,000 | $10,445 |
|---|
Jun 24 | $10,584 | $12,430 | $10,623 |
|---|
Jul 24 | $12,118 | $12,581 | $12,165 |
|---|
Aug 24 | $12,574 | $12,887 | $12,630 |
|---|
Sep 24 | $13,199 | $13,162 | $13,267 |
|---|
Oct 24 | $13,318 | $13,042 | $13,391 |
|---|
Nov 24 | $13,694 | $13,808 | $13,776 |
|---|
Dec 24 | $12,984 | $13,479 | $13,064 |
|---|
Jan 25 | $12,910 | $13,854 | $12,996 |
|---|
Feb 25 | $12,616 | $13,674 | $12,705 |
|---|
Mar 25 | $11,894 | $12,903 | $11,984 |
|---|
Apr 25 | $11,079 | $12,816 | $11,150 |
|---|
May 25 | $11,774 | $13,622 | $11,855 |
|---|
Jun 25 | $12,230 | $14,315 | $12,320 |
|---|
Jul 25 | $12,060 | $14,636 | $12,154 |
|---|
Aug 25 | $12,906 | $14,933 | $13,015 |
|---|
Sep 25 | $13,131 | $15,478 | $13,249 |
|---|
Oct 25 | $12,321 | $15,840 | $12,436 |
|---|
Nov 25 | $12,273 | $15,879 | $12,393 |
|---|
Dec 25 | $11,638 | $15,889 | $11,754 |
|---|
|
| Average Annual Return [Table Text Block] |
Average Annual Total Returns . | 1 Year | Life* |
|---|
VanEck Office and Commercial REIT ETF | (10.37)% | 6.87% |
|---|
MarketVector™ US Listed Office and Commercial REITs Index | (10.03)% | 7.34% |
|---|
S&P 500 Index | 17.88% | 22.49% |
|---|
* Inception of Fund: 09/19/2023. The performance data quoted represents past performance. Past performance is no guarantee of future results. Performance information for the Fund may reflect temporary fee waivers, if applicable. These returns do not reflect the deduction of taxes that a shareholder would pay on Fund dividends and distributions or the sale of Fund shares. Visit vaneck.com for more recent performance information. |
| Performance Inception Date |
Sep. 19, 2023
|
| No Deduction of Taxes [Text Block] |
|
| Performance Table Market Index Changed [Text Block] |
|
| Material Change Description [Text Block] |
|
| Updated Performance Information Location [Text Block] |
|
| AssetsNet |
$ 1,834,072
|
| Holdings Count | Holding |
25
|
| Advisory Fees Paid, Amount |
$ 11,140
|
| InvestmentCompanyPortfolioTurnover |
13.00%
|
| Additional Fund Statistics [Text Block] |
- Total Net Assets$1,834,072
- Number of Portfolio Holdings25
- Portfolio Turnover Rate13%
- Advisory Fees Paid$11,140
|
| Additional Fund Statistics Significance or Limits [Text Block] |
|
| Holdings [Text Block] |
Portfolio Composition (% of Total Net Assets)Value | Value | Value |
|---|
Liabilities in excess of other assets | | (0.3)% | Equity Real Estate Investment Trusts (REITs) | | 100.3% |
|
| Largest Holdings [Text Block] |
Top Ten Holdings (% of Total Net Assets)BXP, Inc. | | 10.2% |
|---|
Cousins Properties, Inc. | | 10.1% |
|---|
Vornado Realty Trust | | 10.1% |
|---|
Kilroy Realty Corp. | | 8.5% |
|---|
COPT Defense Properties | | 7.1% |
|---|
SL Green Realty Corp. | | 5.0% |
|---|
Highwoods Properties, Inc. | | 4.8% |
|---|
Simon Property Group, Inc. | | 4.3% |
|---|
Realty Income Corp. | | 4.2% |
|---|
Prologis, Inc. | | 4.2% |
|---|
|
| Material Fund Change [Text Block] |
|
| Summary of Change Legend [Text Block] |
|
| Updated Prospectus Web Address |
<span style="box-sizing: border-box; color: rgb(0, 0, 0); display: inline; flex-wrap: nowrap; font-size: 10.6667px; font-weight: 400; grid-area: auto; line-height: 16px; margin: 0px; overflow: visible; text-align: left; text-align-last: auto; white-space-collapse: preserve-breaks;">https://www.vaneck.com/us/en/etf-mutual-fund-finder/etfs/documents/</span>
|
| Accountant Change Statement [Text Block] |
|
| Accountant Change Disagreements [Text Block] |
|
| C000158570 |
|
| Shareholder Report [Line Items] |
|
| Fund Name |
VanEck Oil Refiners ETF
|
| Class Name |
VanEck Oil Refiners ETF
|
| Trading Symbol |
CRAK
|
| Security Exchange Name |
NYSEArca
|
| Annual or Semi-Annual Statement [Text Block] |
This annual shareholder report contains important information about the VanEck Oil Refiners ETF (the "Fund") for the period January 1, 2025 to December 31, 2025.
|
| Shareholder Report Annual or Semi-Annual |
Annual Shareholder Report
|
| Additional Information [Text Block] |
You can find additional information about the Fund at https://www.vaneck.com/us/en/etf-mutual-fund-finder/etfs/documents/. You can also request this information by contacting us at 800.826.2333 or info@vaneck.com.
|
| Additional Information Phone Number |
800.826.2333
|
| Additional Information Email |
<span style="box-sizing: border-box; color: rgb(0, 0, 0); display: inline; flex-wrap: nowrap; font-size: 10.6667px; font-weight: 400; grid-area: auto; line-height: 16px; margin: 0px; overflow: visible; text-align: left; text-align-last: auto; white-space-collapse: preserve-breaks;">info@vaneck.com</span>
|
| Additional Information Website |
<span style="box-sizing: border-box; color: rgb(0, 0, 0); display: inline; flex-wrap: nowrap; font-size: 10.6667px; font-weight: 400; grid-area: auto; line-height: 16px; margin: 0px; overflow: visible; text-align: left; text-align-last: auto; white-space-collapse: preserve-breaks;">https://www.vaneck.com/us/en/etf-mutual-fund-finder/etfs/documents/</span>
|
| Expenses [Text Block] |
What were the Fund costs for the last year?(based on a hypothetical $10,000 investment) Fund Name | Costs of a $10,000 investment | Costs paid as a % of a $10,000 investment |
|---|
VanEck Oil Refiners ETF | $73 | 0.61% |
|---|
|
| Expenses Paid, Amount |
$ 73
|
| Expense Ratio, Percent |
0.61%
|
| Factors Affecting Performance [Text Block] |
How did the Fund perform last year?During the period, strong refining margins and resilient demand for refined petroleum products supported performance across global downstream energy markets. The Fund’s exposure to the United States, Poland, South Korea, and Finland were the largest positive contributors to performance for the period, while exposures to Israel, Thailand, and Turkey contributed slightly. There were no overall detractors at the country level. The leading individual contributors to performance were ORLEN, HD Hyundai, and Neste. Holdings including Delek US Holdings, Bangchak and SK Innovation detracted slightly from performance during the period.
|
| Performance Past Does Not Indicate Future [Text] |
The performance data quoted represents past performance. Past performance is no guarantee of future results.
|
| Line Graph [Table Text Block] |
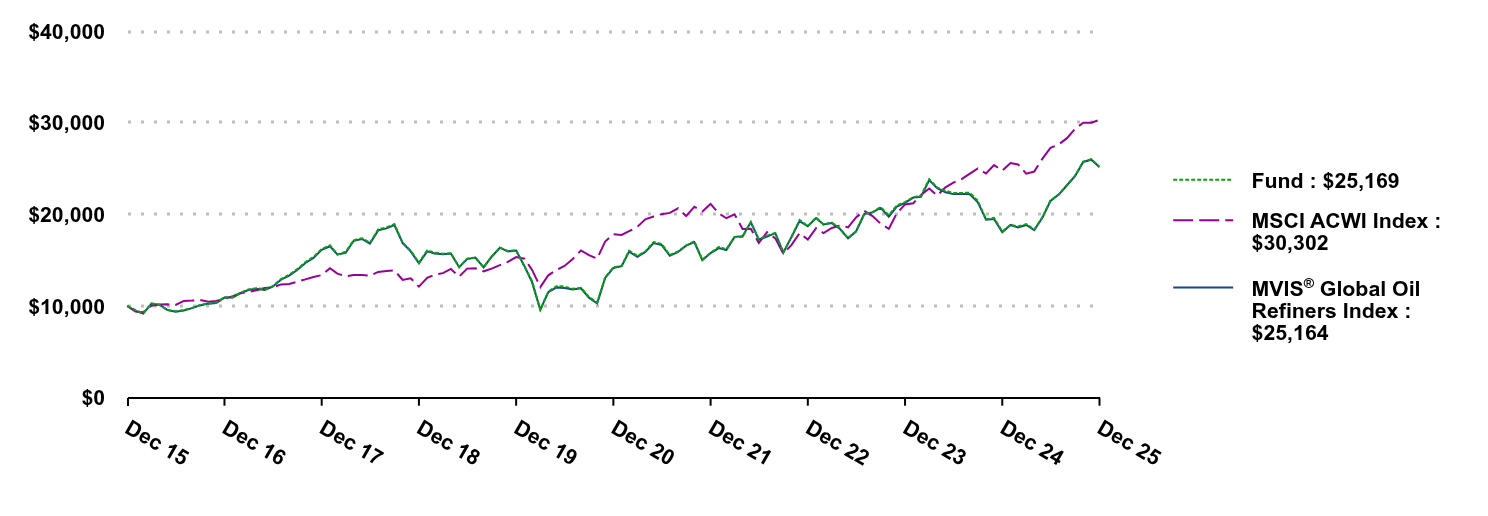 | Fund | MSCI ACWI Index | MVIS® Global Oil Refiners Index |
|---|
Dec 15 | $10,000 | $10,000 | $10,000 |
|---|
Jan 16 | $9,548 | $9,397 | $9,469 |
|---|
Feb 16 | $9,203 | $9,332 | $9,172 |
|---|
Mar 16 | $10,284 | $10,024 | $10,234 |
|---|
Apr 16 | $10,112 | $10,172 | $10,142 |
|---|
May 16 | $9,568 | $10,185 | $9,547 |
|---|
Jun 16 | $9,441 | $10,123 | $9,363 |
|---|
Jul 16 | $9,543 | $10,559 | $9,504 |
|---|
Aug 16 | $9,797 | $10,595 | $9,769 |
|---|
Sep 16 | $10,127 | $10,660 | $10,064 |
|---|
Oct 16 | $10,274 | $10,479 | $10,260 |
|---|
Nov 16 | $10,381 | $10,558 | $10,323 |
|---|
Dec 16 | $10,955 | $10,786 | $10,923 |
|---|
Jan 17 | $10,965 | $11,081 | $10,918 |
|---|
Feb 17 | $11,427 | $11,392 | $11,374 |
|---|
Mar 17 | $11,816 | $11,532 | $11,751 |
|---|
Apr 17 | $11,937 | $11,711 | $11,879 |
|---|
May 17 | $11,816 | $11,970 | $11,748 |
|---|
Jun 17 | $12,173 | $12,024 | $12,110 |
|---|
Jul 17 | $12,929 | $12,360 | $12,868 |
|---|
Aug 17 | $13,413 | $12,408 | $13,324 |
|---|
Sep 17 | $14,022 | $12,647 | $13,932 |
|---|
Oct 17 | $14,783 | $12,910 | $14,691 |
|---|
Nov 17 | $15,361 | $13,160 | $15,242 |
|---|
Dec 17 | $16,203 | $13,372 | $16,123 |
|---|
Jan 18 | $16,630 | $14,127 | $16,512 |
|---|
Feb 18 | $15,622 | $13,533 | $15,627 |
|---|
Mar 18 | $15,921 | $13,244 | $15,790 |
|---|
Apr 18 | $17,179 | $13,370 | $17,116 |
|---|
May 18 | $17,397 | $13,387 | $17,314 |
|---|
Jun 18 | $16,891 | $13,314 | $16,808 |
|---|
Jul 18 | $18,351 | $13,716 | $18,248 |
|---|
Aug 18 | $18,575 | $13,824 | $18,471 |
|---|
Sep 18 | $18,938 | $13,884 | $18,839 |
|---|
Oct 18 | $16,891 | $12,843 | $16,867 |
|---|
Nov 18 | $16,043 | $13,031 | $15,964 |
|---|
Dec 18 | $14,710 | $12,113 | $14,671 |
|---|
Jan 19 | $16,064 | $13,070 | $15,961 |
|---|
Feb 19 | $15,812 | $13,419 | $15,740 |
|---|
Mar 19 | $15,703 | $13,588 | $15,659 |
|---|
Apr 19 | $15,769 | $14,047 | $15,717 |
|---|
May 19 | $14,251 | $13,214 | $14,238 |
|---|
Jun 19 | $15,174 | $14,079 | $15,117 |
|---|
Jul 19 | $15,277 | $14,120 | $15,286 |
|---|
Aug 19 | $14,243 | $13,785 | $14,206 |
|---|
Sep 19 | $15,404 | $14,075 | $15,375 |
|---|
Oct 19 | $16,372 | $14,460 | $16,361 |
|---|
Nov 19 | $15,991 | $14,813 | $15,962 |
|---|
Dec 19 | $16,062 | $15,335 | $16,059 |
|---|
Jan 20 | $14,328 | $15,166 | $14,373 |
|---|
Feb 20 | $12,711 | $13,941 | $12,578 |
|---|
Mar 20 | $9,606 | $12,059 | $9,596 |
|---|
Apr 20 | $11,566 | $13,350 | $11,508 |
|---|
May 20 | $12,167 | $13,931 | $12,032 |
|---|
Jun 20 | $12,112 | $14,376 | $11,973 |
|---|
Jul 20 | $11,887 | $15,137 | $11,790 |
|---|
Aug 20 | $11,991 | $16,063 | $11,935 |
|---|
Sep 20 | $10,983 | $15,545 | $10,914 |
|---|
Oct 20 | $10,373 | $15,167 | $10,278 |
|---|
Nov 20 | $13,117 | $17,037 | $13,067 |
|---|
Dec 20 | $14,214 | $17,828 | $14,149 |
|---|
Jan 21 | $14,385 | $17,747 | $14,351 |
|---|
Feb 21 | $16,037 | $18,158 | $15,934 |
|---|
Mar 21 | $15,475 | $18,643 | $15,374 |
|---|
Apr 21 | $15,957 | $19,458 | $15,899 |
|---|
May 21 | $16,977 | $19,761 | $16,875 |
|---|
Jun 21 | $16,769 | $20,021 | $16,666 |
|---|
Jul 21 | $15,561 | $20,159 | $15,471 |
|---|
Aug 21 | $15,961 | $20,664 | $15,895 |
|---|
Sep 21 | $16,601 | $19,810 | $16,589 |
|---|
Oct 21 | $17,049 | $20,821 | $16,975 |
|---|
Nov 21 | $15,038 | $20,320 | $15,011 |
|---|
Dec 21 | $15,792 | $21,133 | $15,772 |
|---|
Jan 22 | $16,454 | $20,095 | $16,324 |
|---|
Feb 22 | $16,191 | $19,576 | $16,098 |
|---|
Mar 22 | $17,534 | $20,000 | $17,545 |
|---|
Apr 22 | $17,549 | $18,399 | $17,617 |
|---|
May 22 | $19,154 | $18,420 | $19,153 |
|---|
Jun 22 | $17,271 | $16,868 | $17,229 |
|---|
Jul 22 | $17,684 | $18,046 | $17,576 |
|---|
Aug 22 | $17,961 | $17,381 | $17,945 |
|---|
Sep 22 | $15,825 | $15,717 | $15,831 |
|---|
Oct 22 | $17,562 | $16,666 | $17,540 |
|---|
Nov 22 | $19,389 | $17,958 | $19,260 |
|---|
Dec 22 | $18,713 | $17,252 | $18,708 |
|---|
Jan 23 | $19,652 | $18,488 | $19,593 |
|---|
Feb 23 | $18,883 | $17,958 | $18,893 |
|---|
Mar 23 | $19,109 | $18,512 | $19,045 |
|---|
Apr 23 | $18,487 | $18,778 | $18,427 |
|---|
May 23 | $17,406 | $18,577 | $17,384 |
|---|
Jun 23 | $18,163 | $19,656 | $18,127 |
|---|
Jul 23 | $20,055 | $20,375 | $20,037 |
|---|
Aug 23 | $20,235 | $19,806 | $20,213 |
|---|
Sep 23 | $20,794 | $18,987 | $20,700 |
|---|
Oct 23 | $19,906 | $18,416 | $19,742 |
|---|
Nov 23 | $20,976 | $20,116 | $20,842 |
|---|
Dec 23 | $21,332 | $21,082 | $21,246 |
|---|
Jan 24 | $21,863 | $21,206 | $21,827 |
|---|
Feb 24 | $22,028 | $22,116 | $21,903 |
|---|
Mar 24 | $23,833 | $22,810 | $23,736 |
|---|
Apr 24 | $22,912 | $22,057 | $22,860 |
|---|
May 24 | $22,581 | $22,953 | $22,415 |
|---|
Jun 24 | $22,317 | $23,464 | $22,208 |
|---|
Jul 24 | $22,337 | $23,843 | $22,256 |
|---|
Aug 24 | $22,351 | $24,448 | $22,195 |
|---|
Sep 24 | $21,458 | $25,016 | $21,308 |
|---|
Oct 24 | $19,465 | $24,455 | $19,412 |
|---|
Nov 24 | $19,610 | $25,369 | $19,497 |
|---|
Dec 24 | $18,139 | $24,769 | $18,053 |
|---|
Jan 25 | $18,842 | $25,600 | $18,837 |
|---|
Feb 25 | $18,674 | $25,446 | $18,563 |
|---|
Mar 25 | $18,938 | $24,441 | $18,841 |
|---|
Apr 25 | $18,337 | $24,669 | $18,268 |
|---|
May 25 | $19,705 | $26,087 | $19,663 |
|---|
Jun 25 | $21,516 | $27,258 | $21,468 |
|---|
Jul 25 | $22,175 | $27,628 | $22,154 |
|---|
Aug 25 | $23,202 | $28,310 | $23,176 |
|---|
Sep 25 | $24,204 | $29,336 | $24,153 |
|---|
Oct 25 | $25,744 | $29,992 | $25,714 |
|---|
Nov 25 | $26,018 | $29,989 | $25,963 |
|---|
Dec 25 | $25,169 | $30,302 | $25,164 |
|---|
|
| Average Annual Return [Table Text Block] |
Average Annual Total Returns . | 1 Year | 5 Years | 10 Years |
|---|
VanEck Oil Refiners ETF | 38.75% | 12.11% | 9.67% |
|---|
MVIS® Global Oil Refiners Index | 39.39% | 12.20% | 9.67% |
|---|
MSCI ACWI Index | 22.34% | 11.19% | 11.72% |
|---|
The performance data quoted represents past performance. Past performance is no guarantee of future results. Performance information for the Fund may reflect temporary fee waivers, if applicable. These returns do not reflect the deduction of taxes that a shareholder would pay on Fund dividends and distributions or the sale of Fund shares. Visit vaneck.com for more recent performance information. |
| No Deduction of Taxes [Text Block] |
|
| Performance Table Market Index Changed [Text Block] |
|
| Material Change Description [Text Block] |
|
| Updated Performance Information Location [Text Block] |
|
| AssetsNet |
$ 38,499,373
|
| Holdings Count | Holding |
26
|
| Advisory Fees Paid, Amount |
$ 46,489
|
| InvestmentCompanyPortfolioTurnover |
26.00%
|
| Additional Fund Statistics [Text Block] |
- Total Net Assets$38,499,373
- Number of Portfolio Holdings26
- Portfolio Turnover Rate26%
- Advisory Fees Paid$46,489
|
| Additional Fund Statistics Significance or Limits [Text Block] |
|
| Holdings [Text Block] |
Portfolio Composition (% of Total Net Assets)Value | Value | Value |
|---|
Other assets less liabilities | | 0.1% | Energy | | 99.9% |
|
| Largest Holdings [Text Block] |
Top Ten Holdings (% of Total Net Assets)Reliance Industries Ltd. | | 8.5% |
|---|
Phillips 66 | | 7.5% |
|---|
ENEOS Holdings, Inc. | | 6.3% |
|---|
Valero Energy Corp. | | 6.2% |
|---|
Marathon Petroleum Corp. | | 6.2% |
|---|
ORLEN SA | | 5.9% |
|---|
Neste Oyj | | 5.3% |
|---|
Galp Energia SGPS SA | | 4.8% |
|---|
Idemitsu Kosan Co. Ltd. | | 4.7% |
|---|
OMV AG | | 4.7% |
|---|
|
| Material Fund Change [Text Block] |
|
| Summary of Change Legend [Text Block] |
|
| Updated Prospectus Web Address |
<span style="box-sizing: border-box; color: rgb(0, 0, 0); display: inline; flex-wrap: nowrap; font-size: 10.6667px; font-weight: 400; grid-area: auto; line-height: 16px; margin: 0px; overflow: visible; text-align: left; text-align-last: auto; white-space-collapse: preserve-breaks;">https://www.vaneck.com/us/en/etf-mutual-fund-finder/etfs/documents/</span>
|
| Accountant Change Statement [Text Block] |
|
| Accountant Change Disagreements [Text Block] |
|
| C000105866 |
|
| Shareholder Report [Line Items] |
|
| Fund Name |
VanEck Oil Services ETF
|
| Class Name |
VanEck Oil Services ETF
|
| Trading Symbol |
OIH
|
| Security Exchange Name |
NYSEArca
|
| Annual or Semi-Annual Statement [Text Block] |
This annual shareholder report contains important information about the VanEck Oil Services ETF (the "Fund") for the period January 1, 2025 to December 31, 2025.
|
| Shareholder Report Annual or Semi-Annual |
Annual Shareholder Report
|
| Additional Information [Text Block] |
You can find additional information about the Fund at https://www.vaneck.com/us/en/etf-mutual-fund-finder/etfs/documents/. You can also request this information by contacting us at 800.826.2333 or info@vaneck.com.
|
| Additional Information Phone Number |
800.826.2333
|
| Additional Information Email |
<span style="box-sizing: border-box; color: rgb(0, 0, 0); display: inline; flex-wrap: nowrap; font-size: 10.6667px; font-weight: 400; grid-area: auto; line-height: 16px; margin: 0px; overflow: visible; text-align: left; text-align-last: auto; white-space-collapse: preserve-breaks;">info@vaneck.com</span>
|
| Additional Information Website |
<span style="box-sizing: border-box; color: rgb(0, 0, 0); display: inline; flex-wrap: nowrap; font-size: 10.6667px; font-weight: 400; grid-area: auto; line-height: 16px; margin: 0px; overflow: visible; text-align: left; text-align-last: auto; white-space-collapse: preserve-breaks;">https://www.vaneck.com/us/en/etf-mutual-fund-finder/etfs/documents/</span>
|
| Expenses [Text Block] |
What were the Fund costs for the last year?(based on a hypothetical $10,000 investment) Fund Name | Costs of a $10,000 investment | Costs paid as a % of a $10,000 investment |
|---|
VanEck Oil Services ETF | $36 | 0.35% |
|---|
|
| Expenses Paid, Amount |
$ 36
|
| Expense Ratio, Percent |
0.35%
|
| Factors Affecting Performance [Text Block] |
How did the Fund perform last year?During the period, positive, but muted performance reflected stable activity levels in global oilfield services markets, supported by ongoing offshore development and disciplined capital spending by energy producers. The Fund’s majority exposure to the United States and United Kingdom contributed largely positively to performance for the period. There were no overall country-level detractors. The leading individual contributors to performance were TechnipFMC, Baker Hughes, and Valaris. The leading individual detractors were Patterson-UTI Energy, Cactus, and SLB.
|
| Performance Past Does Not Indicate Future [Text] |
The performance data quoted represents past performance. Past performance is no guarantee of future results.
|
| Line Graph [Table Text Block] |
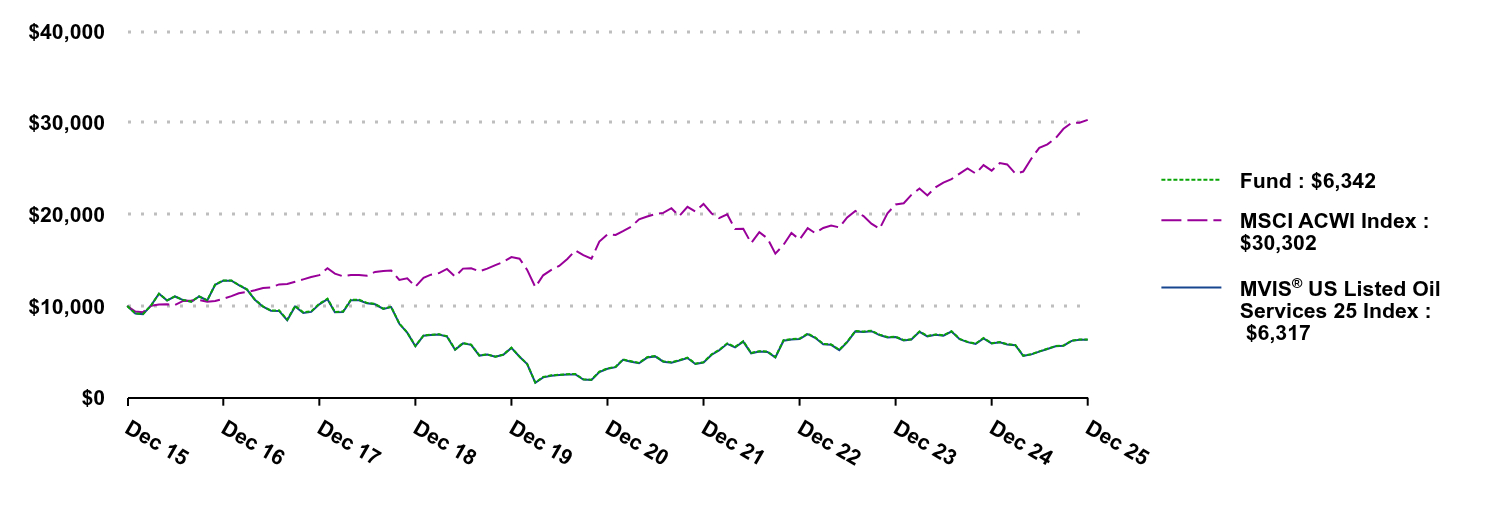 | Fund | MSCI ACWI Index | MVIS® US Listed Oil Services 25 Index |
|---|
Dec 15 | $10,000 | $10,000 | $10,000 |
|---|
Jan 16 | $9,187 | $9,397 | $9,185 |
|---|
Feb 16 | $9,123 | $9,332 | $9,117 |
|---|
Mar 16 | $10,076 | $10,024 | $10,067 |
|---|
Apr 16 | $11,346 | $10,172 | $11,334 |
|---|
May 16 | $10,620 | $10,185 | $10,606 |
|---|
Jun 16 | $11,055 | $10,123 | $11,040 |
|---|
Jul 16 | $10,658 | $10,559 | $10,646 |
|---|
Aug 16 | $10,484 | $10,595 | $10,468 |
|---|
Sep 16 | $11,055 | $10,660 | $11,037 |
|---|
Oct 16 | $10,624 | $10,479 | $10,605 |
|---|
Nov 16 | $12,345 | $10,558 | $12,319 |
|---|
Dec 16 | $12,792 | $10,786 | $12,763 |
|---|
Jan 17 | $12,784 | $11,081 | $12,755 |
|---|
Feb 17 | $12,305 | $11,392 | $12,272 |
|---|
Mar 17 | $11,814 | $11,532 | $11,786 |
|---|
Apr 17 | $10,698 | $11,711 | $10,671 |
|---|
May 17 | $9,951 | $11,970 | $9,925 |
|---|
Jun 17 | $9,506 | $12,024 | $9,482 |
|---|
Jul 17 | $9,525 | $12,360 | $9,463 |
|---|
Aug 17 | $8,513 | $12,408 | $8,454 |
|---|
Sep 17 | $10,012 | $12,647 | $9,946 |
|---|
Oct 17 | $9,303 | $12,910 | $9,241 |
|---|
Nov 17 | $9,421 | $13,160 | $9,358 |
|---|
Dec 17 | $10,240 | $13,372 | $10,189 |
|---|
Jan 18 | $10,799 | $14,127 | $10,748 |
|---|
Feb 18 | $9,355 | $13,533 | $9,311 |
|---|
Mar 18 | $9,398 | $13,244 | $9,351 |
|---|
Apr 18 | $10,681 | $13,370 | $10,630 |
|---|
May 18 | $10,685 | $13,387 | $10,632 |
|---|
Jun 18 | $10,343 | $13,314 | $10,293 |
|---|
Jul 18 | $10,228 | $13,716 | $10,184 |
|---|
Aug 18 | $9,721 | $13,824 | $9,681 |
|---|
Sep 18 | $9,914 | $13,884 | $9,877 |
|---|
Oct 18 | $8,091 | $12,843 | $8,060 |
|---|
Nov 18 | $7,115 | $13,031 | $7,088 |
|---|
Dec 18 | $5,640 | $12,113 | $5,614 |
|---|
Jan 19 | $6,785 | $13,070 | $6,756 |
|---|
Feb 19 | $6,874 | $13,419 | $6,842 |
|---|
Mar 19 | $6,918 | $13,588 | $6,887 |
|---|
Apr 19 | $6,705 | $14,047 | $6,674 |
|---|
May 19 | $5,262 | $13,214 | $5,238 |
|---|
Jun 19 | $5,953 | $14,079 | $5,927 |
|---|
Jul 19 | $5,792 | $14,120 | $5,769 |
|---|
Aug 19 | $4,611 | $13,785 | $4,592 |
|---|
Sep 19 | $4,726 | $14,075 | $4,708 |
|---|
Oct 19 | $4,481 | $14,460 | $4,465 |
|---|
Nov 19 | $4,696 | $14,813 | $4,679 |
|---|
Dec 19 | $5,451 | $15,335 | $5,433 |
|---|
Jan 20 | $4,478 | $15,166 | $4,460 |
|---|
Feb 20 | $3,679 | $13,941 | $3,660 |
|---|
Mar 20 | $1,653 | $12,059 | $1,629 |
|---|
Apr 20 | $2,254 | $13,350 | $2,221 |
|---|
May 20 | $2,436 | $13,931 | $2,399 |
|---|
Jun 20 | $2,501 | $14,376 | $2,463 |
|---|
Jul 20 | $2,568 | $15,137 | $2,530 |
|---|
Aug 20 | $2,575 | $16,063 | $2,535 |
|---|
Sep 20 | $2,007 | $15,545 | $1,978 |
|---|
Oct 20 | $1,965 | $15,167 | $1,937 |
|---|
Nov 20 | $2,835 | $17,037 | $2,793 |
|---|
Dec 20 | $3,199 | $17,828 | $3,152 |
|---|
Jan 21 | $3,378 | $17,747 | $3,329 |
|---|
Feb 21 | $4,169 | $18,158 | $4,122 |
|---|
Mar 21 | $3,973 | $18,643 | $3,929 |
|---|
Apr 21 | $3,798 | $19,458 | $3,756 |
|---|
May 21 | $4,422 | $19,761 | $4,375 |
|---|
Jun 21 | $4,554 | $20,021 | $4,503 |
|---|
Jul 21 | $3,970 | $20,159 | $3,928 |
|---|
Aug 21 | $3,861 | $20,664 | $3,819 |
|---|
Sep 21 | $4,096 | $19,810 | $4,053 |
|---|
Oct 21 | $4,372 | $20,821 | $4,327 |
|---|
Nov 21 | $3,709 | $20,320 | $3,670 |
|---|
Dec 21 | $3,877 | $21,133 | $3,839 |
|---|
Jan 22 | $4,735 | $20,095 | $4,690 |
|---|
Feb 22 | $5,207 | $19,576 | $5,157 |
|---|
Mar 22 | $5,929 | $20,000 | $5,873 |
|---|
Apr 22 | $5,540 | $18,399 | $5,490 |
|---|
May 22 | $6,161 | $18,420 | $6,105 |
|---|
Jun 22 | $4,883 | $16,868 | $4,838 |
|---|
Jul 22 | $5,074 | $18,046 | $5,029 |
|---|
Aug 22 | $5,028 | $17,381 | $4,982 |
|---|
Sep 22 | $4,430 | $15,717 | $4,391 |
|---|
Oct 22 | $6,262 | $16,666 | $6,210 |
|---|
Nov 22 | $6,398 | $17,958 | $6,345 |
|---|
Dec 22 | $6,441 | $17,252 | $6,392 |
|---|
Jan 23 | $6,994 | $18,488 | $6,943 |
|---|
Feb 23 | $6,581 | $17,958 | $6,532 |
|---|
Mar 23 | $5,876 | $18,512 | $5,835 |
|---|
Apr 23 | $5,809 | $18,778 | $5,770 |
|---|
May 23 | $5,228 | $18,577 | $5,191 |
|---|
Jun 23 | $6,094 | $19,656 | $6,053 |
|---|
Jul 23 | $7,279 | $20,375 | $7,232 |
|---|
Aug 23 | $7,217 | $19,806 | $7,169 |
|---|
Sep 23 | $7,303 | $18,987 | $7,256 |
|---|
Oct 23 | $6,876 | $18,416 | $6,833 |
|---|
Nov 23 | $6,619 | $20,116 | $6,577 |
|---|
Dec 23 | $6,648 | $21,082 | $6,609 |
|---|
Jan 24 | $6,284 | $21,206 | $6,248 |
|---|
Feb 24 | $6,379 | $22,116 | $6,342 |
|---|
Mar 24 | $7,229 | $22,810 | $7,189 |
|---|
Apr 24 | $6,729 | $22,057 | $6,693 |
|---|
May 24 | $6,904 | $22,953 | $6,867 |
|---|
Jun 24 | $6,794 | $23,464 | $6,758 |
|---|
Jul 24 | $7,248 | $23,843 | $7,212 |
|---|
Aug 24 | $6,410 | $24,448 | $6,377 |
|---|
Sep 24 | $6,094 | $25,016 | $6,063 |
|---|
Oct 24 | $5,898 | $24,455 | $5,869 |
|---|
Nov 24 | $6,507 | $25,369 | $6,475 |
|---|
Dec 24 | $5,945 | $24,769 | $5,916 |
|---|
Jan 25 | $6,067 | $25,600 | $6,039 |
|---|
Feb 25 | $5,835 | $25,446 | $5,806 |
|---|
Mar 25 | $5,748 | $24,441 | $5,719 |
|---|
Apr 25 | $4,586 | $24,669 | $4,564 |
|---|
May 25 | $4,746 | $26,087 | $4,722 |
|---|
Jun 25 | $5,046 | $27,258 | $5,023 |
|---|
Jul 25 | $5,337 | $27,628 | $5,316 |
|---|
Aug 25 | $5,630 | $28,310 | $5,608 |
|---|
Sep 25 | $5,693 | $29,336 | $5,670 |
|---|
Oct 25 | $6,221 | $29,992 | $6,199 |
|---|
Nov 25 | $6,349 | $29,989 | $6,325 |
|---|
Dec 25 | $6,342 | $30,302 | $6,317 |
|---|
|
| Average Annual Return [Table Text Block] |
Average Annual Total Returns . | 1 Year | 5 Years | 10 Years |
|---|
VanEck Oil Services ETF | 6.67% | 14.67% | (4.45)% |
|---|
MVIS® US Listed Oil Services 25 Index | 6.77% | 14.92% | (4.49)% |
|---|
MSCI ACWI Index | 22.34% | 11.19% | 11.72% |
|---|
The performance data quoted represents past performance. Past performance is no guarantee of future results. Performance information for the Fund may reflect temporary fee waivers, if applicable. These returns do not reflect the deduction of taxes that a shareholder would pay on Fund dividends and distributions or the sale of Fund shares. Visit vaneck.com for more recent performance information. |
| No Deduction of Taxes [Text Block] |
|
| Performance Table Market Index Changed [Text Block] |
|
| Material Change Description [Text Block] |
|
| Updated Performance Information Location [Text Block] |
|
| AssetsNet |
$ 1,294,457,873
|
| Holdings Count | Holding |
26
|
| Advisory Fees Paid, Amount |
$ 3,863,176
|
| InvestmentCompanyPortfolioTurnover |
21.00%
|
| Additional Fund Statistics [Text Block] |
- Total Net Assets$1,294,457,873
- Number of Portfolio Holdings26
- Portfolio Turnover Rate21%
- Advisory Fees Paid$3,863,176
|
| Additional Fund Statistics Significance or Limits [Text Block] |
|
| Holdings [Text Block] |
Portfolio Composition (% of Total Net Assets)Value | Value | Value |
|---|
Other assets less liabilities | | 0.0%Footnote Reference* | Oil & Gas Drilling | | 18.7% | Oil & Gas Equipment & Services | | 81.3% |
| Footnote | Description | Footnote* | Amount is less than 0.05% |
|
| Largest Holdings [Text Block] |
Top Ten Holdings (% of Total Net Assets)SLB Ltd. | | 20.5% |
|---|
Baker Hughes Co. | | 12.5% |
|---|
Halliburton Co. | | 7.8% |
|---|
TechnipFMC PLC | | 5.2% |
|---|
Tenaris SA | | 5.0% |
|---|
Weatherford International PLC | | 4.6% |
|---|
Transocean Ltd. | | 4.6% |
|---|
NOV, Inc. | | 4.5% |
|---|
Noble Corp. PLC | | 4.3% |
|---|
Liberty Energy, Inc. | | 3.5% |
|---|
|
| Material Fund Change [Text Block] |
|
| Summary of Change Legend [Text Block] |
|
| Updated Prospectus Web Address |
<span style="box-sizing: border-box; color: rgb(0, 0, 0); display: inline; flex-wrap: nowrap; font-size: 10.6667px; font-weight: 400; grid-area: auto; line-height: 16px; margin: 0px; overflow: visible; text-align: left; text-align-last: auto; white-space-collapse: preserve-breaks;">https://www.vaneck.com/us/en/etf-mutual-fund-finder/etfs/documents/</span>
|
| Accountant Change Statement [Text Block] |
|
| Accountant Change Disagreements [Text Block] |
|
| C000114511 |
|
| Shareholder Report [Line Items] |
|
| Fund Name |
VanEck Preferred Securities ex Financials ETF
|
| Class Name |
VanEck Preferred Securities ex Financials ETF
|
| Trading Symbol |
PFXF
|
| Security Exchange Name |
NYSEArca
|
| Annual or Semi-Annual Statement [Text Block] |
This annual shareholder report contains important information about the VanEck Preferred Securities ex Financials ETF (the "Fund") for the period January 1, 2025 to December 31, 2025.
|
| Shareholder Report Annual or Semi-Annual |
Annual Shareholder Report
|
| Additional Information [Text Block] |
You can find additional information about the Fund at https://www.vaneck.com/us/en/etf-mutual-fund-finder/etfs/documents/. You can also request this information by contacting us at 800.826.2333 or info@vaneck.com.
|
| Additional Information Phone Number |
800.826.2333
|
| Additional Information Email |
<span style="box-sizing: border-box; color: rgb(0, 0, 0); display: inline; flex-wrap: nowrap; font-size: 10.6667px; font-weight: 400; grid-area: auto; line-height: 16px; margin: 0px; overflow: visible; text-align: left; text-align-last: auto; white-space-collapse: preserve-breaks;">info@vaneck.com</span>
|
| Additional Information Website |
<span style="box-sizing: border-box; color: rgb(0, 0, 0); display: inline; flex-wrap: nowrap; font-size: 10.6667px; font-weight: 400; grid-area: auto; line-height: 16px; margin: 0px; overflow: visible; text-align: left; text-align-last: auto; white-space-collapse: preserve-breaks;">https://www.vaneck.com/us/en/etf-mutual-fund-finder/etfs/documents/</span>
|
| Expenses [Text Block] |
What were the Fund costs for the last year?(based on a hypothetical $10,000 investment) Fund Name | Costs of a $10,000 investment | Costs paid as a % of a $10,000 investment |
|---|
VanEck Preferred Securities ex Financials ETF | $42 | 0.40% |
|---|
|
| Expenses Paid, Amount |
$ 42
|
| Expense Ratio, Percent |
0.40%
|
| Factors Affecting Performance [Text Block] |
How did the Fund perform last year?The Fund provided positive total return during the period, supported by steady coupon income and improved price performance amid an attractive yield environment for preferred securities outside the financials sector. Industrials and utility exposures were top sector contributors to Fund performance during the period, while the retail sector was the greatest detractor. From an issuer perspective, Boeing Company, was the top contributor to performance, while QVC Group, Inc. detracted the most.
|
| Performance Past Does Not Indicate Future [Text] |
The performance data quoted represents past performance. Past performance is no guarantee of future results.
|
| Line Graph [Table Text Block] |
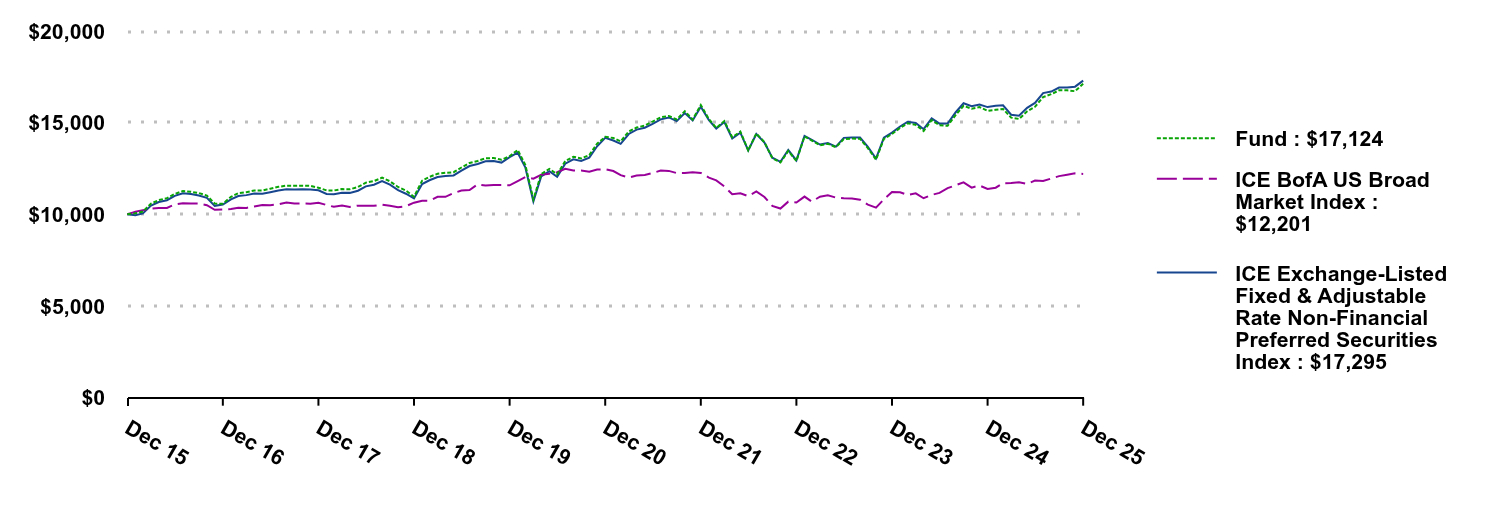 | Fund | ICE BofA US Broad Market Index | ICE Exchange-Listed Fixed & Adjustable Rate Non-Financial Preferred Securities Index |
|---|
Dec 15 | $10,000 | $10,000 | $10,000 |
|---|
Jan 16 | $10,057 | $10,144 | $9,955 |
|---|
Feb 16 | $10,150 | $10,218 | $10,049 |
|---|
Mar 16 | $10,586 | $10,307 | $10,483 |
|---|
Apr 16 | $10,778 | $10,346 | $10,669 |
|---|
May 16 | $10,885 | $10,350 | $10,771 |
|---|
Jun 16 | $11,113 | $10,542 | $11,005 |
|---|
Jul 16 | $11,269 | $10,611 | $11,153 |
|---|
Aug 16 | $11,230 | $10,596 | $11,109 |
|---|
Sep 16 | $11,160 | $10,587 | $11,031 |
|---|
Oct 16 | $11,023 | $10,501 | $10,904 |
|---|
Nov 16 | $10,585 | $10,250 | $10,463 |
|---|
Dec 16 | $10,579 | $10,262 | $10,532 |
|---|
Jan 17 | $10,954 | $10,286 | $10,816 |
|---|
Feb 17 | $11,158 | $10,355 | $11,001 |
|---|
Mar 17 | $11,211 | $10,351 | $11,048 |
|---|
Apr 17 | $11,303 | $10,429 | $11,132 |
|---|
May 17 | $11,303 | $10,511 | $11,122 |
|---|
Jun 17 | $11,398 | $10,502 | $11,209 |
|---|
Jul 17 | $11,500 | $10,546 | $11,302 |
|---|
Aug 17 | $11,564 | $10,644 | $11,364 |
|---|
Sep 17 | $11,557 | $10,589 | $11,354 |
|---|
Oct 17 | $11,565 | $10,597 | $11,367 |
|---|
Nov 17 | $11,552 | $10,584 | $11,355 |
|---|
Dec 17 | $11,452 | $10,632 | $11,312 |
|---|
Jan 18 | $11,307 | $10,510 | $11,114 |
|---|
Feb 18 | $11,301 | $10,411 | $11,099 |
|---|
Mar 18 | $11,378 | $10,478 | $11,181 |
|---|
Apr 18 | $11,368 | $10,402 | $11,171 |
|---|
May 18 | $11,489 | $10,475 | $11,289 |
|---|
Jun 18 | $11,730 | $10,463 | $11,526 |
|---|
Jul 18 | $11,813 | $10,465 | $11,614 |
|---|
Aug 18 | $11,999 | $10,533 | $11,813 |
|---|
Sep 18 | $11,803 | $10,465 | $11,619 |
|---|
Oct 18 | $11,494 | $10,384 | $11,317 |
|---|
Nov 18 | $11,298 | $10,444 | $11,125 |
|---|
Dec 18 | $10,962 | $10,637 | $10,870 |
|---|
Jan 19 | $11,839 | $10,746 | $11,655 |
|---|
Feb 19 | $12,041 | $10,745 | $11,859 |
|---|
Mar 19 | $12,215 | $10,956 | $12,032 |
|---|
Apr 19 | $12,266 | $10,957 | $12,092 |
|---|
May 19 | $12,297 | $11,156 | $12,123 |
|---|
Jun 19 | $12,555 | $11,301 | $12,384 |
|---|
Jul 19 | $12,804 | $11,330 | $12,634 |
|---|
Aug 19 | $12,911 | $11,638 | $12,745 |
|---|
Sep 19 | $13,059 | $11,569 | $12,895 |
|---|
Oct 19 | $13,071 | $11,600 | $12,911 |
|---|
Nov 19 | $12,976 | $11,594 | $12,822 |
|---|
Dec 19 | $13,172 | $11,582 | $13,119 |
|---|
Jan 20 | $13,512 | $11,817 | $13,360 |
|---|
Feb 20 | $12,703 | $12,032 | $12,563 |
|---|
Mar 20 | $10,817 | $11,946 | $10,704 |
|---|
Apr 20 | $12,200 | $12,156 | $12,066 |
|---|
May 20 | $12,481 | $12,217 | $12,349 |
|---|
Jun 20 | $12,186 | $12,299 | $12,045 |
|---|
Jul 20 | $12,904 | $12,489 | $12,760 |
|---|
Aug 20 | $13,144 | $12,386 | $13,002 |
|---|
Sep 20 | $13,053 | $12,385 | $12,911 |
|---|
Oct 20 | $13,234 | $12,323 | $13,092 |
|---|
Nov 20 | $13,853 | $12,444 | $13,711 |
|---|
Dec 20 | $14,225 | $12,458 | $14,170 |
|---|
Jan 21 | $14,166 | $12,361 | $14,029 |
|---|
Feb 21 | $13,981 | $12,140 | $13,845 |
|---|
Mar 21 | $14,518 | $12,012 | $14,382 |
|---|
Apr 21 | $14,735 | $12,115 | $14,621 |
|---|
May 21 | $14,843 | $12,151 | $14,725 |
|---|
Jun 21 | $15,061 | $12,254 | $14,934 |
|---|
Jul 21 | $15,296 | $12,386 | $15,179 |
|---|
Aug 21 | $15,366 | $12,369 | $15,284 |
|---|
Sep 21 | $15,175 | $12,251 | $15,086 |
|---|
Oct 21 | $15,628 | $12,253 | $15,521 |
|---|
Nov 21 | $15,171 | $12,302 | $15,119 |
|---|
Dec 21 | $15,961 | $12,261 | $15,867 |
|---|
Jan 22 | $15,198 | $12,004 | $15,133 |
|---|
Feb 22 | $14,714 | $11,852 | $14,681 |
|---|
Mar 22 | $15,085 | $11,520 | $15,039 |
|---|
Apr 22 | $14,204 | $11,097 | $14,135 |
|---|
May 22 | $14,516 | $11,145 | $14,453 |
|---|
Jun 22 | $13,491 | $10,995 | $13,482 |
|---|
Jul 22 | $14,411 | $11,249 | $14,378 |
|---|
Aug 22 | $13,934 | $10,944 | $13,914 |
|---|
Sep 22 | $13,068 | $10,461 | $13,092 |
|---|
Oct 22 | $12,828 | $10,318 | $12,866 |
|---|
Nov 22 | $13,455 | $10,693 | $13,506 |
|---|
Dec 22 | $12,911 | $10,647 | $12,946 |
|---|
Jan 23 | $14,248 | $10,968 | $14,279 |
|---|
Feb 23 | $14,024 | $10,693 | $14,068 |
|---|
Mar 23 | $13,765 | $10,964 | $13,807 |
|---|
Apr 23 | $13,848 | $11,034 | $13,888 |
|---|
May 23 | $13,662 | $10,914 | $13,697 |
|---|
Jun 23 | $14,103 | $10,874 | $14,171 |
|---|
Jul 23 | $14,130 | $10,865 | $14,188 |
|---|
Aug 23 | $14,123 | $10,797 | $14,189 |
|---|
Sep 23 | $13,607 | $10,529 | $13,676 |
|---|
Oct 23 | $12,985 | $10,366 | $13,046 |
|---|
Nov 23 | $14,115 | $10,820 | $14,184 |
|---|
Dec 23 | $14,383 | $11,222 | $14,459 |
|---|
Jan 24 | $14,715 | $11,208 | $14,792 |
|---|
Feb 24 | $14,965 | $11,055 | $15,043 |
|---|
Mar 24 | $14,880 | $11,148 | $14,987 |
|---|
Apr 24 | $14,547 | $10,879 | $14,645 |
|---|
May 24 | $15,137 | $11,063 | $15,237 |
|---|
Jun 24 | $14,859 | $11,169 | $14,948 |
|---|
Jul 24 | $14,831 | $11,428 | $14,951 |
|---|
Aug 24 | $15,420 | $11,590 | $15,569 |
|---|
Sep 24 | $15,917 | $11,746 | $16,059 |
|---|
Oct 24 | $15,763 | $11,459 | $15,894 |
|---|
Nov 24 | $15,849 | $11,574 | $15,989 |
|---|
Dec 24 | $15,647 | $11,387 | $15,850 |
|---|
Jan 25 | $15,705 | $11,452 | $15,918 |
|---|
Feb 25 | $15,746 | $11,701 | $15,947 |
|---|
Mar 25 | $15,275 | $11,704 | $15,433 |
|---|
Apr 25 | $15,203 | $11,748 | $15,382 |
|---|
May 25 | $15,616 | $11,664 | $15,810 |
|---|
Jun 25 | $15,864 | $11,842 | $16,076 |
|---|
Jul 25 | $16,396 | $11,817 | $16,612 |
|---|
Aug 25 | $16,553 | $11,956 | $16,697 |
|---|
Sep 25 | $16,765 | $12,085 | $16,916 |
|---|
Oct 25 | $16,763 | $12,162 | $16,918 |
|---|
Nov 25 | $16,716 | $12,236 | $16,964 |
|---|
Dec 25 | $17,124 | $12,201 | $17,295 |
|---|
|
| Average Annual Return [Table Text Block] |
Average Annual Total Returns . | 1 Year | 5 Years | 10 Years |
|---|
VanEck Preferred Securities ex Financials ETF | 9.44% | 3.78% | 5.53% |
|---|
ICE Exchange-Listed Fixed & Adjustable Rate Non-Financial Preferred Securities Index | 9.12% | 4.07% | 5.63% |
|---|
ICE BofA US Broad Market Index | 7.15% | (0.42)% | 2.01% |
|---|
Index data prior to June 1, 2021 reflects that of the Wells Fargo® Hybrid and Preferred Securities ex Financials Index. From June 1, 2021 forward, the index data reflects that of the Fund's underlying index, the ICE Exchange-Listed Fixed & Adjustable Rate Non-Financial Preferred Securities Index. The performance data quoted represents past performance. Past performance is no guarantee of future results. Performance information for the Fund may reflect temporary fee waivers, if applicable. These returns do not reflect the deduction of taxes that a shareholder would pay on Fund dividends and distributions or the sale of Fund shares. Visit vaneck.com for more recent performance information. |
| No Deduction of Taxes [Text Block] |
|
| Performance Table Market Index Changed [Text Block] |
|
| Material Change Description [Text Block] |
|
| Updated Performance Information Location [Text Block] |
|
| AssetsNet |
$ 2,028,512,081
|
| Holdings Count | Holding |
113
|
| Advisory Fees Paid, Amount |
$ 7,558,351
|
| InvestmentCompanyPortfolioTurnover |
31.00%
|
| Additional Fund Statistics [Text Block] |
- Total Net Assets$2,028,512,081
- Number of Portfolio Holdings113
- Portfolio Turnover Rate31%
- Advisory Fees Paid$7,558,351
|
| Additional Fund Statistics Significance or Limits [Text Block] |
|
| Holdings [Text Block] |
Portfolio Composition (% of Total Net Assets)Value | Value | Value |
|---|
Other assets less liabilities | | 0.2% | Other Investments | | 4.2% | Electronic Equipment & Parts | | 1.0% | Investment Banking & Investment Services | | 1.2% | Healthcare Providers & Services | | 1.5% | Healthcare Equipment & Supplies | | 1.5% | Semiconductors & Semiconductor Equipment | | 2.6% | Automobiles & Auto Parts | | 2.7% | Multiline Utilities | | 2.8% | Computers Phones & Household Electronics | | 3.0% | Food & Tobacco | | 3.5% | Chemicals | | 4.1% | Software & IT Services | | 9.0% | Aerospace & Defense | | 9.9% | Telecommunications Services | | 10.0% | Residential & Commercial REITs | | 17.0% | Electric Utilities & IPPs | | 25.8% |
|
| Largest Holdings [Text Block] |
Top Ten Holdings (% of Total Net Assets)Boeing Co., 6.00%, 10/15/2027 | | 9.9% |
|---|
Strategy, Inc., 10.50% (Perpetual maturity) | | 4.1% |
|---|
Albemarle Corp., 7.25%, 3/1/2027 | | 4.1% |
|---|
NextEra Energy, Inc., 7.30%, 6/1/2027 | | 3.1% |
|---|
Southern Co., 7.12%, 12/15/2028 | | 3.0% |
|---|
Hewlett Packard Enterprise Co., 7.62%, 9/1/2027 | | 3.0% |
|---|
Microchip Technology, Inc., 7.50%, 3/15/2028 | | 2.6% |
|---|
NextEra Energy, Inc., 7.23%, 11/1/2027 | | 2.2% |
|---|
AT&T, Inc., 4.75% (Perpetual maturity) | | 2.0% |
|---|
PG&E Corp., 6.00%, 12/1/2027 | | 2.0% |
|---|
|
| Material Fund Change [Text Block] |
|
| Summary of Change Legend [Text Block] |
|
| Updated Prospectus Web Address |
<span style="box-sizing: border-box; color: rgb(0, 0, 0); display: inline; flex-wrap: nowrap; font-size: 10.6667px; font-weight: 400; grid-area: auto; line-height: 16px; margin: 0px; overflow: visible; text-align: left; text-align-last: auto; white-space-collapse: preserve-breaks;">https://www.vaneck.com/us/en/etf-mutual-fund-finder/etfs/documents/</span>
|
| Accountant Change Statement [Text Block] |
|
| Accountant Change Disagreements [Text Block] |
|
| C000092114 |
|
| Shareholder Report [Line Items] |
|
| Fund Name |
VanEck Rare Earth and Strategic Metals ETF
|
| Class Name |
VanEck Rare Earth and Strategic Metals ETF
|
| Trading Symbol |
REMX
|
| Security Exchange Name |
NYSEArca
|
| Annual or Semi-Annual Statement [Text Block] |
This annual shareholder report contains important information about the VanEck Rare Earth and Strategic Metals ETF (the "Fund") for the period January 1, 2025 to December 31, 2025.
|
| Shareholder Report Annual or Semi-Annual |
Annual Shareholder Report
|
| Additional Information [Text Block] |
You can find additional information about the Fund at https://www.vaneck.com/us/en/etf-mutual-fund-finder/etfs/documents/. You can also request this information by contacting us at 800.826.2333 or info@vaneck.com.
|
| Additional Information Phone Number |
800.826.2333
|
| Additional Information Email |
<span style="box-sizing: border-box; color: rgb(0, 0, 0); display: inline; flex-wrap: nowrap; font-size: 10.6667px; font-weight: 400; grid-area: auto; line-height: 16px; margin: 0px; overflow: visible; text-align: left; text-align-last: auto; white-space-collapse: preserve-breaks;">info@vaneck.com</span>
|
| Additional Information Website |
<span style="box-sizing: border-box; color: rgb(0, 0, 0); display: inline; flex-wrap: nowrap; font-size: 10.6667px; font-weight: 400; grid-area: auto; line-height: 16px; margin: 0px; overflow: visible; text-align: left; text-align-last: auto; white-space-collapse: preserve-breaks;">https://www.vaneck.com/us/en/etf-mutual-fund-finder/etfs/documents/</span>
|
| Expenses [Text Block] |
What were the Fund costs for the last year?(based on a hypothetical $10,000 investment) Fund Name | Costs of a $10,000 investment | Costs paid as a % of a $10,000 investment |
|---|
VanEck Rare Earth and Strategic Metals ETF | $78 | 0.53% |
|---|
|
| Expenses Paid, Amount |
$ 78
|
| Expense Ratio, Percent |
0.53%
|
| Factors Affecting Performance [Text Block] |
How did the Fund perform last year?During the period, performance reflected improving conditions across global rare earth and strategic metals markets, supported by geopolitical tensions, onshoring efforts, and increased demand tied to electrification and advanced manufacturing. The Fund’s exposure to China, Australia, and the United States led to significant contributions to performance, while exposure to Germany led to marginal detraction. The leading individual contributors to performance for the period were MP Materials, China Northern Rare Earth Group High-Tech, and Lynas Rare Earths. The leading individual detractors were Tronox and Sigma Lithium.
|
| Performance Past Does Not Indicate Future [Text] |
The performance data quoted represents past performance. Past performance is no guarantee of future results.
|
| Line Graph [Table Text Block] |
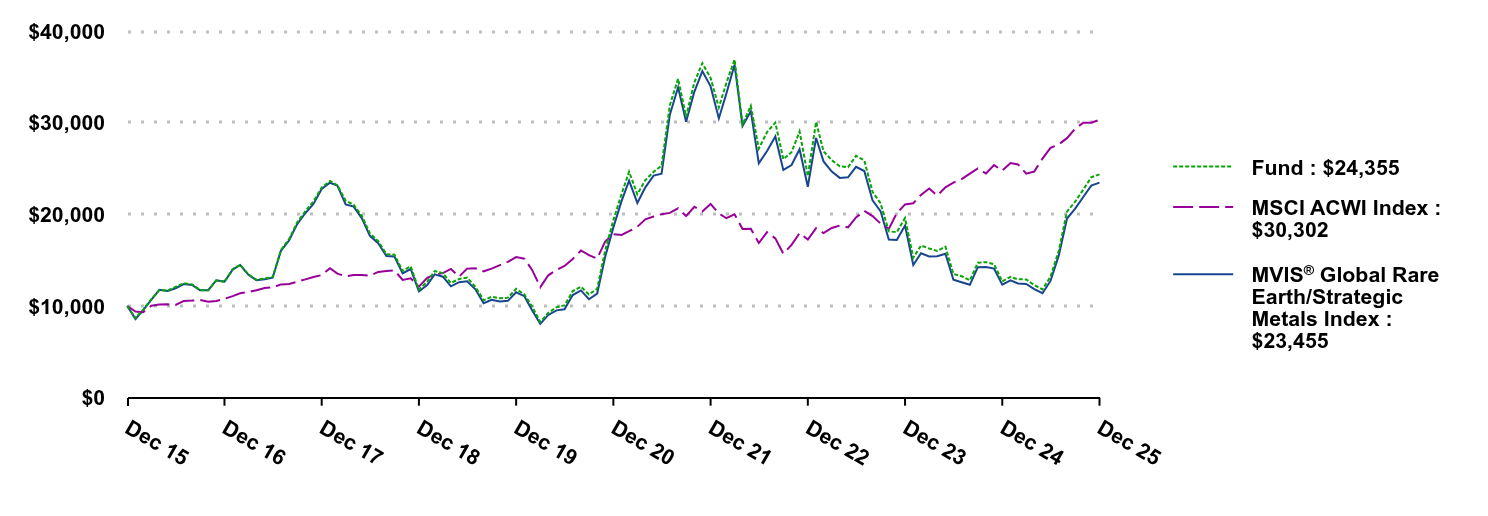 | Fund | MSCI ACWI Index | MVIS® Global Rare Earth/Strategic Metals Index |
|---|
Dec 15 | $10,000 | $10,000 | $10,000 |
|---|
Jan 16 | $8,692 | $9,397 | $8,587 |
|---|
Feb 16 | $9,598 | $9,332 | $9,562 |
|---|
Mar 16 | $10,753 | $10,024 | $10,697 |
|---|
Apr 16 | $11,754 | $10,172 | $11,762 |
|---|
May 16 | $11,681 | $10,185 | $11,627 |
|---|
Jun 16 | $12,091 | $10,123 | $11,942 |
|---|
Jul 16 | $12,485 | $10,559 | $12,400 |
|---|
Aug 16 | $12,354 | $10,595 | $12,289 |
|---|
Sep 16 | $11,754 | $10,660 | $11,720 |
|---|
Oct 16 | $11,711 | $10,479 | $11,732 |
|---|
Nov 16 | $12,785 | $10,558 | $12,811 |
|---|
Dec 16 | $12,635 | $10,786 | $12,664 |
|---|
Jan 17 | $14,018 | $11,081 | $13,973 |
|---|
Feb 17 | $14,504 | $11,392 | $14,473 |
|---|
Mar 17 | $13,450 | $11,532 | $13,403 |
|---|
Apr 17 | $12,859 | $11,711 | $12,821 |
|---|
May 17 | $13,009 | $11,970 | $12,923 |
|---|
Jun 17 | $13,151 | $12,024 | $13,092 |
|---|
Jul 17 | $16,111 | $12,360 | $16,022 |
|---|
Aug 17 | $17,323 | $12,408 | $17,167 |
|---|
Sep 17 | $19,124 | $12,647 | $18,940 |
|---|
Oct 17 | $20,365 | $12,910 | $20,144 |
|---|
Nov 17 | $21,412 | $13,160 | $21,143 |
|---|
Dec 17 | $22,924 | $13,372 | $22,774 |
|---|
Jan 18 | $23,640 | $14,127 | $23,452 |
|---|
Feb 18 | $23,163 | $13,533 | $23,126 |
|---|
Mar 18 | $21,483 | $13,244 | $21,086 |
|---|
Apr 18 | $21,044 | $13,370 | $20,843 |
|---|
May 18 | $19,818 | $13,387 | $19,565 |
|---|
Jun 18 | $17,923 | $13,314 | $17,654 |
|---|
Jul 18 | $17,075 | $13,716 | $16,855 |
|---|
Aug 18 | $15,658 | $13,824 | $15,462 |
|---|
Sep 18 | $15,604 | $13,884 | $15,393 |
|---|
Oct 18 | $13,816 | $12,843 | $13,566 |
|---|
Nov 18 | $14,332 | $13,031 | $14,036 |
|---|
Dec 18 | $11,761 | $12,113 | $11,588 |
|---|
Jan 19 | $12,654 | $13,070 | $12,285 |
|---|
Feb 19 | $13,807 | $13,419 | $13,449 |
|---|
Mar 19 | $13,582 | $13,588 | $13,201 |
|---|
Apr 19 | $12,515 | $14,047 | $12,143 |
|---|
May 19 | $12,949 | $13,214 | $12,604 |
|---|
Jun 19 | $13,096 | $14,079 | $12,700 |
|---|
Jul 19 | $12,099 | $14,120 | $11,825 |
|---|
Aug 19 | $10,623 | $13,785 | $10,309 |
|---|
Sep 19 | $11,003 | $14,075 | $10,669 |
|---|
Oct 19 | $10,836 | $14,460 | $10,506 |
|---|
Nov 19 | $10,913 | $14,813 | $10,565 |
|---|
Dec 19 | $11,867 | $15,335 | $11,501 |
|---|
Jan 20 | $11,268 | $15,166 | $11,074 |
|---|
Feb 20 | $9,951 | $13,941 | $9,531 |
|---|
Mar 20 | $8,253 | $12,059 | $8,048 |
|---|
Apr 20 | $9,258 | $13,350 | $9,026 |
|---|
May 20 | $9,869 | $13,931 | $9,525 |
|---|
Jun 20 | $10,070 | $14,376 | $9,637 |
|---|
Jul 20 | $11,627 | $15,137 | $11,192 |
|---|
Aug 20 | $12,097 | $16,063 | $11,699 |
|---|
Sep 20 | $11,265 | $15,545 | $10,735 |
|---|
Oct 20 | $11,888 | $15,167 | $11,357 |
|---|
Nov 20 | $16,044 | $17,037 | $15,339 |
|---|
Dec 20 | $19,370 | $17,828 | $18,577 |
|---|
Jan 21 | $22,239 | $17,747 | $21,464 |
|---|
Feb 21 | $24,648 | $18,158 | $23,680 |
|---|
Mar 21 | $22,189 | $18,643 | $21,243 |
|---|
Apr 21 | $23,739 | $19,458 | $22,944 |
|---|
May 21 | $24,633 | $19,761 | $24,225 |
|---|
Jun 21 | $25,306 | $20,021 | $24,434 |
|---|
Jul 21 | $31,910 | $20,159 | $30,875 |
|---|
Aug 21 | $34,786 | $20,664 | $33,860 |
|---|
Sep 21 | $30,666 | $19,810 | $30,106 |
|---|
Oct 21 | $34,406 | $20,821 | $33,365 |
|---|
Nov 21 | $36,476 | $20,320 | $35,633 |
|---|
Dec 21 | $34,884 | $21,133 | $33,957 |
|---|
Jan 22 | $31,652 | $20,095 | $30,464 |
|---|
Feb 22 | $34,315 | $19,576 | $33,153 |
|---|
Mar 22 | $36,884 | $20,000 | $36,327 |
|---|
Apr 22 | $29,802 | $18,399 | $29,661 |
|---|
May 22 | $31,837 | $18,420 | $31,258 |
|---|
Jun 22 | $27,167 | $16,868 | $25,557 |
|---|
Jul 22 | $28,971 | $18,046 | $26,907 |
|---|
Aug 22 | $29,998 | $17,381 | $28,485 |
|---|
Sep 22 | $26,019 | $15,717 | $24,845 |
|---|
Oct 22 | $26,781 | $16,666 | $25,379 |
|---|
Nov 22 | $29,047 | $17,958 | $27,095 |
|---|
Dec 22 | $24,182 | $17,252 | $23,012 |
|---|
Jan 23 | $30,074 | $18,488 | $28,334 |
|---|
Feb 23 | $26,871 | $17,958 | $25,774 |
|---|
Mar 23 | $25,899 | $18,512 | $24,666 |
|---|
Apr 23 | $25,251 | $18,778 | $23,977 |
|---|
May 23 | $25,143 | $18,577 | $24,040 |
|---|
Jun 23 | $26,385 | $19,656 | $25,189 |
|---|
Jul 23 | $25,885 | $20,375 | $24,722 |
|---|
Aug 23 | $22,447 | $19,806 | $21,521 |
|---|
Sep 23 | $21,210 | $18,987 | $20,355 |
|---|
Oct 23 | $18,148 | $18,416 | $17,251 |
|---|
Nov 23 | $18,055 | $20,116 | $17,207 |
|---|
Dec 23 | $19,591 | $21,082 | $18,773 |
|---|
Jan 24 | $15,264 | $21,206 | $14,470 |
|---|
Feb 24 | $16,601 | $22,116 | $15,753 |
|---|
Mar 24 | $16,272 | $22,810 | $15,413 |
|---|
Apr 24 | $16,015 | $22,057 | $15,426 |
|---|
May 24 | $16,472 | $22,953 | $15,693 |
|---|
Jun 24 | $13,504 | $23,464 | $12,882 |
|---|
Jul 24 | $13,249 | $23,843 | $12,600 |
|---|
Aug 24 | $12,794 | $24,448 | $12,312 |
|---|
Sep 24 | $14,727 | $25,016 | $14,234 |
|---|
Oct 24 | $14,786 | $24,455 | $14,264 |
|---|
Nov 24 | $14,558 | $25,369 | $14,077 |
|---|
Dec 24 | $12,682 | $24,769 | $12,319 |
|---|
Jan 25 | $13,180 | $25,600 | $12,796 |
|---|
Feb 25 | $12,911 | $25,446 | $12,466 |
|---|
Mar 25 | $12,902 | $24,441 | $12,402 |
|---|
Apr 25 | $12,285 | $24,669 | $11,840 |
|---|
May 25 | $11,813 | $26,087 | $11,391 |
|---|
Jun 25 | $13,209 | $27,258 | $12,736 |
|---|
Jul 25 | $16,008 | $27,628 | $15,492 |
|---|
Aug 25 | $20,302 | $28,310 | $19,538 |
|---|
Sep 25 | $21,366 | $29,336 | $20,590 |
|---|
Oct 25 | $22,688 | $29,992 | $21,893 |
|---|
Nov 25 | $24,046 | $29,989 | $23,130 |
|---|
Dec 25 | $24,355 | $30,302 | $23,455 |
|---|
|
| Average Annual Return [Table Text Block] |
Average Annual Total Returns . | 1 Year | 5 Years | 10 Years |
|---|
VanEck Rare Earth and Strategic Metals ETF | 92.05% | 4.69% | 9.31% |
|---|
MVIS® Global Rare Earth/Strategic Metals Index | 90.39% | 4.77% | 8.90% |
|---|
MSCI ACWI Index | 22.34% | 11.19% | 11.72% |
|---|
The performance data quoted represents past performance. Past performance is no guarantee of future results. Performance information for the Fund may reflect temporary fee waivers, if applicable. These returns do not reflect the deduction of taxes that a shareholder would pay on Fund dividends and distributions or the sale of Fund shares. Visit vaneck.com for more recent performance information. |
| No Deduction of Taxes [Text Block] |
|
| Performance Table Market Index Changed [Text Block] |
|
| Material Change Description [Text Block] |
|
| Updated Performance Information Location [Text Block] |
|
| AssetsNet |
$ 1,627,205,158
|
| Holdings Count | Holding |
26
|
| Advisory Fees Paid, Amount |
$ 3,180,570
|
| InvestmentCompanyPortfolioTurnover |
74.00%
|
| Additional Fund Statistics [Text Block] |
- Total Net Assets$1,627,205,158
- Number of Portfolio Holdings26
- Portfolio Turnover Rate74%
- Advisory Fees Paid$3,180,570
|
| Additional Fund Statistics Significance or Limits [Text Block] |
|
| Holdings [Text Block] |
Portfolio Composition (% of Total Net Assets)Value | Value | Value |
|---|
Other assets less liabilities | | 0.0%Footnote Reference* | Materials | | 100.0% |
| Footnote | Description | Footnote* | Amount is less than 0.05% |
|
| Largest Holdings [Text Block] |
Top Ten Holdings (% of Total Net Assets)Albemarle Corp. | | 8.2% |
|---|
China Northern Rare Earth Group High-Tech Co. Ltd. | | 7.8% |
|---|
Lynas Rare Earths Ltd. | | 6.1% |
|---|
MP Materials Corp. | | 5.9% |
|---|
PLS Group Ltd. | | 5.8% |
|---|
Sociedad Quimica y Minera de Chile SA | | 5.7% |
|---|
Xiamen Tungsten Co. Ltd. | | 5.4% |
|---|
Jinduicheng Molybdenum Co. Ltd. | | 4.8% |
|---|
Shenghe Resources Holding Co. Ltd. | | 4.4% |
|---|
Ganfeng Lithium Group Co. Ltd. | | 4.4% |
|---|
|
| Material Fund Change [Text Block] |
|
| Summary of Change Legend [Text Block] |
|
| Updated Prospectus Web Address |
<span style="box-sizing: border-box; color: rgb(0, 0, 0); display: inline; flex-wrap: nowrap; font-size: 10.6667px; font-weight: 400; grid-area: auto; line-height: 16px; margin: 0px; overflow: visible; text-align: left; text-align-last: auto; white-space-collapse: preserve-breaks;">https://www.vaneck.com/us/en/etf-mutual-fund-finder/etfs/documents/</span>
|
| Accountant Change Statement [Text Block] |
|
| Accountant Change Disagreements [Text Block] |
|
| C000047032 |
|
| Shareholder Report [Line Items] |
|
| Fund Name |
VanEck Russia ETF
|
| Class Name |
VanEck Russia ETF
|
| Trading Symbol |
RSX
|
| Annual or Semi-Annual Statement [Text Block] |
This annual shareholder report contains important information about the VanEck Russia ETF (the "Fund") for the period January 1, 2025 to December 31, 2025.
|
| Shareholder Report Annual or Semi-Annual |
Annual Shareholder Report
|
| Additional Information [Text Block] |
You can find additional information about the Fund at https://www.vaneck.com/us/en/etf-mutual-fund-finder/etfs/documents/. You can also request this information by contacting us at 800.826.2333 or info@vaneck.com.
|
| Material Fund Change Notice [Text Block] |
This report describes material changes to the Fund that occurred during and after the reporting period.
|
| Additional Information Phone Number |
800.826.2333
|
| Additional Information Email |
<span style="box-sizing: border-box; color: rgb(0, 0, 0); display: inline; flex-wrap: nowrap; font-size: 10.6667px; font-weight: 400; grid-area: auto; line-height: 16px; margin: 0px; overflow: visible; text-align: left; text-align-last: auto; white-space-collapse: preserve-breaks;">info@vaneck.com</span>
|
| Additional Information Website |
<span style="box-sizing: border-box; color: rgb(0, 0, 0); display: inline; flex-wrap: nowrap; font-size: 10.6667px; font-weight: 400; grid-area: auto; line-height: 16px; margin: 0px; overflow: visible; text-align: left; text-align-last: auto; white-space-collapse: preserve-breaks;">https://www.vaneck.com/us/en/etf-mutual-fund-finder/etfs/documents/</span>
|
| Expenses [Text Block] |
What were the Fund costs for the last year?(based on a hypothetical $10,000 investment) Fund Name | Costs of a $10,000 investment | Costs paid as a % of a $10,000 investment |
|---|
VanEck Russia ETF | $74 | 0.72% |
|---|
|
| Expenses Paid, Amount |
$ 74
|
| Expense Ratio, Percent |
0.72%
|
| Factors Affecting Performance [Text Block] |
How did the Fund perform last year?Since December 28, 2022, the Fund has been operating under a Plan of Liquidation and Termination which was approved by the Board of Trustees of the Fund. Performance during the period resulted primarily from dividend income from money market fund holdings.
|
| Performance Past Does Not Indicate Future [Text] |
The performance data quoted represents past performance. Past performance is no guarantee of future results.
|
| Line Graph [Table Text Block] |
How did the Fund perform over the past 10 years?This chart shows the value of a hypothetical $10,000 investment in the Fund at NAV over the past 10 years. Cumulative Performance Based on $10,000 Investment 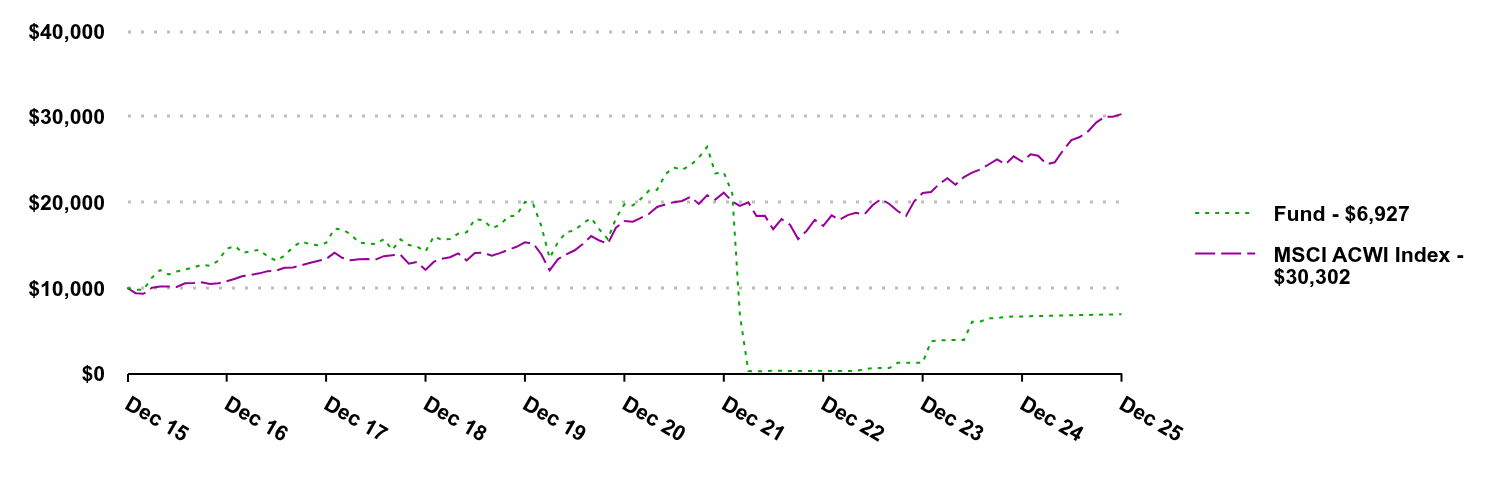 | Fund | MSCI ACWI Index |
|---|
Dec 15 | $10,000 | $10,000 |
|---|
Jan 16 | $9,789 | $9,397 |
|---|
Feb 16 | $9,816 | $9,332 |
|---|
Mar 16 | $11,212 | $10,024 |
|---|
Apr 16 | $12,090 | $10,172 |
|---|
May 16 | $11,579 | $10,185 |
|---|
Jun 16 | $11,920 | $10,123 |
|---|
Jul 16 | $12,158 | $10,559 |
|---|
Aug 16 | $12,410 | $10,595 |
|---|
Sep 16 | $12,696 | $10,660 |
|---|
Oct 16 | $12,594 | $10,479 |
|---|
Nov 16 | $13,186 | $10,558 |
|---|
Dec 16 | $14,591 | $10,786 |
|---|
Jan 17 | $14,899 | $11,081 |
|---|
Feb 17 | $14,089 | $11,392 |
|---|
Mar 17 | $14,311 | $11,532 |
|---|
Apr 17 | $14,449 | $11,711 |
|---|
May 17 | $13,674 | $11,970 |
|---|
Jun 17 | $13,190 | $12,024 |
|---|
Jul 17 | $13,757 | $12,360 |
|---|
Aug 17 | $14,761 | $12,408 |
|---|
Sep 17 | $15,404 | $12,647 |
|---|
Oct 17 | $15,141 | $12,910 |
|---|
Nov 17 | $14,996 | $13,160 |
|---|
Dec 17 | $15,265 | $13,372 |
|---|
Jan 18 | $16,919 | $14,127 |
|---|
Feb 18 | $16,825 | $13,533 |
|---|
Mar 18 | $16,298 | $13,244 |
|---|
Apr 18 | $15,323 | $13,370 |
|---|
May 18 | $15,193 | $13,387 |
|---|
Jun 18 | $15,121 | $13,314 |
|---|
Jul 18 | $15,691 | $13,716 |
|---|
Aug 18 | $14,449 | $13,824 |
|---|
Sep 18 | $15,670 | $13,884 |
|---|
Oct 18 | $15,027 | $12,843 |
|---|
Nov 18 | $14,839 | $13,031 |
|---|
Dec 18 | $14,277 | $12,113 |
|---|
Jan 19 | $16,040 | $13,070 |
|---|
Feb 19 | $15,622 | $13,419 |
|---|
Mar 19 | $15,721 | $13,588 |
|---|
Apr 19 | $16,336 | $14,047 |
|---|
May 19 | $16,503 | $13,214 |
|---|
Jun 19 | $18,038 | $14,079 |
|---|
Jul 19 | $17,914 | $14,120 |
|---|
Aug 19 | $17,001 | $13,785 |
|---|
Sep 19 | $17,353 | $14,075 |
|---|
Oct 19 | $18,345 | $14,460 |
|---|
Nov 19 | $18,484 | $14,813 |
|---|
Dec 19 | $20,044 | $15,335 |
|---|
Jan 20 | $19,736 | $15,166 |
|---|
Feb 20 | $17,262 | $13,941 |
|---|
Mar 20 | $13,493 | $12,059 |
|---|
Apr 20 | $15,331 | $13,350 |
|---|
May 20 | $16,522 | $13,931 |
|---|
Jun 20 | $16,718 | $14,376 |
|---|
Jul 20 | $17,534 | $15,137 |
|---|
Aug 20 | $18,166 | $16,063 |
|---|
Sep 20 | $16,847 | $15,545 |
|---|
Oct 20 | $15,692 | $15,167 |
|---|
Nov 20 | $18,137 | $17,037 |
|---|
Dec 20 | $19,769 | $17,828 |
|---|
Jan 21 | $19,633 | $17,747 |
|---|
Feb 21 | $20,365 | $18,158 |
|---|
Mar 21 | $21,358 | $18,643 |
|---|
Apr 21 | $21,471 | $19,458 |
|---|
May 21 | $23,288 | $19,761 |
|---|
Jun 21 | $24,077 | $20,021 |
|---|
Jul 21 | $23,794 | $20,159 |
|---|
Aug 21 | $24,340 | $20,664 |
|---|
Sep 21 | $25,196 | $19,810 |
|---|
Oct 21 | $26,477 | $20,821 |
|---|
Nov 21 | $23,379 | $20,320 |
|---|
Dec 21 | $23,474 | $21,133 |
|---|
Jan 22 | $21,070 | $20,095 |
|---|
Feb 22 | $6,869 | $19,576 |
|---|
Mar 22 | $299 | $20,000 |
|---|
Apr 22 | $297 | $18,399 |
|---|
May 22 | $276 | $18,420 |
|---|
Jun 22 | $354 | $16,868 |
|---|
Jul 22 | $331 | $18,046 |
|---|
Aug 22 | $326 | $17,381 |
|---|
Sep 22 | $303 | $15,717 |
|---|
Oct 22 | $303 | $16,666 |
|---|
Nov 22 | $333 | $17,958 |
|---|
Dec 22 | $323 | $17,252 |
|---|
Jan 23 | $324 | $18,488 |
|---|
Feb 23 | $326 | $17,958 |
|---|
Mar 23 | $327 | $18,512 |
|---|
Apr 23 | $328 | $18,778 |
|---|
May 23 | $504 | $18,577 |
|---|
Jun 23 | $658 | $19,656 |
|---|
Jul 23 | $660 | $20,375 |
|---|
Aug 23 | $666 | $19,806 |
|---|
Sep 23 | $1,266 | $18,987 |
|---|
Oct 23 | $1,271 | $18,416 |
|---|
Nov 23 | $1,277 | $20,116 |
|---|
Dec 23 | $1,281 | $21,082 |
|---|
Jan 24 | $3,782 | $21,206 |
|---|
Feb 24 | $3,889 | $22,116 |
|---|
Mar 24 | $3,906 | $22,810 |
|---|
Apr 24 | $3,939 | $22,057 |
|---|
May 24 | $3,937 | $22,953 |
|---|
Jun 24 | $6,051 | $23,464 |
|---|
Jul 24 | $6,095 | $23,843 |
|---|
Aug 24 | $6,463 | $24,448 |
|---|
Sep 24 | $6,489 | $25,016 |
|---|
Oct 24 | $6,635 | $24,455 |
|---|
Nov 24 | $6,667 | $25,369 |
|---|
Dec 24 | $6,684 | $24,769 |
|---|
Jan 25 | $6,713 | $25,600 |
|---|
Feb 25 | $6,733 | $25,446 |
|---|
Mar 25 | $6,755 | $24,441 |
|---|
Apr 25 | $6,777 | $24,669 |
|---|
May 25 | $6,799 | $26,087 |
|---|
Jun 25 | $6,821 | $27,258 |
|---|
Jul 25 | $6,840 | $27,628 |
|---|
Aug 25 | $6,860 | $28,310 |
|---|
Sep 25 | $6,881 | $29,336 |
|---|
Oct 25 | $6,901 | $29,992 |
|---|
Nov 25 | $6,921 | $29,989 |
|---|
Dec 25 | $6,927 | $30,302 |
|---|
|
| No Deduction of Taxes [Text Block] |
|
| Performance Table Market Index Changed [Text Block] |
|
| Material Change Description [Text Block] |
|
| Material Change Date |
Dec. 31, 2025
|
| Updated Performance Information Location [Text Block] |
|
| AssetsNet |
$ 32,172,138
|
| Holdings Count | Holding |
29
|
| Advisory Fees Paid, Amount |
$ 0
|
| InvestmentCompanyPortfolioTurnover |
0.00%
|
| Additional Fund Statistics [Text Block] |
- Total Net Assets$32,172,138
- Number of Portfolio Holdings29
- Portfolio Turnover Rate-%
- Advisory Fees Paid$-
|
| Additional Fund Statistics Significance or Limits [Text Block] |
|
| Holdings [Text Block] |
Portfolio Composition (% of Total Net Assets)Value | Value | Value |
|---|
Liabilities in excess of other assetsFootnote Reference* | | (0.7)% | Money Market Fund | | 100.7% |
| Footnote | Description | Footnote* | Includes securities fair valued at zero. |
|
| Material Fund Change [Text Block] |
The following material fund changes occurred during and after the period ended December 31, 2025: The Fund's net expense ratio increased to 0.72% for the year ended December 31, 2025 from 0.32% for the year ended December 31, 2024 primarily resulting from extraordinary legal fees and a decrease in average net assets. Due to regulatory restrictions imposed by the Office of Foreign Assets Control ("OFAC") upon the Fund and certain of its service providers and operational counterparties, the Fund’s ability to process financial transactions and make payments, including distributions to shareholders, has been completely restricted. Such restrictions may exist for a prolonged period of time. During this period, the Fund may not be able to meet its obligations and certain regulatory requirements, which will have a negative impact on the Fund and its shareholders. In addition, the following risk has been added as a principal risk of the Fund. Tax Risk. The Fund has qualified as a regulated investment company under the Internal Revenue Code of 1986, as amended (the "Code"). However, due to restrictions on the Fund’s ability to pay distributions imposed by OFAC, the Fund will be unable, unless such restrictions are lifted, to pay the required distributions of its investment company taxable income and realized capital gains, if any. Regulated investment companies are required to annually distribute at least 90% of their investment company taxable income. Unless these restrictions are lifted, the Fund will be unable to meet this requirement and will no longer be qualified as a regulated investment company after certain deadlines have passed. The loss of qualification is likely to result in income tax liability for the Fund and result in economic loss for the shareholders of the Fund. This is a summary of certain changes to the Fund since December 31, 2025. For more complete information, you may review the Fund’s next prospectus, which we expect to be available by May 1, 2026 at [https://www.vaneck.com/us/en/etf-mutual-fund-finder/etfs/documents] or upon request at [800.826.2333]. |
| Material Fund Change Expenses [Text Block] |
The Fund's net expense ratio increased to 0.72% for the year ended December 31, 2025 from 0.32% for the year ended December 31, 2024 primarily resulting from extraordinary legal fees and a decrease in average net assets.
|
| Material Fund Change Risks Change [Text Block] |
Due to regulatory restrictions imposed by the Office of Foreign Assets Control ("OFAC") upon the Fund and certain of its service providers and operational counterparties, the Fund’s ability to process financial transactions and make payments, including distributions to shareholders, has been completely restricted. Such restrictions may exist for a prolonged period of time. During this period, the Fund may not be able to meet its obligations and certain regulatory requirements, which will have a negative impact on the Fund and its shareholders. In addition, the following risk has been added as a principal risk of the Fund. Tax Risk. The Fund has qualified as a regulated investment company under the Internal Revenue Code of 1986, as amended (the "Code"). However, due to restrictions on the Fund’s ability to pay distributions imposed by OFAC, the Fund will be unable, unless such restrictions are lifted, to pay the required distributions of its investment company taxable income and realized capital gains, if any. Regulated investment companies are required to annually distribute at least 90% of their investment company taxable income. Unless these restrictions are lifted, the Fund will be unable to meet this requirement and will no longer be qualified as a regulated investment company after certain deadlines have passed. The loss of qualification is likely to result in income tax liability for the Fund and result in economic loss for the shareholders of the Fund. This is a summary of certain changes to the Fund since December 31, 2025. For more complete information, you may review the Fund’s next prospectus, which we expect to be available by May 1, 2026 at [https://www.vaneck.com/us/en/etf-mutual-fund-finder/etfs/documents] or upon request at [800.826.2333].
|
| Summary of Change Legend [Text Block] |
The following material fund changes occurred during and after the period ended December 31, 2025:
|
| Updated Prospectus Web Address |
<span style="box-sizing: border-box; color: rgb(0, 0, 0); display: inline; flex-wrap: nowrap; font-size: 10.6667px; font-weight: 400; grid-area: auto; line-height: 16px; margin: 0px; overflow: visible; text-align: left; text-align-last: auto; white-space-collapse: preserve-breaks;">https://www.vaneck.com/us/en/etf-mutual-fund-finder/etfs/documents/</span>
|
| Accountant Change Statement [Text Block] |
|
| Accountant Change Disagreements [Text Block] |
|
| C000098930 |
|
| Shareholder Report [Line Items] |
|
| Fund Name |
VanEck Russia Small-Cap ETF
|
| Class Name |
VanEck Russia Small-Cap ETF
|
| Trading Symbol |
RSXJ
|
| Annual or Semi-Annual Statement [Text Block] |
This annual shareholder report contains important information about the VanEck Russia Small-Cap ETF (the "Fund") for the period January 1, 2025 to December 31, 2025.
|
| Shareholder Report Annual or Semi-Annual |
Annual Shareholder Report
|
| Additional Information [Text Block] |
You can find additional information about the Fund at https://www.vaneck.com/us/en/etf-mutual-fund-finder/etfs/documents/. You can also request this information by contacting us at 800.826.2333 or info@vaneck.com.
|
| Additional Information Phone Number |
800.826.2333
|
| Additional Information Email |
<span style="box-sizing: border-box; color: rgb(0, 0, 0); display: inline; flex-wrap: nowrap; font-size: 10.6667px; font-weight: 400; grid-area: auto; line-height: 16px; margin: 0px; overflow: visible; text-align: left; text-align-last: auto; white-space-collapse: preserve-breaks;">info@vaneck.com</span>
|
| Additional Information Website |
<span style="box-sizing: border-box; color: rgb(0, 0, 0); display: inline; flex-wrap: nowrap; font-size: 10.6667px; font-weight: 400; grid-area: auto; line-height: 16px; margin: 0px; overflow: visible; text-align: left; text-align-last: auto; white-space-collapse: preserve-breaks;">https://www.vaneck.com/us/en/etf-mutual-fund-finder/etfs/documents/</span>
|
| Expenses [Text Block] |
What were the Fund costs for the last year?(based on a hypothetical $10,000 investment) Fund Name | Costs of a $10,000 investment | Costs paid as a % of a $10,000 investment |
|---|
VanEck Russia Small-Cap ETF | $150 | 0.72% |
|---|
|
| Expenses Paid, Amount |
$ 150
|
| Expense Ratio, Percent |
0.72%
|
| Factors Affecting Performance [Text Block] |
How did the Fund perform last year?Since December 28, 2022, the Fund has been operating under a Plan of Liquidation and Termination which was approved by the Board of Trustees of the Fund. Performance during the period resulted primarily from a distribution made from a security and dividend income from money market fund holdings.
|
| Performance Past Does Not Indicate Future [Text] |
The performance data quoted represents past performance. Past performance is no guarantee of future results.
|
| Line Graph [Table Text Block] |
How did the Fund perform over the past 10 years?This chart shows the value of a hypothetical $10,000 investment in the Fund at NAV over the past 10 years. Cumulative Performance Based on $10,000 Investment  | Fund | MSCI ACWI Index |
|---|
Dec 15 | $10,000 | $10,000 |
|---|
Jan 16 | $9,094 | $9,397 |
|---|
Feb 16 | $9,420 | $9,332 |
|---|
Mar 16 | $11,554 | $10,024 |
|---|
Apr 16 | $12,615 | $10,172 |
|---|
May 16 | $12,771 | $10,185 |
|---|
Jun 16 | $13,853 | $10,123 |
|---|
Jul 16 | $14,635 | $10,559 |
|---|
Aug 16 | $15,324 | $10,595 |
|---|
Sep 16 | $16,401 | $10,660 |
|---|
Oct 16 | $17,240 | $10,479 |
|---|
Nov 16 | $18,389 | $10,558 |
|---|
Dec 16 | $20,107 | $10,786 |
|---|
Jan 17 | $21,548 | $11,081 |
|---|
Feb 17 | $20,913 | $11,392 |
|---|
Mar 17 | $21,664 | $11,532 |
|---|
Apr 17 | $21,654 | $11,711 |
|---|
May 17 | $21,797 | $11,970 |
|---|
Jun 17 | $20,744 | $12,024 |
|---|
Jul 17 | $21,215 | $12,360 |
|---|
Aug 17 | $22,812 | $12,408 |
|---|
Sep 17 | $22,558 | $12,647 |
|---|
Oct 17 | $22,855 | $12,910 |
|---|
Nov 17 | $21,691 | $13,160 |
|---|
Dec 17 | $22,321 | $13,372 |
|---|
Jan 18 | $23,682 | $14,127 |
|---|
Feb 18 | $23,380 | $13,533 |
|---|
Mar 18 | $23,188 | $13,244 |
|---|
Apr 18 | $20,922 | $13,370 |
|---|
May 18 | $20,637 | $13,387 |
|---|
Jun 18 | $19,808 | $13,314 |
|---|
Jul 18 | $19,517 | $13,716 |
|---|
Aug 18 | $17,877 | $13,824 |
|---|
Sep 18 | $17,761 | $13,884 |
|---|
Oct 18 | $16,680 | $12,843 |
|---|
Nov 18 | $16,955 | $13,031 |
|---|
Dec 18 | $15,829 | $12,113 |
|---|
Jan 19 | $17,795 | $13,070 |
|---|
Feb 19 | $17,692 | $13,419 |
|---|
Mar 19 | $17,600 | $13,588 |
|---|
Apr 19 | $17,933 | $14,047 |
|---|
May 19 | $18,105 | $13,214 |
|---|
Jun 19 | $19,808 | $14,079 |
|---|
Jul 19 | $20,151 | $14,120 |
|---|
Aug 19 | $19,457 | $13,785 |
|---|
Sep 19 | $19,553 | $14,075 |
|---|
Oct 19 | $19,682 | $14,460 |
|---|
Nov 19 | $20,119 | $14,813 |
|---|
Dec 19 | $21,553 | $15,335 |
|---|
Jan 20 | $22,866 | $15,166 |
|---|
Feb 20 | $20,483 | $13,941 |
|---|
Mar 20 | $14,461 | $12,059 |
|---|
Apr 20 | $16,363 | $13,350 |
|---|
May 20 | $17,485 | $13,931 |
|---|
Jun 20 | $18,716 | $14,376 |
|---|
Jul 20 | $19,863 | $15,137 |
|---|
Aug 20 | $20,476 | $16,063 |
|---|
Sep 20 | $19,640 | $15,545 |
|---|
Oct 20 | $18,655 | $15,167 |
|---|
Nov 20 | $21,594 | $17,037 |
|---|
Dec 20 | $22,681 | $17,828 |
|---|
Jan 21 | $22,423 | $17,747 |
|---|
Feb 21 | $23,181 | $18,158 |
|---|
Mar 21 | $22,823 | $18,643 |
|---|
Apr 21 | $22,936 | $19,458 |
|---|
May 21 | $23,483 | $19,761 |
|---|
Jun 21 | $23,001 | $20,021 |
|---|
Jul 21 | $22,976 | $20,159 |
|---|
Aug 21 | $23,986 | $20,664 |
|---|
Sep 21 | $23,575 | $19,810 |
|---|
Oct 21 | $24,888 | $20,821 |
|---|
Nov 21 | $22,302 | $20,320 |
|---|
Dec 21 | $21,938 | $21,133 |
|---|
Jan 22 | $19,764 | $20,095 |
|---|
Feb 22 | $8,523 | $19,576 |
|---|
Mar 22 | $500 | $20,000 |
|---|
Apr 22 | $446 | $18,399 |
|---|
May 22 | $451 | $18,420 |
|---|
Jun 22 | $426 | $16,868 |
|---|
Jul 22 | $426 | $18,046 |
|---|
Aug 22 | $414 | $17,381 |
|---|
Sep 22 | $377 | $15,717 |
|---|
Oct 22 | $349 | $16,666 |
|---|
Nov 22 | $322 | $17,958 |
|---|
Dec 22 | $294 | $17,252 |
|---|
Jan 23 | $291 | $18,488 |
|---|
Feb 23 | $293 | $17,958 |
|---|
Mar 23 | $293 | $18,512 |
|---|
Apr 23 | $293 | $18,778 |
|---|
May 23 | $294 | $18,577 |
|---|
Jun 23 | $294 | $19,656 |
|---|
Jul 23 | $304 | $20,375 |
|---|
Aug 23 | $306 | $19,806 |
|---|
Sep 23 | $307 | $18,987 |
|---|
Oct 23 | $309 | $18,416 |
|---|
Nov 23 | $310 | $20,116 |
|---|
Dec 23 | $311 | $21,082 |
|---|
Jan 24 | $312 | $21,206 |
|---|
Feb 24 | $314 | $22,116 |
|---|
Mar 24 | $315 | $22,810 |
|---|
Apr 24 | $317 | $22,057 |
|---|
May 24 | $318 | $22,953 |
|---|
Jun 24 | $320 | $23,464 |
|---|
Jul 24 | $1,381 | $23,843 |
|---|
Aug 24 | $1,386 | $24,448 |
|---|
Sep 24 | $2,084 | $25,016 |
|---|
Oct 24 | $2,091 | $24,455 |
|---|
Nov 24 | $2,109 | $25,369 |
|---|
Dec 24 | $2,115 | $24,769 |
|---|
Jan 25 | $2,125 | $25,600 |
|---|
Feb 25 | $2,132 | $25,446 |
|---|
Mar 25 | $2,139 | $24,441 |
|---|
Apr 25 | $2,146 | $24,669 |
|---|
May 25 | $2,154 | $26,087 |
|---|
Jun 25 | $2,161 | $27,258 |
|---|
Jul 25 | $2,169 | $27,628 |
|---|
Aug 25 | $2,177 | $28,310 |
|---|
Sep 25 | $2,183 | $29,336 |
|---|
Oct 25 | $6,622 | $29,992 |
|---|
Nov 25 | $6,641 | $29,989 |
|---|
Dec 25 | $6,665 | $30,302 |
|---|
|
| No Deduction of Taxes [Text Block] |
|
| Performance Table Market Index Changed [Text Block] |
|
| Material Change Description [Text Block] |
|
| Updated Performance Information Location [Text Block] |
|
| AssetsNet |
$ 340,383
|
| Holdings Count | Holding |
22
|
| Advisory Fees Paid, Amount |
$ 0
|
| InvestmentCompanyPortfolioTurnover |
0.00%
|
| Additional Fund Statistics [Text Block] |
- Total Net Assets$340,383
- Number of Portfolio Holdings22
- Portfolio Turnover Rate-%
- Advisory Fees Paid$-
|
| Additional Fund Statistics Significance or Limits [Text Block] |
|
| Holdings [Text Block] |
Portfolio Composition (% of Total Net Assets)Value | Value | Value |
|---|
Liabilities in excess of other assetsFootnote Reference* | | (10.6)% | Money Market Fund | | 110.6% |
| Footnote | Description | Footnote* | Includes securities fair valued at zero. |
|
| Material Fund Change [Text Block] |
|
| Summary of Change Legend [Text Block] |
|
| Updated Prospectus Web Address |
<span style="box-sizing: border-box; color: rgb(0, 0, 0); display: inline; flex-wrap: nowrap; font-size: 10.6667px; font-weight: 400; grid-area: auto; line-height: 16px; margin: 0px; overflow: visible; text-align: left; text-align-last: auto; white-space-collapse: preserve-breaks;">https://www.vaneck.com/us/en/etf-mutual-fund-finder/etfs/documents/</span>
|
| Accountant Change Statement [Text Block] |
|
| Accountant Change Disagreements [Text Block] |
|
| C000037682 |
|
| Shareholder Report [Line Items] |
|
| Fund Name |
VanEck Steel ETF
|
| Class Name |
VanEck Steel ETF
|
| Trading Symbol |
SLX
|
| Security Exchange Name |
NYSEArca
|
| Annual or Semi-Annual Statement [Text Block] |
This annual shareholder report contains important information about the VanEck Steel ETF (the "Fund") for the period January 1, 2025 to December 31, 2025.
|
| Shareholder Report Annual or Semi-Annual |
Annual Shareholder Report
|
| Additional Information [Text Block] |
You can find additional information about the Fund at https://www.vaneck.com/us/en/etf-mutual-fund-finder/etfs/documents/. You can also request this information by contacting us at 800.826.2333 or info@vaneck.com.
|
| Material Fund Change Notice [Text Block] |
This report describes material changes to the Fund that occurred during the reporting period.
|
| Additional Information Phone Number |
800.826.2333
|
| Additional Information Email |
<span style="box-sizing: border-box; color: rgb(0, 0, 0); display: inline; flex-wrap: nowrap; font-size: 10.6667px; font-weight: 400; grid-area: auto; line-height: 16px; margin: 0px; overflow: visible; text-align: left; text-align-last: auto; white-space-collapse: preserve-breaks;">info@vaneck.com</span>
|
| Additional Information Website |
<span style="box-sizing: border-box; color: rgb(0, 0, 0); display: inline; flex-wrap: nowrap; font-size: 10.6667px; font-weight: 400; grid-area: auto; line-height: 16px; margin: 0px; overflow: visible; text-align: left; text-align-last: auto; white-space-collapse: preserve-breaks;">https://www.vaneck.com/us/en/etf-mutual-fund-finder/etfs/documents/</span>
|
| Expenses [Text Block] |
What were the Fund costs for the last year?(based on a hypothetical $10,000 investment) Fund Name | Costs of a $10,000 investment | Costs paid as a % of a $10,000 investment |
|---|
VanEck Steel ETF | $69 | 0.55% |
|---|
|
| Expenses Paid, Amount |
$ 69
|
| Expense Ratio, Percent |
0.55%
|
| Factors Affecting Performance [Text Block] |
How did the Fund perform last year?During the period, performance reflected improving conditions across global steel and metals markets, supported by firm demand and favorable pricing dynamics. The fund’s exposure to aerospace and defense-linked companies led the Fund’s contribution to performance for the period. From a country perspective, exposures to the United States, Brazil, and Australia were the leading contributors to performance for the period, while Canada detracted. The leading individual contributors were ATI, Carpenter Technology, Vale SA, Rio Tinto, and ArcelorMittal. The leading individual detractors for the period were Algoma Steel Group and Gibraltar Industries.
|
| Performance Past Does Not Indicate Future [Text] |
The performance data quoted represents past performance. Past performance is no guarantee of future results.
|
| Line Graph [Table Text Block] |
 | Fund | MSCI ACWI Index | MarketVector™ Global Steel Index | NYSE Arca Steel Index |
|---|
Dec 15 | $10,000 | $10,000 | $10,000 | $10,000 |
|---|
Jan 16 | $8,996 | $9,397 | $8,992 | $8,992 |
|---|
Feb 16 | $9,969 | $9,332 | $9,963 | $9,963 |
|---|
Mar 16 | $12,787 | $10,024 | $12,747 | $12,747 |
|---|
Apr 16 | $15,184 | $10,172 | $15,126 | $15,126 |
|---|
May 16 | $12,782 | $10,185 | $12,731 | $12,731 |
|---|
Jun 16 | $14,160 | $10,123 | $14,100 | $14,100 |
|---|
Jul 16 | $16,481 | $10,559 | $16,407 | $16,407 |
|---|
Aug 16 | $15,241 | $10,595 | $15,169 | $15,169 |
|---|
Sep 16 | $15,845 | $10,660 | $15,770 | $15,770 |
|---|
Oct 16 | $17,013 | $10,479 | $16,937 | $16,937 |
|---|
Nov 16 | $20,312 | $10,558 | $20,226 | $20,226 |
|---|
Dec 16 | $19,577 | $10,786 | $19,486 | $19,486 |
|---|
Jan 17 | $21,343 | $11,081 | $21,247 | $21,247 |
|---|
Feb 17 | $22,176 | $11,392 | $22,091 | $22,091 |
|---|
Mar 17 | $20,892 | $11,532 | $20,830 | $20,830 |
|---|
Apr 17 | $19,686 | $11,711 | $19,640 | $19,640 |
|---|
May 17 | $18,915 | $11,970 | $18,873 | $18,873 |
|---|
Jun 17 | $19,935 | $12,024 | $19,890 | $19,890 |
|---|
Jul 17 | $21,306 | $12,360 | $21,267 | $21,267 |
|---|
Aug 17 | $22,083 | $12,408 | $22,051 | $22,051 |
|---|
Sep 17 | $21,834 | $12,647 | $21,809 | $21,809 |
|---|
Oct 17 | $21,928 | $12,910 | $21,911 | $21,911 |
|---|
Nov 17 | $21,938 | $13,160 | $21,927 | $21,927 |
|---|
Dec 17 | $24,250 | $13,372 | $24,285 | $24,285 |
|---|
Jan 18 | $26,226 | $14,127 | $26,262 | $26,262 |
|---|
Feb 18 | $26,072 | $13,533 | $26,120 | $26,120 |
|---|
Mar 18 | $24,274 | $13,244 | $24,316 | $24,316 |
|---|
Apr 18 | $25,669 | $13,370 | $25,718 | $25,718 |
|---|
May 18 | $25,367 | $13,387 | $25,430 | $25,430 |
|---|
Jun 18 | $24,030 | $13,314 | $24,102 | $24,102 |
|---|
Jul 18 | $25,414 | $13,716 | $25,502 | $25,502 |
|---|
Aug 18 | $23,404 | $13,824 | $23,497 | $23,497 |
|---|
Sep 18 | $24,353 | $13,884 | $24,473 | $24,473 |
|---|
Oct 18 | $22,613 | $12,843 | $22,733 | $22,733 |
|---|
Nov 18 | $21,298 | $13,031 | $21,409 | $21,409 |
|---|
Dec 18 | $19,657 | $12,113 | $19,755 | $19,755 |
|---|
Jan 19 | $22,363 | $13,070 | $22,450 | $22,450 |
|---|
Feb 19 | $22,566 | $13,419 | $22,665 | $22,665 |
|---|
Mar 19 | $22,543 | $13,588 | $22,656 | $22,656 |
|---|
Apr 19 | $21,737 | $14,047 | $21,849 | $21,849 |
|---|
May 19 | $19,820 | $13,214 | $19,931 | $19,931 |
|---|
Jun 19 | $22,081 | $14,079 | $22,214 | $22,214 |
|---|
Jul 19 | $21,006 | $14,120 | $21,140 | $21,140 |
|---|
Aug 19 | $18,383 | $13,785 | $18,499 | $18,499 |
|---|
Sep 19 | $19,117 | $14,075 | $19,247 | $19,247 |
|---|
Oct 19 | $19,448 | $14,460 | $19,588 | $19,588 |
|---|
Nov 19 | $20,696 | $14,813 | $20,855 | $20,855 |
|---|
Dec 19 | $21,824 | $15,335 | $22,046 | $22,046 |
|---|
Jan 20 | $19,440 | $15,166 | $19,613 | $19,613 |
|---|
Feb 20 | $16,988 | $13,941 | $17,149 | $17,149 |
|---|
Mar 20 | $12,679 | $12,059 | $12,777 | $12,777 |
|---|
Apr 20 | $13,780 | $13,350 | $13,890 | $13,890 |
|---|
May 20 | $15,091 | $13,931 | $15,221 | $15,221 |
|---|
Jun 20 | $15,969 | $14,376 | $16,111 | $16,111 |
|---|
Jul 20 | $16,562 | $15,137 | $16,715 | $16,715 |
|---|
Aug 20 | $17,807 | $16,063 | $17,995 | $17,995 |
|---|
Sep 20 | $17,887 | $15,545 | $18,087 | $18,087 |
|---|
Oct 20 | $18,542 | $15,167 | $18,777 | $18,777 |
|---|
Nov 20 | $23,000 | $17,037 | $23,300 | $23,300 |
|---|
Dec 20 | $26,314 | $17,828 | $26,739 | $26,739 |
|---|
Jan 21 | $25,559 | $17,747 | $25,984 | $25,984 |
|---|
Feb 21 | $28,631 | $18,158 | $29,121 | $29,121 |
|---|
Mar 21 | $32,889 | $18,643 | $33,539 | $33,539 |
|---|
Apr 21 | $34,966 | $19,458 | $35,664 | $35,663 |
|---|
May 21 | $37,301 | $19,761 | $38,068 | $38,068 |
|---|
Jun 21 | $36,580 | $20,021 | $37,356 | $37,356 |
|---|
Jul 21 | $38,212 | $20,159 | $39,038 | $39,038 |
|---|
Aug 21 | $36,896 | $20,664 | $37,711 | $37,711 |
|---|
Sep 21 | $32,584 | $19,810 | $33,296 | $33,296 |
|---|
Oct 21 | $33,236 | $20,821 | $34,000 | $34,000 |
|---|
Nov 21 | $30,666 | $20,320 | $31,382 | $31,382 |
|---|
Dec 21 | $33,657 | $21,133 | $34,451 | $34,451 |
|---|
Jan 22 | $33,095 | $20,095 | $33,892 | $33,892 |
|---|
Feb 22 | $37,953 | $19,576 | $38,881 | $38,881 |
|---|
Mar 22 | $42,901 | $20,000 | $44,032 | $44,032 |
|---|
Apr 22 | $39,373 | $18,399 | $40,430 | $40,430 |
|---|
May 22 | $39,738 | $18,420 | $40,842 | $40,842 |
|---|
Jun 22 | $31,301 | $16,868 | $32,150 | $32,150 |
|---|
Jul 22 | $34,086 | $18,046 | $35,018 | $35,018 |
|---|
Aug 22 | $33,433 | $17,381 | $34,373 | $34,373 |
|---|
Sep 22 | $30,142 | $15,717 | $30,968 | $30,968 |
|---|
Oct 22 | $33,562 | $16,666 | $34,490 | $34,490 |
|---|
Nov 22 | $39,460 | $17,958 | $40,563 | $40,563 |
|---|
Dec 22 | $38,326 | $17,252 | $39,503 | $39,503 |
|---|
Jan 23 | $45,093 | $18,488 | $46,514 | $46,514 |
|---|
Feb 23 | $43,814 | $17,958 | $45,216 | $45,216 |
|---|
Mar 23 | $42,322 | $18,512 | $43,724 | $43,724 |
|---|
Apr 23 | $40,384 | $18,778 | $41,742 | $41,742 |
|---|
May 23 | $36,887 | $18,577 | $38,154 | $38,154 |
|---|
Jun 23 | $42,443 | $19,656 | $43,944 | $43,944 |
|---|
Jul 23 | $46,859 | $20,375 | $48,533 | $48,533 |
|---|
Aug 23 | $44,706 | $19,806 | $46,336 | $46,336 |
|---|
Sep 23 | $43,370 | $18,987 | $44,976 | $44,976 |
|---|
Oct 23 | $41,514 | $18,416 | $43,064 | $43,064 |
|---|
Nov 23 | $46,392 | $20,116 | $48,147 | $48,147 |
|---|
Dec 23 | $50,295 | $21,082 | $52,367 | $52,367 |
|---|
Jan 24 | $47,331 | $21,206 | $49,297 | $49,297 |
|---|
Feb 24 | $48,146 | $22,116 | $50,171 | $50,171 |
|---|
Mar 24 | $49,442 | $22,810 | $51,569 | $51,569 |
|---|
Apr 24 | $46,897 | $22,057 | $48,941 | $48,941 |
|---|
May 24 | $48,669 | $22,953 | $50,838 | $50,838 |
|---|
Jun 24 | $45,406 | $23,464 | $47,445 | $47,444 |
|---|
Jul 24 | $47,864 | $23,843 | $50,034 | $50,034 |
|---|
Aug 24 | $45,491 | $24,448 | $47,597 | $47,597 |
|---|
Sep 24 | $48,012 | $25,016 | $50,248 | $50,248 |
|---|
Oct 24 | $45,740 | $24,455 | $47,890 | $47,890 |
|---|
Nov 24 | $48,534 | $25,369 | $50,833 | $50,833 |
|---|
Dec 24 | $41,276 | $24,769 | $43,274 | $43,274 |
|---|
Jan 25 | $43,023 | $25,600 | $45,126 | $45,126 |
|---|
Feb 25 | $43,952 | $25,446 | $46,140 | $46,140 |
|---|
Mar 25 | $43,318 | $24,441 | $45,497 | $45,497 |
|---|
Apr 25 | $42,518 | $24,669 | $44,658 | $44,658 |
|---|
May 25 | $43,625 | $26,087 | $45,866 | $45,866 |
|---|
Jun 25 | $46,751 | $27,258 | $49,159 | $49,159 |
|---|
Jul 25 | $48,139 | $27,628 | $50,641 | $50,641 |
|---|
Aug 25 | $50,173 | $28,310 | $52,856 | $52,856 |
|---|
Sep 25 | $51,183 | $29,336 | $53,932 | $53,932 |
|---|
Oct 25 | $55,938 | $29,992 | $58,968 | $58,968 |
|---|
Nov 25 | $57,208 | $29,989 | $60,362 | $60,362 |
|---|
Dec 25 | $60,742 | $30,302 | $64,200 | $63,364 |
|---|
|
| Average Annual Return [Table Text Block] |
Average Annual Total Returns . | 1 Year | 5 Years | 10 Years |
|---|
VanEck Steel ETF | 47.16% | 18.21% | 19.77% |
|---|
MarketVector™ Global Steel Index | 48.36% | 19.15% | 20.44% |
|---|
MSCI ACWI Index | 22.34% | 11.19% | 11.72% |
|---|
NYSE Arca Steel Index | 46.43% | 18.83% | 20.28% |
|---|
Index data prior to December 22, 2025 reflects that of the NYSE Arca Steel Index. From December 22, 2025 forward, the index data reflects that of the Fund's underlying index, MarketVector Global Steel Index. The performance data quoted represents past performance. Past performance is no guarantee of future results. Performance information for the Fund may reflect temporary fee waivers, if applicable. These returns do not reflect the deduction of taxes that a shareholder would pay on Fund dividends and distributions or the sale of Fund shares. Visit vaneck.com for more recent performance information. |
| No Deduction of Taxes [Text Block] |
|
| Performance Table Market Index Changed [Text Block] |
|
| Material Change Description [Text Block] |
|
| Material Change Date |
Dec. 31, 2025
|
| Updated Performance Information Location [Text Block] |
|
| AssetsNet |
$ 161,097,156
|
| Holdings Count | Holding |
39
|
| Advisory Fees Paid, Amount |
$ 375,907
|
| InvestmentCompanyPortfolioTurnover |
107.00%
|
| Additional Fund Statistics [Text Block] |
- Total Net Assets$161,097,156
- Number of Portfolio Holdings39
- Portfolio Turnover Rate107%
- Advisory Fees Paid$375,907
|
| Additional Fund Statistics Significance or Limits [Text Block] |
|
| Holdings [Text Block] |
Portfolio Composition (% of Total Net Assets)Value | Value | Value |
|---|
Other assets less liabilities | | 0.4% | Industrials | | 1.8% | Energy | | 3.0% | Materials | | 94.8% |
|
| Largest Holdings [Text Block] |
Top Ten Holdings (% of Total Net Assets)Rio Tinto PLC | | 8.3% |
|---|
BHP Group Ltd. | | 7.9% |
|---|
Vale SA | | 6.9% |
|---|
Fortescue Ltd. | | 6.2% |
|---|
Nucor Corp. | | 5.9% |
|---|
Rio Tinto Ltd. | | 5.8% |
|---|
ArcelorMittal SA | | 5.0% |
|---|
Nippon Steel Corp. | | 4.6% |
|---|
Reliance, Inc. | | 4.4% |
|---|
Steel Dynamics, Inc. | | 4.4% |
|---|
|
| Material Fund Change [Text Block] |
The following material fund change occurred during the period ended December 31, 2025: Effective after the close of trading on the NYSE Arca, Inc., on December 19, 2025, the Fund’s benchmark index became the MarketVector Global Steel Index and the Fund’s investment objective and principal investment strategy changed in connection therewith. |
| Material Fund Change Objectives [Text Block] |
Effective after the close of trading on the NYSE Arca, Inc., on December 19, 2025, the Fund’s benchmark index became the MarketVector Global Steel Index and the Fund’s investment objective and principal investment strategy changed in connection therewith.
|
| Summary of Change Legend [Text Block] |
The following material fund change occurred during the period ended December 31, 2025:
|
| Updated Prospectus Web Address |
<span style="box-sizing: border-box; color: rgb(0, 0, 0); display: inline; flex-wrap: nowrap; font-size: 10.6667px; font-weight: 400; grid-area: auto; line-height: 16px; margin: 0px; overflow: visible; text-align: left; text-align-last: auto; white-space-collapse: preserve-breaks;">https://www.vaneck.com/us/en/etf-mutual-fund-finder/etfs/documents/</span>
|
| Accountant Change Statement [Text Block] |
|
| Accountant Change Disagreements [Text Block] |
|
| C000051121 |
|
| Shareholder Report [Line Items] |
|
| Fund Name |
VanEck Uranium and Nuclear ETF
|
| Class Name |
VanEck Uranium and Nuclear ETF
|
| Trading Symbol |
NLR
|
| Security Exchange Name |
NYSEArca
|
| Annual or Semi-Annual Statement [Text Block] |
This annual shareholder report contains important information about the VanEck Uranium and Nuclear ETF (the "Fund") for the period January 1, 2025 to December 31, 2025.
|
| Shareholder Report Annual or Semi-Annual |
Annual Shareholder Report
|
| Additional Information [Text Block] |
You can find additional information about the Fund at https://www.vaneck.com/us/en/etf-mutual-fund-finder/etfs/documents/. You can also request this information by contacting us at 800.826.2333 or info@vaneck.com.
|
| Additional Information Phone Number |
800.826.2333
|
| Additional Information Email |
<span style="box-sizing: border-box; color: rgb(0, 0, 0); display: inline; flex-wrap: nowrap; font-size: 10.6667px; font-weight: 400; grid-area: auto; line-height: 16px; margin: 0px; overflow: visible; text-align: left; text-align-last: auto; white-space-collapse: preserve-breaks;">info@vaneck.com</span>
|
| Additional Information Website |
<span style="box-sizing: border-box; color: rgb(0, 0, 0); display: inline; flex-wrap: nowrap; font-size: 10.6667px; font-weight: 400; grid-area: auto; line-height: 16px; margin: 0px; overflow: visible; text-align: left; text-align-last: auto; white-space-collapse: preserve-breaks;">https://www.vaneck.com/us/en/etf-mutual-fund-finder/etfs/documents/</span>
|
| Expenses [Text Block] |
What were the Fund costs for the last year?(based on a hypothetical $10,000 investment) Fund Name | Costs of a $10,000 investment | Costs paid as a % of a $10,000 investment |
|---|
VanEck Uranium and Nuclear ETF | $67 | 0.52% |
|---|
|
| Expenses Paid, Amount |
$ 67
|
| Expense Ratio, Percent |
0.52%
|
| Factors Affecting Performance [Text Block] |
How did the Fund perform last year?During the period, nuclear energy and uranium companies benefited from continued growth in electricity demand, driven by increased infrastructure investment and sustained demand from data centers and industrial users. The Fund’s exposures to energy and utilities were among the top contributing sectors to performance. The United States led the contributions to performance. There were no detractors during the period at the country level. The leading individual contributors to performance were Okla, Centrus Energy, Cameco, and Constellation Energy. The leading individual detractors from performance were PG&E, encore Energy, and Nano Nuclear Energy.
|
| Performance Past Does Not Indicate Future [Text] |
The performance data quoted represents past performance. Past performance is no guarantee of future results.
|
| Line Graph [Table Text Block] |
 | Fund | MSCI ACWI Index | MVIS® Global Uranium & Nuclear Energy Index |
|---|
Dec 15 | $10,000 | $10,000 | $10,000 |
|---|
Jan 16 | $10,099 | $9,397 | $10,045 |
|---|
Feb 16 | $10,099 | $9,332 | $10,075 |
|---|
Mar 16 | $10,809 | $10,024 | $10,775 |
|---|
Apr 16 | $10,630 | $10,172 | $10,655 |
|---|
May 16 | $10,685 | $10,185 | $10,640 |
|---|
Jun 16 | $11,151 | $10,123 | $11,050 |
|---|
Jul 16 | $11,145 | $10,559 | $11,105 |
|---|
Aug 16 | $10,696 | $10,595 | $10,628 |
|---|
Sep 16 | $10,762 | $10,660 | $10,665 |
|---|
Oct 16 | $10,690 | $10,479 | $10,619 |
|---|
Nov 16 | $10,354 | $10,558 | $10,258 |
|---|
Dec 16 | $10,887 | $10,786 | $10,776 |
|---|
Jan 17 | $10,928 | $11,081 | $10,803 |
|---|
Feb 17 | $11,251 | $11,392 | $11,119 |
|---|
Mar 17 | $11,400 | $11,532 | $11,253 |
|---|
Apr 17 | $11,317 | $11,711 | $11,200 |
|---|
May 17 | $11,809 | $11,970 | $11,679 |
|---|
Jun 17 | $11,516 | $12,024 | $11,373 |
|---|
Jul 17 | $11,800 | $12,360 | $11,670 |
|---|
Aug 17 | $12,105 | $12,408 | $11,960 |
|---|
Sep 17 | $11,798 | $12,647 | $11,654 |
|---|
Oct 17 | $12,267 | $12,910 | $12,109 |
|---|
Nov 17 | $12,469 | $13,160 | $12,303 |
|---|
Dec 17 | $11,787 | $13,372 | $11,615 |
|---|
Jan 18 | $11,749 | $14,127 | $11,568 |
|---|
Feb 18 | $11,377 | $13,533 | $11,230 |
|---|
Mar 18 | $11,747 | $13,244 | $11,530 |
|---|
Apr 18 | $12,277 | $13,370 | $12,104 |
|---|
May 18 | $12,121 | $13,387 | $11,943 |
|---|
Jun 18 | $12,239 | $13,314 | $12,055 |
|---|
Jul 18 | $12,525 | $13,716 | $12,328 |
|---|
Aug 18 | $12,505 | $13,824 | $12,318 |
|---|
Sep 18 | $12,688 | $13,884 | $12,492 |
|---|
Oct 18 | $12,445 | $12,843 | $12,264 |
|---|
Nov 18 | $12,626 | $13,031 | $12,427 |
|---|
Dec 18 | $12,394 | $12,113 | $12,177 |
|---|
Jan 19 | $12,664 | $13,070 | $12,429 |
|---|
Feb 19 | $12,921 | $13,419 | $12,682 |
|---|
Mar 19 | $12,936 | $13,588 | $12,689 |
|---|
Apr 19 | $12,786 | $14,047 | $12,546 |
|---|
May 19 | $12,255 | $13,214 | $12,030 |
|---|
Jun 19 | $12,741 | $14,079 | $12,501 |
|---|
Jul 19 | $12,405 | $14,120 | $12,186 |
|---|
Aug 19 | $12,306 | $13,785 | $12,075 |
|---|
Sep 19 | $12,443 | $14,075 | $12,230 |
|---|
Oct 19 | $12,248 | $14,460 | $12,052 |
|---|
Nov 19 | $12,044 | $14,813 | $11,843 |
|---|
Dec 19 | $12,449 | $15,335 | $12,246 |
|---|
Jan 20 | $12,757 | $15,166 | $12,571 |
|---|
Feb 20 | $11,899 | $13,941 | $11,686 |
|---|
Mar 20 | $10,099 | $12,059 | $9,948 |
|---|
Apr 20 | $10,892 | $13,350 | $10,695 |
|---|
May 20 | $11,384 | $13,931 | $11,146 |
|---|
Jun 20 | $10,856 | $14,376 | $10,633 |
|---|
Jul 20 | $11,381 | $15,137 | $11,141 |
|---|
Aug 20 | $11,420 | $16,063 | $11,194 |
|---|
Sep 20 | $11,363 | $15,545 | $11,139 |
|---|
Oct 20 | $11,578 | $15,167 | $11,347 |
|---|
Nov 20 | $12,392 | $17,037 | $12,149 |
|---|
Dec 20 | $12,896 | $17,828 | $12,636 |
|---|
Jan 21 | $12,648 | $17,747 | $12,411 |
|---|
Feb 21 | $12,415 | $18,158 | $12,179 |
|---|
Mar 21 | $13,685 | $18,643 | $13,419 |
|---|
Apr 21 | $14,004 | $19,458 | $13,708 |
|---|
May 21 | $14,208 | $19,761 | $13,872 |
|---|
Jun 21 | $13,678 | $20,021 | $13,389 |
|---|
Jul 21 | $13,535 | $20,159 | $13,250 |
|---|
Aug 21 | $14,052 | $20,664 | $13,748 |
|---|
Sep 21 | $13,818 | $19,810 | $13,549 |
|---|
Oct 21 | $14,497 | $20,821 | $14,192 |
|---|
Nov 21 | $14,058 | $20,320 | $13,776 |
|---|
Dec 21 | $14,635 | $21,133 | $14,302 |
|---|
Jan 22 | $14,141 | $20,095 | $13,804 |
|---|
Feb 22 | $14,365 | $19,576 | $14,051 |
|---|
Mar 22 | $15,208 | $20,000 | $14,867 |
|---|
Apr 22 | $14,719 | $18,399 | $14,425 |
|---|
May 22 | $15,084 | $18,420 | $14,740 |
|---|
Jun 22 | $13,904 | $16,868 | $13,580 |
|---|
Jul 22 | $14,793 | $18,046 | $14,448 |
|---|
Aug 22 | $14,999 | $17,381 | $14,676 |
|---|
Sep 22 | $13,744 | $15,717 | $13,467 |
|---|
Oct 22 | $14,327 | $16,666 | $14,014 |
|---|
Nov 22 | $15,164 | $17,958 | $14,792 |
|---|
Dec 22 | $14,942 | $17,252 | $14,668 |
|---|
Jan 23 | $15,807 | $18,488 | $15,483 |
|---|
Feb 23 | $15,012 | $17,958 | $14,732 |
|---|
Mar 23 | $15,088 | $18,512 | $14,785 |
|---|
Apr 23 | $15,353 | $18,778 | $15,038 |
|---|
May 23 | $14,790 | $18,577 | $14,501 |
|---|
Jun 23 | $16,187 | $19,656 | $15,830 |
|---|
Jul 23 | $16,637 | $20,375 | $16,277 |
|---|
Aug 23 | $17,429 | $19,806 | $17,084 |
|---|
Sep 23 | $19,256 | $18,987 | $18,883 |
|---|
Oct 23 | $18,927 | $18,416 | $18,523 |
|---|
Nov 23 | $20,031 | $20,116 | $19,633 |
|---|
Dec 23 | $20,325 | $21,082 | $19,919 |
|---|
Jan 24 | $21,464 | $21,206 | $21,087 |
|---|
Feb 24 | $21,005 | $22,116 | $20,591 |
|---|
Mar 24 | $21,608 | $22,810 | $21,179 |
|---|
Apr 24 | $21,919 | $22,057 | $21,565 |
|---|
May 24 | $24,647 | $22,953 | $24,127 |
|---|
Jun 24 | $22,820 | $23,464 | $22,397 |
|---|
Jul 24 | $22,393 | $23,843 | $21,941 |
|---|
Aug 24 | $21,477 | $24,448 | $21,059 |
|---|
Sep 24 | $23,838 | $25,016 | $23,368 |
|---|
Oct 24 | $25,792 | $24,455 | $25,323 |
|---|
Nov 24 | $27,037 | $25,369 | $26,476 |
|---|
Dec 24 | $23,276 | $24,769 | $22,839 |
|---|
Jan 25 | $25,589 | $25,600 | $25,126 |
|---|
Feb 25 | $22,801 | $25,446 | $22,308 |
|---|
Mar 25 | $21,027 | $24,441 | $20,580 |
|---|
Apr 25 | $22,619 | $24,669 | $22,132 |
|---|
May 25 | $27,870 | $26,087 | $27,289 |
|---|
Jun 25 | $31,687 | $27,258 | $31,023 |
|---|
Jul 25 | $32,786 | $27,628 | $32,182 |
|---|
Aug 25 | $34,006 | $28,310 | $33,330 |
|---|
Sep 25 | $38,751 | $29,336 | $37,941 |
|---|
Oct 25 | $44,372 | $29,992 | $43,496 |
|---|
Nov 25 | $37,165 | $29,989 | $36,366 |
|---|
Dec 25 | $36,296 | $30,302 | $35,587 |
|---|
|
| Average Annual Return [Table Text Block] |
Average Annual Total Returns . | 1 Year | 5 Years | 10 Years |
|---|
VanEck Uranium and Nuclear ETF | 55.94% | 22.99% | 13.76% |
|---|
MVIS® Global Uranium & Nuclear Energy Index | 55.82% | 23.01% | 13.53% |
|---|
MSCI ACWI Index | 22.34% | 11.19% | 11.72% |
|---|
The performance data quoted represents past performance. Past performance is no guarantee of future results. Performance information for the Fund may reflect temporary fee waivers, if applicable. These returns do not reflect the deduction of taxes that a shareholder would pay on Fund dividends and distributions or the sale of Fund shares. Visit vaneck.com for more recent performance information. |
| No Deduction of Taxes [Text Block] |
|
| Performance Table Market Index Changed [Text Block] |
|
| Material Change Description [Text Block] |
|
| Updated Performance Information Location [Text Block] |
|
| AssetsNet |
$ 3,602,853,321
|
| Holdings Count | Holding |
26
|
| Advisory Fees Paid, Amount |
$ 10,247,077
|
| InvestmentCompanyPortfolioTurnover |
42.00%
|
| Additional Fund Statistics [Text Block] |
- Total Net Assets$3,602,853,321
- Number of Portfolio Holdings26
- Portfolio Turnover Rate42%
- Advisory Fees Paid$10,247,077
|
| Additional Fund Statistics Significance or Limits [Text Block] |
|
| Holdings [Text Block] |
Portfolio Composition (% of Total Net Assets)Value | Value | Value |
|---|
Other assets less liabilities | | 0.4% | Industrials | | 16.1% | Utilities | | 35.6% | Energy | | 47.9% |
|
| Largest Holdings [Text Block] |
Top Ten Holdings (% of Total Net Assets)Cameco Corp. | | 8.2% |
|---|
Constellation Energy Corp. | | 8.2% |
|---|
BWX Technologies, Inc. | | 5.5% |
|---|
Public Service Enterprise Group, Inc. | | 5.5% |
|---|
PG&E Corp. | | 5.3% |
|---|
CGN Power Co. Ltd. | | 4.7% |
|---|
NexGen Energy Ltd. | | 4.6% |
|---|
Denison Mines Corp. | | 4.6% |
|---|
Oklo, Inc. | | 4.5% |
|---|
Centrus Energy Corp. | | 4.3% |
|---|
|
| Material Fund Change [Text Block] |
|
| Summary of Change Legend [Text Block] |
|
| Updated Prospectus Web Address |
<span style="box-sizing: border-box; color: rgb(0, 0, 0); display: inline; flex-wrap: nowrap; font-size: 10.6667px; font-weight: 400; grid-area: auto; line-height: 16px; margin: 0px; overflow: visible; text-align: left; text-align-last: auto; white-space-collapse: preserve-breaks;">https://www.vaneck.com/us/en/etf-mutual-fund-finder/etfs/documents/</span>
|
| Accountant Change Statement [Text Block] |
|
| Accountant Change Disagreements [Text Block] |
|
| C000066397 |
|
| Shareholder Report [Line Items] |
|
| Fund Name |
VanEck Vietnam ETF
|
| Class Name |
VanEck Vietnam ETF
|
| Trading Symbol |
VNM
|
| Security Exchange Name |
CboeBZX
|
| Annual or Semi-Annual Statement [Text Block] |
This annual shareholder report contains important information about the VanEck Vietnam ETF (the "Fund") for the period January 1, 2025 to December 31, 2025.
|
| Shareholder Report Annual or Semi-Annual |
Annual Shareholder Report
|
| Additional Information [Text Block] |
You can find additional information about the Fund at https://www.vaneck.com/us/en/etf-mutual-fund-finder/etfs/documents/. You can also request this information by contacting us at 800.826.2333 or info@vaneck.com.
|
| Additional Information Phone Number |
800.826.2333
|
| Additional Information Email |
<span style="box-sizing: border-box; color: rgb(0, 0, 0); display: inline; flex-wrap: nowrap; font-size: 10.6667px; font-weight: 400; grid-area: auto; line-height: 16px; margin: 0px; overflow: visible; text-align: left; text-align-last: auto; white-space-collapse: preserve-breaks;">info@vaneck.com</span>
|
| Additional Information Website |
<span style="box-sizing: border-box; color: rgb(0, 0, 0); display: inline; flex-wrap: nowrap; font-size: 10.6667px; font-weight: 400; grid-area: auto; line-height: 16px; margin: 0px; overflow: visible; text-align: left; text-align-last: auto; white-space-collapse: preserve-breaks;">https://www.vaneck.com/us/en/etf-mutual-fund-finder/etfs/documents/</span>
|
| Expenses [Text Block] |
What were the Fund costs for the last year?(based on a hypothetical $10,000 investment) Fund Name | Costs of a $10,000 investment | Costs paid as a % of a $10,000 investment |
|---|
VanEck Vietnam ETF | $87 | 0.66% |
|---|
|
| Expenses Paid, Amount |
$ 87
|
| Expense Ratio, Percent |
0.66%
|
| Factors Affecting Performance [Text Block] |
How did the Fund perform last year?The Fund posted a positive return over the period, supported by robust economic growth in Vietnam, improving manufacturing and export activity and a recovery in domestic consumption, despite continued uncertainty around global demand and currency-related pressures. The Real Estate sector contributed the most to the Fund’s performance during the period, followed by Financials and Industrials. The leading individual contributors to performance were Vingroup Joint Stock Company, Vinhomes Joint Stock Company and VIX Securities Joint Stock Company. The Information Technology sector detracted the most from the Fund’s performance during the period, followed by Energy. The leading individual detractors from performance were Duc Giang Chemicals Group Joint Stock Company, Vietnam Airlines JSC and Vinh Hoan Corp.
|
| Performance Past Does Not Indicate Future [Text] |
The performance data quoted represents past performance. Past performance is no guarantee of future results.
|
| Line Graph [Table Text Block] |
 | Fund | MSCI ACWI Index | MarketVector™ Vietnam Local Index |
|---|
Dec 15 | $10,000 | $10,000 | $10,000 |
|---|
Jan 16 | $9,456 | $9,397 | $9,326 |
|---|
Feb 16 | $9,395 | $9,332 | $9,342 |
|---|
Mar 16 | $9,469 | $10,024 | $9,421 |
|---|
Apr 16 | $9,795 | $10,172 | $9,772 |
|---|
May 16 | $9,734 | $10,185 | $9,708 |
|---|
Jun 16 | $9,958 | $10,123 | $9,912 |
|---|
Jul 16 | $10,209 | $10,559 | $10,185 |
|---|
Aug 16 | $10,318 | $10,595 | $10,323 |
|---|
Sep 16 | $10,352 | $10,660 | $10,299 |
|---|
Oct 16 | $9,836 | $10,479 | $9,823 |
|---|
Nov 16 | $9,164 | $10,558 | $9,149 |
|---|
Dec 16 | $9,022 | $10,786 | $9,051 |
|---|
Jan 17 | $9,286 | $11,081 | $9,309 |
|---|
Feb 17 | $9,481 | $11,392 | $9,506 |
|---|
Mar 17 | $9,745 | $11,532 | $9,802 |
|---|
Apr 17 | $9,780 | $11,711 | $9,850 |
|---|
May 17 | $9,940 | $11,970 | $10,016 |
|---|
Jun 17 | $10,329 | $12,024 | $10,416 |
|---|
Jul 17 | $10,329 | $12,360 | $10,422 |
|---|
Aug 17 | $10,260 | $12,408 | $10,359 |
|---|
Sep 17 | $10,350 | $12,647 | $10,440 |
|---|
Oct 17 | $11,081 | $12,910 | $11,184 |
|---|
Nov 17 | $11,839 | $13,160 | $11,948 |
|---|
Dec 17 | $12,248 | $13,372 | $12,383 |
|---|
Jan 18 | $13,572 | $14,127 | $13,699 |
|---|
Feb 18 | $13,207 | $13,533 | $13,389 |
|---|
Mar 18 | $13,593 | $13,244 | $13,814 |
|---|
Apr 18 | $12,701 | $13,370 | $12,880 |
|---|
May 18 | $11,689 | $13,387 | $11,843 |
|---|
Jun 18 | $11,168 | $13,314 | $11,349 |
|---|
Jul 18 | $11,428 | $13,716 | $11,572 |
|---|
Aug 18 | $11,667 | $13,824 | $11,850 |
|---|
Sep 18 | $11,850 | $13,884 | $12,051 |
|---|
Oct 18 | $10,761 | $12,843 | $10,916 |
|---|
Nov 18 | $10,979 | $13,031 | $11,145 |
|---|
Dec 18 | $10,515 | $12,113 | $10,699 |
|---|
Jan 19 | $10,919 | $13,070 | $11,091 |
|---|
Feb 19 | $11,635 | $13,419 | $11,864 |
|---|
Mar 19 | $11,755 | $13,588 | $11,971 |
|---|
Apr 19 | $11,876 | $14,047 | $12,087 |
|---|
May 19 | $11,302 | $13,214 | $11,566 |
|---|
Jun 19 | $11,422 | $14,079 | $11,642 |
|---|
Jul 19 | $11,421 | $14,120 | $11,722 |
|---|
Aug 19 | $11,165 | $13,785 | $11,411 |
|---|
Sep 19 | $11,661 | $14,075 | $11,914 |
|---|
Oct 19 | $11,610 | $14,460 | $11,899 |
|---|
Nov 19 | $11,412 | $14,813 | $11,677 |
|---|
Dec 19 | $11,447 | $15,335 | $11,741 |
|---|
Jan 20 | $10,635 | $15,166 | $11,009 |
|---|
Feb 20 | $9,892 | $13,941 | $10,068 |
|---|
Mar 20 | $7,528 | $12,059 | $7,815 |
|---|
Apr 20 | $8,855 | $13,350 | $9,119 |
|---|
May 20 | $9,694 | $13,931 | $9,936 |
|---|
Jun 20 | $9,629 | $14,376 | $9,841 |
|---|
Jul 20 | $9,866 | $15,137 | $10,145 |
|---|
Aug 20 | $10,460 | $16,063 | $10,797 |
|---|
Sep 20 | $10,625 | $15,545 | $10,908 |
|---|
Oct 20 | $10,622 | $15,167 | $10,905 |
|---|
Nov 20 | $11,430 | $17,037 | $11,795 |
|---|
Dec 20 | $12,560 | $17,828 | $12,967 |
|---|
Jan 21 | $12,081 | $17,747 | $12,544 |
|---|
Feb 21 | $12,639 | $18,158 | $13,090 |
|---|
Mar 21 | $12,824 | $18,643 | $13,242 |
|---|
Apr 21 | $13,586 | $19,458 | $14,117 |
|---|
May 21 | $14,039 | $19,761 | $14,610 |
|---|
Jun 21 | $14,817 | $20,021 | $15,376 |
|---|
Jul 21 | $13,887 | $20,159 | $14,411 |
|---|
Aug 21 | $14,080 | $20,664 | $14,636 |
|---|
Sep 21 | $13,878 | $19,810 | $14,511 |
|---|
Oct 21 | $14,653 | $20,821 | $15,278 |
|---|
Nov 21 | $14,907 | $20,320 | $15,586 |
|---|
Dec 21 | $15,389 | $21,133 | $16,094 |
|---|
Jan 22 | $14,293 | $20,095 | $14,820 |
|---|
Feb 22 | $14,141 | $19,576 | $14,731 |
|---|
Mar 22 | $13,682 | $20,000 | $14,382 |
|---|
Apr 22 | $12,392 | $18,399 | $13,052 |
|---|
May 22 | $11,592 | $18,420 | $12,181 |
|---|
Jun 22 | $10,485 | $16,868 | $10,992 |
|---|
Jul 22 | $10,640 | $18,046 | $11,145 |
|---|
Aug 22 | $11,002 | $17,381 | $11,593 |
|---|
Sep 22 | $9,399 | $15,717 | $9,962 |
|---|
Oct 22 | $8,290 | $16,666 | $8,738 |
|---|
Nov 22 | $8,925 | $17,958 | $9,316 |
|---|
Dec 22 | $8,546 | $17,252 | $9,009 |
|---|
Jan 23 | $9,323 | $18,488 | $9,786 |
|---|
Feb 23 | $8,240 | $17,958 | $8,758 |
|---|
Mar 23 | $8,869 | $18,512 | $9,372 |
|---|
Apr 23 | $8,839 | $18,778 | $9,341 |
|---|
May 23 | $9,107 | $18,577 | $9,676 |
|---|
Jun 23 | $9,679 | $19,656 | $10,255 |
|---|
Jul 23 | $10,835 | $20,375 | $11,507 |
|---|
Aug 23 | $11,068 | $19,806 | $11,788 |
|---|
Sep 23 | $9,921 | $18,987 | $10,584 |
|---|
Oct 23 | $8,448 | $18,416 | $8,975 |
|---|
Nov 23 | $9,608 | $20,116 | $10,234 |
|---|
Dec 23 | $9,909 | $21,082 | $10,586 |
|---|
Jan 24 | $9,740 | $21,206 | $10,439 |
|---|
Feb 24 | $10,275 | $22,116 | $10,959 |
|---|
Mar 24 | $10,558 | $22,810 | $11,194 |
|---|
Apr 24 | $9,402 | $22,057 | $10,087 |
|---|
May 24 | $9,770 | $22,953 | $10,423 |
|---|
Jun 24 | $9,337 | $23,464 | $10,024 |
|---|
Jul 24 | $9,279 | $23,843 | $9,929 |
|---|
Aug 24 | $9,663 | $24,448 | $10,361 |
|---|
Sep 24 | $9,791 | $25,016 | $10,530 |
|---|
Oct 24 | $9,205 | $24,455 | $9,919 |
|---|
Nov 24 | $9,044 | $25,369 | $9,707 |
|---|
Dec 24 | $8,899 | $24,769 | $9,594 |
|---|
Jan 25 | $8,908 | $25,600 | $9,619 |
|---|
Feb 25 | $9,220 | $25,446 | $9,915 |
|---|
Mar 25 | $9,615 | $24,441 | $10,351 |
|---|
Apr 25 | $9,215 | $24,669 | $9,917 |
|---|
May 25 | $10,398 | $26,087 | $11,250 |
|---|
Jun 25 | $10,590 | $27,258 | $11,456 |
|---|
Jul 25 | $12,399 | $27,628 | $13,472 |
|---|
Aug 25 | $13,932 | $28,310 | $15,115 |
|---|
Sep 25 | $13,715 | $29,336 | $14,874 |
|---|
Oct 25 | $13,433 | $29,992 | $14,590 |
|---|
Nov 25 | $13,919 | $29,989 | $15,116 |
|---|
Dec 25 | $14,454 | $30,302 | $15,739 |
|---|
|
| Average Annual Return [Table Text Block] |
Average Annual Total Returns . | 1 Year | 5 Years | 10 Years |
|---|
VanEck Vietnam ETF | 62.42% | 2.85% | 3.75% |
|---|
MarketVector™ Vietnam Local Index | 64.05% | 3.95% | 4.64% |
|---|
MSCI ACWI Index | 22.34% | 11.19% | 11.72% |
|---|
The performance data quoted represents past performance. Past performance is no guarantee of future results. Performance information for the Fund may reflect temporary fee waivers, if applicable. These returns do not reflect the deduction of taxes that a shareholder would pay on Fund dividends and distributions or the sale of Fund shares. Visit vaneck.com for more recent performance information. |
| No Deduction of Taxes [Text Block] |
|
| Performance Table Market Index Changed [Text Block] |
|
| Material Change Description [Text Block] |
|
| Updated Performance Information Location [Text Block] |
|
| AssetsNet |
$ 606,482,036
|
| Holdings Count | Holding |
55
|
| Advisory Fees Paid, Amount |
$ 2,392,301
|
| InvestmentCompanyPortfolioTurnover |
48.00%
|
| Additional Fund Statistics [Text Block] |
- Total Net Assets$606,482,036
- Number of Portfolio Holdings55
- Portfolio Turnover Rate48%
- Advisory Fees Paid$2,392,301
|
| Additional Fund Statistics Significance or Limits [Text Block] |
|
| Holdings [Text Block] |
Portfolio Composition (% of Total Net Assets)Value | Value | Value |
|---|
Other assets less liabilities | | 0.1% | Other Investments | | 0.8% | Energy | | 1.4% | Information Technology | | 1.9% | Materials | | 8.9% | Industrials | | 12.2% | Consumer Staples | | 16.8% | Financials | | 28.7% | Real Estate | | 29.2% |
|
| Largest Holdings [Text Block] |
Top Ten Holdings (% of Total Net Assets)Vingroup JSC | | 9.5% |
|---|
Vinhomes JSC | | 9.3% |
|---|
Masan Group Corp. | | 6.8% |
|---|
Hoa Phat Group JSC | | 6.2% |
|---|
Vietnam Dairy Products JSC | | 5.2% |
|---|
SSI Securities Corp. | | 5.0% |
|---|
Bank for Foreign Trade of Vietnam JSC | | 4.8% |
|---|
VIX Securities JSC | | 3.6% |
|---|
Vietjet Aviation JSC | | 3.3% |
|---|
Vincom Retail JSC | | 3.1% |
|---|
|
| Material Fund Change [Text Block] |
|
| Summary of Change Legend [Text Block] |
|
| Updated Prospectus Web Address |
<span style="box-sizing: border-box; color: rgb(0, 0, 0); display: inline; flex-wrap: nowrap; font-size: 10.6667px; font-weight: 400; grid-area: auto; line-height: 16px; margin: 0px; overflow: visible; text-align: left; text-align-last: auto; white-space-collapse: preserve-breaks;">https://www.vaneck.com/us/en/etf-mutual-fund-finder/etfs/documents/</span>
|
| Accountant Change Statement [Text Block] |
|
| Accountant Change Disagreements [Text Block] |
|