| Year | Summary Compensation Table Total for PEO | Compensation Actually Paid to PEO | Average Summary Compensation Table Total for Non-PEO NEOs | Average Compensation Actually Paid to Non-PEO NEOs | Value of Initial Fixed $100 Investment Based on Total Shareholder Return(1) | Net Income (Loss) | ||||||||||||||||||
| (a) | (b) | (c) | (d) | (e) | (f) | (g) | ||||||||||||||||||
| 2025 | $ | 1,012,670 | $ | 1,130,991 | (2) | $ | 685,092 | $ | 757,676 | (3) | $ | 194.16 | $ | (20,559,122 | ) | |||||||||
| 2024 | $ | 300,000 | $ | 262,801 | $ | 230,000 | $ | 224,346 | $ | 73.98 | $ | (6,897,483 | ) | |||||||||||
| 2023 | $ | 349,650 | $ | 206,651 | $ | 279,650 | $ | 250,376 | $ | 76.28 | $ | (7,614,204 | ) | |||||||||||
| 2. | George Bee was the Company’s PEO for all of 2023, 2024 and 2025. The following table contains a reconciliation of the amounts reflected in the Summary Compensation Table for Mr. Bee for each year covered in the pay for performance table above (as reported in column (b), above) as compared to the Compensation Actually Paid to Mr. Bee for each such covered year (as reported in column (c), above). |
| 2023 | 2024 | 2025 | ||||||||||
| Summary Compensation Table total for Mr. Bee for the covered year | $ | 349,650 | $ | 300,000 | $ | 1,012,670 | ||||||
| Less Grant date fair value of equity awards reported in the “Stock Awards” and “Options Awards” columns in the Summary Compensation Table for the covered fiscal year | $ | (49,650 | ) | $ | (629,337 | ) | ||||||
| Plus Fair value as of the end of the covered fiscal year of all equity awards granted during the covered fiscal year that are outstanding and unvested as of the end of that covered fiscal year | $ | 336,762 | ||||||||||
| Plus Change in fair value (whether positive or negative) as of the end of the covered fiscal year (from the end of the prior fiscal year) of any equity awards granted in any prior fiscal year that are outstanding and unvested as of the end of such covered fiscal year | $ | (77,751 | ) | $ | (1,872 | ) | ||||||
| Plus Fair value of any equity awards that are granted and vest in the covered fiscal year | $ | 49,650 | $ | 403,649 | ||||||||
| Plus Change in fair value (whether positive or negative) as of the vesting date (from the end of the prior fiscal year) of any equity awards granted in a prior fiscal year for which all applicable vesting conditions were satisfied during the covered fiscal year | $ | (65,248 | ) | $ | (35,327 | ) | $ | 7,247 | ||||
| Less Fair value of any equity awards granted in a prior fiscal year that failed to meet the applicable vesting conditions in the covered fiscal year determined as of the end of the prior fiscal year | ||||||||||||
| Plus The dollar value of any dividends or other earnings paid on stock or option awards in the covered fiscal year prior to the vesting date that are not otherwise included in the total compensation for the covered fiscal year | ||||||||||||
| Compensation Actually Paid to Mr. Bee for the covered year | $ | 206,651 | $ | 262,801 | $ | 1,130,991 | ||||||
| 2023 | 2024 | 2025 | ||||||||||
| Average of Summary Compensation Table Total for non-PEOs named executive officers | $ | 279,650 | $ | 230,000 | $ | 685,092 | ||||||
| Less Average of grant date fair value of equity awards in the “Stock Awards” and “Options Awards” columns in the Summary Compensation Table for the covered fiscal year | $ | (49,650 | ) | $ | (402,925 | ) | ||||||
| Plus Average of fair value as of the end of the covered fiscal year of all equity awards granted during the covered fiscal year that are outstanding and unvested as of the end of that covered fiscal year | $ | 202,824 | ||||||||||
| Plus Average of the change in fair value (whether positive or negative) as of the end of the covered fiscal year (from the end of the prior fiscal year) of any equity awards granted in any prior fiscal year that are outstanding and unvested as of the end of such covered fiscal year | $ | (16,975 | ) | $ | (852 | ) | ||||||
| Plus Average of fair value of any equity awards that are granted and vest in the covered fiscal year | $ | 49,650 | $ | 266,996 | ||||||||
| Plus Average of change in fair value (whether positive or negative) as of the vesting date (from the end of the prior fiscal year) of any equity awards granted in a prior fiscal year for which all applicable vesting conditions were satisfied during the covered fiscal year | $ | (12,299 | ) | $ | (4,802 | ) | $ | 5,689 | ||||
| Less Average of the fair value of any equity awards granted in a prior fiscal year that failed to meet the applicable vesting conditions in the covered fiscal year determined as of the end of the prior fiscal year | ||||||||||||
| Plus The dollar value of any dividends or other earnings paid on stock or option awards in the covered fiscal year prior to the vesting date that are not otherwise included in the total compensation for the covered fiscal year | ||||||||||||
| Average Compensation Actually Paid to the non-PEOs named executive officers for the covered year | $ | 250,376 | $ | 224,346 | $ | 757,676 | ||||||
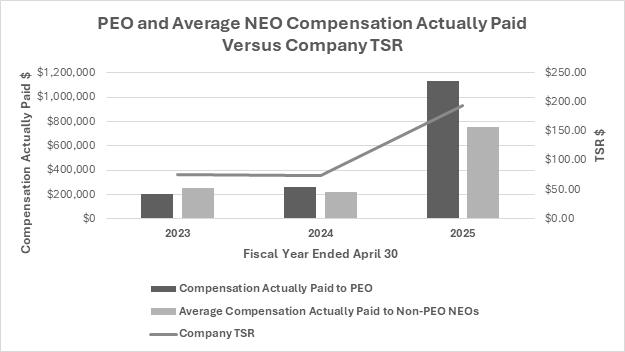
The following chart reflects the relationship between the amount of “compensation actually paid” to Mr. Bee and the average amount of “compensation actually paid” to the Company’s NEOs as a group (excluding Mr. Bee), and the Company’s cumulative TSR over the three years presented in the table. The Company does not use TSR as a performance measure in its overall executive compensation program.
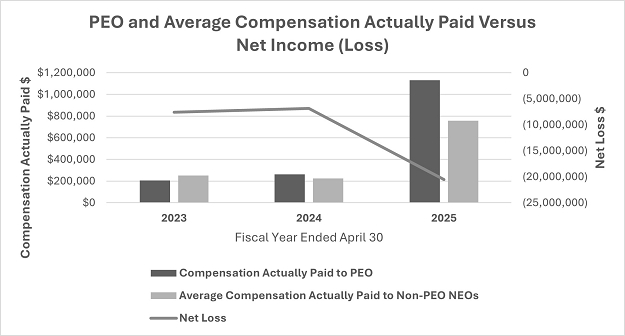
Compensation Actually Paid and GAAP Net Income (Loss)
The following chart reflects the relationship between the amount of “compensation actually paid” to Mr. Bee and the average amount of “compensation actually paid” to the Company’s NEOs as a group (excluding Mr. Bee), and the Company’s net income (loss) as reported under US GAAP, over the three years presented in the table. The Company does not use net income as a performance measure in its overall executive compensation program.
| [1] | Total Shareholder Return (“TSR”) represents the value as of the end of each relevant fiscal year of a hypothetical $100 investment in the Company’s common stock on April 30, 2022, assuming dividend reinvestment. |