Shareholder Report
|
6 Months Ended |
|
Dec. 31, 2025
USD ($)
Holding
|
|---|
| Shareholder Report [Line Items] |
|
|
| Document Type |
N-CSRS
|
|
| Amendment Flag |
false
|
|
| Registrant Name |
Mutual Fund Series Trust
|
|
| Entity Central Index Key |
0001355064
|
|
| Entity Investment Company Type |
N-1A
|
|
| Document Period End Date |
Dec. 31, 2025
|
|
| Shareholder Report Annual or Semi-Annual |
Semi-Annual Shareholder Report
|
|
| C000108407 |
|
|
| Shareholder Report [Line Items] |
|
|
| Fund Name |
Catalyst Dynamic Alpha Fund
|
|
| Class Name |
Class A
|
|
| Trading Symbol |
CPEAX
|
|
| Annual or Semi-Annual Statement [Text Block] |
This semi-annual shareholder report contains important information about Catalyst Dynamic Alpha Fund for the period of July 1, 2025 to December 31, 2025.
|
|
| Additional Information [Text Block] |
You can find additional information about the Fund at https://catalystmf.com/literature-and-forms/. You can also request this information by contacting us at 1-866-447-4228.
|
|
| Additional Information Phone Number |
1-866-447-4228
|
|
| Additional Information Website |
https://catalystmf.com/literature-and-forms/
|
|
| Expenses [Text Block] |
What were the Fund’s costs for the last six months?(based on a hypothetical $10,000 investment) Class Name | Costs of a $10,000 investment | Costs paid as a percentage of a $10,000 investment |
|---|
Class A | $72 | 1.38%Footnote Reference* |
|---|
| Footnote | Description | Footnote* | Annualized |
|
|
| Expenses Paid, Amount |
$ 72
|
|
| Expense Ratio, Percent |
1.38%
|
[1] |
| AssetsNet |
$ 115,876,723
|
|
| Holdings Count | Holding |
37
|
|
| Advisory Fees Paid, Amount |
$ 537,530
|
|
| InvestmentCompanyPortfolioTurnover |
36.00%
|
|
| Additional Fund Statistics [Text Block] |
- Net Assets$115,876,723
- Number of Portfolio Holdings37
- Advisory Fee (net of waivers)$537,530
- Portfolio Turnover36%
|
|
| Holdings [Text Block] |
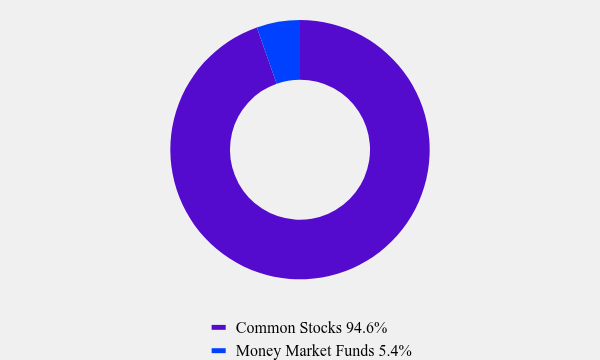
Asset Weighting (% of total investments)Value | Value |
|---|
Common Stocks | 94.6% | Money Market Funds | 5.4% |
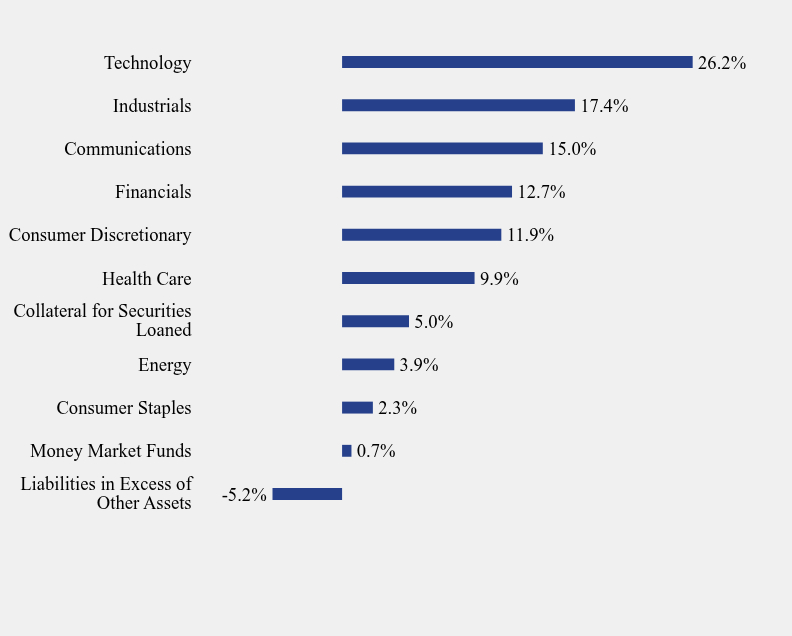
Sector Weighting (% of net assets)Value | Value |
|---|
Liabilities in Excess of Other Assets | -5.2% | Money Market Funds | 0.7% | Consumer Staples | 2.3% | Energy | 3.9% | Collateral for Securities Loaned | 5.0% | Health Care | 9.9% | Consumer Discretionary | 11.9% | Financials | 12.7% | Communications | 15.0% | Industrials | 17.4% | Technology | 26.2% |
Top 10 Holdings (% of net assets)Holding Name | % of Net Assets |
|---|
Taiwan Semiconductor Manufacturing Company Ltd. | 7.1% |
|---|
Amphenol Corporation, Class A | 6.3% |
|---|
Flex Ltd. | 5.3% |
|---|
Mount Vernon Liquid Assets Portfolio | 5.0% |
|---|
Amazon.com, Inc. | 4.7% |
|---|
American Express Company | 4.3% |
|---|
Alphabet, Inc., Class A | 4.0% |
|---|
Corning, Inc. | 3.9% |
|---|
Ralph Lauren Corporation | 3.6% |
|---|
Cardinal Health, Inc. | 3.6% |
|---|
|
|
| Material Fund Change [Text Block] |
|
|
| C000108408 |
|
|
| Shareholder Report [Line Items] |
|
|
| Fund Name |
Catalyst Dynamic Alpha Fund
|
|
| Class Name |
Class C
|
|
| Trading Symbol |
CPECX
|
|
| Annual or Semi-Annual Statement [Text Block] |
This semi-annual shareholder report contains important information about Catalyst Dynamic Alpha Fund for the period of July 1, 2025 to December 31, 2025.
|
|
| Additional Information [Text Block] |
You can find additional information about the Fund at https://catalystmf.com/literature-and-forms/. You can also request this information by contacting us at 1-866-447-4228.
|
|
| Additional Information Phone Number |
1-866-447-4228
|
|
| Additional Information Website |
https://catalystmf.com/literature-and-forms/
|
|
| Expenses [Text Block] |
What were the Fund’s costs for the last six months?(based on a hypothetical $10,000 investment) Class Name | Costs of a $10,000 investment | Costs paid as a percentage of a $10,000 investment |
|---|
Class C | $111 | 2.13%Footnote Reference* |
|---|
| Footnote | Description | Footnote* | Annualized |
|
|
| Expenses Paid, Amount |
$ 111
|
|
| Expense Ratio, Percent |
2.13%
|
[2] |
| AssetsNet |
$ 115,876,723
|
|
| Holdings Count | Holding |
37
|
|
| Advisory Fees Paid, Amount |
$ 537,530
|
|
| InvestmentCompanyPortfolioTurnover |
36.00%
|
|
| Additional Fund Statistics [Text Block] |
- Net Assets$115,876,723
- Number of Portfolio Holdings37
- Advisory Fee (net of waivers)$537,530
- Portfolio Turnover36%
|
|
| Holdings [Text Block] |
Asset Weighting (% of total investments)Value | Value |
|---|
Common Stocks | 94.6% | Money Market Funds | 5.4% |
Sector Weighting (% of net assets)Value | Value |
|---|
Liabilities in Excess of Other Assets | -5.2% | Money Market Funds | 0.7% | Consumer Staples | 2.3% | Energy | 3.9% | Collateral for Securities Loaned | 5.0% | Health Care | 9.9% | Consumer Discretionary | 11.9% | Financials | 12.7% | Communications | 15.0% | Industrials | 17.4% | Technology | 26.2% |
Top 10 Holdings (% of net assets)Holding Name | % of Net Assets |
|---|
Taiwan Semiconductor Manufacturing Company Ltd. | 7.1% |
|---|
Amphenol Corporation, Class A | 6.3% |
|---|
Flex Ltd. | 5.3% |
|---|
Mount Vernon Liquid Assets Portfolio | 5.0% |
|---|
Amazon.com, Inc. | 4.7% |
|---|
American Express Company | 4.3% |
|---|
Alphabet, Inc., Class A | 4.0% |
|---|
Corning, Inc. | 3.9% |
|---|
Ralph Lauren Corporation | 3.6% |
|---|
Cardinal Health, Inc. | 3.6% |
|---|
|
|
| Material Fund Change [Text Block] |
|
|
| C000142551 |
|
|
| Shareholder Report [Line Items] |
|
|
| Fund Name |
Catalyst Dynamic Alpha Fund
|
|
| Class Name |
Class I
|
|
| Trading Symbol |
CPEIX
|
|
| Annual or Semi-Annual Statement [Text Block] |
This semi-annual shareholder report contains important information about Catalyst Dynamic Alpha Fund for the period of July 1, 2025 to December 31, 2025.
|
|
| Additional Information [Text Block] |
You can find additional information about the Fund at https://catalystmf.com/literature-and-forms/. You can also request this information by contacting us at 1-866-447-4228.
|
|
| Additional Information Phone Number |
1-866-447-4228
|
|
| Additional Information Website |
https://catalystmf.com/literature-and-forms/
|
|
| Expenses [Text Block] |
What were the Fund’s costs for the last six months?(based on a hypothetical $10,000 investment) Class Name | Costs of a $10,000 investment | Costs paid as a percentage of a $10,000 investment |
|---|
Class I | $59 | 1.13%Footnote Reference* |
|---|
| Footnote | Description | Footnote* | Annualized |
|
|
| Expenses Paid, Amount |
$ 59
|
|
| Expense Ratio, Percent |
1.13%
|
[3] |
| AssetsNet |
$ 115,876,723
|
|
| Holdings Count | Holding |
37
|
|
| Advisory Fees Paid, Amount |
$ 537,530
|
|
| InvestmentCompanyPortfolioTurnover |
36.00%
|
|
| Additional Fund Statistics [Text Block] |
- Net Assets$115,876,723
- Number of Portfolio Holdings37
- Advisory Fee (net of waivers)$537,530
- Portfolio Turnover36%
|
|
| Holdings [Text Block] |
Asset Weighting (% of total investments)Value | Value |
|---|
Common Stocks | 94.6% | Money Market Funds | 5.4% |
Sector Weighting (% of net assets)Value | Value |
|---|
Liabilities in Excess of Other Assets | -5.2% | Money Market Funds | 0.7% | Consumer Staples | 2.3% | Energy | 3.9% | Collateral for Securities Loaned | 5.0% | Health Care | 9.9% | Consumer Discretionary | 11.9% | Financials | 12.7% | Communications | 15.0% | Industrials | 17.4% | Technology | 26.2% |
Top 10 Holdings (% of net assets)Holding Name | % of Net Assets |
|---|
Taiwan Semiconductor Manufacturing Company Ltd. | 7.1% |
|---|
Amphenol Corporation, Class A | 6.3% |
|---|
Flex Ltd. | 5.3% |
|---|
Mount Vernon Liquid Assets Portfolio | 5.0% |
|---|
Amazon.com, Inc. | 4.7% |
|---|
American Express Company | 4.3% |
|---|
Alphabet, Inc., Class A | 4.0% |
|---|
Corning, Inc. | 3.9% |
|---|
Ralph Lauren Corporation | 3.6% |
|---|
Cardinal Health, Inc. | 3.6% |
|---|
|
|
| Material Fund Change [Text Block] |
|
|
| C000142728 |
|
|
| Shareholder Report [Line Items] |
|
|
| Fund Name |
Catalyst Energy Infrastructure Fund
|
|
| Class Name |
Class A
|
|
| Trading Symbol |
MLXAX
|
|
| Annual or Semi-Annual Statement [Text Block] |
This semi-annual shareholder report contains important information about Catalyst Energy Infrastructure Fund for the period of July 1, 2025 to December 31, 2025.
|
|
| Additional Information [Text Block] |
You can find additional information about the Fund at https://catalystmf.com/literature-and-forms/. You can also request this information by contacting us at 1-866-447-4228.
|
|
| Additional Information Phone Number |
1-866-447-4228
|
|
| Additional Information Website |
https://catalystmf.com/literature-and-forms/
|
|
| Expenses [Text Block] |
What were the Fund’s costs for the last six months?(based on a hypothetical $10,000 investment) Class Name | Costs of a $10,000 investment | Costs paid as a percentage of a $10,000 investment |
|---|
Class A | $80 | 1.68%Footnote Reference* |
|---|
| Footnote | Description | Footnote* | Annualized |
|
|
| Expenses Paid, Amount |
$ 80
|
|
| Expense Ratio, Percent |
1.68%
|
[4] |
| AssetsNet |
$ 327,542,994
|
|
| Holdings Count | Holding |
19
|
|
| Advisory Fees Paid, Amount |
$ 2,293,652
|
|
| InvestmentCompanyPortfolioTurnover |
4.00%
|
|
| Additional Fund Statistics [Text Block] |
- Net Assets$327,542,994
- Number of Portfolio Holdings19
- Advisory Fee (net of waivers)$2,293,652
- Portfolio Turnover4%
|
|
| Holdings [Text Block] |
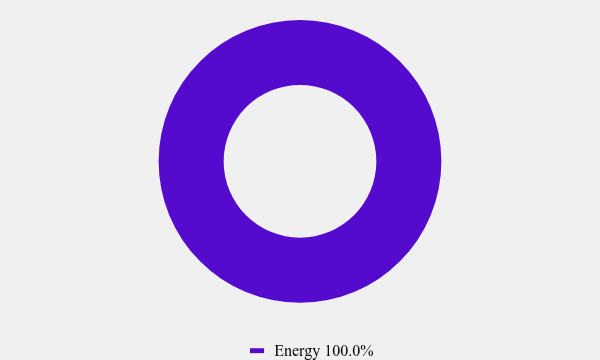
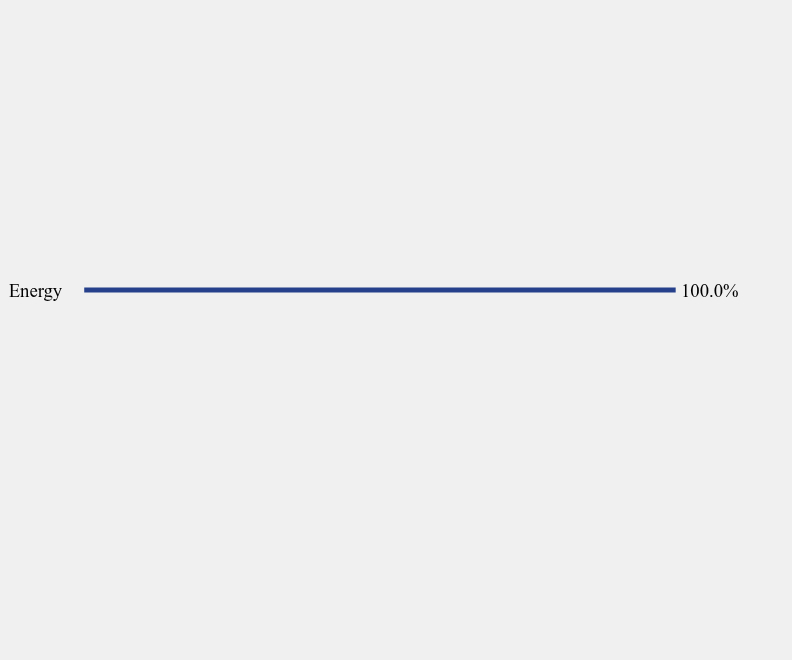
Asset Weighting (% of total investments)Asset Weighting (% of net assets) |
|
| Largest Holdings [Text Block] |
Top 10 Holdings (% of net assets)Holding Name | % of Net Assets |
|---|
Energy Transfer, L.P. | 10.1% |
|---|
Cheniere Energy, Inc. | 9.9% |
|---|
Targa Resources Corporation | 9.9% |
|---|
NextDecade Corporation | 7.5% |
|---|
Venture Global, Inc., Class A | 6.0% |
|---|
ONEOK, Inc. | 4.7% |
|---|
Pembina Pipeline Corporation | 4.6% |
|---|
Kinder Morgan, Inc. | 4.6% |
|---|
Enbridge, Inc. | 4.6% |
|---|
Williams Companies, Inc. (The) | 4.6% |
|---|
|
|
| Material Fund Change [Text Block] |
|
|
| C000142729 |
|
|
| Shareholder Report [Line Items] |
|
|
| Fund Name |
Catalyst Energy Infrastructure Fund
|
|
| Class Name |
Class C
|
|
| Trading Symbol |
MLXCX
|
|
| Annual or Semi-Annual Statement [Text Block] |
This semi-annual shareholder report contains important information about Catalyst Energy Infrastructure Fund for the period of July 1, 2025 to December 31, 2025.
|
|
| Additional Information [Text Block] |
You can find additional information about the Fund at https://catalystmf.com/literature-and-forms/. You can also request this information by contacting us at 1-866-447-4228.
|
|
| Additional Information Phone Number |
1-866-447-4228
|
|
| Additional Information Website |
https://catalystmf.com/literature-and-forms/
|
|
| Expenses [Text Block] |
What were the Fund’s costs for the last six months?(based on a hypothetical $10,000 investment) Class Name | Costs of a $10,000 investment | Costs paid as a percentage of a $10,000 investment |
|---|
Class C | $116 | 2.43%Footnote Reference* |
|---|
| Footnote | Description | Footnote* | Annualized |
|
|
| Expenses Paid, Amount |
$ 116
|
|
| Expense Ratio, Percent |
2.43%
|
[5] |
| AssetsNet |
$ 327,542,994
|
|
| Holdings Count | Holding |
19
|
|
| Advisory Fees Paid, Amount |
$ 2,293,652
|
|
| InvestmentCompanyPortfolioTurnover |
4.00%
|
|
| Additional Fund Statistics [Text Block] |
- Net Assets$327,542,994
- Number of Portfolio Holdings19
- Advisory Fee (net of waivers)$2,293,652
- Portfolio Turnover4%
|
|
| Holdings [Text Block] |
Asset Weighting (% of total investments)Asset Weighting (% of net assets) |
|
| Largest Holdings [Text Block] |
Top 10 Holdings (% of net assets)Holding Name | % of Net Assets |
|---|
Energy Transfer, L.P. | 10.1% |
|---|
Cheniere Energy, Inc. | 9.9% |
|---|
Targa Resources Corporation | 9.9% |
|---|
NextDecade Corporation | 7.5% |
|---|
Venture Global, Inc., Class A | 6.0% |
|---|
ONEOK, Inc. | 4.7% |
|---|
Pembina Pipeline Corporation | 4.6% |
|---|
Kinder Morgan, Inc. | 4.6% |
|---|
Enbridge, Inc. | 4.6% |
|---|
Williams Companies, Inc. (The) | 4.6% |
|---|
|
|
| Material Fund Change [Text Block] |
|
|
| C000142730 |
|
|
| Shareholder Report [Line Items] |
|
|
| Fund Name |
Catalyst Energy Infrastructure Fund
|
|
| Class Name |
Class I
|
|
| Trading Symbol |
MLXIX
|
|
| Annual or Semi-Annual Statement [Text Block] |
This semi-annual shareholder report contains important information about Catalyst Energy Infrastructure Fund for the period of July 1, 2025 to December 31, 2025.
|
|
| Additional Information [Text Block] |
You can find additional information about the Fund at https://catalystmf.com/literature-and-forms/. You can also request this information by contacting us at 1-866-447-4228.
|
|
| Additional Information Phone Number |
1-866-447-4228
|
|
| Additional Information Website |
https://catalystmf.com/literature-and-forms/
|
|
| Expenses [Text Block] |
What were the Fund’s costs for the last six months?(based on a hypothetical $10,000 investment) Class Name | Costs of a $10,000 investment | Costs paid as a percentage of a $10,000 investment |
|---|
Class I | $69 | 1.43%Footnote Reference* |
|---|
| Footnote | Description | Footnote* | Annualized |
|
|
| Expenses Paid, Amount |
$ 69
|
|
| Expense Ratio, Percent |
1.43%
|
[6] |
| AssetsNet |
$ 327,542,994
|
|
| Holdings Count | Holding |
19
|
|
| Advisory Fees Paid, Amount |
$ 2,293,652
|
|
| InvestmentCompanyPortfolioTurnover |
4.00%
|
|
| Additional Fund Statistics [Text Block] |
- Net Assets$327,542,994
- Number of Portfolio Holdings19
- Advisory Fee (net of waivers)$2,293,652
- Portfolio Turnover4%
|
|
| Holdings [Text Block] |
Asset Weighting (% of total investments)Asset Weighting (% of net assets) |
|
| Largest Holdings [Text Block] |
Top 10 Holdings (% of net assets)Holding Name | % of Net Assets |
|---|
Energy Transfer, L.P. | 10.1% |
|---|
Cheniere Energy, Inc. | 9.9% |
|---|
Targa Resources Corporation | 9.9% |
|---|
NextDecade Corporation | 7.5% |
|---|
Venture Global, Inc., Class A | 6.0% |
|---|
ONEOK, Inc. | 4.7% |
|---|
Pembina Pipeline Corporation | 4.6% |
|---|
Kinder Morgan, Inc. | 4.6% |
|---|
Enbridge, Inc. | 4.6% |
|---|
Williams Companies, Inc. (The) | 4.6% |
|---|
|
|
| Material Fund Change [Text Block] |
|
|
| C000102754 |
|
|
| Shareholder Report [Line Items] |
|
|
| Fund Name |
Catalyst Insider Buying Fund
|
|
| Class Name |
Class A
|
|
| Trading Symbol |
INSAX
|
|
| Annual or Semi-Annual Statement [Text Block] |
This semi-annual shareholder report contains important information about Catalyst Insider Buying Fund for the period of July 1, 2025 to December 31, 2025.
|
|
| Additional Information [Text Block] |
You can find additional information about the Fund at https://catalystmf.com/literature-and-forms/. You can also request this information by contacting us at 1-866-447-4228.
|
|
| Additional Information Phone Number |
1-866-447-4228
|
|
| Additional Information Website |
https://catalystmf.com/literature-and-forms/
|
|
| Expenses [Text Block] |
What were the Fund’s costs for the last six months?(based on a hypothetical $10,000 investment) Class Name | Costs of a $10,000 investment | Costs paid as a percentage of a $10,000 investment |
|---|
Class A | $78 | 1.53%Footnote Reference* |
|---|
| Footnote | Description | Footnote* | Annualized |
|
|
| Expenses Paid, Amount |
$ 78
|
|
| Expense Ratio, Percent |
1.53%
|
[7] |
| AssetsNet |
$ 18,643,329
|
|
| Holdings Count | Holding |
60
|
|
| Advisory Fees Paid, Amount |
$ 27,062
|
|
| InvestmentCompanyPortfolioTurnover |
44.00%
|
|
| Additional Fund Statistics [Text Block] |
Net Assets | $18,643,329 |
|---|
Number of Portfolio Holdings | 60 |
|---|
Advisory Fee (net of waivers) | $27,062 |
|---|
Portfolio Turnover | 44% |
|---|
|
|
| Holdings [Text Block] |
Asset Weighting (% of total investments)Value | Value |
|---|
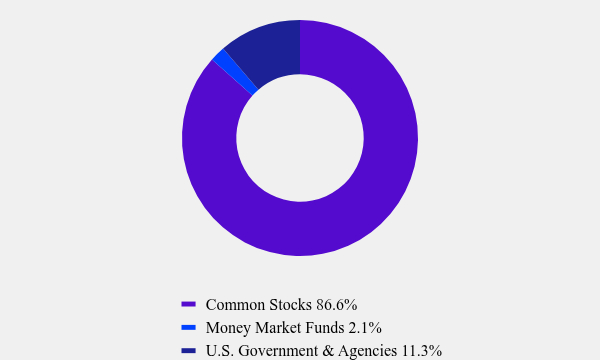
Common Stocks | 86.6% | Money Market Funds | 2.1% | U.S. Government & Agencies | 11.3% |
Sector Weighting (% of net assets)Value | Value |
|---|
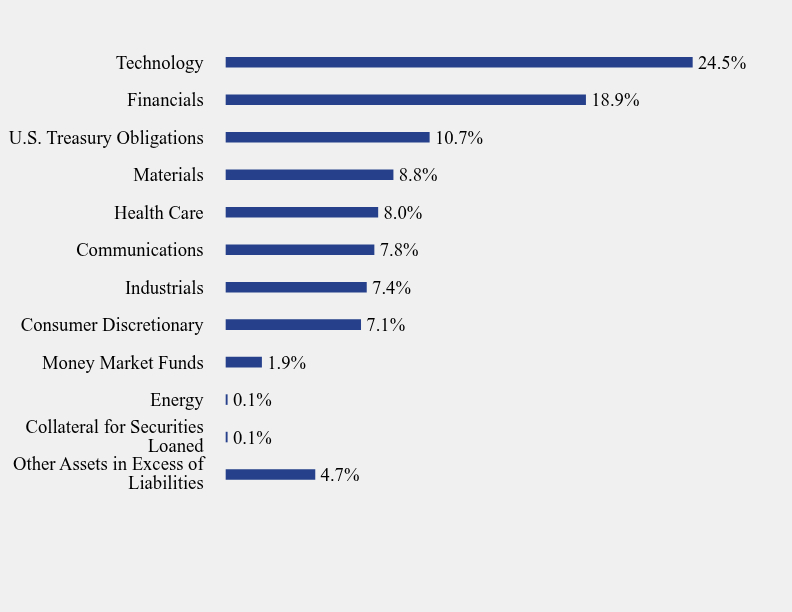
Other Assets in Excess of Liabilities | 4.7% | Collateral for Securities Loaned | 0.1% | Energy | 0.1% | Money Market Funds | 1.9% | Consumer Discretionary | 7.1% | Industrials | 7.4% | Communications | 7.8% | Health Care | 8.0% | Materials | 8.8% | U.S. Treasury Obligations | 10.7% | Financials | 18.9% | Technology | 24.5% |
Excludes investments in swaps. |
|
| Largest Holdings [Text Block] |
Top 10 Holdings (% of net assets)Holding Name | % of Net Assets |
|---|
LPL Financial Holdings, Inc. | 4.8% |
|---|
United States Treasury Bill | 4.7% |
|---|
United States Treasury Bill | 4.5% |
|---|
Mastercard, Inc., Class A | 4.5% |
|---|
GigaCloud Technology, Inc., Class A | 4.3% |
|---|
TransMedics Group, Inc. | 4.3% |
|---|
Comfort Systems USA, Inc. | 4.3% |
|---|
Arista Networks, Inc. | 4.0% |
|---|
Medpace Holdings, Inc. | 3.6% |
|---|
Uber Technologies, Inc. | 3.4% |
|---|
|
|
| Material Fund Change [Text Block] |
|
|
| C000102755 |
|
|
| Shareholder Report [Line Items] |
|
|
| Fund Name |
Catalyst Insider Buying Fund
|
|
| Class Name |
Class C
|
|
| Trading Symbol |
INSCX
|
|
| Annual or Semi-Annual Statement [Text Block] |
This semi-annual shareholder report contains important information about Catalyst Insider Buying Fund for the period of July 1, 2025 to December 31, 2025.
|
|
| Additional Information [Text Block] |
You can find additional information about the Fund at https://catalystmf.com/literature-and-forms/. You can also request this information by contacting us at 1-866-447-4228.
|
|
| Additional Information Phone Number |
1-866-447-4228
|
|
| Additional Information Website |
https://catalystmf.com/literature-and-forms/
|
|
| Expenses [Text Block] |
What were the Fund’s costs for the last six months?(based on a hypothetical $10,000 investment) Class Name | Costs of a $10,000 investment | Costs paid as a percentage of a $10,000 investment |
|---|
Class C | $116 | 2.28%Footnote Reference* |
|---|
| Footnote | Description | Footnote* | Annualized |
|
|
| Expenses Paid, Amount |
$ 116
|
|
| Expense Ratio, Percent |
2.28%
|
[8] |
| AssetsNet |
$ 18,643,329
|
|
| Holdings Count | Holding |
60
|
|
| Advisory Fees Paid, Amount |
$ 27,062
|
|
| InvestmentCompanyPortfolioTurnover |
44.00%
|
|
| Additional Fund Statistics [Text Block] |
Net Assets | $18,643,329 |
|---|
Number of Portfolio Holdings | 60 |
|---|
Advisory Fee (net of waivers) | $27,062 |
|---|
Portfolio Turnover | 44% |
|---|
|
|
| Holdings [Text Block] |
Asset Weighting (% of total investments)Value | Value |
|---|
Common Stocks | 86.6% | Money Market Funds | 2.1% | U.S. Government & Agencies | 11.3% |
Sector Weighting (% of net assets)Value | Value |
|---|
Other Assets in Excess of Liabilities | 4.7% | Collateral for Securities Loaned | 0.1% | Energy | 0.1% | Money Market Funds | 1.9% | Consumer Discretionary | 7.1% | Industrials | 7.4% | Communications | 7.8% | Health Care | 8.0% | Materials | 8.8% | U.S. Treasury Obligations | 10.7% | Financials | 18.9% | Technology | 24.5% |
Excludes investments in swaps. |
|
| Largest Holdings [Text Block] |
Top 10 Holdings (% of net assets)Holding Name | % of Net Assets |
|---|
LPL Financial Holdings, Inc. | 4.8% |
|---|
United States Treasury Bill | 4.7% |
|---|
United States Treasury Bill | 4.5% |
|---|
Mastercard, Inc., Class A | 4.5% |
|---|
GigaCloud Technology, Inc., Class A | 4.3% |
|---|
TransMedics Group, Inc. | 4.3% |
|---|
Comfort Systems USA, Inc. | 4.3% |
|---|
Arista Networks, Inc. | 4.0% |
|---|
Medpace Holdings, Inc. | 3.6% |
|---|
Uber Technologies, Inc. | 3.4% |
|---|
|
|
| Material Fund Change [Text Block] |
|
|
| C000142548 |
|
|
| Shareholder Report [Line Items] |
|
|
| Fund Name |
Catalyst Insider Buying Fund
|
|
| Class Name |
Class I
|
|
| Trading Symbol |
INSIX
|
|
| Annual or Semi-Annual Statement [Text Block] |
This semi-annual shareholder report contains important information about Catalyst Insider Buying Fund for the period of July 1, 2025 to December 31, 2025.
|
|
| Additional Information [Text Block] |
You can find additional information about the Fund at https://catalystmf.com/literature-and-forms/. You can also request this information by contacting us at 1-866-447-4228.
|
|
| Additional Information Phone Number |
1-866-447-4228
|
|
| Additional Information Website |
https://catalystmf.com/literature-and-forms/
|
|
| Expenses [Text Block] |
What were the Fund’s costs for the last six months?(based on a hypothetical $10,000 investment) Class Name | Costs of a $10,000 investment | Costs paid as a percentage of a $10,000 investment |
|---|
Class I | $66 | 1.28%Footnote Reference* |
|---|
| Footnote | Description | Footnote* | Annualized |
|
|
| Expenses Paid, Amount |
$ 66
|
|
| Expense Ratio, Percent |
1.28%
|
[9] |
| AssetsNet |
$ 18,643,329
|
|
| Holdings Count | Holding |
60
|
|
| Advisory Fees Paid, Amount |
$ 27,062
|
|
| InvestmentCompanyPortfolioTurnover |
44.00%
|
|
| Additional Fund Statistics [Text Block] |
Net Assets | $18,643,329 |
|---|
Number of Portfolio Holdings | 60 |
|---|
Advisory Fee (net of waivers) | $27,062 |
|---|
Portfolio Turnover | 44% |
|---|
|
|
| Holdings [Text Block] |
Asset Weighting (% of total investments)Value | Value |
|---|
Common Stocks | 86.6% | Money Market Funds | 2.1% | U.S. Government & Agencies | 11.3% |
Sector Weighting (% of net assets)Value | Value |
|---|
Other Assets in Excess of Liabilities | 4.7% | Collateral for Securities Loaned | 0.1% | Energy | 0.1% | Money Market Funds | 1.9% | Consumer Discretionary | 7.1% | Industrials | 7.4% | Communications | 7.8% | Health Care | 8.0% | Materials | 8.8% | U.S. Treasury Obligations | 10.7% | Financials | 18.9% | Technology | 24.5% |
Excludes investments in swaps. |
|
| Largest Holdings [Text Block] |
Top 10 Holdings (% of net assets)Holding Name | % of Net Assets |
|---|
LPL Financial Holdings, Inc. | 4.8% |
|---|
United States Treasury Bill | 4.7% |
|---|
United States Treasury Bill | 4.5% |
|---|
Mastercard, Inc., Class A | 4.5% |
|---|
GigaCloud Technology, Inc., Class A | 4.3% |
|---|
TransMedics Group, Inc. | 4.3% |
|---|
Comfort Systems USA, Inc. | 4.3% |
|---|
Arista Networks, Inc. | 4.0% |
|---|
Medpace Holdings, Inc. | 3.6% |
|---|
Uber Technologies, Inc. | 3.4% |
|---|
|
|
| Material Fund Change [Text Block] |
|
|
| C000111981 |
|
|
| Shareholder Report [Line Items] |
|
|
| Fund Name |
Catalyst/Lyons Tactical Allocation Fund
|
|
| Class Name |
Class A
|
|
| Trading Symbol |
CLTAX
|
|
| Annual or Semi-Annual Statement [Text Block] |
This semi-annual shareholder report contains important information about Catalyst/Lyons Tactical Allocation Fund for the period of July 1, 2025 to December 31, 2025.
|
|
| Additional Information [Text Block] |
You can find additional information about the Fund at https://catalystmf.com/literature-and-forms/. You can also request this information by contacting us at 1-866-447-4228.
|
|
| Additional Information Phone Number |
1-866-447-4228
|
|
| Additional Information Website |
https://catalystmf.com/literature-and-forms/
|
|
| Expenses [Text Block] |
What were the Fund’s costs for the last six months?(based on a hypothetical $10,000 investment) Class Name | Costs of a $10,000 investment | Costs paid as a percentage of a $10,000 investment |
|---|
Class A | $81 | 1.54%Footnote Reference* |
|---|
| Footnote | Description | Footnote* | Annualized |
|
|
| Expenses Paid, Amount |
$ 81
|
|
| Expense Ratio, Percent |
1.54%
|
[10] |
| AssetsNet |
$ 17,878,677
|
|
| Holdings Count | Holding |
26
|
|
| Advisory Fees Paid, Amount |
$ 35,378
|
|
| InvestmentCompanyPortfolioTurnover |
36.00%
|
|
| Additional Fund Statistics [Text Block] |
Net Assets | $17,878,677 |
|---|
Number of Portfolio Holdings | 26 |
|---|
Advisory Fee (net of waivers) | $35,378 |
|---|
Portfolio Turnover | 36% |
|---|
|
|
| Holdings [Text Block] |
Asset Weighting (% of total investments)Value | Value |
|---|
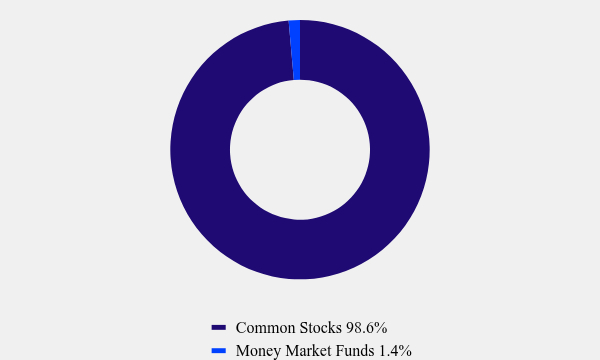
Common Stocks | 98.6% | Money Market Funds | 1.4% |
Sector Weighting (% of net assets)Value | Value |
|---|
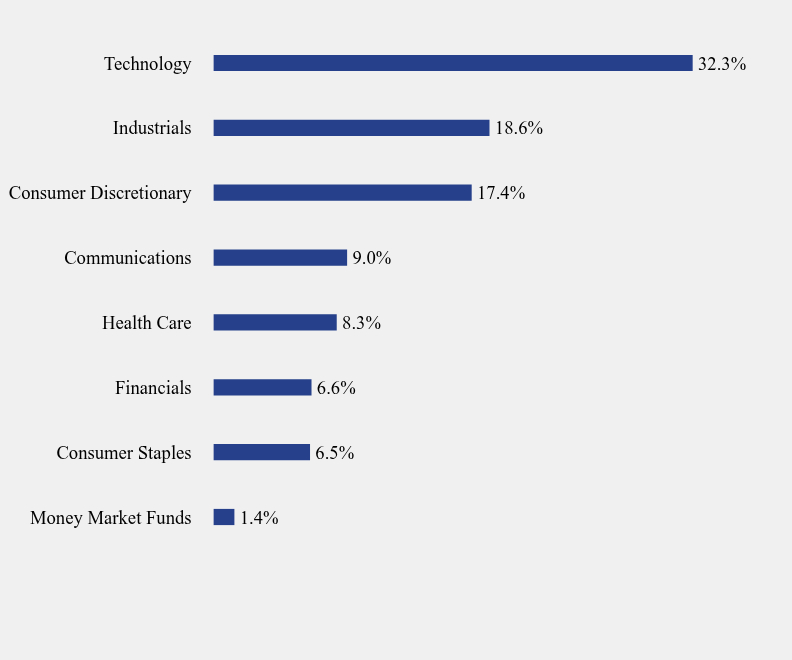
Money Market Funds | 1.4% | Consumer Staples | 6.5% | Financials | 6.6% | Health Care | 8.3% | Communications | 9.0% | Consumer Discretionary | 17.4% | Industrials | 18.6% | Technology | 32.3% |
|
|
| Largest Holdings [Text Block] |
Top 10 Holdings (% of net assets)Holding Name | % of Net Assets |
|---|
Microsoft Corporation | 5.2% |
|---|
Marriott International Inc, Class A | 5.2% |
|---|
KLA Corporation | 5.1% |
|---|
HCA Healthcare, Inc. | 5.0% |
|---|
Vertiv Holdings Company, Class A | 4.9% |
|---|
Apple, Inc. | 4.9% |
|---|
Meta Platforms, Inc., Class A | 4.6% |
|---|
AutoZone, Inc. | 4.6% |
|---|
Cadence Design Systems, Inc. | 4.4% |
|---|
Alphabet, Inc., Class A | 4.4% |
|---|
|
|
| Material Fund Change [Text Block] |
|
|
| C000111982 |
|
|
| Shareholder Report [Line Items] |
|
|
| Fund Name |
Catalyst/Lyons Tactical Allocation Fund
|
|
| Class Name |
Class C
|
|
| Trading Symbol |
CLTCX
|
|
| Annual or Semi-Annual Statement [Text Block] |
This semi-annual shareholder report contains important information about Catalyst/Lyons Tactical Allocation Fund for the period of July 1, 2025 to December 31, 2025.
|
|
| Additional Information [Text Block] |
You can find additional information about the Fund at https://catalystmf.com/literature-and-forms/. You can also request this information by contacting us at 1-866-447-4228.
|
|
| Additional Information Phone Number |
1-866-447-4228
|
|
| Additional Information Website |
https://catalystmf.com/literature-and-forms/
|
|
| Expenses [Text Block] |
What were the Fund’s costs for the last six months?(based on a hypothetical $10,000 investment) Class Name | Costs of a $10,000 investment | Costs paid as a percentage of a $10,000 investment |
|---|
Class C | $120 | 2.29%Footnote Reference* |
|---|
| Footnote | Description | Footnote* | Annualized |
|
|
| Expenses Paid, Amount |
$ 120
|
|
| Expense Ratio, Percent |
2.29%
|
[11] |
| AssetsNet |
$ 17,878,677
|
|
| Holdings Count | Holding |
26
|
|
| Advisory Fees Paid, Amount |
$ 35,378
|
|
| InvestmentCompanyPortfolioTurnover |
36.00%
|
|
| Additional Fund Statistics [Text Block] |
Net Assets | $17,878,677 |
|---|
Number of Portfolio Holdings | 26 |
|---|
Advisory Fee (net of waivers) | $35,378 |
|---|
Portfolio Turnover | 36% |
|---|
|
|
| Holdings [Text Block] |
Asset Weighting (% of total investments)Value | Value |
|---|
Common Stocks | 98.6% | Money Market Funds | 1.4% |
Sector Weighting (% of net assets)Value | Value |
|---|
Money Market Funds | 1.4% | Consumer Staples | 6.5% | Financials | 6.6% | Health Care | 8.3% | Communications | 9.0% | Consumer Discretionary | 17.4% | Industrials | 18.6% | Technology | 32.3% |
|
|
| Largest Holdings [Text Block] |
Top 10 Holdings (% of net assets)Holding Name | % of Net Assets |
|---|
Microsoft Corporation | 5.2% |
|---|
Marriott International Inc, Class A | 5.2% |
|---|
KLA Corporation | 5.1% |
|---|
HCA Healthcare, Inc. | 5.0% |
|---|
Vertiv Holdings Company, Class A | 4.9% |
|---|
Apple, Inc. | 4.9% |
|---|
Meta Platforms, Inc., Class A | 4.6% |
|---|
AutoZone, Inc. | 4.6% |
|---|
Cadence Design Systems, Inc. | 4.4% |
|---|
Alphabet, Inc., Class A | 4.4% |
|---|
|
|
| Material Fund Change [Text Block] |
|
|
| C000142553 |
|
|
| Shareholder Report [Line Items] |
|
|
| Fund Name |
Catalyst/Lyons Tactical Allocation Fund
|
|
| Class Name |
Class I
|
|
| Trading Symbol |
CLTIX
|
|
| Annual or Semi-Annual Statement [Text Block] |
This semi-annual shareholder report contains important information about Catalyst/Lyons Tactical Allocation Fund for the period of July 1, 2025 to December 31, 2025.
|
|
| Additional Information [Text Block] |
You can find additional information about the Fund at https://catalystmf.com/literature-and-forms/. You can also request this information by contacting us at 1-866-447-4228.
|
|
| Additional Information Phone Number |
1-866-447-4228
|
|
| Additional Information Website |
https://catalystmf.com/literature-and-forms/
|
|
| Expenses [Text Block] |
What were the Fund’s costs for the last six months?(based on a hypothetical $10,000 investment) Class Name | Costs of a $10,000 investment | Costs paid as a percentage of a $10,000 investment |
|---|
Class I | $68 | 1.29%Footnote Reference* |
|---|
| Footnote | Description | Footnote* | Annualized |
|
|
| Expenses Paid, Amount |
$ 68
|
|
| Expense Ratio, Percent |
1.29%
|
[12] |
| AssetsNet |
$ 17,878,677
|
|
| Holdings Count | Holding |
26
|
|
| Advisory Fees Paid, Amount |
$ 35,378
|
|
| InvestmentCompanyPortfolioTurnover |
36.00%
|
|
| Additional Fund Statistics [Text Block] |
Net Assets | $17,878,677 |
|---|
Number of Portfolio Holdings | 26 |
|---|
Advisory Fee (net of waivers) | $35,378 |
|---|
Portfolio Turnover | 36% |
|---|
|
|
| Holdings [Text Block] |
Asset Weighting (% of total investments)Value | Value |
|---|
Common Stocks | 98.6% | Money Market Funds | 1.4% |
Sector Weighting (% of net assets)Value | Value |
|---|
Money Market Funds | 1.4% | Consumer Staples | 6.5% | Financials | 6.6% | Health Care | 8.3% | Communications | 9.0% | Consumer Discretionary | 17.4% | Industrials | 18.6% | Technology | 32.3% |
|
|
| Largest Holdings [Text Block] |
Top 10 Holdings (% of net assets)Holding Name | % of Net Assets |
|---|
Microsoft Corporation | 5.2% |
|---|
Marriott International Inc, Class A | 5.2% |
|---|
KLA Corporation | 5.1% |
|---|
HCA Healthcare, Inc. | 5.0% |
|---|
Vertiv Holdings Company, Class A | 4.9% |
|---|
Apple, Inc. | 4.9% |
|---|
Meta Platforms, Inc., Class A | 4.6% |
|---|
AutoZone, Inc. | 4.6% |
|---|
Cadence Design Systems, Inc. | 4.4% |
|---|
Alphabet, Inc., Class A | 4.4% |
|---|
|
|
| Material Fund Change [Text Block] |
|
|
| C000102760 |
|
|
| Shareholder Report [Line Items] |
|
|
| Fund Name |
Catalyst/MAP Global Equity Fund
|
|
| Class Name |
Class A
|
|
| Trading Symbol |
CAXAX
|
|
| Annual or Semi-Annual Statement [Text Block] |
This semi-annual shareholder report contains important information about Catalyst/MAP Global Equity Fund for the period of July 1, 2025 to December 31, 2025.
|
|
| Additional Information [Text Block] |
You can find additional information about the Fund at https://catalystmf.com/literature-and-forms/. You can also request this information by contacting us at 1-866-447-4228.
|
|
| Additional Information Phone Number |
1-866-447-4228
|
|
| Additional Information Website |
https://catalystmf.com/literature-and-forms/
|
|
| Expenses [Text Block] |
What were the Fund’s costs for the last six months?(based on a hypothetical $10,000 investment) Class Name | Costs of a $10,000 investment | Costs paid as a percentage of a $10,000 investment |
|---|
Class A | $63 | 1.21%Footnote Reference* |
|---|
| Footnote | Description | Footnote* | Annualized |
|
|
| Expenses Paid, Amount |
$ 63
|
|
| Expense Ratio, Percent |
1.21%
|
[13] |
| AssetsNet |
$ 85,298,099
|
|
| Holdings Count | Holding |
53
|
|
| Advisory Fees Paid, Amount |
$ 275,842
|
|
| InvestmentCompanyPortfolioTurnover |
15.00%
|
|
| Additional Fund Statistics [Text Block] |
Net Assets | $85,298,099 |
|---|
Number of Portfolio Holdings | 53 |
|---|
Advisory Fee (net of waivers) | $275,842 |
|---|
Portfolio Turnover | 15% |
|---|
|
|
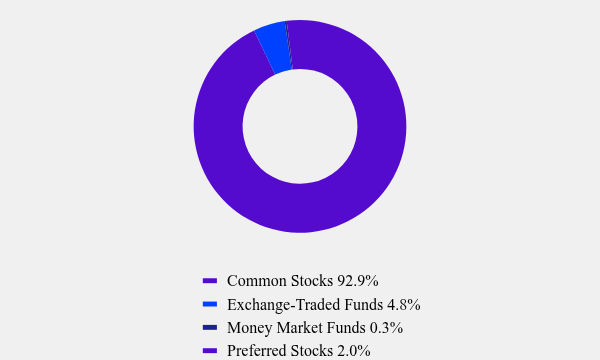
| Holdings [Text Block] |
Value | Value |
|---|
Common Stocks | 92.9% | Exchange-Traded Funds | 4.8% | Money Market Funds | 0.3% | Preferred Stocks | 2.0% |
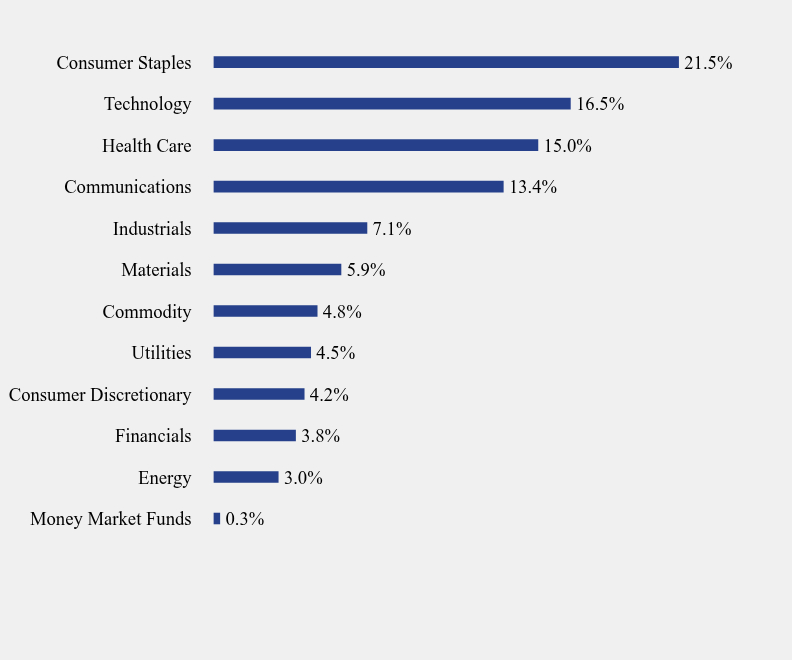
Sector Weighting (% of net assets)Value | Value |
|---|
Money Market Funds | 0.3% | Energy | 3.0% | Financials | 3.8% | Consumer Discretionary | 4.2% | Utilities | 4.5% | Commodity | 4.8% | Materials | 5.9% | Industrials | 7.1% | Communications | 13.4% | Health Care | 15.0% | Technology | 16.5% | Consumer Staples | 21.5% |
|
|
| Largest Holdings [Text Block] |
Top 10 Holdings (% of net assets)Holding Name | % of Net Assets |
|---|
SPDR Gold MiniShares Trust | 4.8% |
|---|
Cisco Systems, Inc. | 4.0% |
|---|
Microsoft Corporation | 4.0% |
|---|
Sanofi | 3.6% |
|---|
Novartis A.G. | 3.6% |
|---|
Nestle S.A. | 3.4% |
|---|
Medtronic PLC | 3.1% |
|---|
Takeda Pharmaceutical Company Ltd. | 3.1% |
|---|
Alphabet, Inc., Class C | 3.0% |
|---|
Chevron Corporation | 3.0% |
|---|
|
|
| Material Fund Change [Text Block] |
|
|
| C000102761 |
|
|
| Shareholder Report [Line Items] |
|
|
| Fund Name |
Catalyst/MAP Global Equity Fund
|
|
| Class Name |
Class C
|
|
| Trading Symbol |
CAXCX
|
|
| Annual or Semi-Annual Statement [Text Block] |
This semi-annual shareholder report contains important information about Catalyst/MAP Global Equity Fund for the period of July 1, 2025 to December 31, 2025.
|
|
| Additional Information [Text Block] |
You can find additional information about the Fund at https://catalystmf.com/literature-and-forms/. You can also request this information by contacting us at 1-866-447-4228.
|
|
| Additional Information Phone Number |
1-866-447-4228
|
|
| Additional Information Website |
https://catalystmf.com/literature-and-forms/
|
|
| Expenses [Text Block] |
What were the Fund’s costs for the last six months?(based on a hypothetical $10,000 investment) Class Name | Costs of a $10,000 investment | Costs paid as a percentage of a $10,000 investment |
|---|
Class C | $102 | 1.96%Footnote Reference* |
|---|
| Footnote | Description | Footnote* | Annualized |
|
|
| Expenses Paid, Amount |
$ 102
|
|
| Expense Ratio, Percent |
1.96%
|
[14] |
| AssetsNet |
$ 85,298,099
|
|
| Holdings Count | Holding |
53
|
|
| Advisory Fees Paid, Amount |
$ 275,842
|
|
| InvestmentCompanyPortfolioTurnover |
15.00%
|
|
| Additional Fund Statistics [Text Block] |
Net Assets | $85,298,099 |
|---|
Number of Portfolio Holdings | 53 |
|---|
Advisory Fee (net of waivers) | $275,842 |
|---|
Portfolio Turnover | 15% |
|---|
|
|
| Holdings [Text Block] |
Value | Value |
|---|
Common Stocks | 92.9% | Exchange-Traded Funds | 4.8% | Money Market Funds | 0.3% | Preferred Stocks | 2.0% |
Sector Weighting (% of net assets)Value | Value |
|---|
Money Market Funds | 0.3% | Energy | 3.0% | Financials | 3.8% | Consumer Discretionary | 4.2% | Utilities | 4.5% | Commodity | 4.8% | Materials | 5.9% | Industrials | 7.1% | Communications | 13.4% | Health Care | 15.0% | Technology | 16.5% | Consumer Staples | 21.5% |
|
|
| Largest Holdings [Text Block] |
Top 10 Holdings (% of net assets)Holding Name | % of Net Assets |
|---|
SPDR Gold MiniShares Trust | 4.8% |
|---|
Cisco Systems, Inc. | 4.0% |
|---|
Microsoft Corporation | 4.0% |
|---|
Sanofi | 3.6% |
|---|
Novartis A.G. | 3.6% |
|---|
Nestle S.A. | 3.4% |
|---|
Medtronic PLC | 3.1% |
|---|
Takeda Pharmaceutical Company Ltd. | 3.1% |
|---|
Alphabet, Inc., Class C | 3.0% |
|---|
Chevron Corporation | 3.0% |
|---|
|
|
| Material Fund Change [Text Block] |
|
|
| C000142550 |
|
|
| Shareholder Report [Line Items] |
|
|
| Fund Name |
Catalyst/MAP Global Equity Fund
|
|
| Class Name |
Class I
|
|
| Trading Symbol |
CAXIX
|
|
| Annual or Semi-Annual Statement [Text Block] |
This semi-annual shareholder report contains important information about Catalyst/MAP Global Equity Fund for the period of July 1, 2025 to December 31, 2025.
|
|
| Additional Information [Text Block] |
You can find additional information about the Fund at https://catalystmf.com/literature-and-forms/. You can also request this information by contacting us at 1-866-447-4228.
|
|
| Additional Information Phone Number |
1-866-447-4228
|
|
| Additional Information Website |
https://catalystmf.com/literature-and-forms/
|
|
| Expenses [Text Block] |
What were the Fund’s costs for the last six months?(based on a hypothetical $10,000 investment) Class Name | Costs of a $10,000 investment | Costs paid as a percentage of a $10,000 investment |
|---|
Class I | $50 | 0.96%Footnote Reference* |
|---|
| Footnote | Description | Footnote* | Annualized |
|
|
| Expenses Paid, Amount |
$ 50
|
|
| Expense Ratio, Percent |
0.96%
|
[15] |
| AssetsNet |
$ 85,298,099
|
|
| Holdings Count | Holding |
53
|
|
| Advisory Fees Paid, Amount |
$ 275,842
|
|
| InvestmentCompanyPortfolioTurnover |
15.00%
|
|
| Additional Fund Statistics [Text Block] |
Net Assets | $85,298,099 |
|---|
Number of Portfolio Holdings | 53 |
|---|
Advisory Fee (net of waivers) | $275,842 |
|---|
Portfolio Turnover | 15% |
|---|
|
|
| Holdings [Text Block] |
Value | Value |
|---|
Common Stocks | 92.9% | Exchange-Traded Funds | 4.8% | Money Market Funds | 0.3% | Preferred Stocks | 2.0% |
Sector Weighting (% of net assets)Value | Value |
|---|
Money Market Funds | 0.3% | Energy | 3.0% | Financials | 3.8% | Consumer Discretionary | 4.2% | Utilities | 4.5% | Commodity | 4.8% | Materials | 5.9% | Industrials | 7.1% | Communications | 13.4% | Health Care | 15.0% | Technology | 16.5% | Consumer Staples | 21.5% |
|
|
| Largest Holdings [Text Block] |
Top 10 Holdings (% of net assets)Holding Name | % of Net Assets |
|---|
SPDR Gold MiniShares Trust | 4.8% |
|---|
Cisco Systems, Inc. | 4.0% |
|---|
Microsoft Corporation | 4.0% |
|---|
Sanofi | 3.6% |
|---|
Novartis A.G. | 3.6% |
|---|
Nestle S.A. | 3.4% |
|---|
Medtronic PLC | 3.1% |
|---|
Takeda Pharmaceutical Company Ltd. | 3.1% |
|---|
Alphabet, Inc., Class C | 3.0% |
|---|
Chevron Corporation | 3.0% |
|---|
|
|
| Material Fund Change [Text Block] |
|
|
|
|