The following table sets forth compensation of our CEO (the Principal Executive Officer, referred to in this section as “PEO”) and our other named executive officers (the “Non-PEO NEOs”), on an average basis, along with total stockholder return, net income (loss), and total revenue for our fiscal years 2025, 2024, 2023, 2022, and 2021.
Value of Initial Fixed $100 Investment Based on: | ||||||||||||
Year (1) | Summary Compensation Table Total for Current PEO ($) | Compensation Actually Paid to Current PEO (2) | Summary Compensation Table Total for Former PEO ($) | Compensation Actually Paid to Former PEO (2) | Average Summary Compensation Table Total for Non-PEO NEOs | Average Compensation Actually Paid to Non-PEO NEOs (2) | Company Total Stockholder Return (3) | Peer Group Total Stockholder Return (3) | Net Income (Loss) | Total Revenue (4) | ||
2025 | 3,466,916 | 6,327,870 | — | — | 1,525,229 | 2,703,839 | 64.53 | 77.53 | 19,086 | 329,522 | ||
2024 | 2,476,841 | 2,815,831 | 2,630,335 | 797,435 | 1,140,558 | 1,296,343 | 38.12 | 78.05 | 16,960 | 292,984 | ||
2023 | — | — | 2,874,593 | 3,205,532 | 755,916 | 593,656 | 31.82 | 74.29 | 28,515 | 274,423 | ||
2022 | — | — | 3,220,584 | 1,851,324 | 1,166,401 | 768,103 | 25.55 | 79.00 | (17,866) | 246,785 | ||
2021 | — | — | 2,076,884 | 459,477 | 941,781 | 359,062 | 42.35 | 103.32 | (11,811) | 208,057 | ||
| (1) | Sheri L. Dodd was our PEO in 2025 and in 2024 starting on July 1, 2024, and Daniel L. Reuvers served as our PEO in 2024 through June 30, 2024 and in each of 2023, 2022 and 2021. In 2025, Elaine M. Birkemeyer and Kristie T. Burns were our Non-PEO NEOs. In 2024, Elaine M. Birkemeyer, Kristie T. Burns and Sherri L. Ferstler were our Non-PEO NEOs. In 2023, Elaine M. Birkemeyer, Kristie T. Burns, Sherri L. Ferstler and Brent A. Moen were our Non-PEO NEOs. In 2022 and 2021, Brent A. Moen, Kristie T. Burns and Eric Pauls were our Non-PEO NEOs. |
| (2) | The dollar amounts reported represent the Compensation Actually Paid (“CAP”) to the NEOs in accordance with, and using the adjustments set forth in, Item 402(v) of Regulation S-K. The following adjustments related to equity awards were made to their total compensation each year as reported in the Summary Compensation Table (“SCT”) to determine the CAP: |
Reconciliation of PEO Summary Compensation Table Total to Compensation Actually Paid
Year | Reported SCT Total | Equity Award Adjustments | Compensation Actually Paid |
2025 | 3,466,916 | 2,860,954 | 6,327,870 |
2024 (Current) | 2,476,841 | 338,990 | 2,815,831 |
2024 (Former) | 2,630,335 | (1,832,900) | 797,435 |
2023 | 2,874,593 | 330,939 | 3,205,532 |
2022 | 3,220,584 | (1,369,260) | 1,851,324 |
2021 | 2,076,884 | (1,617,407) | 459,477 |
Reconciliation of Average Non-PEO NEO Summary Compensation Table Total to Compensation Actually Paid
Year | Reported SCT Total | Equity Award Adjustments | Compensation Actually Paid |
2025 | 1,525,229 | 1,178,610 | 2,703,839 |
2024 | 1,140,558 | 155,785 | 1,296,343 |
2023 | 755,916 | (162,260) | 593,656 |
2022 | 1,166,401 | (398,298) | 768,103 |
2021 | 941,781 | (582,719) | 359,062 |
| (3) | Our peer group for the calculation of total stockholder return (“TSR”) is the S&P Healthcare Equipment Select Industry Index, which is the industry index used in our stock price performance graph in our Form 10-K for the fiscal year ended December 31, 2025. TSR, in the case of both the Company and our peer group, reflects the cumulative return on $100 as if invested on December 31, 2020, including reinvestment of any dividends. |
| (4) | Our company-selected measure, which we believe represents the most important financial performance measure (that is not otherwise required to be disclosed in the table) used by the Company to link CAP to the NEOs for 2025 to company performance, is revenue. Revenue is one of the metrics under both the 2025 annual cash incentive program and the 2025 PSUs. |
In order to calculate CAP, the following amounts were excluded from or added to the SCT total compensation:
Current PEO
Year | Deduct: Grant Date Fair Value of Covered Year Equity Awards | Year End Fair Value of Covered Year Equity Awards | Change in Fair Value at End of Covered Year from End of Prior Year of Equity Awards Granted in a Prior Year that were Unvested at End of Covered Year | Fair Value as of Vesting Date of Equity Awards Granted and Vested in the Covered Year | Change in Fair Value at Vesting Date from End of Prior Year of Equity Awards Granted in a Prior Year that Vested in the Covered Year | Fair Value at the End of the Prior Year of Equity Awards that Failed to Meet Vesting Conditions in the Covered Year | Value of Dividends or other Earnings Paid on Stock or Option Awards not Otherwise Reflected in Fair Value or Total Compensation | Total Equity Award Adjustments |
2025 | (2,019,978) | 3,808,802 | 1,252,095 | — | (179,965) | — | — | 2,860,954 |
2024 | (1,869,991) | 2,212,463 | — | — | (3,482) | — | — | 338,990 |
2023 | — | — | — | — | — | — | — | — |
2022 | — | — | — | — | — | — | — | — |
2021 | — | — | — | — | — | — | — | — |
Former PEO
Year | Deduct: Grant Date Fair Value of Covered Year Equity Awards | Year End Fair Value of Covered Year Equity Awards | Change in Fair Value at End of Covered Year from End of Prior Year of Equity Awards Granted in a Prior Year that were Unvested at End of Covered Year | Fair Value as of Vesting Date of Equity Awards Granted and Vested in the Covered Year | Change in Fair Value at Vesting Date from End of Prior Year of Equity Awards Granted in a Prior Year that Vested in the Covered Year | Fair Value at the End of the Prior Year of Equity Awards that Failed to Meet Vesting Conditions in the Covered Year | Value of Dividends or other Earnings Paid on Stock or Option Awards not Otherwise Reflected in Fair Value or Total Compensation | Total Equity Award Adjustments |
2025 | — | — | — | — | — | — | — | — |
2024 | (1,999,997) | 411,377 | 212,604 | — | 44,732 | (501,615) | — | (1,832,900) |
2023 | (1,506,836) | 1,406,539 | 249,724 | — | 181,513 | — | — | 330,939 |
2022 | (1,999,984) | 1,081,241 | (323,775) | — | (126,742) | — | — | (1,369,260) |
2021 | (1,499,930) | 598,713 | (382,129) | — | (334,060) | — | — | (1,617,407) |
Average Non-PEO NEOs
Year | Deduct: Grant Date Fair Value of Covered Year Equity Awards | Year End Fair Value of Covered Year Equity Awards | Change in Fair Value at End of Covered Year from End of Prior Year of Equity Awards Granted in a Prior Year that were Unvested at End of Covered Year | Fair Value as of Vesting Date of Equity Awards Granted and Vested in the Covered Year | Change in Fair Value at Vesting Date from End of Prior Year of Equity Awards Granted in a Prior Year that Vested in the Covered Year | Fair Value at the End of the Prior Year of Equity Awards that Failed to Meet Vesting Conditions in the Covered Year | Value of Dividends or other Earnings Paid on Stock or Option Awards not Otherwise Reflected in Fair Value or Total Compensation | Total Equity Award Adjustments |
2025 | (812,479) | 1,531,983 | 542,768 | — | (83,661) | — | — | 1,178,610 |
2024 | (566,651) | 657,780 | 63,848 | — | 807 | — | — | 155,785 |
2023 | (397,276) | 300,766 | 16,319 | — | 24,594 | (106,664) | — | (162,260) |
2022 | (599,979) | 333,793 | (104,006) | — | (28,107) | — | — | (398,298) |
2021 | (622,120) | 239,005 | (114,494) | - | (5,881) | (79,229) | — | (582,719) |
| (1) | Sheri L. Dodd was our PEO in 2025 and in 2024 starting on July 1, 2024, and Daniel L. Reuvers served as our PEO in 2024 through June 30, 2024 and in each of 2023, 2022 and 2021. In 2025, Elaine M. Birkemeyer and Kristie T. Burns were our Non-PEO NEOs. In 2024, Elaine M. Birkemeyer, Kristie T. Burns and Sherri L. Ferstler were our Non-PEO NEOs. In 2023, Elaine M. Birkemeyer, Kristie T. Burns, Sherri L. Ferstler and Brent A. Moen were our Non-PEO NEOs. In 2022 and 2021, Brent A. Moen, Kristie T. Burns and Eric Pauls were our Non-PEO NEOs. |
| (3) | Our peer group for the calculation of total stockholder return (“TSR”) is the S&P Healthcare Equipment Select Industry Index, which is the industry index used in our stock price performance graph in our Form 10-K for the fiscal year ended December 31, 2025. TSR, in the case of both the Company and our peer group, reflects the cumulative return on $100 as if invested on December 31, 2020, including reinvestment of any dividends. |
Reconciliation of PEO Summary Compensation Table Total to Compensation Actually Paid
Year | Reported SCT Total | Equity Award Adjustments | Compensation Actually Paid |
2025 | 3,466,916 | 2,860,954 | 6,327,870 |
2024 (Current) | 2,476,841 | 338,990 | 2,815,831 |
2024 (Former) | 2,630,335 | (1,832,900) | 797,435 |
2023 | 2,874,593 | 330,939 | 3,205,532 |
2022 | 3,220,584 | (1,369,260) | 1,851,324 |
2021 | 2,076,884 | (1,617,407) | 459,477 |
Year | Deduct: Grant Date Fair Value of Covered Year Equity Awards | Year End Fair Value of Covered Year Equity Awards | Change in Fair Value at End of Covered Year from End of Prior Year of Equity Awards Granted in a Prior Year that were Unvested at End of Covered Year | Fair Value as of Vesting Date of Equity Awards Granted and Vested in the Covered Year | Change in Fair Value at Vesting Date from End of Prior Year of Equity Awards Granted in a Prior Year that Vested in the Covered Year | Fair Value at the End of the Prior Year of Equity Awards that Failed to Meet Vesting Conditions in the Covered Year | Value of Dividends or other Earnings Paid on Stock or Option Awards not Otherwise Reflected in Fair Value or Total Compensation | Total Equity Award Adjustments |
2025 | (2,019,978) | 3,808,802 | 1,252,095 | — | (179,965) | — | — | 2,860,954 |
2024 | (1,869,991) | 2,212,463 | — | — | (3,482) | — | — | 338,990 |
2023 | — | — | — | — | — | — | — | — |
2022 | — | — | — | — | — | — | — | — |
2021 | — | — | — | — | — | — | — | — |
Former PEO
Year | Deduct: Grant Date Fair Value of Covered Year Equity Awards | Year End Fair Value of Covered Year Equity Awards | Change in Fair Value at End of Covered Year from End of Prior Year of Equity Awards Granted in a Prior Year that were Unvested at End of Covered Year | Fair Value as of Vesting Date of Equity Awards Granted and Vested in the Covered Year | Change in Fair Value at Vesting Date from End of Prior Year of Equity Awards Granted in a Prior Year that Vested in the Covered Year | Fair Value at the End of the Prior Year of Equity Awards that Failed to Meet Vesting Conditions in the Covered Year | Value of Dividends or other Earnings Paid on Stock or Option Awards not Otherwise Reflected in Fair Value or Total Compensation | Total Equity Award Adjustments |
2025 | — | — | — | — | — | — | — | — |
2024 | (1,999,997) | 411,377 | 212,604 | — | 44,732 | (501,615) | — | (1,832,900) |
2023 | (1,506,836) | 1,406,539 | 249,724 | — | 181,513 | — | — | 330,939 |
2022 | (1,999,984) | 1,081,241 | (323,775) | — | (126,742) | — | — | (1,369,260) |
2021 | (1,499,930) | 598,713 | (382,129) | — | (334,060) | — | — | (1,617,407) |
Reconciliation of Average Non-PEO NEO Summary Compensation Table Total to Compensation Actually Paid
Year | Reported SCT Total | Equity Award Adjustments | Compensation Actually Paid |
2025 | 1,525,229 | 1,178,610 | 2,703,839 |
2024 | 1,140,558 | 155,785 | 1,296,343 |
2023 | 755,916 | (162,260) | 593,656 |
2022 | 1,166,401 | (398,298) | 768,103 |
2021 | 941,781 | (582,719) | 359,062 |
Average Non-PEO NEOs
Year | Deduct: Grant Date Fair Value of Covered Year Equity Awards | Year End Fair Value of Covered Year Equity Awards | Change in Fair Value at End of Covered Year from End of Prior Year of Equity Awards Granted in a Prior Year that were Unvested at End of Covered Year | Fair Value as of Vesting Date of Equity Awards Granted and Vested in the Covered Year | Change in Fair Value at Vesting Date from End of Prior Year of Equity Awards Granted in a Prior Year that Vested in the Covered Year | Fair Value at the End of the Prior Year of Equity Awards that Failed to Meet Vesting Conditions in the Covered Year | Value of Dividends or other Earnings Paid on Stock or Option Awards not Otherwise Reflected in Fair Value or Total Compensation | Total Equity Award Adjustments |
2025 | (812,479) | 1,531,983 | 542,768 | — | (83,661) | — | — | 1,178,610 |
2024 | (566,651) | 657,780 | 63,848 | — | 807 | — | — | 155,785 |
2023 | (397,276) | 300,766 | 16,319 | — | 24,594 | (106,664) | — | (162,260) |
2022 | (599,979) | 333,793 | (104,006) | — | (28,107) | — | — | (398,298) |
2021 | (622,120) | 239,005 | (114,494) | - | (5,881) | (79,229) | — | (582,719) |
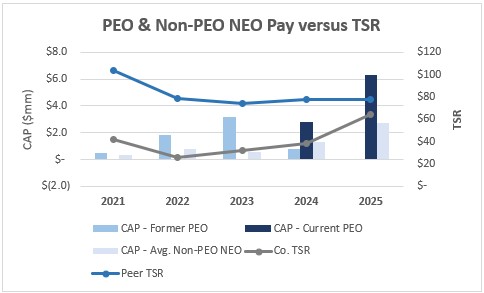
Compensation Actually Paid versus Company and Peer Group TSR:
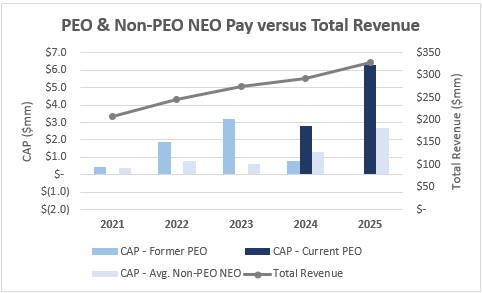
Compensation Actually Paid versus Total Revenue:
Most Important Company Performance Measures |
Total Revenue |
Adjusted EBITDA |
Adjusted EBITDA Margin |
| (4) | Our company-selected measure, which we believe represents the most important financial performance measure (that is not otherwise required to be disclosed in the table) used by the Company to link CAP to the NEOs for 2025 to company performance, is revenue. Revenue is one of the metrics under both the 2025 annual cash incentive program and the 2025 PSUs. |