Shareholder Report
Dec. 31, 2025
USD ($)
$ / shares
WHAT WERE THE FUND COSTS FOR THE PAST YEAR? (based on a hypothetical $10,000 investment)
|
Fund Name
|
Costs of a $10,000 investment
|
Costs paid as a percentage of a $10,000 investment
|
|
Evercore Equity Fund
|
$95
|
0.90%
|
HOW DID THE FUND PERFORM LAST YEAR AND WHAT AFFECTED ITS PERFORMANCE?
The Evercore Equity Fund (EWMCX) gained 11.22% in 2025 while the S&P 500 gained 17.88%. The year was marked by significant volatility related to tariffs in the Spring and then steady gains throughout the rest of the year. The year 2025 was the second year in a row of solid positive returns but that the fund had relative underperformance to the S&P 500.
During 2024, much of the fund’s relative underperformance was due to underweight positions to the “Magnificent 7” (Alphabet, Amazon, Apple, Meta, Microsoft, Nvidia and Tesla) which powered the market. In 2025, the best performing sectors of the stock market were related to momentum and unprofitable technology stocks while one of the worst performing sectors were “Quality” companies as defined by high returns on invested capital (ROIC) and good free cash flow (FCF). We have historically eschewed the former and embraced the latter which negatively impacted performance. In addition, we made several decisions -both of omission and commission - that hurt our absolute and relative performance.
In 2024 we purchased Novo Nordisk and Fiserv. Our investment thesis for each of these companies quickly unraveled. We sold both at considerable losses in 2025. Our acts of omission were holding for too long stocks that had performed well but had significant challenges. Both United Health and Celanese were sold in 2025 at large gains from original purchase but down close to 50% from relatively recent highs.
In response to the changing market dynamics and our relative underperformance, we made a number of changes to the fund. During the year our turnover was higher than in any of the last ten years. Overall, we sold eleven holdings and added five in addition to other adds and trims to existing positions. Throughout this process, we were true to our investment philosophy and were careful to maintain our investment discipline. We believe that the portfolio is well positioned for the current environment.
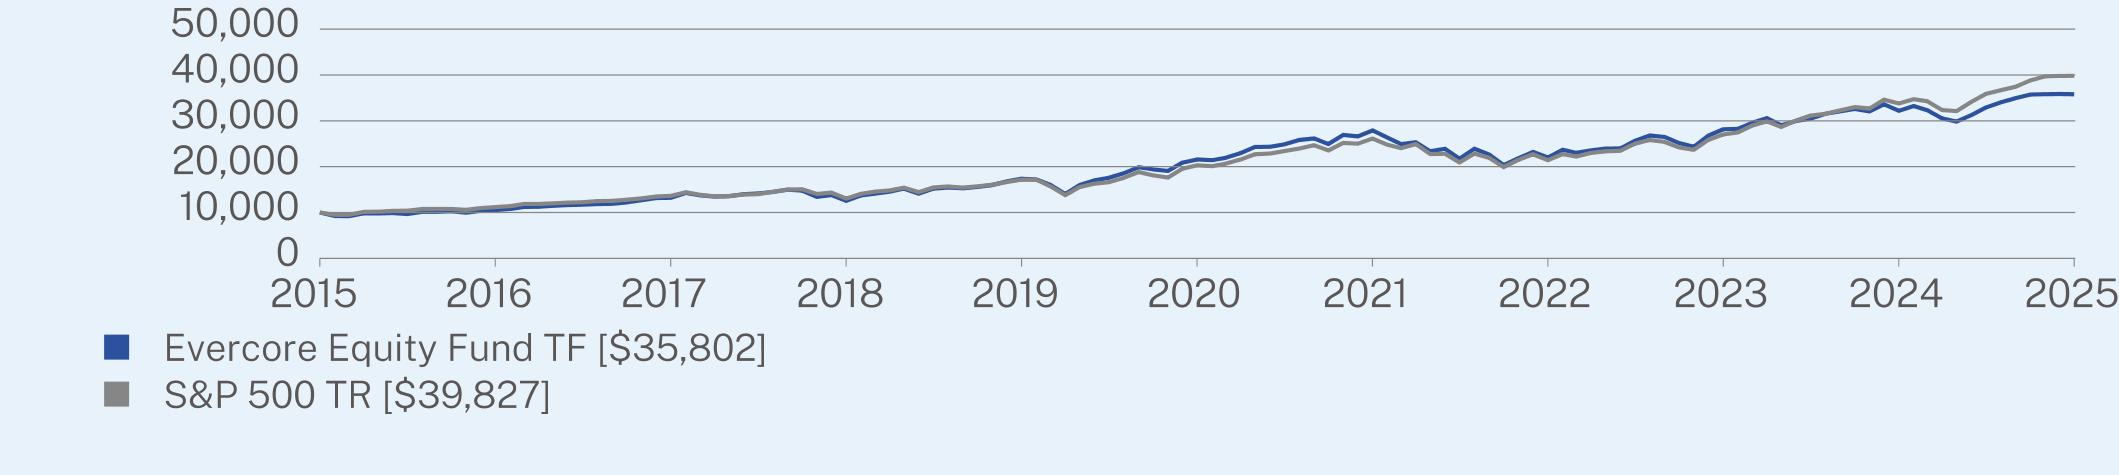
ANNUAL AVERAGE TOTAL RETURN (%)
|
|
1 Year
|
5 Year
|
10 Year
|
|
TF (without sales charge)
|
11.22
|
10.66
|
13.60
|
|
S&P 500 TR
|
17.88
|
14.42
|
14.82
|
Visit http://www.evercoreequityfund.com for more recent performance information.
KEY FUND STATISTICS (as of December 31, 2025)
|
Net Assets
|
$505,905,379
|
|
Number of Holdings
|
31
|
|
Net Advisory Fee
|
$3,647,603
|
|
Portfolio Turnover
|
17%
|
WHAT DID THE FUND INVEST IN? (as of December 31, 2025)
|
Top Sectors
|
(%) of net assets
|
|
Financials
|
23.8%
|
|
Information Technology
|
23.1%
|
|
Consumer Discretionary
|
19.5%
|
|
Industrials
|
9.8%
|
|
Communication Services
|
9.3%
|
|
Energy
|
5.4%
|
|
Real Estate
|
4.6%
|
|
Health Care
|
3.1%
|
|
Cash & Other
|
1.4%
|
|
Top 10 Issuers
|
(%) of net assets
|
|
Alphabet, Inc.
|
9.3%
|
|
NVIDIA Corp.
|
9.0%
|
|
Microsoft Corp.
|
5.8%
|
|
Apple, Inc.
|
5.0%
|
|
Morgan Stanley
|
4.9%
|
|
Amazon.com, Inc.
|
4.5%
|
|
JPMorgan Chase & Co.
|
4.2%
|
|
Comfort Systems USA, Inc.
|
4.2%
|
|
Mastercard, Inc.
|
4.1%
|
|
Viking Holdings Ltd.
|
3.9%
|