Pay vs Performance Disclosure - USD ($)
Dec. 31, 2025
Dec. 31, 2024
Dec. 31, 2023
Dec. 31, 2022
Dec. 31, 2021
Year |
Summary Compensation Table Total for René F. Jones 1 ($) |
Compensation Actually Paid to René F. Jones 1,2,3 ($) |
Average Summary Compensation Table Total for Non-PEO NEOs 1 ($) |
Average Compensation Actually Paid to Non-PEO NEOs 1,2,3 ($) |
Value of Initial Fixed $100 Investment based on: 4 |
Net Income ($ Millions) |
Return on Tangible Common Equity 5 | |||||||||||||||||||||||||||||||||
TSR ($) |
Peer Group TSR ($) | |||||||||||||||||||||||||||||||||||||||
2025 |
12,015,250 | 14,887,642 | 4,444,338 | 5,321,898 | 185.53 | 196.00 | 2,851 | 15.4% | ||||||||||||||||||||||||||||||||
2024 |
10,265,583 | 13,936,847 | 4,223,909 | 5,391,208 | 168.01 | 147.85 | 2,588 | 14.5% | ||||||||||||||||||||||||||||||||
2023 |
9,385,557 | 9,677,118 | 3,852,702 | 3,883,837 | 118.57 | 107.76 | 2,741 | 17.6% | ||||||||||||||||||||||||||||||||
2022 |
8,815,707 | 8,747,318 | 4,052,188 | 4,106,681 | 120.58 | 108.73 | 1,992 | 16.7% | ||||||||||||||||||||||||||||||||
2021 |
6,868,174 | 9,143,656 | 3,554,911 | 4,583,251 | 124.29 | 138.33 | 1,859 | 16.8% | ||||||||||||||||||||||||||||||||
| 1. | Mr. Jones was our PEO for each year presented. The individuals comprising the Non-PEO NEOs for each year presented are listed below. |
2021 |
2022 |
2023 |
2024 |
2025 | ||||
| Darren J. King | Darren J. King | Daryl Bible | Daryl Bible | Daryl Bible | ||||
| Richard S. Gold | Richard S. Gold | Darren J. King | Kevin J. Pearson | Kevin J. Pearson | ||||
| Kevin J. Pearson | Kevin J. Pearson | Kevin J. Pearson | Christopher E. Kay | Christopher E. Kay | ||||
| Doris P. Meister | Christopher E. Kay | Christopher E. Kay | Mike Todaro | Peter D’Arcy | ||||
| Doris P. Meister | ||||||||
| 2. | The amounts shown for Compensation Actually Paid have been calculated in accordance with Item 402(v) of Regulation S-K and do not reflect compensation actually earned, realized, or received by the company’s NEOs. These amounts reflect the “Total” column of the Summary Compensation Table with certain adjustments as described in footnote 3 below. |
| 3. | Compensation Actually Paid reflects the exclusions and inclusions of certain amounts for the PEO and the other NEOs as set forth below. Equity values are calculated in accordance with FASB ASC Topic 718 and valuation assumptions do not differ materially from those disclosed as of the grant date of the equity awards. Amounts in the Exclusion of Stock Awards and Option Awards column are the totals from the Stock Awards and Option Awards columns set forth in the Summary Compensation Table. Amounts in the Exclusion of Change in Pension Value column reflect the amounts attributable to the Change in Pension Value reported in the Summary Compensation Table. Amounts in the Inclusion of Pension Service Cost are based on the service cost for services rendered during the listed year. |
Year |
Summary Compensation Table Total for René F. Jones ($) |
Exclusion of Change in Pension Value for René F. Jones ($) |
Exclusion of Stock Awards and Option Awards for René F. Jones ($) |
Inclusion of Pension Service Cost for René F. Jones ($) |
Inclusion of Equity Values for René F. Jones ($) |
Compensation Actually Paid to René F. Jones ($) | ||||||||||||||||||||||||
2025 |
12,015,250 | — | (7,400,262) | — | 10,272,654 | 14,887,642 | ||||||||||||||||||||||||
Year |
Average Summary Compensation Table Total for Non-PEO NEOs ($) |
Average Exclusion of Change in Pension Value for Non-PEO NEOs ($) |
Average Exclusion of Stock Awards and Option Awards for Non-PEO NEOs ($) |
Average Inclusion of Pension Service Cost for Non-PEO NEOs ($) |
Average Inclusion of Equity Values for Non-PEO NEOs ($) |
Average Compensation Actually Paid to Non-PEO NEOs ($) | ||||||||||||||||||||||||
2025 |
4,444,338 | — | (2,051,519) | — | 2,929,079 | 5,321,898 | ||||||||||||||||||||||||
The amounts in the Inclusion of Equity Values in the tables above are derived from the amounts set forth in the following tables:
Year |
Year-End FairValue of Equity Awards Granted During Year That Remained Unvested as of Last Day of Year for René F. Jones ($) |
Change in Fair Value from Last Day of Prior Year to Last Day of Year of Unvested Equity Awards for René F. Jones ($) |
Vesting-Date Fair Value of Equity Awards Granted During Year that Vested During Year for René F. Jones ($) |
Change in Fair Value from Last Day of Prior Year to Vesting Date of Unvested Equity Awards that Vested During Year for René F. Jones ($) |
Fair Value at Last Day of Prior Year of Equity Awards Forfeited During Year for René F. Jones ($) |
Value of Dividends or Other Earnings Paid on Equity Awards Not Otherwise Included for René F. Jones ($) |
Total - Inclusion of Equity Values for René F. Jones ($) | ||||||||||||||||||||||||||||
2025 |
8,244,620 | 1,746,107 | — | 281,927 | — | — | 10,272,654 | ||||||||||||||||||||||||||||
Year |
Average Year-End FairValue of Equity Awards Granted During Year That Remained Unvested as of Last Day of Year for Non- PEO NEOs ($) |
Average Change in Fair Value from Last Day of Prior Year to Last Day of Year of Unvested Equity Awards for Non-PEO NEOs($) |
Average Vesting-Date Fair Value of Equity Awards Granted During Year that Vested During Year for Non- PEO NEOs ($) |
Average Change in Fair Value from Last Day of Prior Year to Vesting Date of Unvested Equity Awards that Vested During Year for Non-PEO NEOs ($) |
Average Fair Value at Last Day of Prior Year of Equity Awards Forfeited During Year for Non-PEO NEOs ($) |
Average Value of Dividends or Other Earnings Paid on Equity Awards Not Otherwise Included for Non-PEO NEOs($) |
Total - Average Inclusion of Equity Values for Non-PEO NEOs ($) | ||||||||||||||||||||||||||||
2025 |
2,283,985 | 549,292 | — | 95,802 | — | — | 2,929,079 | ||||||||||||||||||||||||||||
| 4. | The Peer Group TSR set forth in this table utilizes the KBW NASDAQ Bank Index (assuming reinvestment of all dividends), which we also utilize in the stock performance graph required by Item 201(e) of Regulation S-K included in M&T’s 2025 Form 10-K. The comparison assumes $100 was invested for the period starting December 31, 2020, through the end of the listed year in the company and in the KBW NASDAQ Bank Index, respectively, and assumes reinvestment of all dividends. Historical stock performance is not necessarily indicative of future stock performance. |
| 5. | We determined Return on Tangible Common Equity (ROTCE) to be the most important financial performance measure used to link company performance to Compensation Actually Paid to our PEO and Non-PEO NEOs in 2021, 2022, 2023, 2024 and 2025. ROTCE is computed by dividing net operating income available to common equity by average tangible common equity. Net operating income available to common equity is computed by taking net income available to common equity and adding back the after-tax effect of the amortization of core deposit and other intangible assets, adding back the after-tax effects of merger-related expenses, and subtracting the after-tax effects of merger-related gains. Average tangible common equity is computed by taking average common equity for the applicable period and subtracting average goodwill and average core deposit and other intangible assets (net of any related average deferred tax amounts). The C&HC Committee and management use these non-GAAP financial measures as they believe they better reflect the impact of acquisition activity in reported results. See Appendix A for a reconciliation of GAAP financial measures to these corresponding non-GAAP financial measures. |
| 1. | Mr. Jones was our PEO for each year presented. The individuals comprising the Non-PEO NEOs for each year presented are listed below. |
2021 |
2022 |
2023 |
2024 |
2025 | ||||
| Darren J. King | Darren J. King | Daryl Bible | Daryl Bible | Daryl Bible | ||||
| Richard S. Gold | Richard S. Gold | Darren J. King | Kevin J. Pearson | Kevin J. Pearson | ||||
| Kevin J. Pearson | Kevin J. Pearson | Kevin J. Pearson | Christopher E. Kay | Christopher E. Kay | ||||
| Doris P. Meister | Christopher E. Kay | Christopher E. Kay | Mike Todaro | Peter D’Arcy | ||||
| Doris P. Meister | ||||||||
| 4. | The Peer Group TSR set forth in this table utilizes the KBW NASDAQ Bank Index (assuming reinvestment of all dividends), which we also utilize in the stock performance graph required by Item 201(e) of Regulation S-K included in M&T’s 2025 Form 10-K. The comparison assumes $100 was invested for the period starting December 31, 2020, through the end of the listed year in the company and in the KBW NASDAQ Bank Index, respectively, and assumes reinvestment of all dividends. Historical stock performance is not necessarily indicative of future stock performance. |
| 3. | Compensation Actually Paid reflects the exclusions and inclusions of certain amounts for the PEO and the other NEOs as set forth below. Equity values are calculated in accordance with FASB ASC Topic 718 and valuation assumptions do not differ materially from those disclosed as of the grant date of the equity awards. Amounts in the Exclusion of Stock Awards and Option Awards column are the totals from the Stock Awards and Option Awards columns set forth in the Summary Compensation Table. Amounts in the Exclusion of Change in Pension Value column reflect the amounts attributable to the Change in Pension Value reported in the Summary Compensation Table. Amounts in the Inclusion of Pension Service Cost are based on the service cost for services rendered during the listed year. |
Year |
Summary Compensation Table Total for René F. Jones ($) |
Exclusion of Change in Pension Value for René F. Jones ($) |
Exclusion of Stock Awards and Option Awards for René F. Jones ($) |
Inclusion of Pension Service Cost for René F. Jones ($) |
Inclusion of Equity Values for René F. Jones ($) |
Compensation Actually Paid to René F. Jones ($) | ||||||||||||||||||||||||
2025 |
12,015,250 | — | (7,400,262) | — | 10,272,654 | 14,887,642 | ||||||||||||||||||||||||
Year |
Average Summary Compensation Table Total for Non-PEO NEOs ($) |
Average Exclusion of Change in Pension Value for Non-PEO NEOs ($) |
Average Exclusion of Stock Awards and Option Awards for Non-PEO NEOs ($) |
Average Inclusion of Pension Service Cost for Non-PEO NEOs ($) |
Average Inclusion of Equity Values for Non-PEO NEOs ($) |
Average Compensation Actually Paid to Non-PEO NEOs ($) | ||||||||||||||||||||||||
2025 |
4,444,338 | — | (2,051,519) | — | 2,929,079 | 5,321,898 | ||||||||||||||||||||||||
The amounts in the Inclusion of Equity Values in the tables above are derived from the amounts set forth in the following tables:
Year |
Year-End FairValue of Equity Awards Granted During Year That Remained Unvested as of Last Day of Year for René F. Jones ($) |
Change in Fair Value from Last Day of Prior Year to Last Day of Year of Unvested Equity Awards for René F. Jones ($) |
Vesting-Date Fair Value of Equity Awards Granted During Year that Vested During Year for René F. Jones ($) |
Change in Fair Value from Last Day of Prior Year to Vesting Date of Unvested Equity Awards that Vested During Year for René F. Jones ($) |
Fair Value at Last Day of Prior Year of Equity Awards Forfeited During Year for René F. Jones ($) |
Value of Dividends or Other Earnings Paid on Equity Awards Not Otherwise Included for René F. Jones ($) |
Total - Inclusion of Equity Values for René F. Jones ($) | ||||||||||||||||||||||||||||
2025 |
8,244,620 | 1,746,107 | — | 281,927 | — | — | 10,272,654 | ||||||||||||||||||||||||||||
Year |
Average Year-End FairValue of Equity Awards Granted During Year That Remained Unvested as of Last Day of Year for Non- PEO NEOs ($) |
Average Change in Fair Value from Last Day of Prior Year to Last Day of Year of Unvested Equity Awards for Non-PEO NEOs($) |
Average Vesting-Date Fair Value of Equity Awards Granted During Year that Vested During Year for Non- PEO NEOs ($) |
Average Change in Fair Value from Last Day of Prior Year to Vesting Date of Unvested Equity Awards that Vested During Year for Non-PEO NEOs ($) |
Average Fair Value at Last Day of Prior Year of Equity Awards Forfeited During Year for Non-PEO NEOs ($) |
Average Value of Dividends or Other Earnings Paid on Equity Awards Not Otherwise Included for Non-PEO NEOs($) |
Total - Average Inclusion of Equity Values for Non-PEO NEOs ($) | ||||||||||||||||||||||||||||
2025 |
2,283,985 | 549,292 | — | 95,802 | — | — | 2,929,079 | ||||||||||||||||||||||||||||
Relationship Between PEO and
Non-PEO
NEOs Compensation Actually Paid and Company Total Shareholder Return (“TSR”) The following chart sets forth the relationship between Compensation Actually Paid to our PEO, the average of Compensation Actually Paid to our
Non-PEO
NEOs, the Company’s cumulative TSR, and of the KBW NASDAQ Bank Index over the five most recently completed fiscal years. 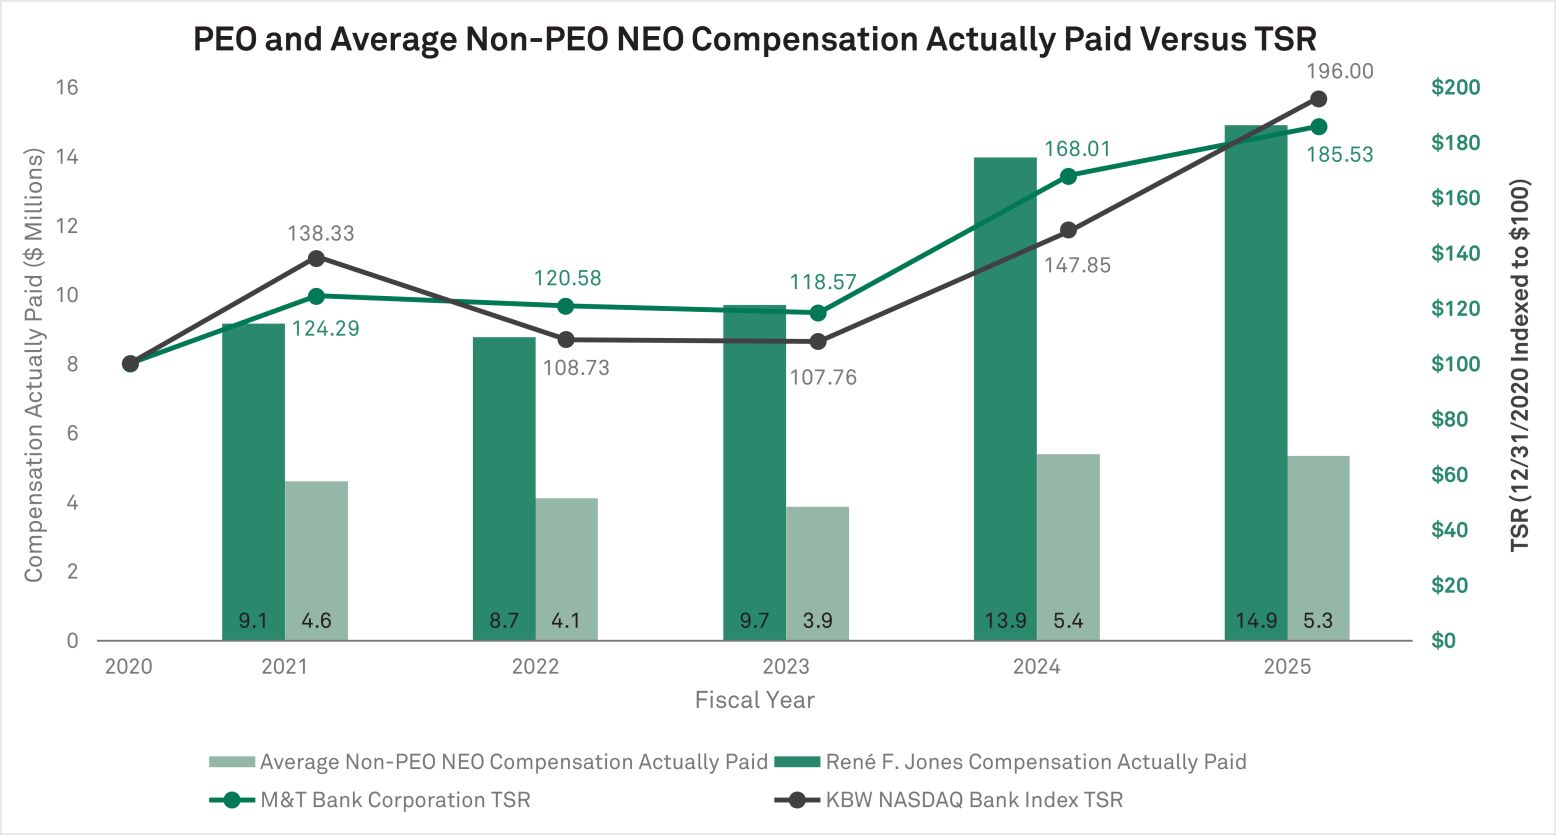
Relationship Between PEO and
Non-PEO
NEOs Compensation Actually Paid and Net Income The following chart sets forth the relationship between Compensation Actually Paid to our PEO, the average of Compensation Actually Paid to our
Non-PEO
NEOs, and our net income during the five most recently completed fiscal years. 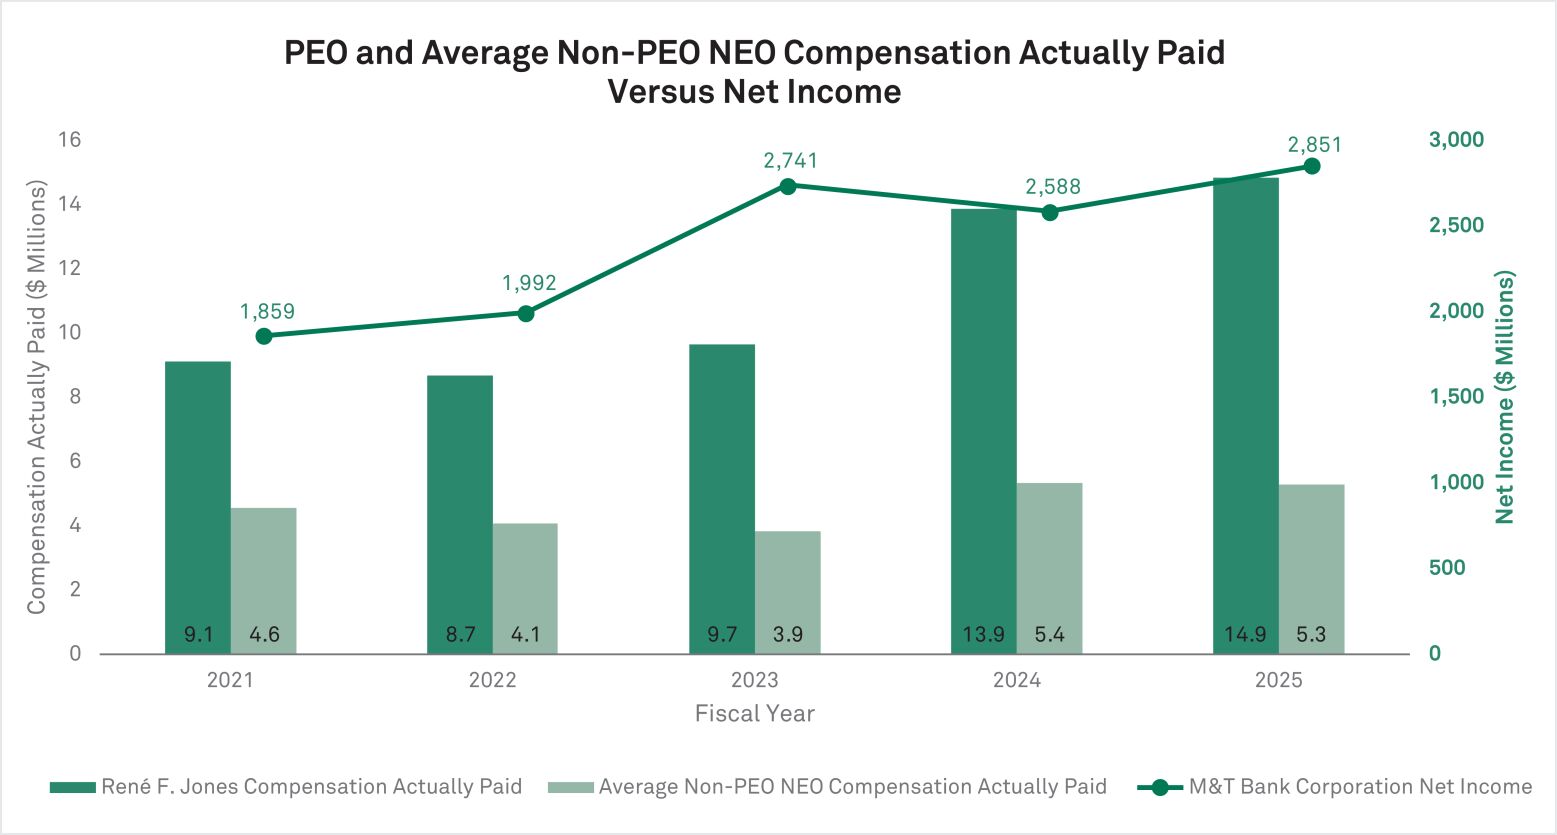
Relationship Between PEO and
Non-PEO
NEOs Compensation Actually Paid and Return on Tangible Common Equity The following chart sets forth the relationship between Compensation Actually Paid to our PEO, the average of Compensation Actually Paid to our
Non-PEO
NEOs, and our ROTCE during the five most recently completed fiscal years. See Appendix A for a reconciliation of ROTCE, a non-GAAP
financial measure to its most directly comparable GAAP measure for 2023, 2024 and 2025. 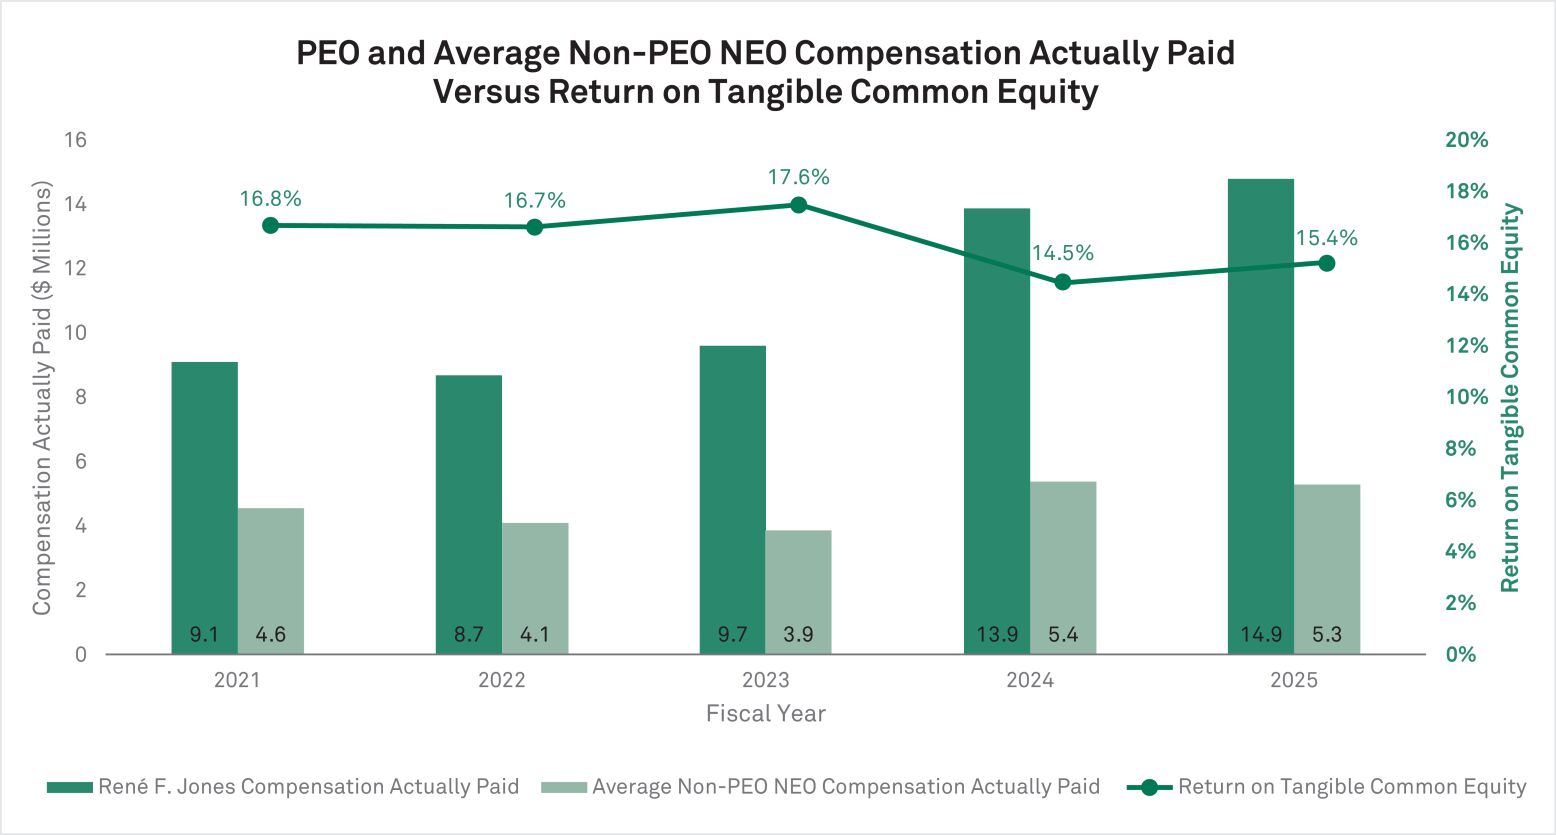
Relationship Between PEO and
Non-PEO
NEOs Compensation Actually Paid and Company Total Shareholder Return (“TSR”) The following chart sets forth the relationship between Compensation Actually Paid to our PEO, the average of Compensation Actually Paid to our
Non-PEO
NEOs, the Company’s cumulative TSR, and of the KBW NASDAQ Bank Index over the five most recently completed fiscal years.
Tabular List of Most Important Financial Performance Measures
The following table presents the financial performance measures that the company considers to have been the most important in linking Compensation Actually Paid to our PEO and other
Non-PEO
NEOs for 2025 to company performance. The measures in this table are not ranked. Net Operating Income
Earnings Per Share
Return on Tangible Common Equity
Return on Tangible Assets
| 5. | We determined Return on Tangible Common Equity (ROTCE) to be the most important financial performance measure used to link company performance to Compensation Actually Paid to our PEO and Non-PEO NEOs in 2021, 2022, 2023, 2024 and 2025. ROTCE is computed by dividing net operating income available to common equity by average tangible common equity. Net operating income available to common equity is computed by taking net income available to common equity and adding back the after-tax effect of the amortization of core deposit and other intangible assets, adding back the after-tax effects of merger-related expenses, and subtracting the after-tax effects of merger-related gains. Average tangible common equity is computed by taking average common equity for the applicable period and subtracting average goodwill and average core deposit and other intangible assets (net of any related average deferred tax amounts). The C&HC Committee and management use these non-GAAP financial measures as they believe they better reflect the impact of acquisition activity in reported results. See Appendix A for a reconciliation of GAAP financial measures to these corresponding non-GAAP financial measures. |