Pay Versus Performance
As required by Item 402(v) of Regulation S-K, we are providing the following information about the relationship between executive compensation actually paid and certain financial performance of the Company. For further information concerning the Company’s pay-for-performance philosophy and how the Company’s executive compensation aligns with the Company’s performance, refer to “Compensation Discussion and Analysis.” The Compensation and Human Capital Committee did not consider the Compensation Actually Paid measure below in making its compensation decisions for any of the years shown below.
|
|
|
|
|
|
|
|
|
|
|
|
|
|
|
|
|
|
|
|
Value of Initial Fixed $100 |
|
|
|
|
|
|
|
|||||||||||||
Year |
|
Summary |
|
|
Summary |
|
|
Compensation |
|
|
Compensation |
|
|
Average |
|
|
Average |
|
|
Total |
|
|
Peer Group |
|
|
Net |
|
|
Incentive |
|
||||||||||
2025 |
|
|
|
|
|
10,696,081 |
|
|
|
|
|
|
8,945,334 |
|
|
|
3,486,455 |
|
|
|
3,013,220 |
|
|
|
118.24 |
|
|
|
137.50 |
|
|
|
601.7 |
|
|
|
1,089.0 |
|
||
2024 |
|
|
|
|
|
8,944,625 |
|
|
|
|
|
|
10,718,331 |
|
|
|
2,783,204 |
|
|
|
3,349,278 |
|
|
|
117.50 |
|
|
|
138.71 |
|
|
|
584.2 |
|
|
|
1,014.5 |
|
||
2023 |
|
|
|
|
|
10,135,862 |
|
|
|
|
|
|
14,374,311 |
|
|
|
4,181,603 |
|
|
|
5,957,664 |
|
|
|
111.25 |
|
|
|
128.76 |
|
|
|
519.1 |
|
|
|
935.8 |
|
||
2022 |
|
|
1,577,173 |
|
|
|
6,636,731 |
|
|
|
(5,565,349 |
) |
|
|
(27,849 |
) |
|
|
3,222,641 |
|
|
|
2,114,168 |
|
|
|
92.19 |
|
|
|
111.26 |
|
|
|
452.3 |
|
|
|
894.7 |
|
2021 |
|
|
7,138,002 |
|
|
|
— |
|
|
|
18,863,088 |
|
|
|
— |
|
|
|
2,669,548 |
|
|
|
4,929,996 |
|
|
|
148.40 |
|
|
|
122.05 |
|
|
|
510.5 |
|
|
|
893.1 |
|
2021 |
2022 |
2023 |
2024 |
2025 |
Russell J. Weiner |
Sandeep Reddy |
Sandeep Reddy |
Sandeep Reddy |
Sandeep Reddy |
Joseph H. Jordan |
Joseph H. Jordan |
Joseph H. Jordan |
Joseph H. Jordan |
Joseph H. Jordan |
Kevin S. Morris |
Kelly E. Garcia |
Kelly E. Garcia |
Kelly E. Garcia |
Cynthia A. Headen |
Stuart A. Levy |
Arthur P. D'Elia |
Arthur P. D'Elia |
Cynthia A. Headen |
Kelly E. Garcia |
|
|
|
Arthur P. D'Elia |
|
Year |
|
Summary |
|
|
Exclusion of Stock |
|
|
Inclusion of Equity |
|
|
Compensation |
|
2022 |
|
1,577,173 |
|
|
(196,857) |
|
|
(6,945,665) |
|
|
(5,565,349) |
|
2021 |
|
7,138,002 |
|
|
(3,460,131) |
|
|
15,185,216 |
|
|
18,863,088 |
|
Year |
|
Summary |
|
|
Exclusion of Stock |
|
|
Inclusion of Equity |
|
|
Compensation |
|
2025 |
|
10,696,081 |
|
|
(7,615,905) |
|
|
5,865,158 |
|
|
8,945,334 |
|
2024 |
|
8,944,625 |
|
|
(5,772,288) |
|
|
7,545,994 |
|
|
10,718,331 |
|
2023 |
|
10,135,862 |
|
|
(7,070,798) |
|
|
11,309,247 |
|
|
14,374,311 |
|
2022 |
|
6,636,731 |
|
|
(4,553,658) |
|
|
(2,110,922) |
|
|
(27,849) |
|
Year |
|
Average Summary |
|
|
Average Exclusion of |
|
|
Average Inclusion of |
|
|
Average |
|
2025 |
|
3,486,455 |
|
|
(1,940,789) |
|
|
1,467,554 |
|
|
3,013,220 |
|
2024 |
|
2,783,204 |
|
|
(1,367,579) |
|
|
1,933,653 |
|
|
3,349,278 |
|
2023 |
|
4,181,603 |
|
|
(2,715,339) |
|
|
4,491,400 |
|
|
5,957,664 |
|
2022 |
|
3,222,641 |
|
|
(1,904,195) |
|
|
795,722 |
|
|
2,114,168 |
|
2021 |
|
2,669,548 |
|
|
(1,136,067) |
|
|
3,396,515 |
|
|
4,929,996 |
|
The amounts in the Inclusion of Equity Values in the tables above are derived from the amounts set forth in the following tables:
Year |
|
Year-End Fair |
|
|
Change in Fair |
|
|
Change in Fair |
|
|
Fair Value at Last |
|
|
Total - Inclusion |
|
2022 |
|
— |
|
|
(692,267) |
|
|
(6,253,398) |
|
|
— |
|
|
(6,945,665) |
|
2021 |
|
5,462,058 |
|
|
7,624,249 |
|
|
2,098,909 |
|
|
— |
|
|
15,185,216 |
|
Year |
|
Year-End Fair |
|
|
Change in Fair |
|
|
Change in Fair |
|
|
Fair Value at Last |
|
|
Total - Inclusion |
|
2025 |
|
7,039,398 |
|
|
(1,249,262) |
|
|
75,022 |
|
|
— |
|
|
5,865,158 |
|
2024 |
|
5,261,943 |
|
|
1,676,729 |
|
|
607,322 |
|
|
— |
|
|
7,545,994 |
|
2023 |
|
10,957,111 |
|
|
627,305 |
|
|
(275,169) |
|
|
— |
|
|
11,309,247 |
|
2022 |
|
3,584,162 |
|
|
(2,645,641) |
|
|
(3,049,443) |
|
|
— |
|
|
(2,110,922) |
|
|
|
|
|
|
|
|
|
|
|
|
|
|
|
|
|
Year |
|
Average Year-End |
|
|
Average Change in |
|
|
Average Change in |
|
|
Average Fair Value |
|
|
Total - Average |
|
2025 |
|
1,777,550 |
|
|
(355,394) |
|
|
45,398 |
|
|
— |
|
|
1,467,554 |
|
2024 |
|
1,243,061 |
|
|
441,853 |
|
|
248,739 |
|
|
— |
|
|
1,933,653 |
|
2023 |
|
4,285,464 |
|
|
277,603 |
|
|
(71,667) |
|
|
— |
|
|
4,491,400 |
|
2022 |
|
1,559,241 |
|
|
(573,013) |
|
|
(190,506) |
|
|
— |
|
|
795,722 |
|
2021 |
|
1,380,101 |
|
|
1,658,217 |
|
|
590,885 |
|
|
(232,688) |
|
|
3,396,515 |
|
2021 |
2022 |
2023 |
2024 |
2025 |
Russell J. Weiner |
Sandeep Reddy |
Sandeep Reddy |
Sandeep Reddy |
Sandeep Reddy |
Joseph H. Jordan |
Joseph H. Jordan |
Joseph H. Jordan |
Joseph H. Jordan |
Joseph H. Jordan |
Kevin S. Morris |
Kelly E. Garcia |
Kelly E. Garcia |
Kelly E. Garcia |
Cynthia A. Headen |
Stuart A. Levy |
Arthur P. D'Elia |
Arthur P. D'Elia |
Cynthia A. Headen |
Kelly E. Garcia |
|
|
|
Arthur P. D'Elia |
|
Year |
|
Summary |
|
|
Exclusion of Stock |
|
|
Inclusion of Equity |
|
|
Compensation |
|
2022 |
|
1,577,173 |
|
|
(196,857) |
|
|
(6,945,665) |
|
|
(5,565,349) |
|
2021 |
|
7,138,002 |
|
|
(3,460,131) |
|
|
15,185,216 |
|
|
18,863,088 |
|
Year |
|
Summary |
|
|
Exclusion of Stock |
|
|
Inclusion of Equity |
|
|
Compensation |
|
2025 |
|
10,696,081 |
|
|
(7,615,905) |
|
|
5,865,158 |
|
|
8,945,334 |
|
2024 |
|
8,944,625 |
|
|
(5,772,288) |
|
|
7,545,994 |
|
|
10,718,331 |
|
2023 |
|
10,135,862 |
|
|
(7,070,798) |
|
|
11,309,247 |
|
|
14,374,311 |
|
2022 |
|
6,636,731 |
|
|
(4,553,658) |
|
|
(2,110,922) |
|
|
(27,849) |
|
Year |
|
Average Summary |
|
|
Average Exclusion of |
|
|
Average Inclusion of |
|
|
Average |
|
2025 |
|
3,486,455 |
|
|
(1,940,789) |
|
|
1,467,554 |
|
|
3,013,220 |
|
2024 |
|
2,783,204 |
|
|
(1,367,579) |
|
|
1,933,653 |
|
|
3,349,278 |
|
2023 |
|
4,181,603 |
|
|
(2,715,339) |
|
|
4,491,400 |
|
|
5,957,664 |
|
2022 |
|
3,222,641 |
|
|
(1,904,195) |
|
|
795,722 |
|
|
2,114,168 |
|
2021 |
|
2,669,548 |
|
|
(1,136,067) |
|
|
3,396,515 |
|
|
4,929,996 |
|
The amounts in the Inclusion of Equity Values in the tables above are derived from the amounts set forth in the following tables:
Year |
|
Year-End Fair |
|
|
Change in Fair |
|
|
Change in Fair |
|
|
Fair Value at Last |
|
|
Total - Inclusion |
|
2022 |
|
— |
|
|
(692,267) |
|
|
(6,253,398) |
|
|
— |
|
|
(6,945,665) |
|
2021 |
|
5,462,058 |
|
|
7,624,249 |
|
|
2,098,909 |
|
|
— |
|
|
15,185,216 |
|
Year |
|
Year-End Fair |
|
|
Change in Fair |
|
|
Change in Fair |
|
|
Fair Value at Last |
|
|
Total - Inclusion |
|
2025 |
|
7,039,398 |
|
|
(1,249,262) |
|
|
75,022 |
|
|
— |
|
|
5,865,158 |
|
2024 |
|
5,261,943 |
|
|
1,676,729 |
|
|
607,322 |
|
|
— |
|
|
7,545,994 |
|
2023 |
|
10,957,111 |
|
|
627,305 |
|
|
(275,169) |
|
|
— |
|
|
11,309,247 |
|
2022 |
|
3,584,162 |
|
|
(2,645,641) |
|
|
(3,049,443) |
|
|
— |
|
|
(2,110,922) |
|
|
|
|
|
|
|
|
|
|
|
|
|
|
|
|
|
Year |
|
Average Year-End |
|
|
Average Change in |
|
|
Average Change in |
|
|
Average Fair Value |
|
|
Total - Average |
|
2025 |
|
1,777,550 |
|
|
(355,394) |
|
|
45,398 |
|
|
— |
|
|
1,467,554 |
|
2024 |
|
1,243,061 |
|
|
441,853 |
|
|
248,739 |
|
|
— |
|
|
1,933,653 |
|
2023 |
|
4,285,464 |
|
|
277,603 |
|
|
(71,667) |
|
|
— |
|
|
4,491,400 |
|
2022 |
|
1,559,241 |
|
|
(573,013) |
|
|
(190,506) |
|
|
— |
|
|
795,722 |
|
2021 |
|
1,380,101 |
|
|
1,658,217 |
|
|
590,885 |
|
|
(232,688) |
|
|
3,396,515 |
|
Year |
|
Summary |
|
|
Exclusion of Stock |
|
|
Inclusion of Equity |
|
|
Compensation |
|
2022 |
|
1,577,173 |
|
|
(196,857) |
|
|
(6,945,665) |
|
|
(5,565,349) |
|
2021 |
|
7,138,002 |
|
|
(3,460,131) |
|
|
15,185,216 |
|
|
18,863,088 |
|
Year |
|
Summary |
|
|
Exclusion of Stock |
|
|
Inclusion of Equity |
|
|
Compensation |
|
2025 |
|
10,696,081 |
|
|
(7,615,905) |
|
|
5,865,158 |
|
|
8,945,334 |
|
2024 |
|
8,944,625 |
|
|
(5,772,288) |
|
|
7,545,994 |
|
|
10,718,331 |
|
2023 |
|
10,135,862 |
|
|
(7,070,798) |
|
|
11,309,247 |
|
|
14,374,311 |
|
2022 |
|
6,636,731 |
|
|
(4,553,658) |
|
|
(2,110,922) |
|
|
(27,849) |
|
Year |
|
Average Summary |
|
|
Average Exclusion of |
|
|
Average Inclusion of |
|
|
Average |
|
2025 |
|
3,486,455 |
|
|
(1,940,789) |
|
|
1,467,554 |
|
|
3,013,220 |
|
2024 |
|
2,783,204 |
|
|
(1,367,579) |
|
|
1,933,653 |
|
|
3,349,278 |
|
2023 |
|
4,181,603 |
|
|
(2,715,339) |
|
|
4,491,400 |
|
|
5,957,664 |
|
2022 |
|
3,222,641 |
|
|
(1,904,195) |
|
|
795,722 |
|
|
2,114,168 |
|
2021 |
|
2,669,548 |
|
|
(1,136,067) |
|
|
3,396,515 |
|
|
4,929,996 |
|
The amounts in the Inclusion of Equity Values in the tables above are derived from the amounts set forth in the following tables:
Year |
|
Year-End Fair |
|
|
Change in Fair |
|
|
Change in Fair |
|
|
Fair Value at Last |
|
|
Total - Inclusion |
|
2022 |
|
— |
|
|
(692,267) |
|
|
(6,253,398) |
|
|
— |
|
|
(6,945,665) |
|
2021 |
|
5,462,058 |
|
|
7,624,249 |
|
|
2,098,909 |
|
|
— |
|
|
15,185,216 |
|
Year |
|
Year-End Fair |
|
|
Change in Fair |
|
|
Change in Fair |
|
|
Fair Value at Last |
|
|
Total - Inclusion |
|
2025 |
|
7,039,398 |
|
|
(1,249,262) |
|
|
75,022 |
|
|
— |
|
|
5,865,158 |
|
2024 |
|
5,261,943 |
|
|
1,676,729 |
|
|
607,322 |
|
|
— |
|
|
7,545,994 |
|
2023 |
|
10,957,111 |
|
|
627,305 |
|
|
(275,169) |
|
|
— |
|
|
11,309,247 |
|
2022 |
|
3,584,162 |
|
|
(2,645,641) |
|
|
(3,049,443) |
|
|
— |
|
|
(2,110,922) |
|
|
|
|
|
|
|
|
|
|
|
|
|
|
|
|
|
Year |
|
Average Year-End |
|
|
Average Change in |
|
|
Average Change in |
|
|
Average Fair Value |
|
|
Total - Average |
|
2025 |
|
1,777,550 |
|
|
(355,394) |
|
|
45,398 |
|
|
— |
|
|
1,467,554 |
|
2024 |
|
1,243,061 |
|
|
441,853 |
|
|
248,739 |
|
|
— |
|
|
1,933,653 |
|
2023 |
|
4,285,464 |
|
|
277,603 |
|
|
(71,667) |
|
|
— |
|
|
4,491,400 |
|
2022 |
|
1,559,241 |
|
|
(573,013) |
|
|
(190,506) |
|
|
— |
|
|
795,722 |
|
2021 |
|
1,380,101 |
|
|
1,658,217 |
|
|
590,885 |
|
|
(232,688) |
|
|
3,396,515 |
|
Compensation Actually Paid and Cumulative TSR
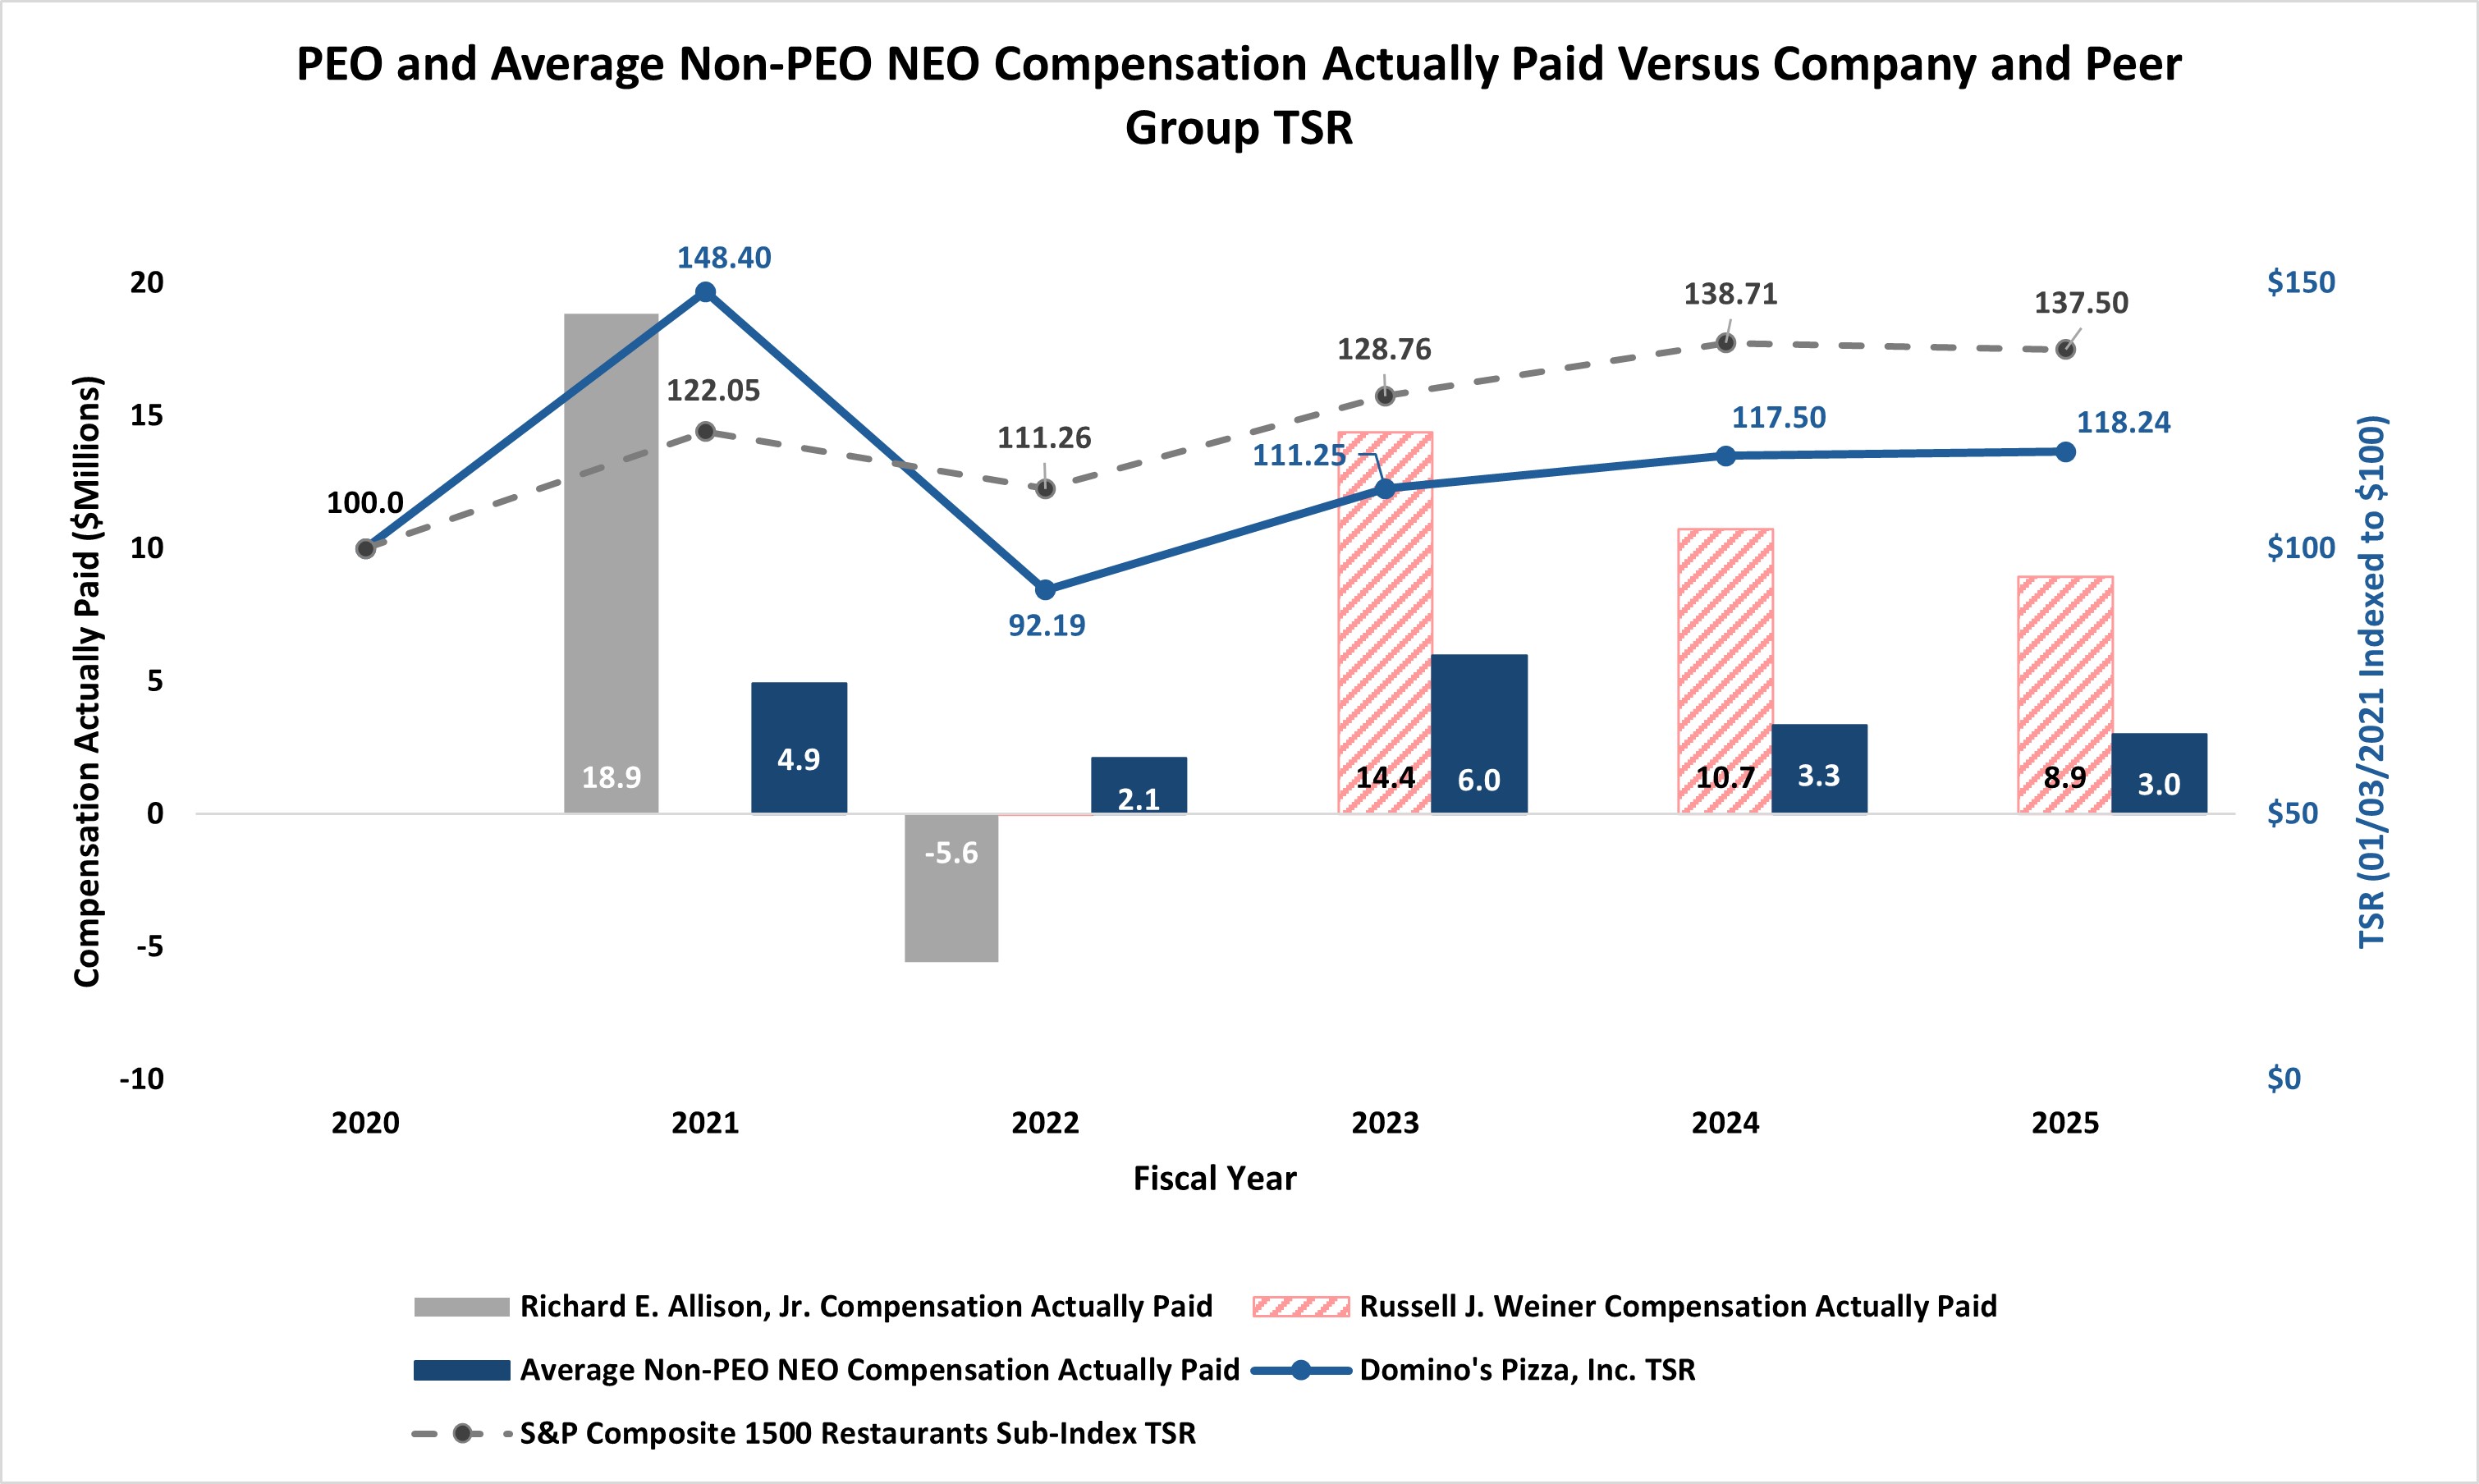
The following chart sets forth the relationship between Compensation Actually Paid to our PEOs, the average of Compensation Actually Paid to our Non-PEO NEOs, and the Company’s cumulative TSR over the five most recently completed fiscal years and also compares our cumulative TSR over the five most recently completed fiscal years to that of the S&P Composite 1500 Restaurant Sub-Index TSR over the same period.
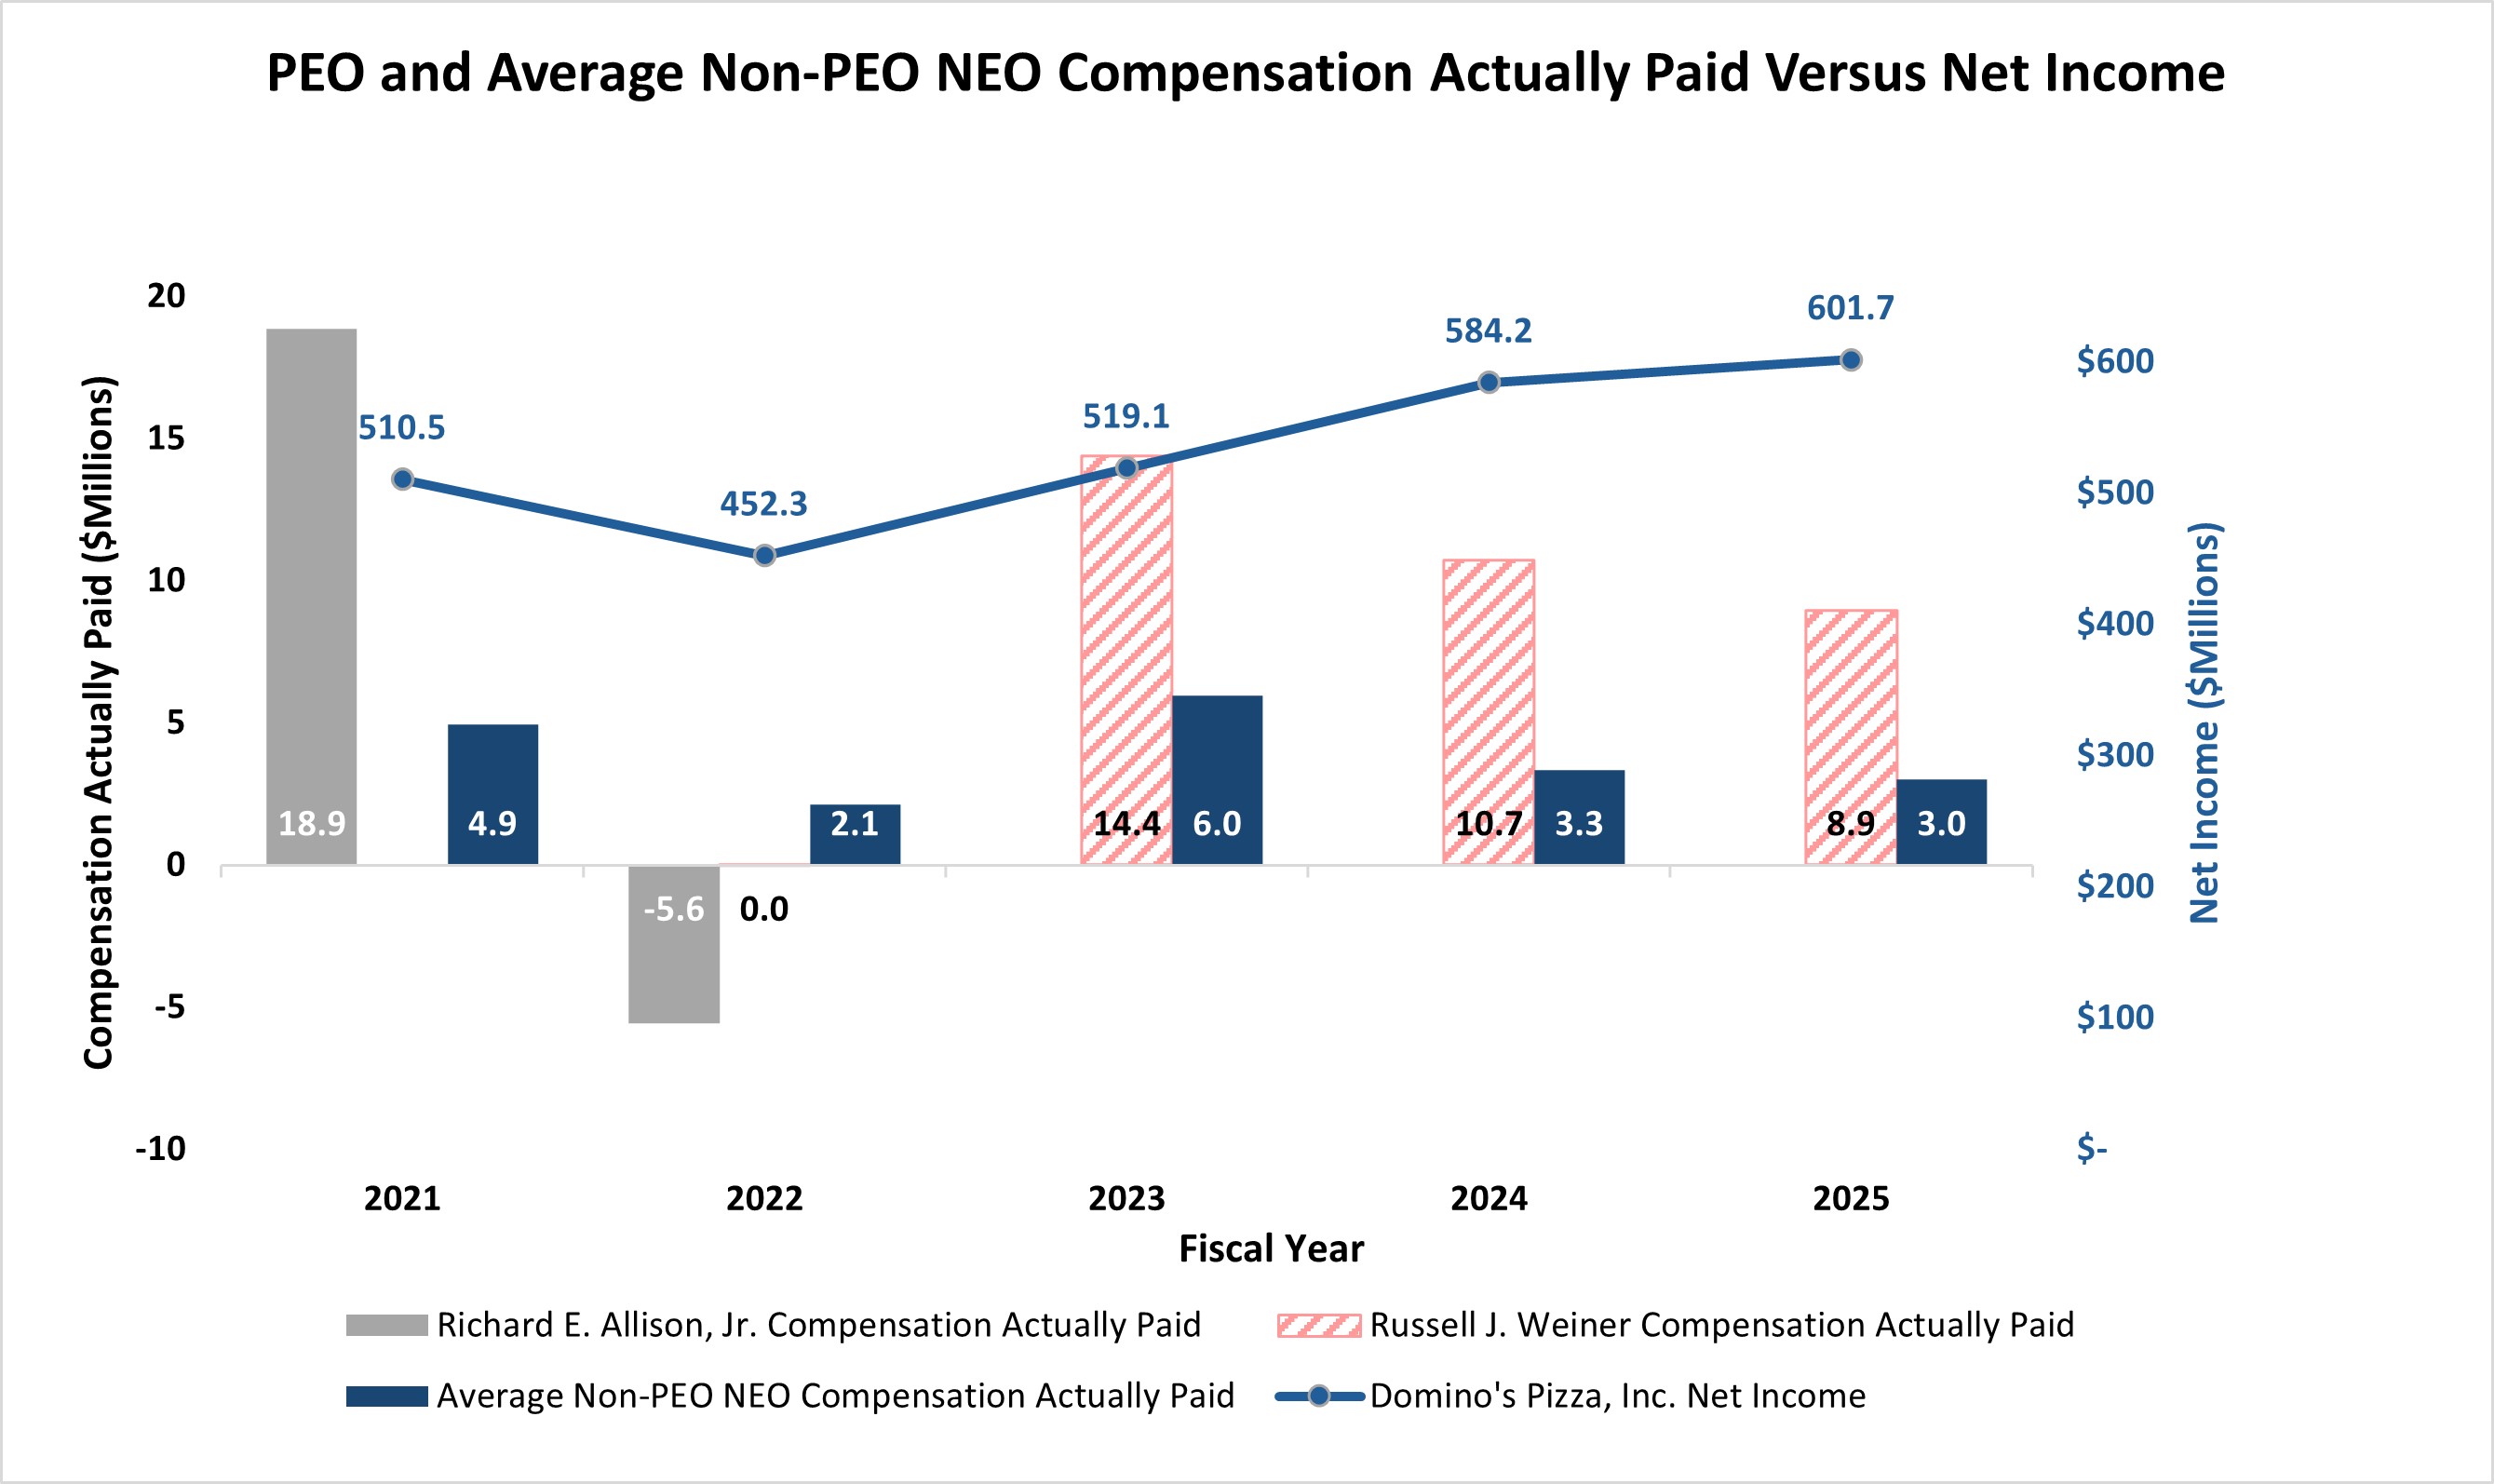
Compensation Actually Paid and Net Income
The following chart sets forth the relationship between Compensation Actually Paid to our PEOs, the average of Compensation Actually Paid to our Non-PEO NEOs, and our net income during the five most recently completed fiscal years.
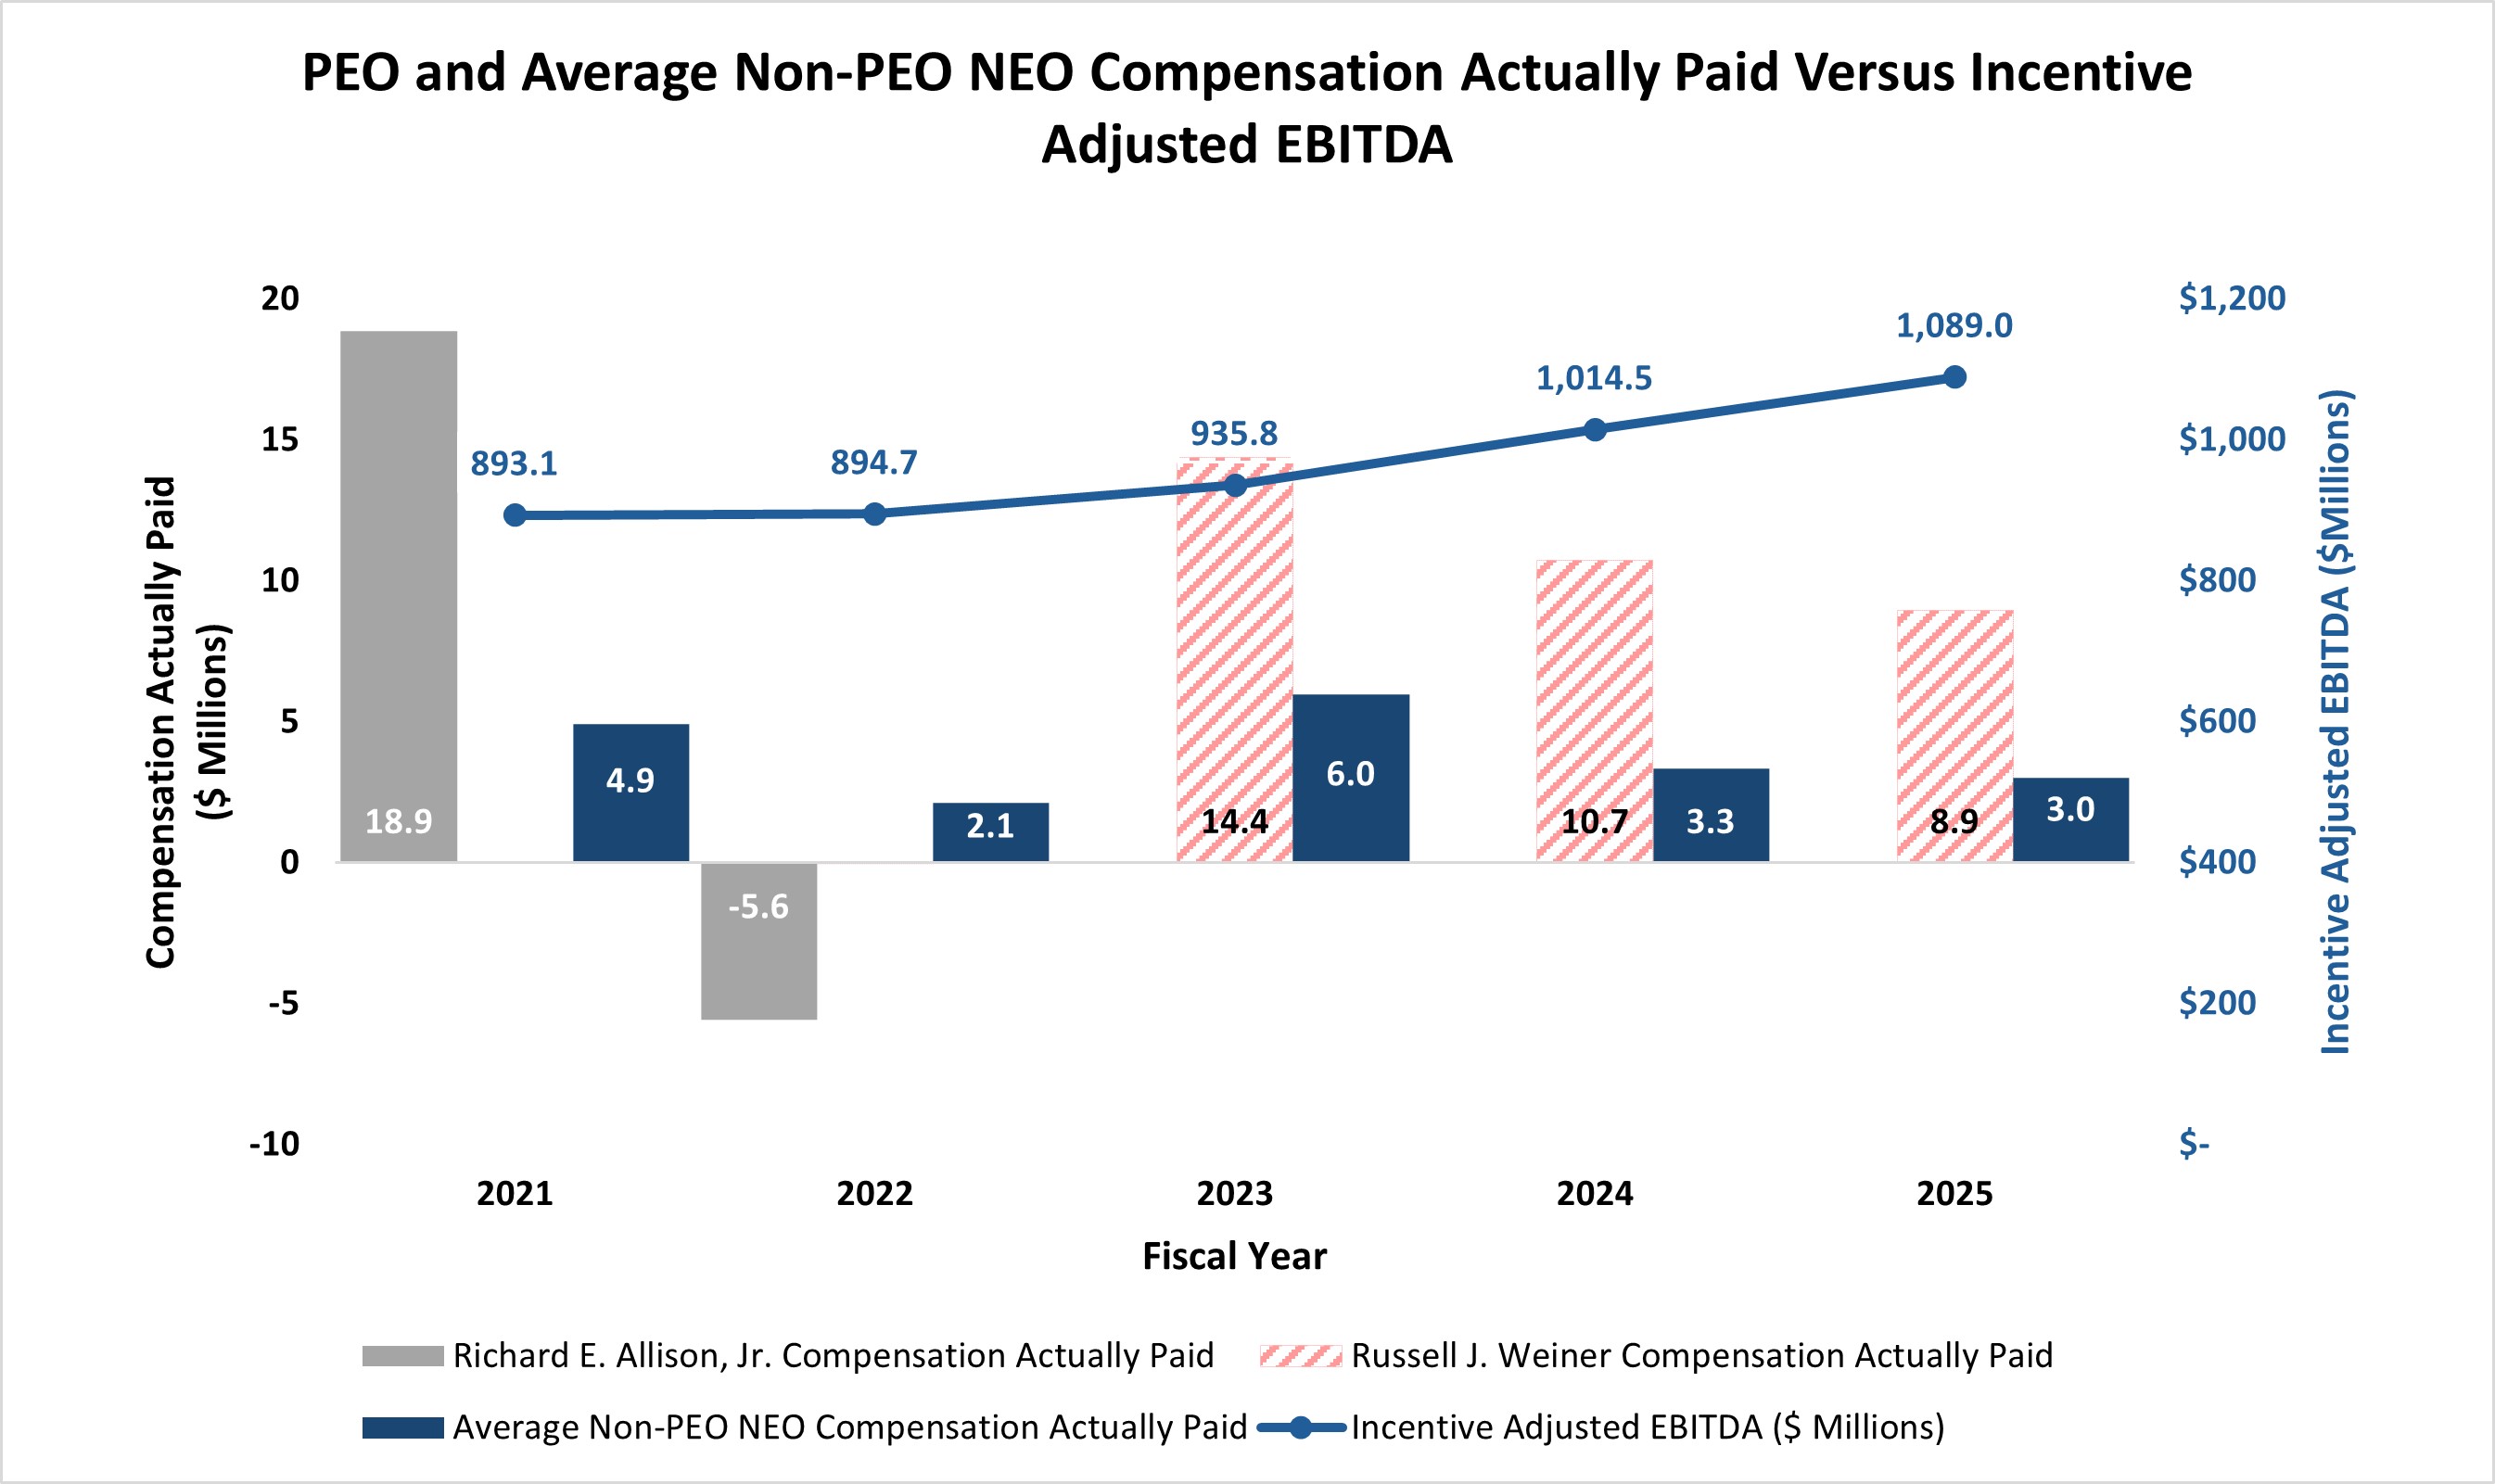
Compensation Actually Paid and Incentive Adjusted EBITDA
The following chart sets forth the relationship between Compensation Actually Paid to our PEO, the average of Compensation Actually Paid to our Non-PEO NEOs, and our Incentive Adjusted EBITDA during the five most recently completed fiscal years.
Cumulative TSR of the Company and Cumulative TSR of the Peer Group
The Company’s cumulative TSR over the five-year period presented in the table was approximately 18.2%, while the cumulative TSR of the peer group presented for this purpose, the S&P Composite 1500 Restaurants Sub-Index, was approximately 37.5% over this same period. The Company’s cumulative TSR underperformed the S&P Composite 1500 Restaurants Sub-Index during the period presented in the table, representing the Company’s underperformance as compared to the companies comprising the S&P Composite 1500 Restaurants Sub-Index comparison group in certain years in the period, but still grew positively in 2025 and corresponded with a significant return to growth and a return to the Company’s historical strong operating performance. For more information regarding the Company’s performance and the companies that the Compensation and Human Capital Committee considers when determining compensation, refer to “Compensation Discussion and Analysis.”
The following list presents the most important financial performance measures used by the Company to link executive compensation actually paid to the Company’s named executive officers in fiscal 2025 to the Company’s performance. The measures in this list are not ranked.