Pay vs Performance Disclosure
Dec. 31, 2025
USD ($)
$ / shares
Target
Dec. 31, 2024
USD ($)
$ / shares
Dec. 31, 2023
USD ($)
$ / shares
Dec. 31, 2022
USD ($)
$ / shares
Dec. 31, 2021
USD ($)
$ / shares
Pay versus Performance
Below are the tables and related footnotes for PVP:
CEO | Non-CEO NEOs | Value of Initial Fixed $100 Investment Base On: Jan 1st, 2021 | ||||||||||||||||||||||
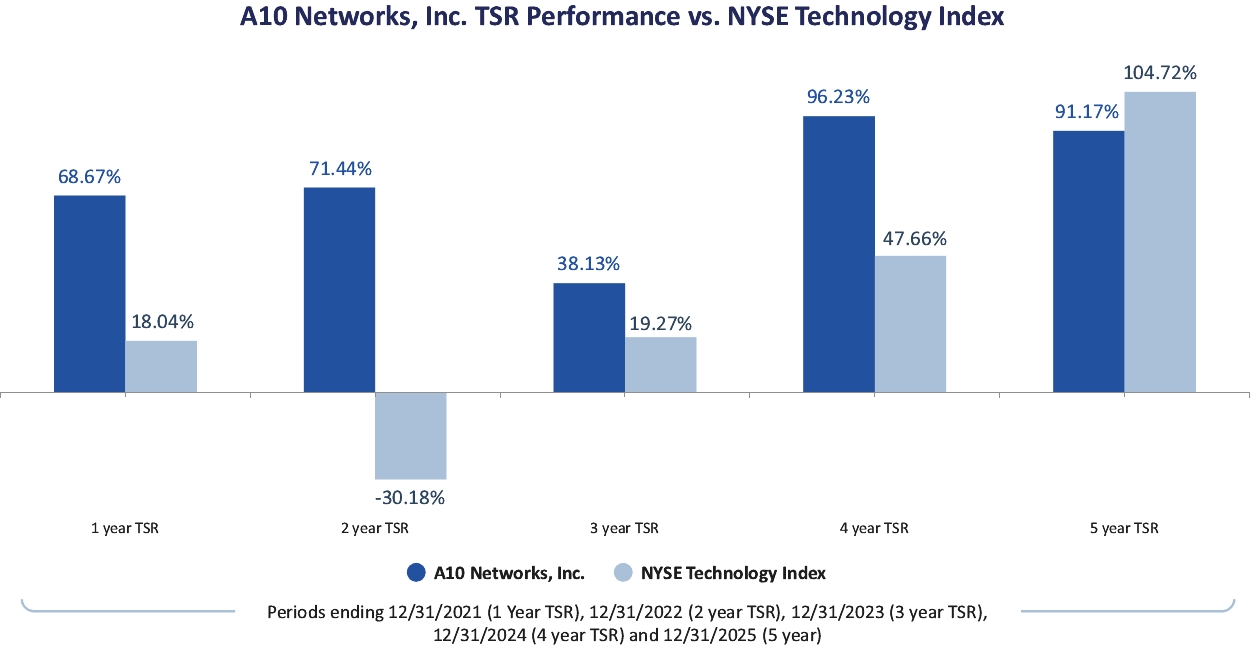
Year | Summary Compensation Table Total for CEO | Compensation Actually Paid to CEO(2) | Average Summary Compensation Table Total for Non-CEO NEOs(4) | Average Compensation Actually Paid to Non-CEO NEOs(3)(4) | The Company Total Shareholder Return | Peer Group Total Shareholder Return(1) | Net Income (millions) | 100-Day Volume Weighted Average Stock Price(5) | ||||||||||||||||
2025 | 6,974,141 | 6,602,267 | 1,154,486 | 843,944 | 91.17% | 104.72% | $42.1 | $17.76 | ||||||||||||||||
2024 | 6,344,956 | 10,373,309 | 1,090,459 | 1,182,950 | 96.23% | 47.66% | $50.1 | $16.11 | ||||||||||||||||
2023 | 4,577,120 | 2,500,784 | 861,834 | (729,343) | 38.13% | 19.27% | $40.0 | $12.40 | ||||||||||||||||
2022 | 4,453,280 | 4,364,958 | 944,728 | 482,296 | 71.44% | -30.18% | $46.9 | $16.73 | ||||||||||||||||
2021 | 3,135,250 | 7,250,200 | 1,121,976 | 1,943,908 | 68.67% | 18.04% | $94.9 | $15.07 | ||||||||||||||||
(1) | The Company’s peer group Total Shareholder Return is based on NYSE Technology Index, which is one of the indexes used for purposes of our 10-K performance graph. |
(2) | The following represents the adjustments made to the Summary Compensation Table totals to derive the compensation actually paid to Dr. Trivedi in his role as CEO. Dr. Trivedi served as the CEO through the entire reporting period. |
Adjustments | 2025 | 2024 | 2023 | 2022 | 2021 | ||||||||||
Amounts reported in “Stock Awards” column of Summary Compensation Table | (5,211,973) | (4,500,005) | (3,896,752) | (2,999,996) | (1,699,993) | ||||||||||
Fair value of outstanding and unvested stock awards that were granted in the current year: | 3,888,532 | 5,142,872 | 2,854,663 | 3,237,507 | 2,156,627 | ||||||||||
Change in fair value for stock awards outstanding and unvested at the end of the current year that were granted in a prior year: | 234,011 | 2,360,631 | (635,675) | 17,739 | 2,940,000 | ||||||||||
Fair value of stock awards granted and vested in the current year: | — | 934,951 | — | — | 553,941 | ||||||||||
Change in fair value for stock awards vested in the current year that were granted in a prior year: | 717,557 | 89,905 | (398,572) | (343,571) | 164,375 | ||||||||||
(3) | The following represents the average adjustments made to the Summary Compensation Table totals for our non-CEO named executive officers to derive the average compensation actually paid for our non-CEO named executive officers. |
Adjustments | 2025 | 2024 | 2023 | 2022 | 2021 | ||||||||||
Amounts reported in “Stock Awards” column of Summary Compensation Table | (655,438) | (351,668) | (1,430,284) | (475,557) | (499,998) | ||||||||||
Fair value of outstanding and unvested stock awards that were granted in the current year: | 446,797 | 344,763 | 293,936 | 419,947 | 634,307 | ||||||||||
Change in fair value for stock awards outstanding and unvested at the end of the current year that were granted in a prior year: | 58,410 | 194,716 | (53,083) | 1,649 | 520,860 | ||||||||||
Fair value of stock awards granted and vested in the current year | — | 73,058 | — | — | 162,920 | ||||||||||
Change in fair value for stock awards vested in the current year that were granted in a prior year: | 45,733 | 2,489 | (33,872) | (71,765) | 3,843 | ||||||||||
Fair value of stock awards forfeited in the current year that were granted in a prior year: | (206,044) | (170,867) | (367,872) | (336,707) | — | ||||||||||
(4) | The named executive officers included in the non-CEO named executive average for each year are as follows: |
2025 | Ms. Caron, Mr. Khoury, Mr. Weber and Mr. Becker. | ||
2024 | Messrs. Becker and Weber and Ms. Thomas. | ||
2023 | Messrs. Becker, Bruening and Weber and Ms. Thomas. | ||
2022 | Messrs. Becker, Bruening, Cochran, and Weber. | ||
2021 | Messrs. Becker, Bruening, and Cochran. | ||
(5) | Represents 100-Day Volume Weighted Average Stock Price (“VWAP”) as of December 31 of each applicable year. The VWAP metric is used for purposes of determining achievement of our 2025 PSU awards, which are eligible to vest upon the achievement of two distinct VWAP targets during the performance period beginning on the date of grant of the 2025 PSU award and ending on the four (4) year anniversary of such date. |
(2) | The following represents the adjustments made to the Summary Compensation Table totals to derive the compensation actually paid to Dr. Trivedi in his role as CEO. Dr. Trivedi served as the CEO through the entire reporting period. |
(4) | The named executive officers included in the non-CEO named executive average for each year are as follows: |
2025 | Ms. Caron, Mr. Khoury, Mr. Weber and Mr. Becker. | ||
2024 | Messrs. Becker and Weber and Ms. Thomas. | ||
2023 | Messrs. Becker, Bruening and Weber and Ms. Thomas. | ||
2022 | Messrs. Becker, Bruening, Cochran, and Weber. | ||
2021 | Messrs. Becker, Bruening, and Cochran. | ||
(1) | The Company’s peer group Total Shareholder Return is based on NYSE Technology Index, which is one of the indexes used for purposes of our 10-K performance graph. |
(2) | The following represents the adjustments made to the Summary Compensation Table totals to derive the compensation actually paid to Dr. Trivedi in his role as CEO. Dr. Trivedi served as the CEO through the entire reporting period. |
Adjustments | 2025 | 2024 | 2023 | 2022 | 2021 | ||||||||||
Amounts reported in “Stock Awards” column of Summary Compensation Table | (5,211,973) | (4,500,005) | (3,896,752) | (2,999,996) | (1,699,993) | ||||||||||
Fair value of outstanding and unvested stock awards that were granted in the current year: | 3,888,532 | 5,142,872 | 2,854,663 | 3,237,507 | 2,156,627 | ||||||||||
Change in fair value for stock awards outstanding and unvested at the end of the current year that were granted in a prior year: | 234,011 | 2,360,631 | (635,675) | 17,739 | 2,940,000 | ||||||||||
Fair value of stock awards granted and vested in the current year: | — | 934,951 | — | — | 553,941 | ||||||||||
Change in fair value for stock awards vested in the current year that were granted in a prior year: | 717,557 | 89,905 | (398,572) | (343,571) | 164,375 | ||||||||||
(3) | The following represents the average adjustments made to the Summary Compensation Table totals for our non-CEO named executive officers to derive the average compensation actually paid for our non-CEO named executive officers. |
Adjustments | 2025 | 2024 | 2023 | 2022 | 2021 | ||||||||||
Amounts reported in “Stock Awards” column of Summary Compensation Table | (655,438) | (351,668) | (1,430,284) | (475,557) | (499,998) | ||||||||||
Fair value of outstanding and unvested stock awards that were granted in the current year: | 446,797 | 344,763 | 293,936 | 419,947 | 634,307 | ||||||||||
Change in fair value for stock awards outstanding and unvested at the end of the current year that were granted in a prior year: | 58,410 | 194,716 | (53,083) | 1,649 | 520,860 | ||||||||||
Fair value of stock awards granted and vested in the current year | — | 73,058 | — | — | 162,920 | ||||||||||
Change in fair value for stock awards vested in the current year that were granted in a prior year: | 45,733 | 2,489 | (33,872) | (71,765) | 3,843 | ||||||||||
Fair value of stock awards forfeited in the current year that were granted in a prior year: | (206,044) | (170,867) | (367,872) | (336,707) | — | ||||||||||
The following metrics represent the three most important financial performance measures used by the Company in setting NEO compensation for the most recent fiscal year:
100-Day Volume Weighted Average Stock Price | |||
Revenue | |||
Adjusted EBITDA | |||