Shareholder Report
|
12 Months Ended |
|
Dec. 31, 2025
USD ($)
Holding
|
|---|
| Shareholder Report [Line Items] |
|
| Document Type |
N-CSR
|
| Amendment Flag |
false
|
| Registrant Name |
Voya Investors Trust
|
| Entity Central Index Key |
0000837276
|
| Entity Investment Company Type |
N-1A
|
| Document Period End Date |
Dec. 31, 2025
|
| C000028890 |
|
| Shareholder Report [Line Items] |
|
| Fund Name |
Voya Balanced Income Portfolio
|
| Class Name |
Class ADV
|
| Trading Symbol |
IIFAX
|
| Annual or Semi-Annual Statement [Text Block] |
This annual shareholder report contains important information about Voya Balanced Income Portfolio for the period of January 1, 2025 to December 31, 2025.
|
| Shareholder Report Annual or Semi-Annual |
Annual Shareholder Report
|
| Material Fund Change Notice [Text Block] |
This report describes changes to the Fund that occurred during the reporting period.
|
| Additional Information Phone Number |
1-800-992-0180
|
| Expenses [Text Block] |
What were the Fund’s costs for the last year? (based on a hypothetical $10,000 investment)Class Name | Costs of $10K investment | Costs paid as % of $10K investment |
|---|
Class ADV | $126 | 1.19% |
|---|
|
| Expenses Paid, Amount |
$ 126
|
| Expense Ratio, Percent |
1.19%
|
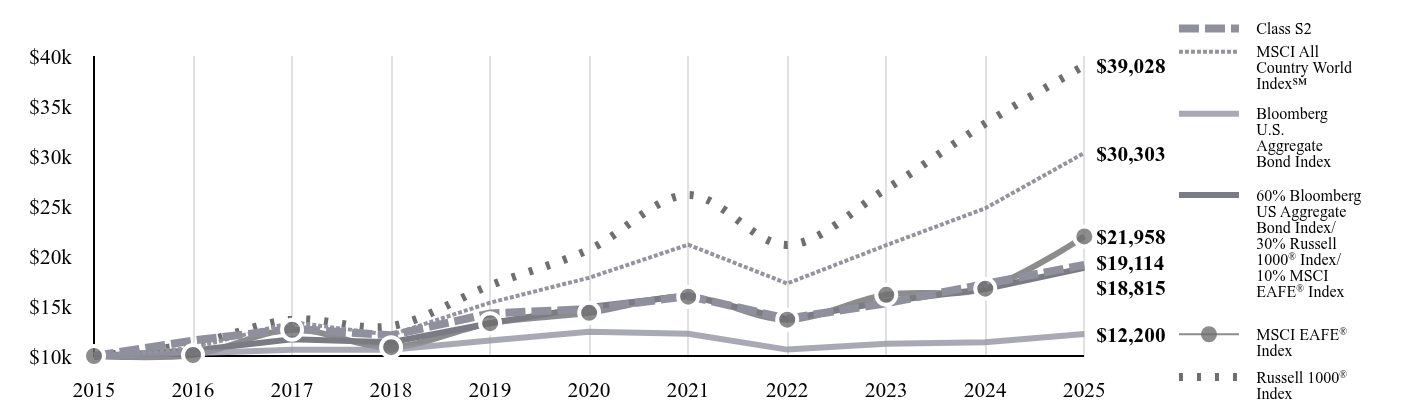
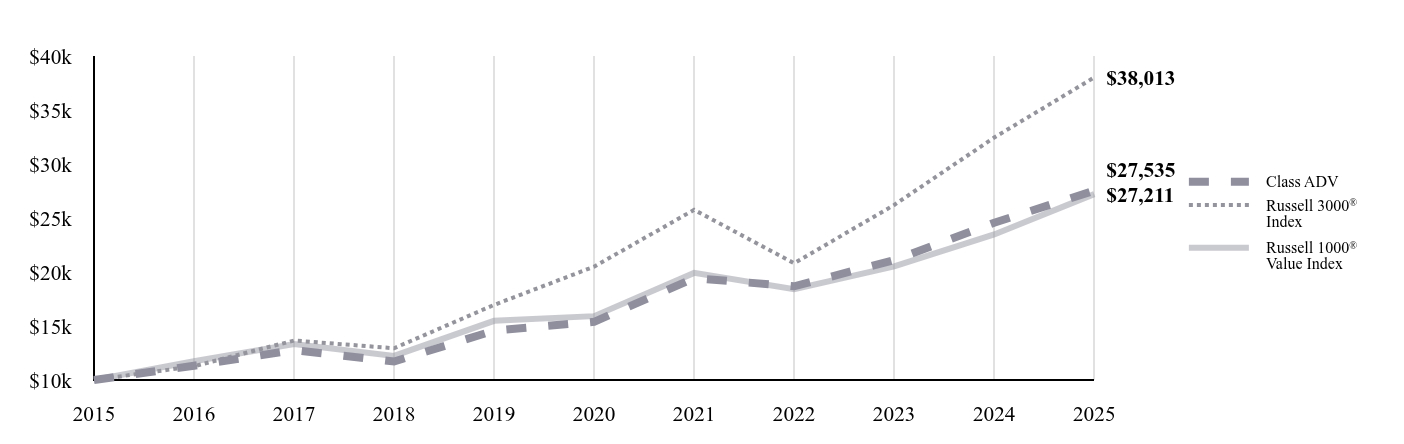
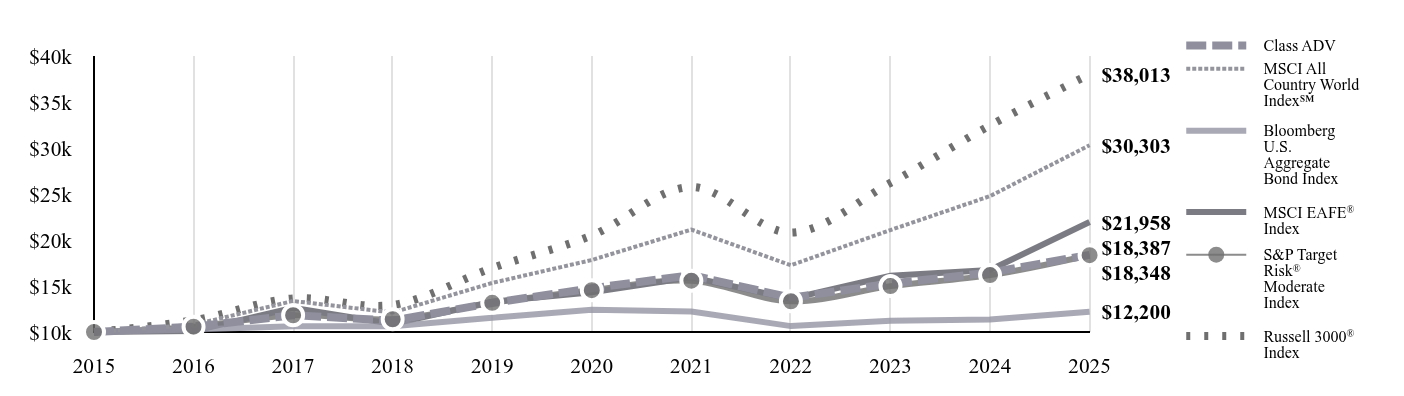
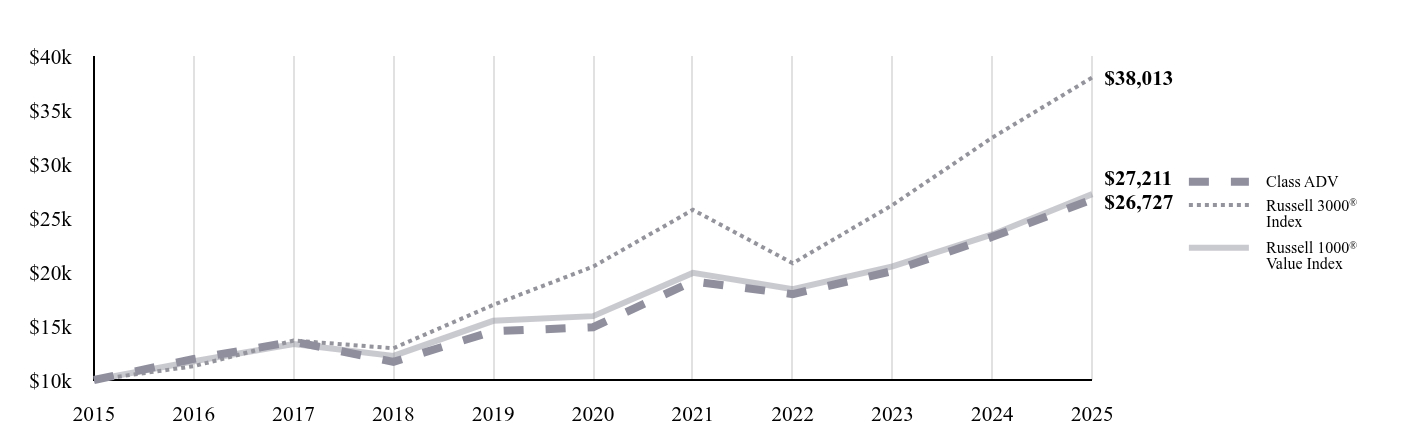
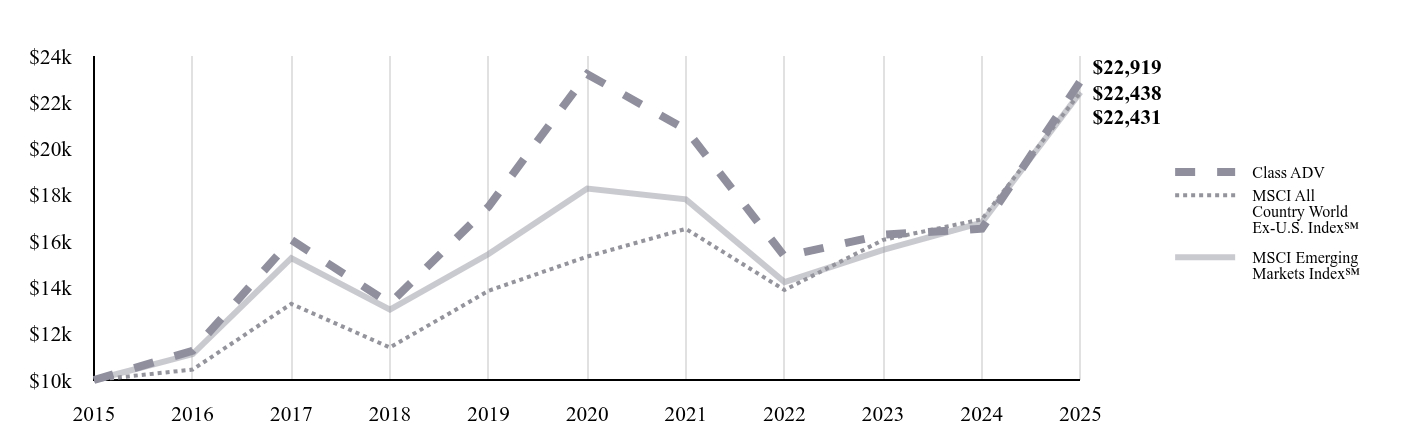
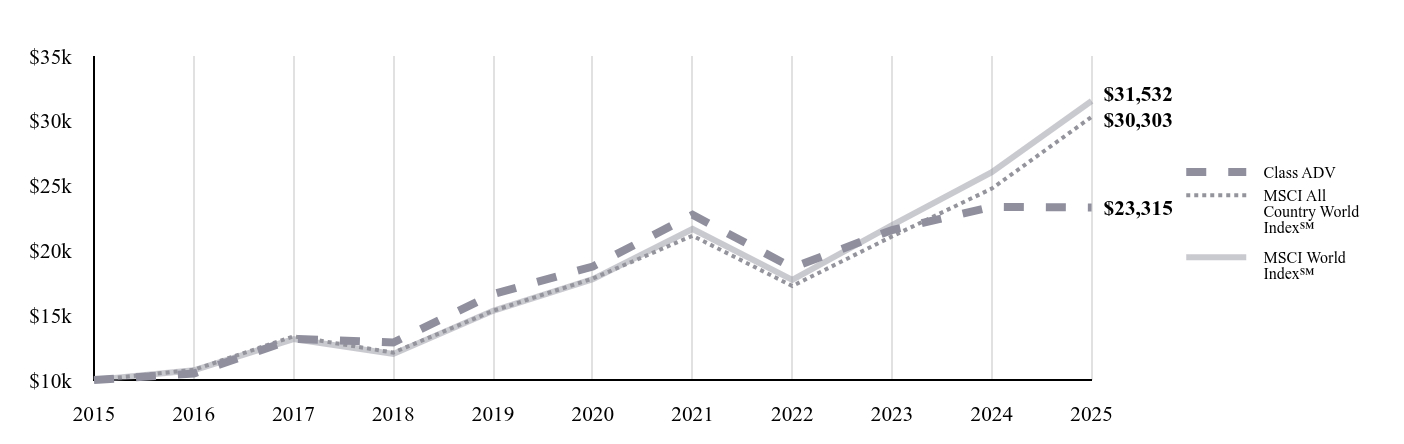
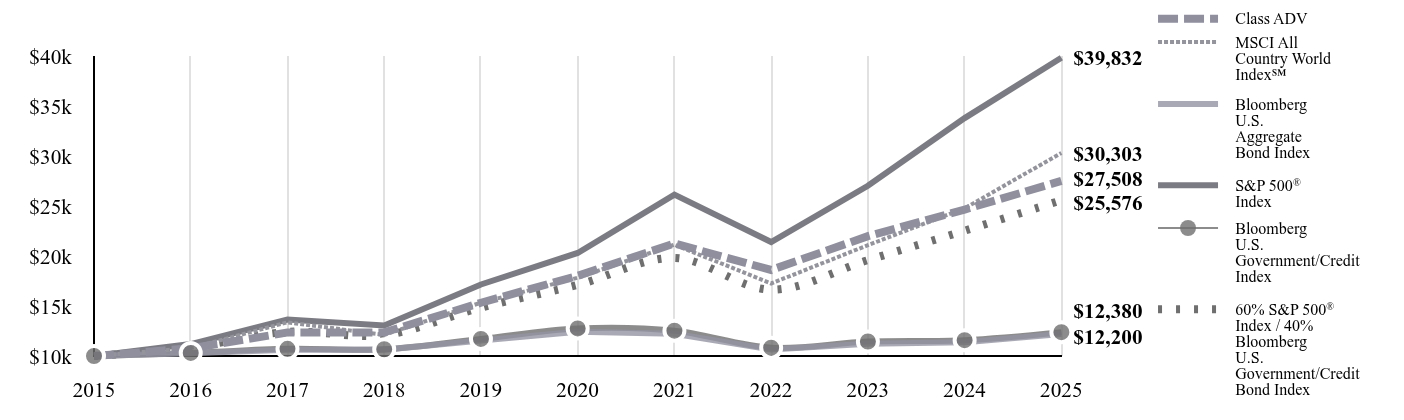
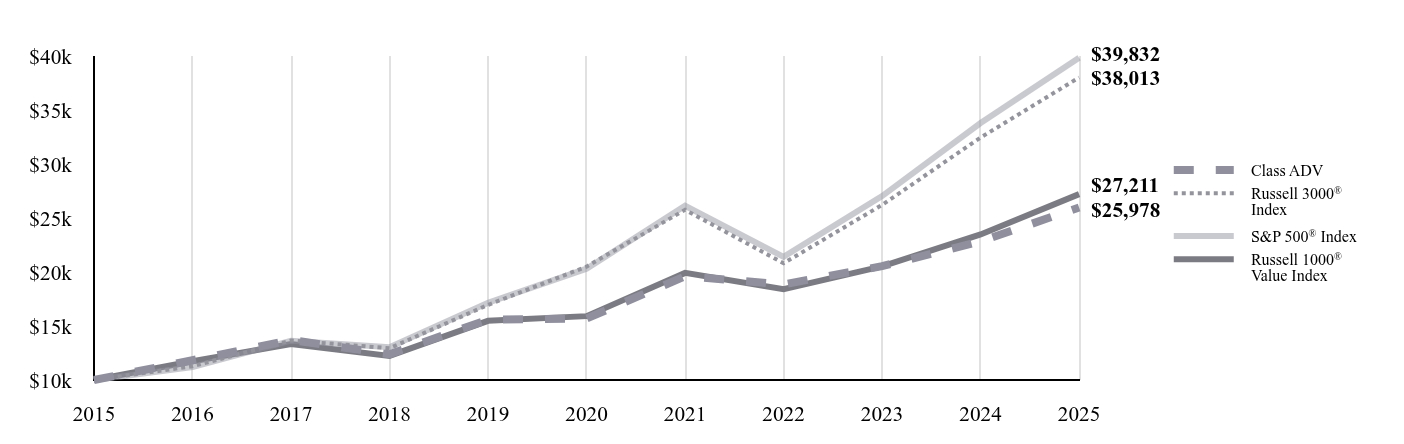
| Factors Affecting Performance [Text Block] |
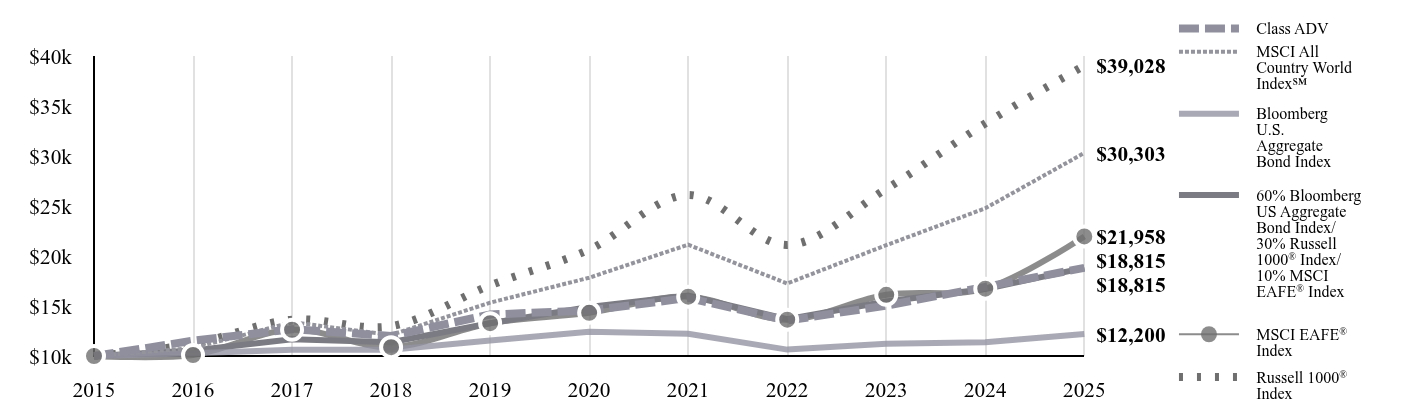
How did the Fund perform in the past 12 months?For the year ended December 31, 2025, the Fund underperformed the blended 60% Bloomberg U.S. Aggregate Bond Index/30% of the Russell 1000 Index/10% MSCI EAFE Index. ↑ Top contributors to performance: Underlying fund selection and asset allocation had positive impacts. The Fund’s overweight to emerging market equities and underweight to U.S. small cap were the biggest contributors. ↓ Top detractors from performance: The Fund’s overweight to S&P 500 health care and underweight to U.S. mid cap were the biggest detractors |
| Line Graph [Table Text Block] |
| Class ADV | MSCI All Country World Index℠ | Bloomberg U.S. Aggregate Bond Index | 60% Bloomberg US Aggregate Bond Index/ 30% Russell 1000® Index/ 10% MSCI EAFE® Index | MSCI EAFE® Index
| Russell 1000® Index |
|---|
2015 | $10,000 | $10,000 | $10,000 | $10,000 | $10,000 | $10,000 |
|---|
2016 | $11,526 | $10,786 | $10,265 | $10,541 | $10,100 | $11,205 |
|---|
2017 | $12,682 | $13,371 | $10,628 | $11,680 | $12,628 | $13,635 |
|---|
2018 | $11,999 | $12,113 | $10,629 | $11,376 | $10,887 | $12,984 |
|---|
2019 | $14,150 | $15,335 | $11,556 | $13,278 | $13,283 | $17,064 |
|---|
2020 | $14,546 | $17,827 | $12,424 | $14,909 | $14,321 | $20,641 |
|---|
2021 | $15,804 | $21,132 | $12,233 | $16,049 | $15,934 | $26,101 |
|---|
2022 | $13,544 | $17,252 | $10,641 | $13,686 | $13,632 | $21,108 |
|---|
2023 | $15,036 | $21,083 | $11,230 | $15,446 | $16,118 | $26,707 |
|---|
2024 | $16,910 | $24,770 | $11,370 | $16,702 | $16,734 | $33,253 |
|---|
2025 | $18,815 | $30,303 | $12,200 | $18,815 | $21,958 | $39,028 |
|---|
|
| Average Annual Return [Table Text Block] |
Fund | 1 Year
| 5 Years
| 10 Years
|
|---|
Class ADV
| 11.27% | 5.28% | 6.52% |
|---|
MSCI All Country World Index℠ | 22.34% | 11.19% | 11.72% |
|---|
Bloomberg U.S. Aggregate Bond Index | 7.30% | -0.36% | 2.01% |
|---|
60% Bloomberg US Aggregate Bond Index/ 30% Russell 1000® Index/ 10% MSCI EAFE® Index | 12.65% | 4.76% | 6.53% |
|---|
MSCI EAFE® Index
| 31.22% | 8.92% | 8.18% |
|---|
Russell 1000® Index | 17.37% | 13.59% | 14.59% |
|---|
|
| AssetsNet |
$ 372,553,770
|
| Holdings Count | Holding |
406
|
| Advisory Fees Paid, Amount |
$ 2,175,808
|
| InvestmentCompanyPortfolioTurnover |
117.00%
|
| Additional Fund Statistics [Text Block] |
- Total Net Assets$372,553,770
- # of Portfolio Holdings406
- Portfolio Turnover Rate117%
- Investment Advisory Fees Paid$2,175,808
|
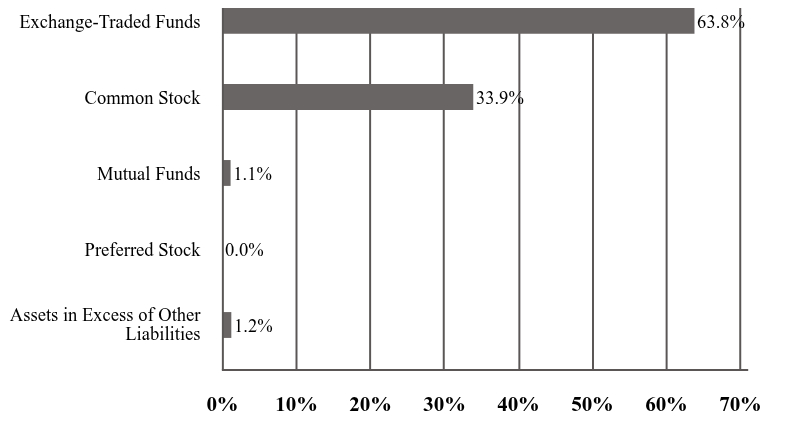
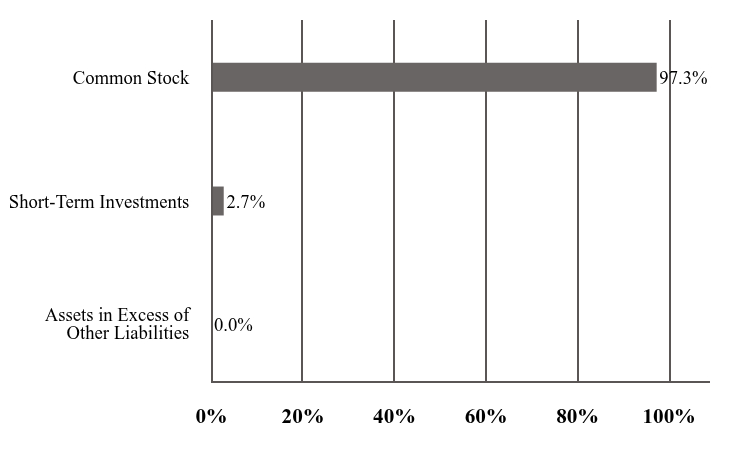
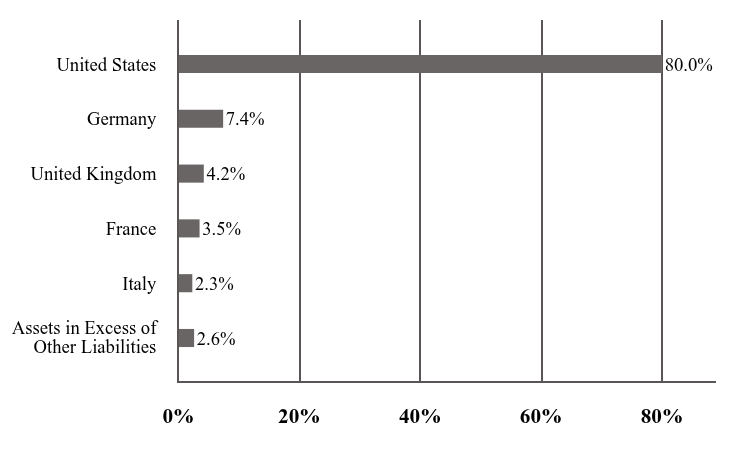
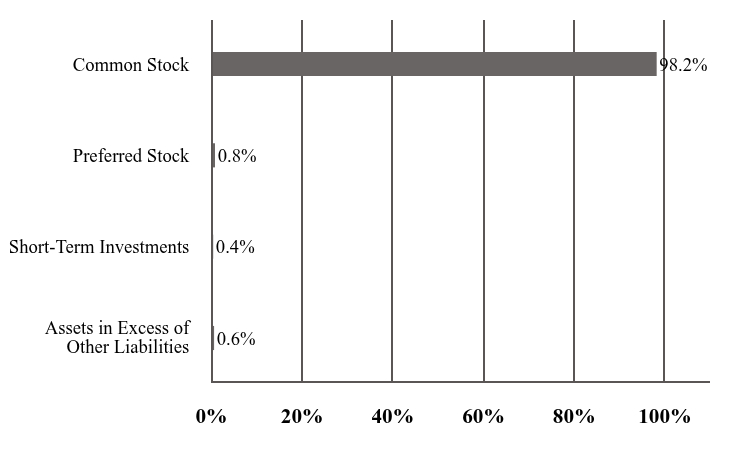
| Holdings [Text Block] |
Investment Type AllocationValue | Value |
|---|
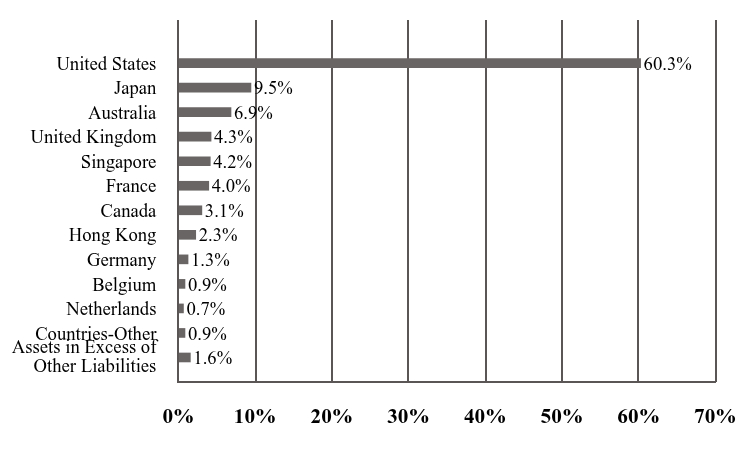
Assets in Excess of Other Liabilities | 1.2% | Preferred Stock | 0.0% | Mutual Funds | 1.1% | Common Stock | 33.9% | Exchange-Traded Funds | 63.8% |
|
| Largest Holdings [Text Block] |
Voya Core Bond ETF | 29.2% |
|---|
Voya Multi-Sector Income ETF | 28.7% |
|---|
iShares Core S&P Mid-Cap ETF | 4.5% |
|---|
NVIDIA Corp. | 2.0% |
|---|
Alphabet, Inc. - Class A | 1.8% |
|---|
Microsoft Corp. | 1.6% |
|---|
Apple, Inc. | 1.3% |
|---|
Voya Multi-Manager Emerging Markets Equity Fund - Class I | 1.1% |
|---|
Invesco S&P 500 Equal Weight ETF | 1.0% |
|---|
Broadcom, Inc. | 0.8% |
|---|
|
| Material Fund Change [Text Block] |
This is a summary of certain changes to the Portfolio during the year ended December 31, 2025. For more complete information, you may review the Portfolio’s Prospectus, as supplemented, at https://individuals.voya.com/production/mutual-fund/prospectuses-reports. Copies of the Prospectus can be requested by calling Voya at 1-800-992-0180. Effective November 15, 2025, the Portfolio (i) made changes to the Portfolio’s principal investment strategies, including changes to the principal risks; (ii) implemented a management fee waiver on investments into affiliated exchange‑traded funds; & (iii) reduced the Portfolio’s standard expense limits. |
| C000028891 |
|
| Shareholder Report [Line Items] |
|
| Fund Name |
Voya Balanced Income Portfolio
|
| Class Name |
Class I
|
| Trading Symbol |
IIFIX
|
| Annual or Semi-Annual Statement [Text Block] |
This annual shareholder report contains important information about Voya Balanced Income Portfolio for the period of January 1, 2025 to December 31, 2025.
|
| Shareholder Report Annual or Semi-Annual |
Annual Shareholder Report
|
| Material Fund Change Notice [Text Block] |
This report describes changes to the Fund that occurred during the reporting period.
|
| Additional Information Phone Number |
1-800-992-0180
|
| Expenses [Text Block] |
What were the Fund’s costs for the last year? (based on a hypothetical $10,000 investment)Class Name | Costs of $10K investment | Costs paid as % of $10K investment |
|---|
Class I | $63 | 0.59% |
|---|
|
| Expenses Paid, Amount |
$ 63
|
| Expense Ratio, Percent |
0.59%
|
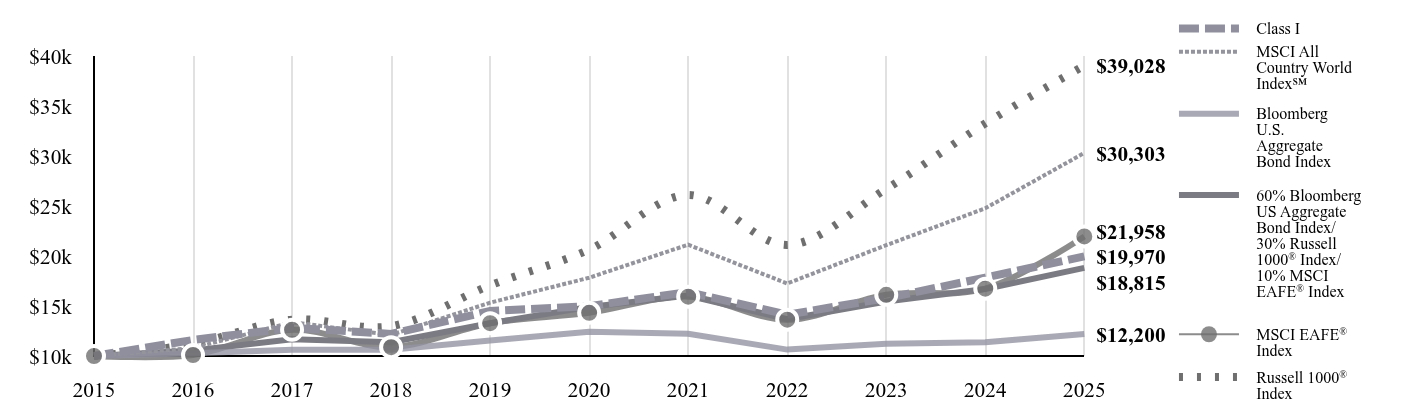
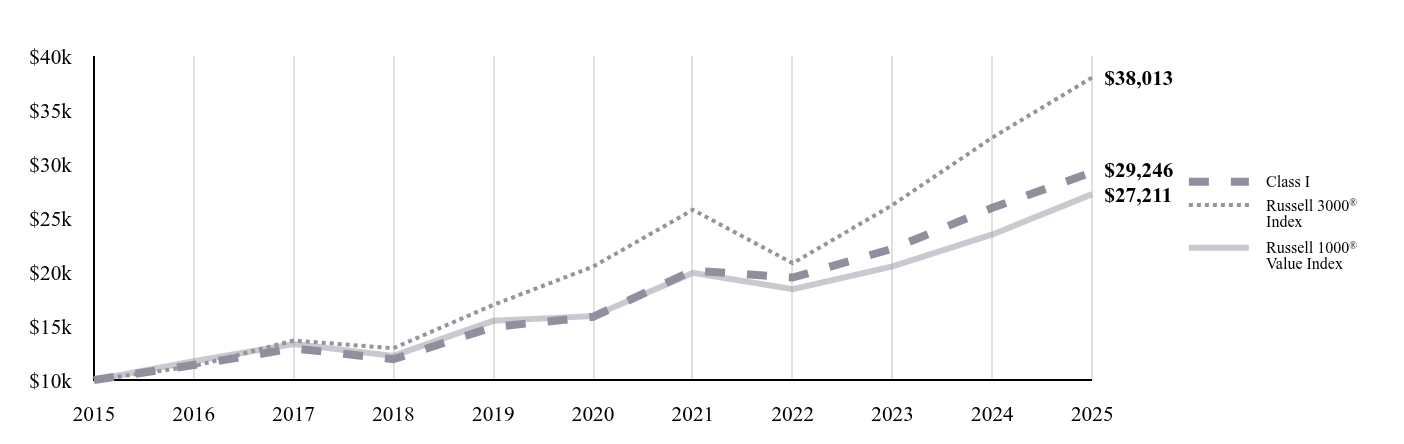
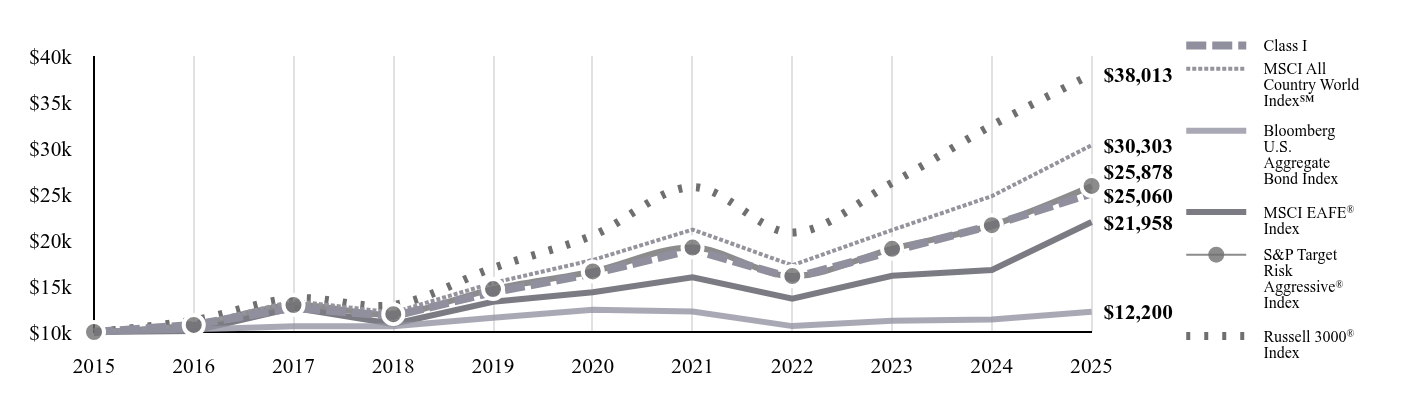
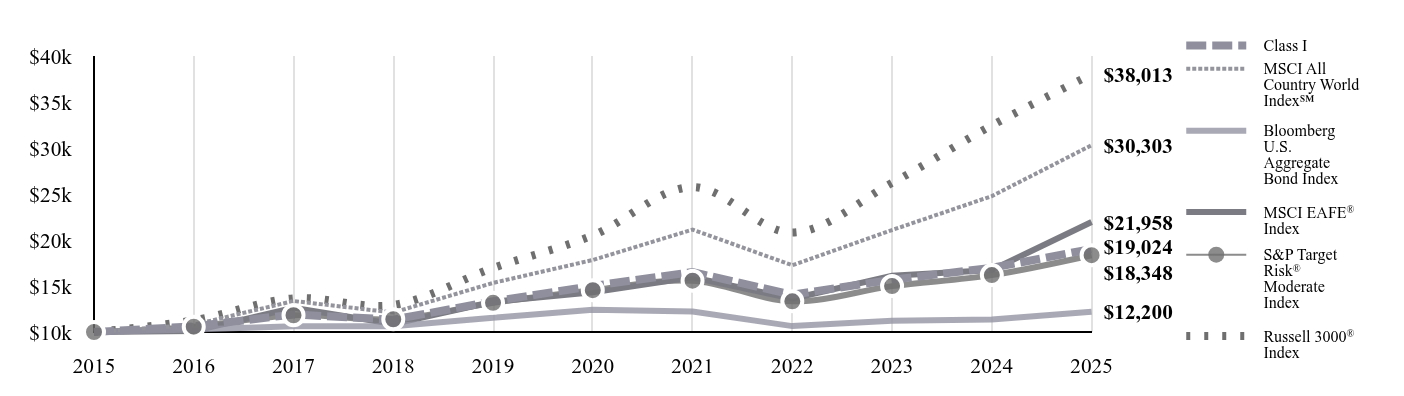
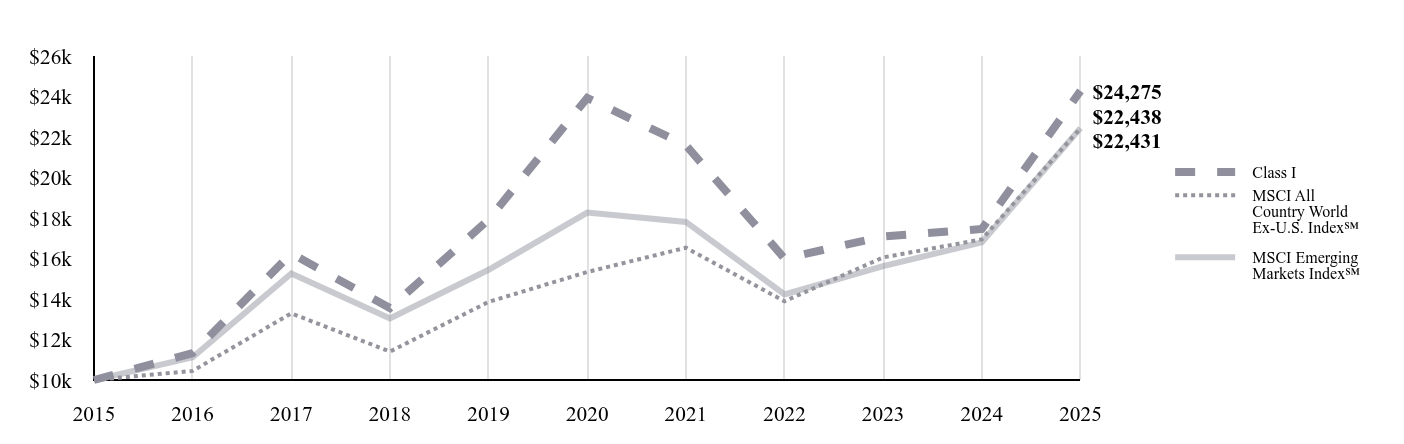
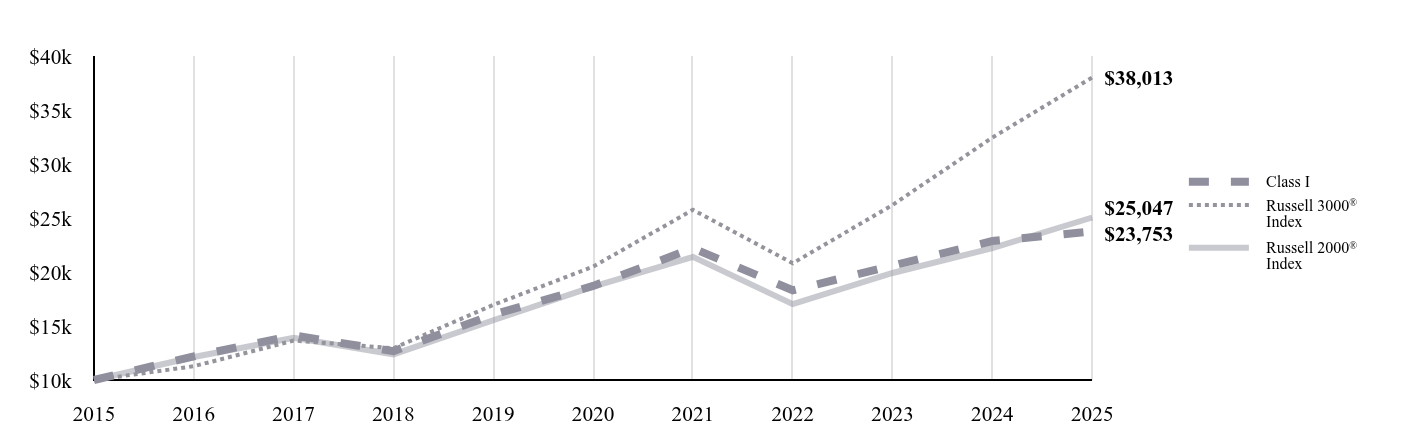
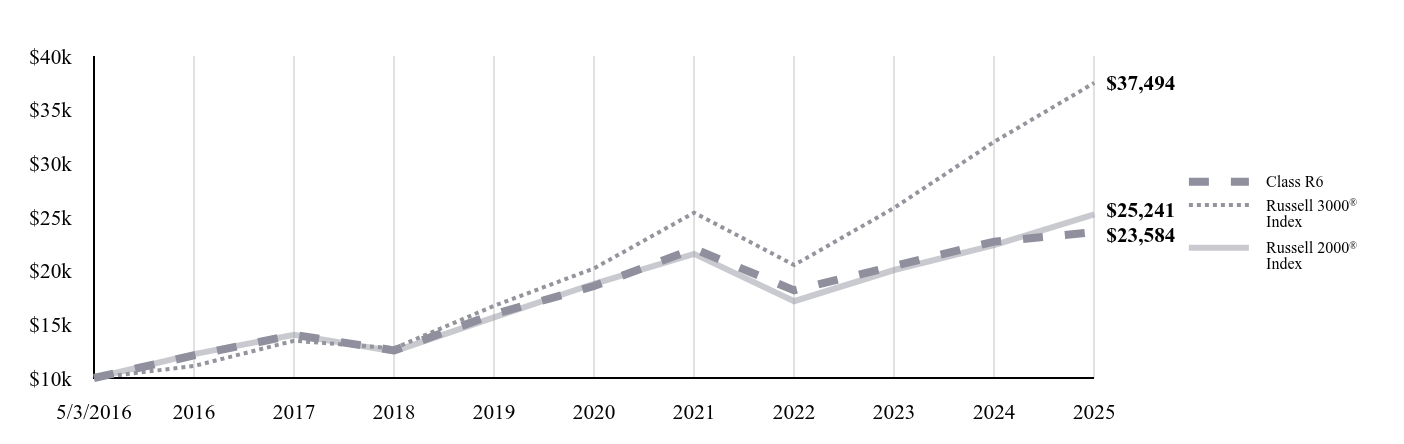
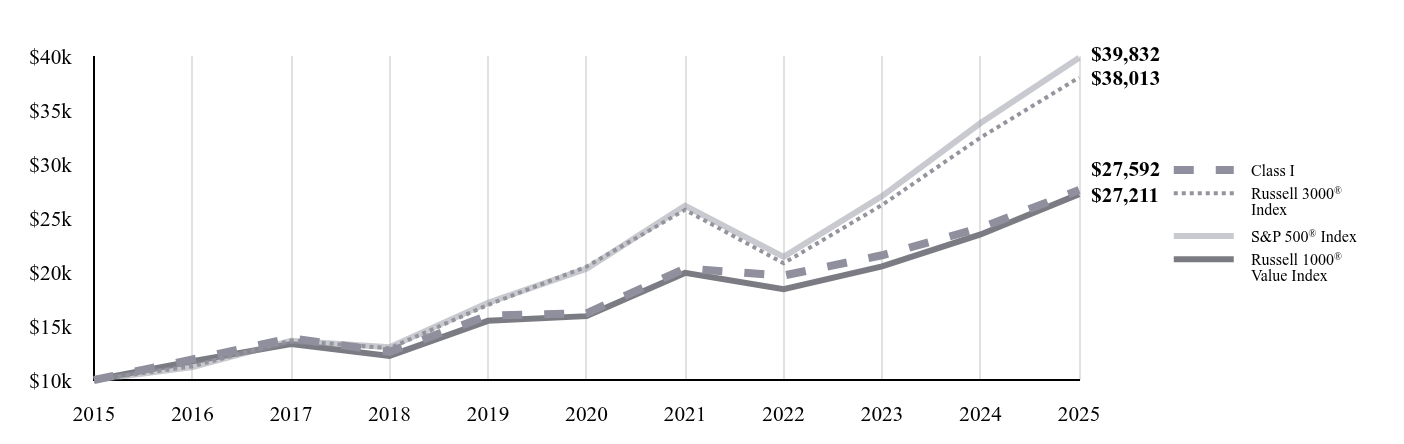
| Factors Affecting Performance [Text Block] |
How did the Fund perform in the past 12 months?For the year ended December 31, 2025, the Fund underperformed the blended 60% Bloomberg U.S. Aggregate Bond Index/30% of the Russell 1000 Index/10% MSCI EAFE Index. ↑ Top contributors to performance: Underlying fund selection and asset allocation had positive impacts. The Fund’s overweight to emerging market equities and underweight to U.S. small cap were the biggest contributors. ↓ Top detractors from performance: The Fund’s overweight to S&P 500 health care and underweight to U.S. mid cap were the biggest detractors |
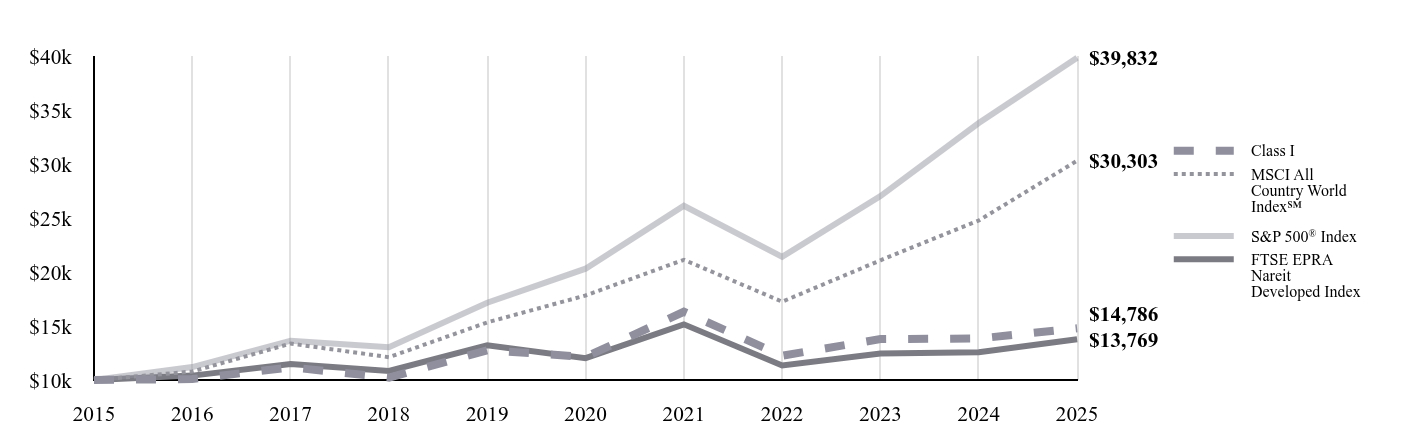
| Line Graph [Table Text Block] |
| Class I | MSCI All Country World Index℠ | Bloomberg U.S. Aggregate Bond Index | 60% Bloomberg US Aggregate Bond Index/ 30% Russell 1000® Index/ 10% MSCI EAFE® Index | MSCI EAFE® Index
| Russell 1000® Index |
|---|
2015 | $10,000 | $10,000 | $10,000 | $10,000 | $10,000 | $10,000 |
|---|
2016 | $11,602 | $10,786 | $10,265 | $10,541 | $10,100 | $11,205 |
|---|
2017 | $12,827 | $13,371 | $10,628 | $11,680 | $12,628 | $13,635 |
|---|
2018 | $12,212 | $12,113 | $10,629 | $11,376 | $10,887 | $12,984 |
|---|
2019 | $14,500 | $15,335 | $11,556 | $13,278 | $13,283 | $17,064 |
|---|
2020 | $14,983 | $17,827 | $12,424 | $14,909 | $14,321 | $20,641 |
|---|
2021 | $16,394 | $21,132 | $12,233 | $16,049 | $15,934 | $26,101 |
|---|
2022 | $14,134 | $17,252 | $10,641 | $13,686 | $13,632 | $21,108 |
|---|
2023 | $15,785 | $21,083 | $11,230 | $15,446 | $16,118 | $26,707 |
|---|
2024 | $17,837 | $24,770 | $11,370 | $16,702 | $16,734 | $33,253 |
|---|
2025 | $19,970 | $30,303 | $12,200 | $18,815 | $21,958 | $39,028 |
|---|
|
| Average Annual Return [Table Text Block] |
Fund | 1 Year
| 5 Years
| 10 Years
|
|---|
Class I
| 11.96% | 5.92% | 7.16% |
|---|
MSCI All Country World Index℠ | 22.34% | 11.19% | 11.72% |
|---|
Bloomberg U.S. Aggregate Bond Index | 7.30% | -0.36% | 2.01% |
|---|
60% Bloomberg US Aggregate Bond Index/ 30% Russell 1000® Index/ 10% MSCI EAFE® Index | 12.65% | 4.76% | 6.53% |
|---|
MSCI EAFE® Index
| 31.22% | 8.92% | 8.18% |
|---|
Russell 1000® Index | 17.37% | 13.59% | 14.59% |
|---|
|
| AssetsNet |
$ 372,553,770
|
| Holdings Count | Holding |
406
|
| Advisory Fees Paid, Amount |
$ 2,175,808
|
| InvestmentCompanyPortfolioTurnover |
117.00%
|
| Additional Fund Statistics [Text Block] |
- Total Net Assets$372,553,770
- # of Portfolio Holdings406
- Portfolio Turnover Rate117%
- Investment Advisory Fees Paid$2,175,808
|
| Holdings [Text Block] |
Investment Type AllocationValue | Value |
|---|
Assets in Excess of Other Liabilities | 1.2% | Preferred Stock | 0.0% | Mutual Funds | 1.1% | Common Stock | 33.9% | Exchange-Traded Funds | 63.8% |
|
| Largest Holdings [Text Block] |
Voya Core Bond ETF | 29.2% |
|---|
Voya Multi-Sector Income ETF | 28.7% |
|---|
iShares Core S&P Mid-Cap ETF | 4.5% |
|---|
NVIDIA Corp. | 2.0% |
|---|
Alphabet, Inc. - Class A | 1.8% |
|---|
Microsoft Corp. | 1.6% |
|---|
Apple, Inc. | 1.3% |
|---|
Voya Multi-Manager Emerging Markets Equity Fund - Class I | 1.1% |
|---|
Invesco S&P 500 Equal Weight ETF | 1.0% |
|---|
Broadcom, Inc. | 0.8% |
|---|
|
| Material Fund Change [Text Block] |
This is a summary of certain changes to the Portfolio during the year ended December 31, 2025. For more complete information, you may review the Portfolio’s Prospectus, as supplemented, at https://individuals.voya.com/production/mutual-fund/prospectuses-reports. Copies of the Prospectus can be requested by calling Voya at 1-800-992-0180. Effective November 15, 2025, the Portfolio (i) made changes to the Portfolio’s principal investment strategies, including changes to the principal risks; (ii) implemented a management fee waiver on investments into affiliated exchange‑traded funds; & (iii) reduced the Portfolio’s standard expense limits. |
| C000028892 |
|
| Shareholder Report [Line Items] |
|
| Fund Name |
Voya Balanced Income Portfolio
|
| Class Name |
Class S
|
| Trading Symbol |
IIFSX
|
| Annual or Semi-Annual Statement [Text Block] |
This annual shareholder report contains important information about Voya Balanced Income Portfolio for the period of January 1, 2025 to December 31, 2025.
|
| Shareholder Report Annual or Semi-Annual |
Annual Shareholder Report
|
| Material Fund Change Notice [Text Block] |
This report describes changes to the Fund that occurred during the reporting period.
|
| Additional Information Phone Number |
1-800-992-0180
|
| Expenses [Text Block] |
What were the Fund’s costs for the last year? (based on a hypothetical $10,000 investment)Class Name | Costs of $10K investment | Costs paid as % of $10K investment |
|---|
Class S | $90 | 0.85% |
|---|
|
| Expenses Paid, Amount |
$ 90
|
| Expense Ratio, Percent |
0.85%
|
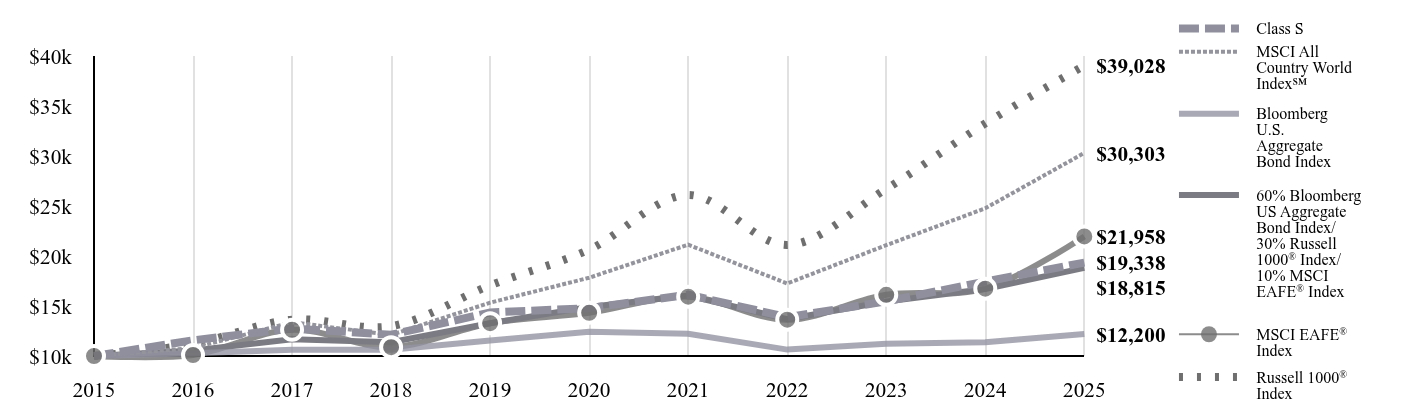
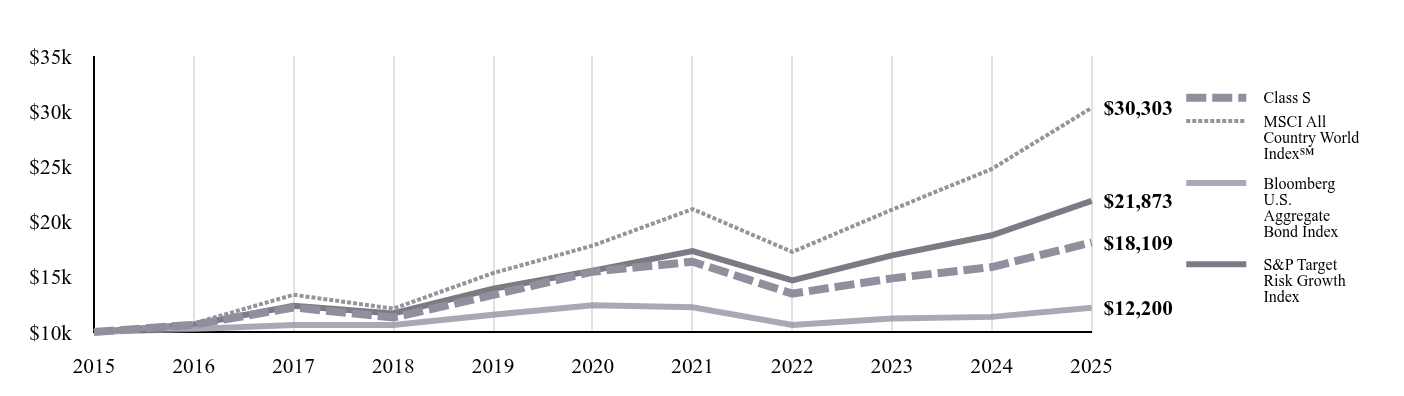
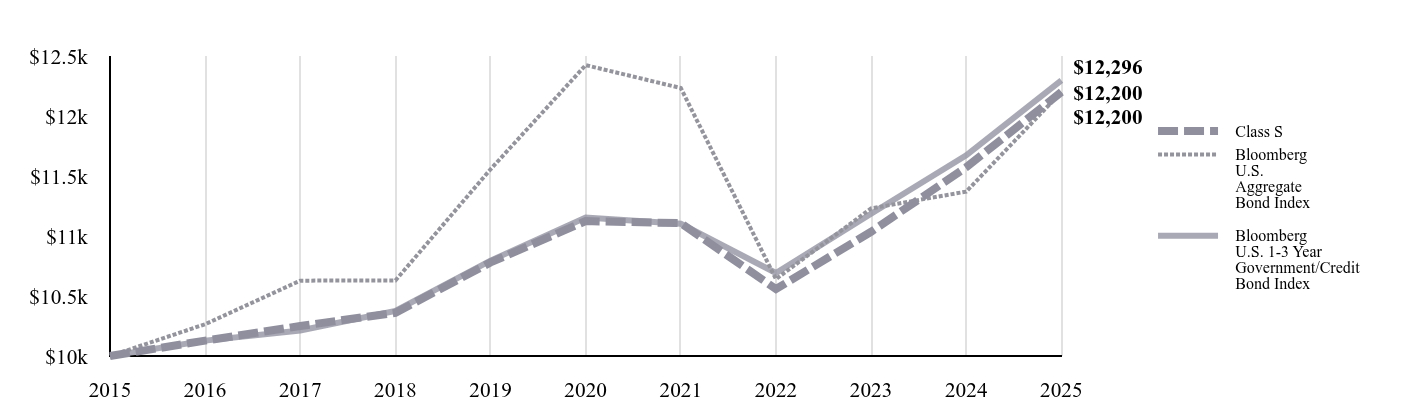
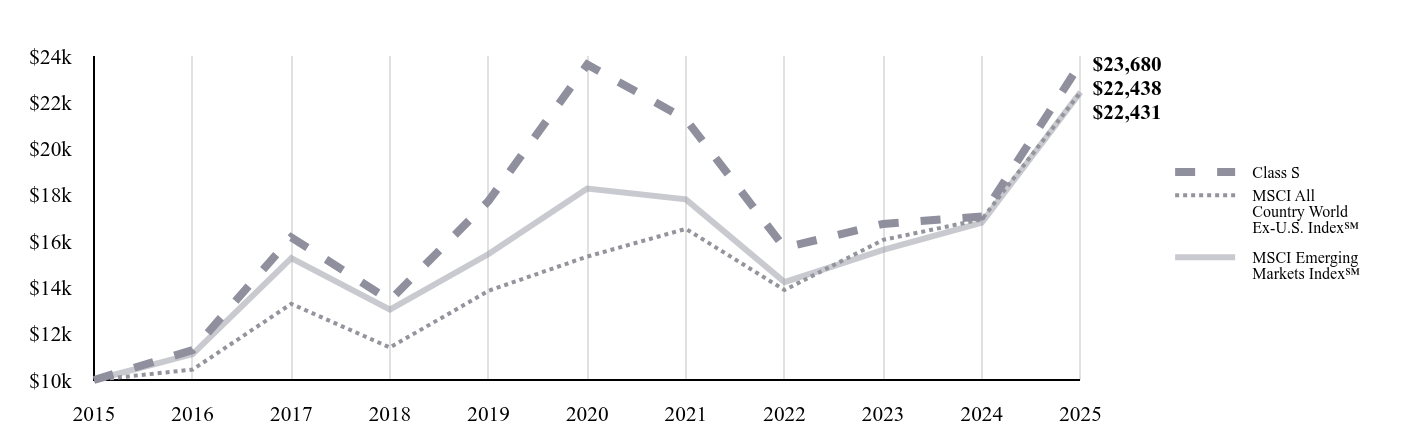
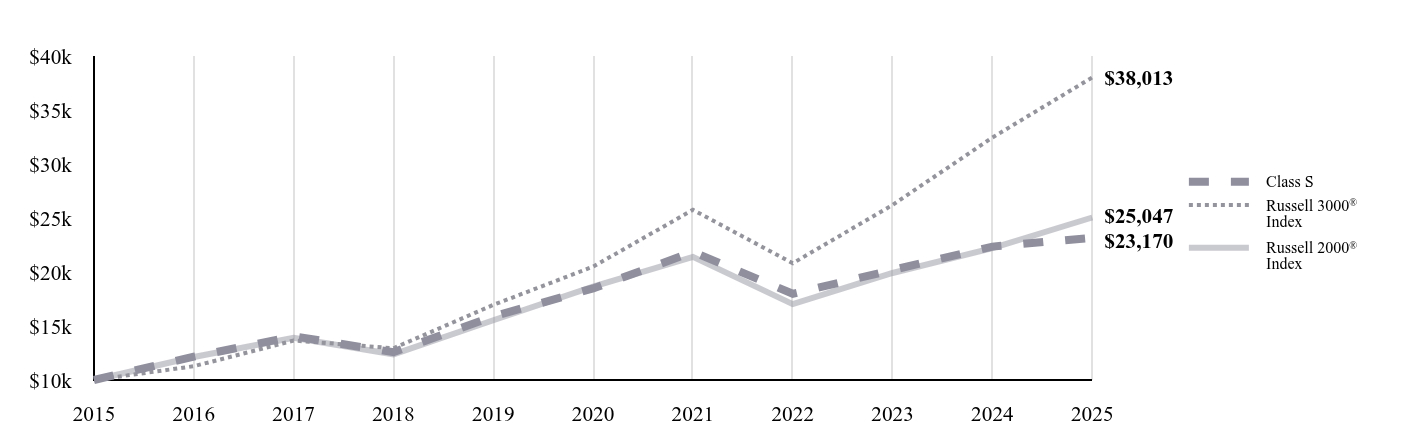
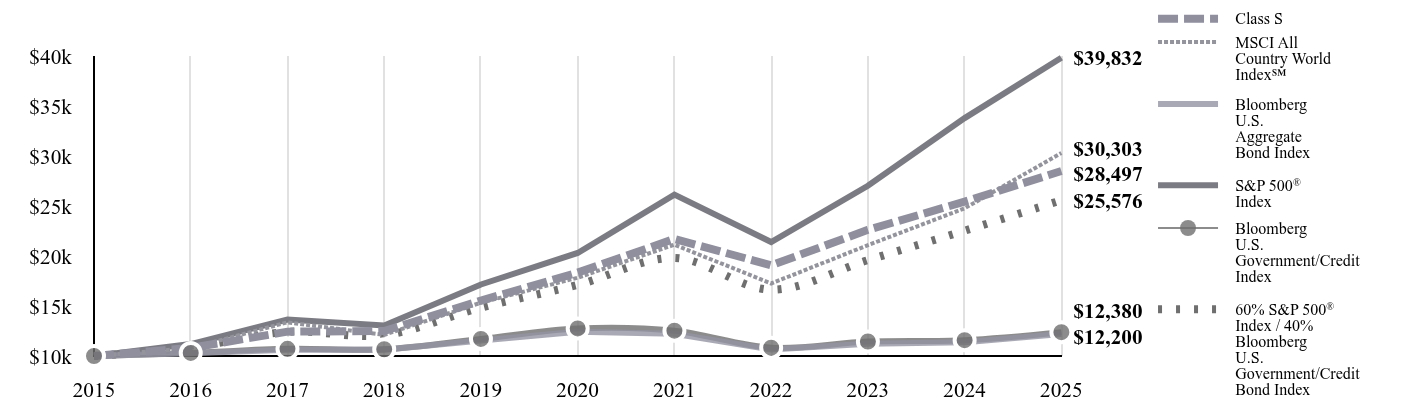
| Factors Affecting Performance [Text Block] |
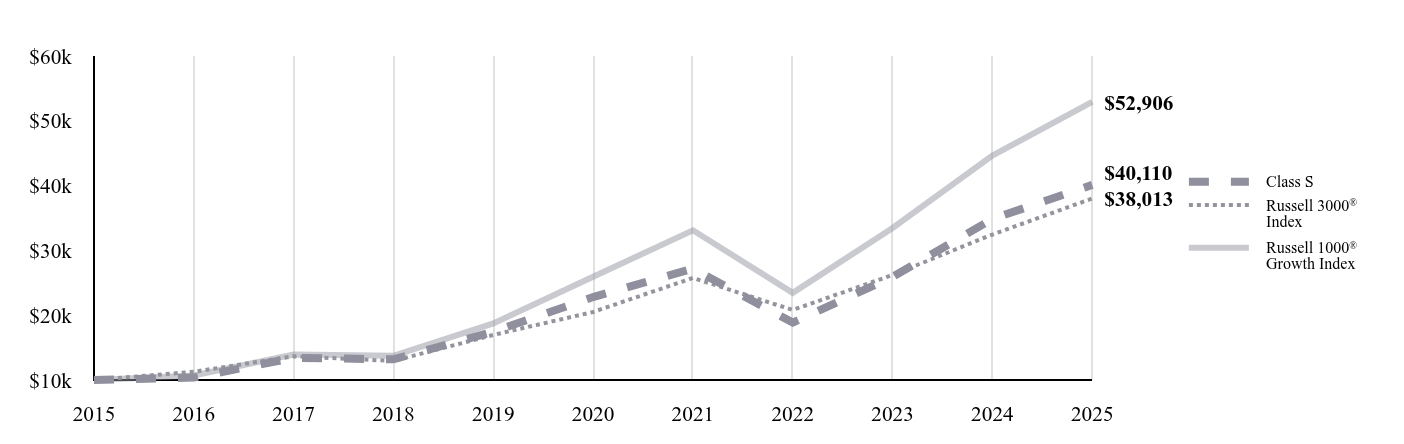
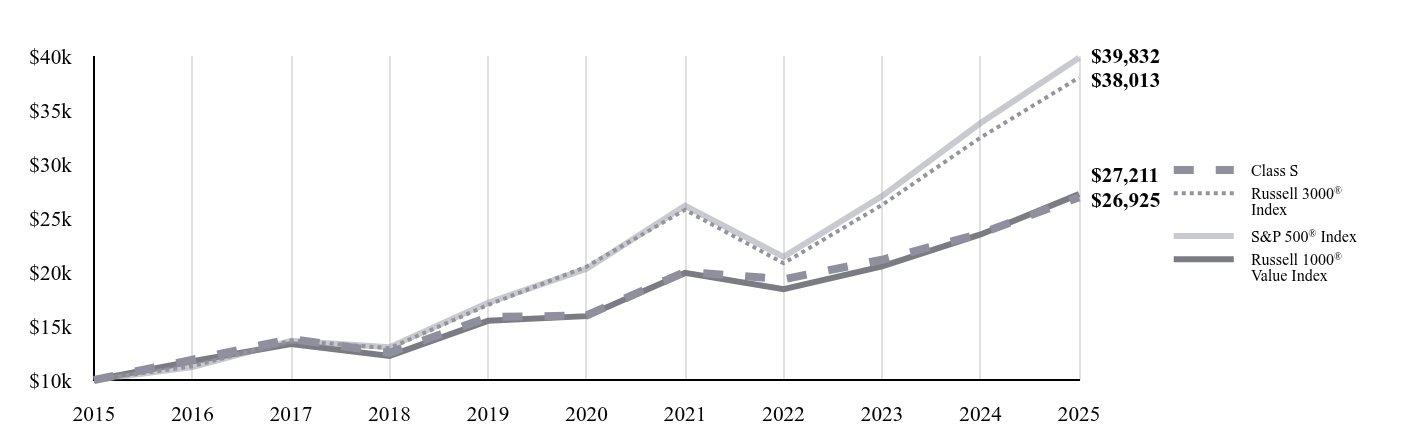
How did the Fund perform in the past 12 months?For the year ended December 31, 2025, the Fund underperformed the blended 60% Bloomberg U.S. Aggregate Bond Index/30% of the Russell 1000 Index/10% MSCI EAFE Index. ↑ Top contributors to performance: Underlying fund selection and asset allocation had positive impacts. The Fund’s overweight to emerging market equities and underweight to U.S. small cap were the biggest contributors. ↓ Top detractors from performance: The Fund’s overweight to S&P 500 health care and underweight to U.S. mid cap were the biggest detractors |
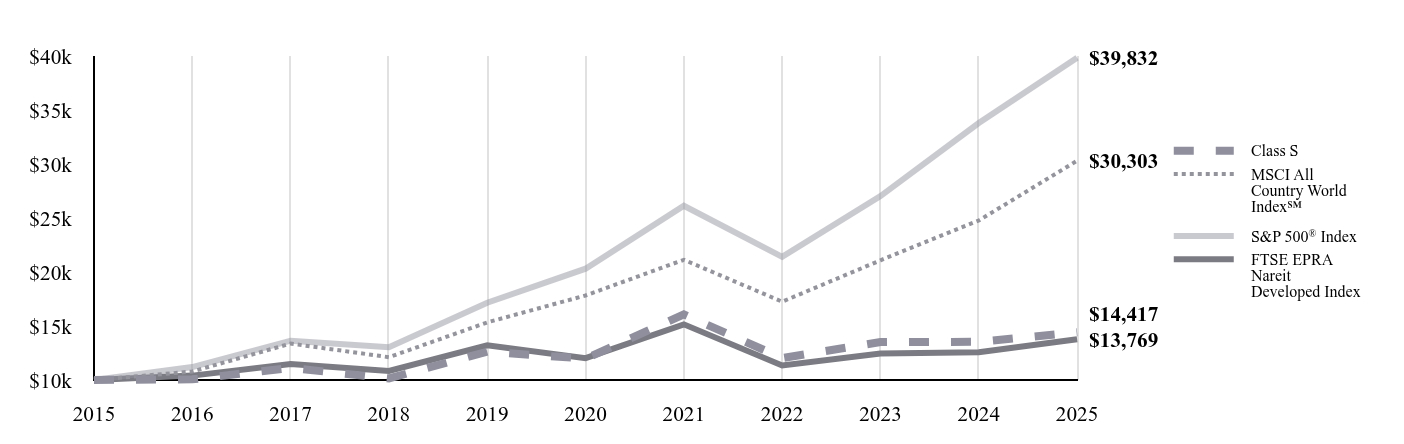
| Line Graph [Table Text Block] |
| Class S | MSCI All Country World Index℠ | Bloomberg U.S. Aggregate Bond Index | 60% Bloomberg US Aggregate Bond Index/ 30% Russell 1000® Index/ 10% MSCI EAFE® Index | MSCI EAFE® Index
| Russell 1000® Index |
|---|
2015 | $10,000 | $10,000 | $10,000 | $10,000 | $10,000 | $10,000 |
|---|
2016 | $11,568 | $10,786 | $10,265 | $10,541 | $10,100 | $11,205 |
|---|
2017 | $12,763 | $13,371 | $10,628 | $11,680 | $12,628 | $13,635 |
|---|
2018 | $12,123 | $12,113 | $10,629 | $11,376 | $10,887 | $12,984 |
|---|
2019 | $14,353 | $15,335 | $11,556 | $13,278 | $13,283 | $17,064 |
|---|
2020 | $14,789 | $17,827 | $12,424 | $14,909 | $14,321 | $20,641 |
|---|
2021 | $16,133 | $21,132 | $12,233 | $16,049 | $15,934 | $26,101 |
|---|
2022 | $13,880 | $17,252 | $10,641 | $13,686 | $13,632 | $21,108 |
|---|
2023 | $15,464 | $21,083 | $11,230 | $15,446 | $16,118 | $26,707 |
|---|
2024 | $17,442 | $24,770 | $11,370 | $16,702 | $16,734 | $33,253 |
|---|
2025 | $19,338 | $30,303 | $12,200 | $18,815 | $21,958 | $39,028 |
|---|
|
| Average Annual Return [Table Text Block] |
Fund | 1 Year
| 5 Years
| 10 Years
|
|---|
Class S
| 10.87% | 5.51% | 6.82% |
|---|
MSCI All Country World Index℠ | 22.34% | 11.19% | 11.72% |
|---|
Bloomberg U.S. Aggregate Bond Index | 7.30% | -0.36% | 2.01% |
|---|
60% Bloomberg US Aggregate Bond Index/ 30% Russell 1000® Index/ 10% MSCI EAFE® Index | 12.65% | 4.76% | 6.53% |
|---|
MSCI EAFE® Index
| 31.22% | 8.92% | 8.18% |
|---|
Russell 1000® Index | 17.37% | 13.59% | 14.59% |
|---|
|
| AssetsNet |
$ 372,553,770
|
| Holdings Count | Holding |
406
|
| Advisory Fees Paid, Amount |
$ 2,175,808
|
| InvestmentCompanyPortfolioTurnover |
117.00%
|
| Additional Fund Statistics [Text Block] |
- Total Net Assets$372,553,770
- # of Portfolio Holdings406
- Portfolio Turnover Rate117%
- Investment Advisory Fees Paid$2,175,808
|
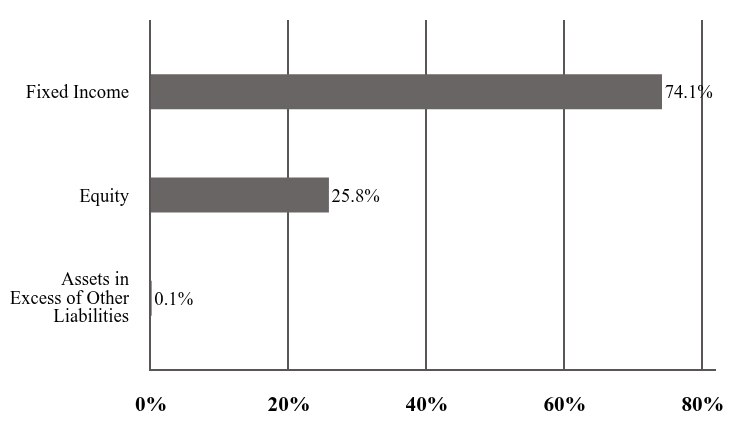
| Holdings [Text Block] |
Investment Type AllocationValue | Value |
|---|
Assets in Excess of Other Liabilities | 1.2% | Preferred Stock | 0.0% | Mutual Funds | 1.1% | Common Stock | 33.9% | Exchange-Traded Funds | 63.8% |
|
| Largest Holdings [Text Block] |
Voya Core Bond ETF | 29.2% |
|---|
Voya Multi-Sector Income ETF | 28.7% |
|---|
iShares Core S&P Mid-Cap ETF | 4.5% |
|---|
NVIDIA Corp. | 2.0% |
|---|
Alphabet, Inc. - Class A | 1.8% |
|---|
Microsoft Corp. | 1.6% |
|---|
Apple, Inc. | 1.3% |
|---|
Voya Multi-Manager Emerging Markets Equity Fund - Class I | 1.1% |
|---|
Invesco S&P 500 Equal Weight ETF | 1.0% |
|---|
Broadcom, Inc. | 0.8% |
|---|
|
| Material Fund Change [Text Block] |
This is a summary of certain changes to the Portfolio during the year ended December 31, 2025. For more complete information, you may review the Portfolio’s Prospectus, as supplemented, at https://individuals.voya.com/production/mutual-fund/prospectuses-reports. Copies of the Prospectus can be requested by calling Voya at 1-800-992-0180. Effective November 15, 2025, the Portfolio (i) made changes to the Portfolio’s principal investment strategies, including changes to the principal risks; (ii) implemented a management fee waiver on investments into affiliated exchange‑traded funds; & (iii) reduced the Portfolio’s standard expense limits. |
| C000028893 |
|
| Shareholder Report [Line Items] |
|
| Fund Name |
Voya Balanced Income Portfolio
|
| Class Name |
Class S2
|
| Trading Symbol |
IIFTX
|
| Annual or Semi-Annual Statement [Text Block] |
This annual shareholder report contains important information about Voya Balanced Income Portfolio for the period of January 1, 2025 to December 31, 2025.
|
| Shareholder Report Annual or Semi-Annual |
Annual Shareholder Report
|
| Material Fund Change Notice [Text Block] |
This report describes changes to the Fund that occurred during the reporting period.
|
| Additional Information Phone Number |
1-800-992-0180
|
| Expenses [Text Block] |
What were the Fund’s costs for the last year? (based on a hypothetical $10,000 investment)Class Name | Costs of $10K investment | Costs paid as % of $10K investment |
|---|
Class S2 | $104 | 0.99% |
|---|
|
| Expenses Paid, Amount |
$ 104
|
| Expense Ratio, Percent |
0.99%
|
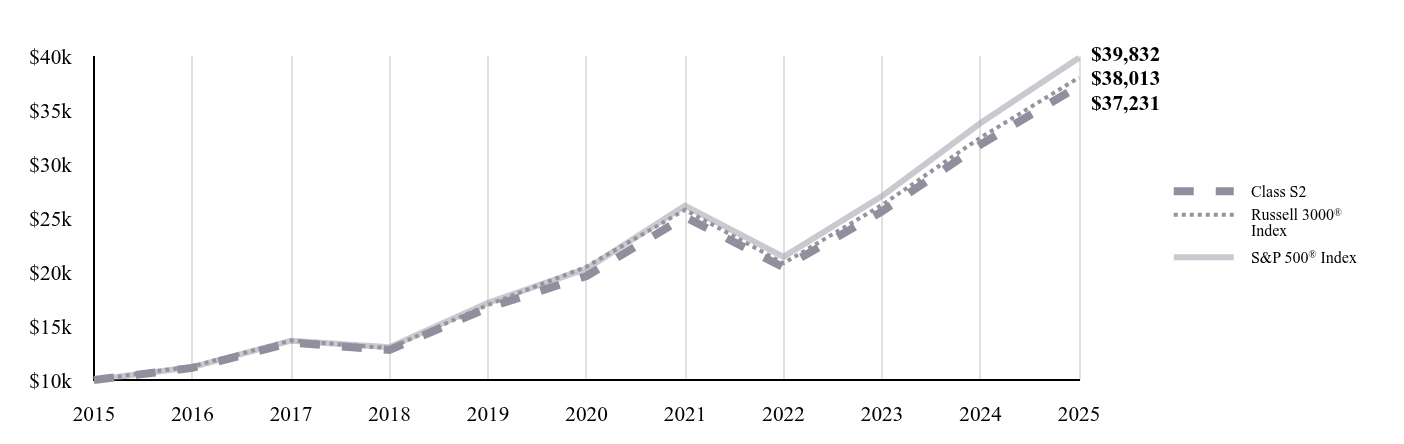
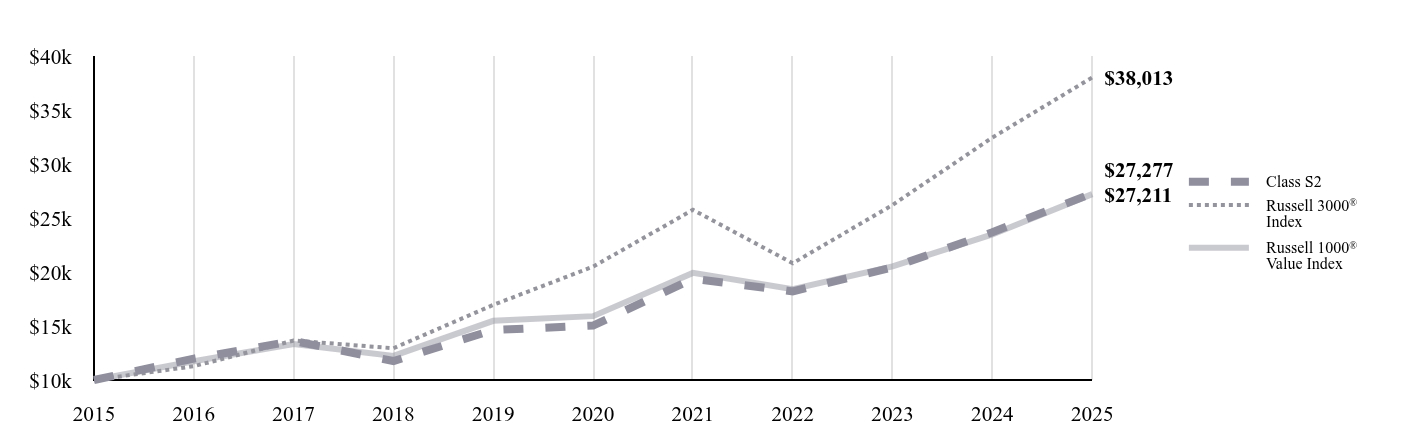
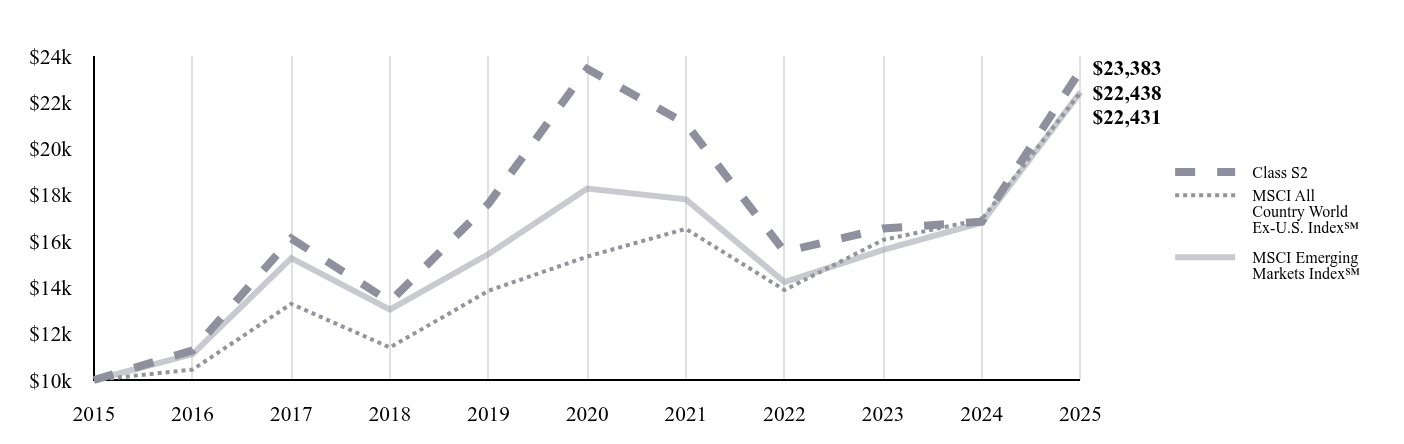
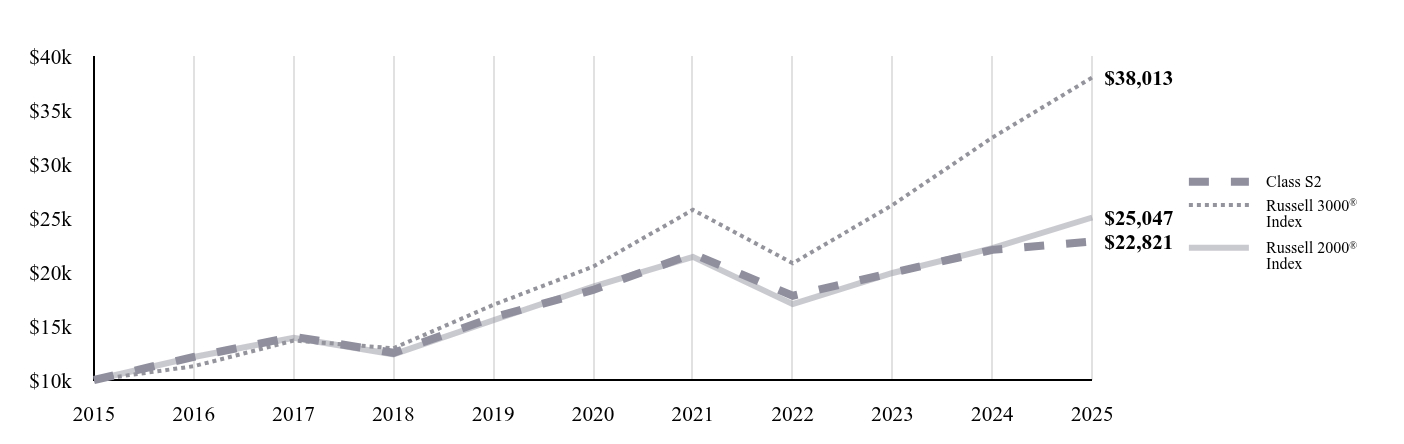
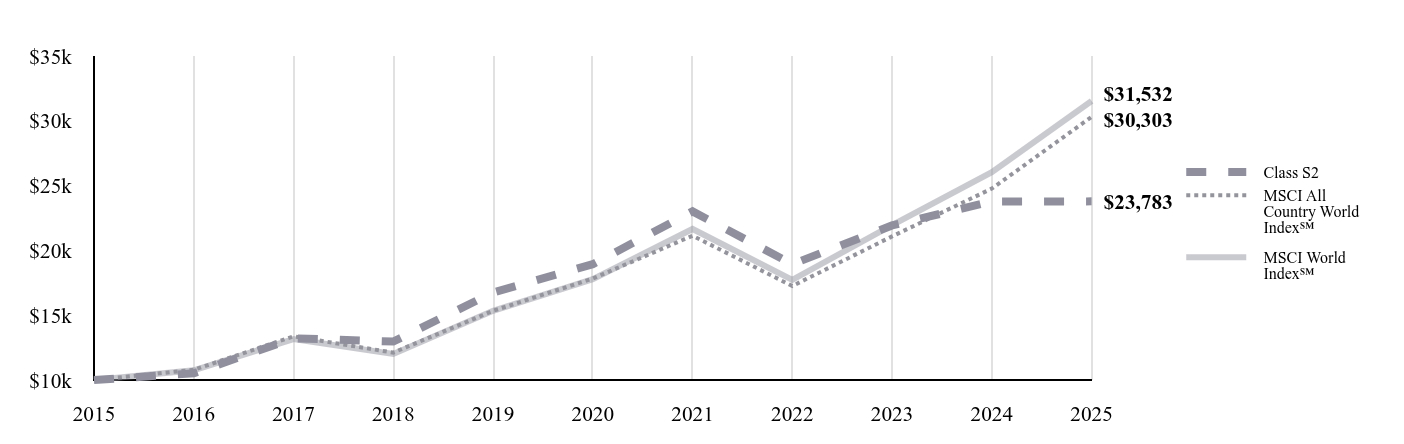
| Factors Affecting Performance [Text Block] |
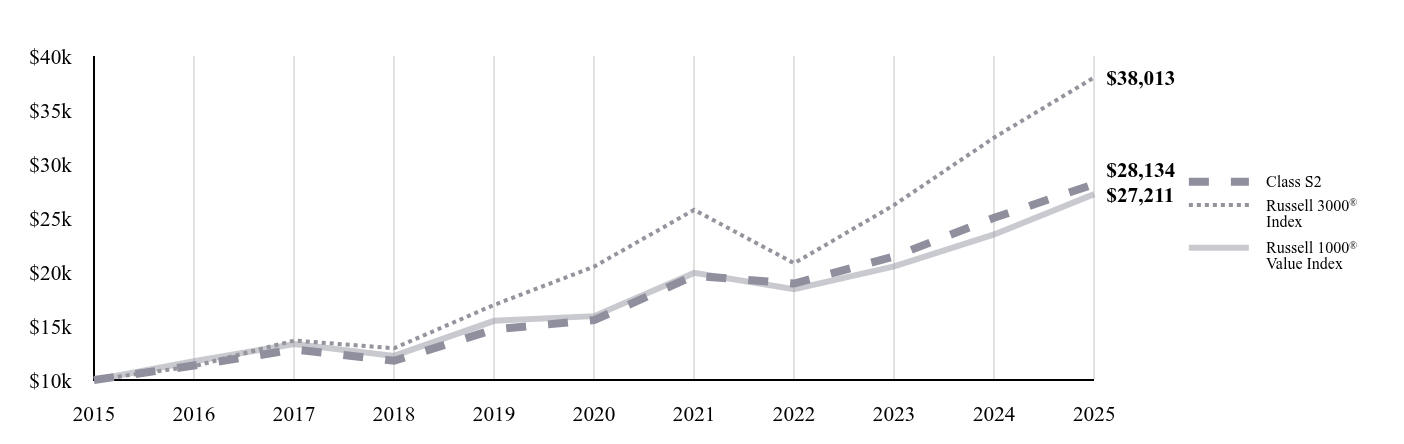
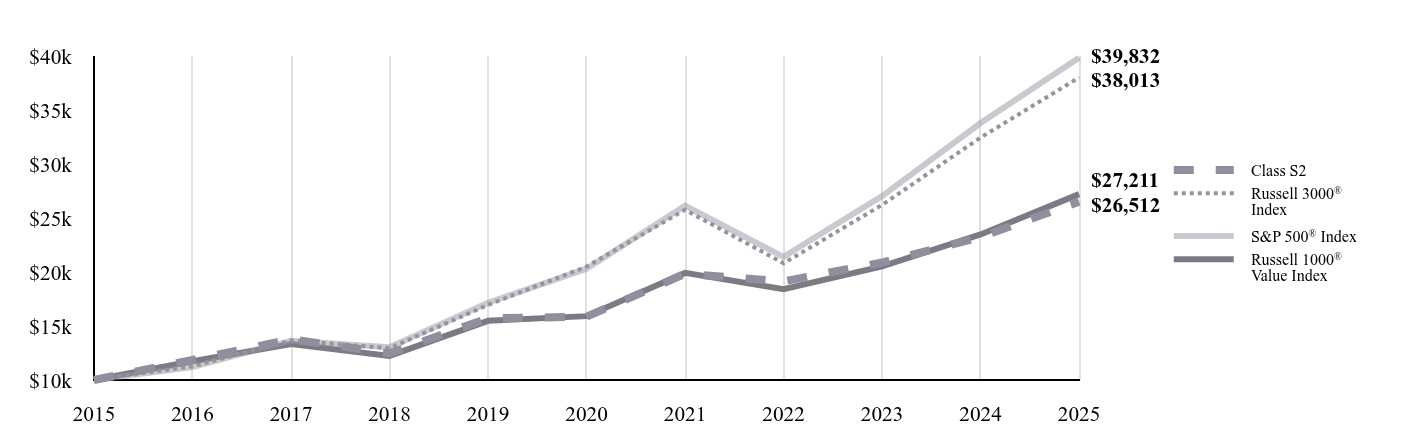
How did the Fund perform in the past 12 months?For the year ended December 31, 2025, the Fund underperformed the blended 60% Bloomberg U.S. Aggregate Bond Index/30% of the Russell 1000 Index/10% MSCI EAFE Index. ↑ Top contributors to performance: Underlying fund selection and asset allocation had positive impacts. The Fund’s overweight to emerging market equities and underweight to U.S. small cap were the biggest contributors. ↓ Top detractors from performance: The Fund’s overweight to S&P 500 health care and underweight to U.S. mid cap were the biggest detractors |
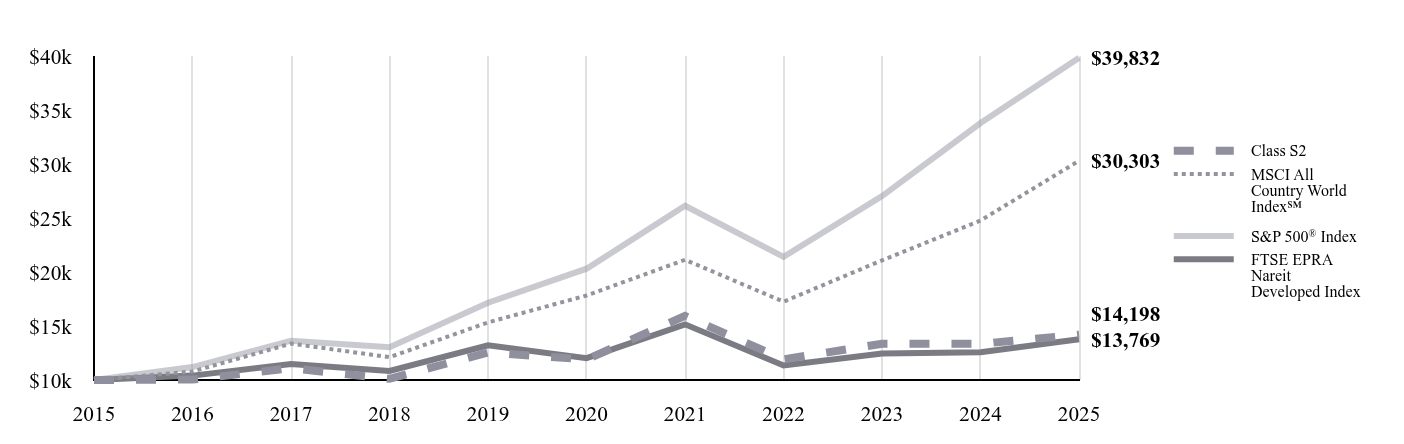
| Line Graph [Table Text Block] |
| Class S2 | MSCI All Country World Index℠ | Bloomberg U.S. Aggregate Bond Index | 60% Bloomberg US Aggregate Bond Index/ 30% Russell 1000® Index/ 10% MSCI EAFE® Index | MSCI EAFE® Index
| Russell 1000® Index |
|---|
2015 | $10,000 | $10,000 | $10,000 | $10,000 | $10,000 | $10,000 |
|---|
2016 | $11,552 | $10,786 | $10,265 | $10,541 | $10,100 | $11,205 |
|---|
2017 | $12,726 | $13,371 | $10,628 | $11,680 | $12,628 | $13,635 |
|---|
2018 | $12,070 | $12,113 | $10,629 | $11,376 | $10,887 | $12,984 |
|---|
2019 | $14,260 | $15,335 | $11,556 | $13,278 | $13,283 | $17,064 |
|---|
2020 | $14,691 | $17,827 | $12,424 | $14,909 | $14,321 | $20,641 |
|---|
2021 | $15,996 | $21,132 | $12,233 | $16,049 | $15,934 | $26,101 |
|---|
2022 | $13,734 | $17,252 | $10,641 | $13,686 | $13,632 | $21,108 |
|---|
2023 | $15,273 | $21,083 | $11,230 | $15,446 | $16,118 | $26,707 |
|---|
2024 | $17,206 | $24,770 | $11,370 | $16,702 | $16,734 | $33,253 |
|---|
2025 | $19,114 | $30,303 | $12,200 | $18,815 | $21,958 | $39,028 |
|---|
|
| Average Annual Return [Table Text Block] |
Fund | 1 Year
| 5 Years
| 10 Years
|
|---|
Class S2
| 11.09% | 5.41% | 6.69% |
|---|
MSCI All Country World Index℠ | 22.34% | 11.19% | 11.72% |
|---|
Bloomberg U.S. Aggregate Bond Index | 7.30% | -0.36% | 2.01% |
|---|
60% Bloomberg US Aggregate Bond Index/ 30% Russell 1000® Index/ 10% MSCI EAFE® Index | 12.65% | 4.76% | 6.53% |
|---|
MSCI EAFE® Index
| 31.22% | 8.92% | 8.18% |
|---|
Russell 1000® Index | 17.37% | 13.59% | 14.59% |
|---|
|
| AssetsNet |
$ 372,553,770
|
| Holdings Count | Holding |
406
|
| Advisory Fees Paid, Amount |
$ 2,175,808
|
| InvestmentCompanyPortfolioTurnover |
117.00%
|
| Additional Fund Statistics [Text Block] |
- Total Net Assets$372,553,770
- # of Portfolio Holdings406
- Portfolio Turnover Rate117%
- Investment Advisory Fees Paid$2,175,808
|
| Holdings [Text Block] |
Investment Type AllocationValue | Value |
|---|
Assets in Excess of Other Liabilities | 1.2% | Preferred Stock | 0.0% | Mutual Funds | 1.1% | Common Stock | 33.9% | Exchange-Traded Funds | 63.8% |
|
| Largest Holdings [Text Block] |
Voya Core Bond ETF | 29.2% |
|---|
Voya Multi-Sector Income ETF | 28.7% |
|---|
iShares Core S&P Mid-Cap ETF | 4.5% |
|---|
NVIDIA Corp. | 2.0% |
|---|
Alphabet, Inc. - Class A | 1.8% |
|---|
Microsoft Corp. | 1.6% |
|---|
Apple, Inc. | 1.3% |
|---|
Voya Multi-Manager Emerging Markets Equity Fund - Class I | 1.1% |
|---|
Invesco S&P 500 Equal Weight ETF | 1.0% |
|---|
Broadcom, Inc. | 0.8% |
|---|
|
| Material Fund Change [Text Block] |
This is a summary of certain changes to the Portfolio during the year ended December 31, 2025. For more complete information, you may review the Portfolio’s Prospectus, as supplemented, at https://individuals.voya.com/production/mutual-fund/prospectuses-reports. Copies of the Prospectus can be requested by calling Voya at 1-800-992-0180. Effective November 15, 2025, the Portfolio (i) made changes to the Portfolio’s principal investment strategies, including changes to the principal risks; (ii) implemented a management fee waiver on investments into affiliated exchange‑traded funds; & (iii) reduced the Portfolio’s standard expense limits. |
| C000125916 |
|
| Shareholder Report [Line Items] |
|
| Fund Name |
Voya Global Perspectives<sup style="inset: 1.5px 0px 4px; box-sizing: border-box; color: rgb(0, 0, 0); display: inline; flex-wrap: nowrap; font-size: 9px; font-weight: 400; grid-area: auto; line-height: 0px; margin: 0px; overflow: visible; position: relative; text-align: left; text-align-last: auto; white-space-collapse: preserve-breaks;">®</sup> Portfolio
|
| Class Name |
Class ADV
|
| Trading Symbol |
IPARX
|
| Annual or Semi-Annual Statement [Text Block] |
This annual shareholder report contains important information about Voya Global Perspectives® Portfolio for the period of January 1, 2025 to December 31, 2025.
|
| Shareholder Report Annual or Semi-Annual |
Annual Shareholder Report
|
| Material Fund Change Notice [Text Block] |
This report describes changes to the Fund that occurred during the reporting period.
|
| Additional Information Phone Number |
1-800-992-0180
|
| Expenses [Text Block] |
What were the Fund’s costs for the last year? (based on a hypothetical $10,000 investment)Class Name | Costs of $10K investment | Costs paid as % of $10K investment |
|---|
Class ADV | $56 | 0.52% |
|---|
|
| Expenses Paid, Amount |
$ 56
|
| Expense Ratio, Percent |
0.52%
|
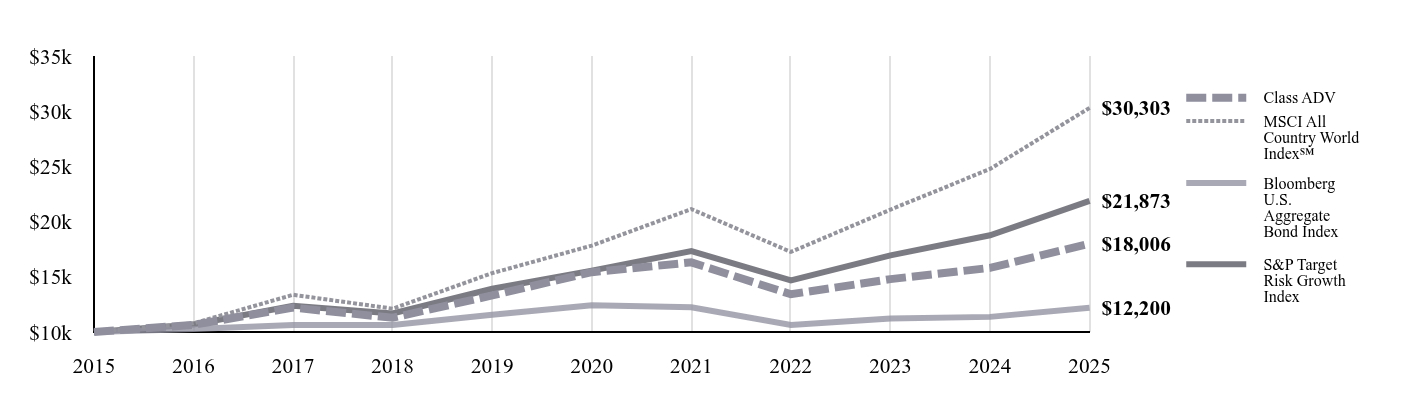
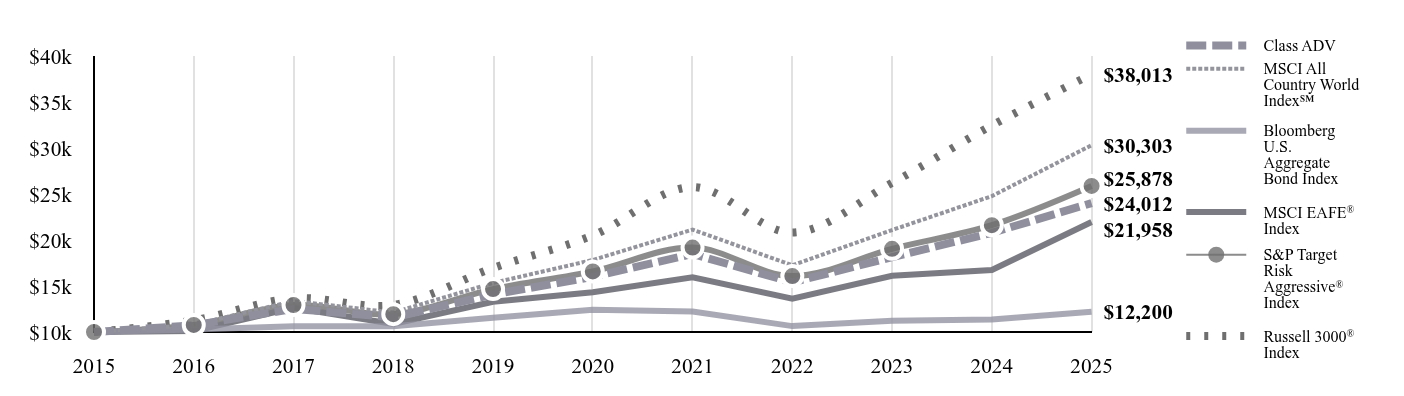
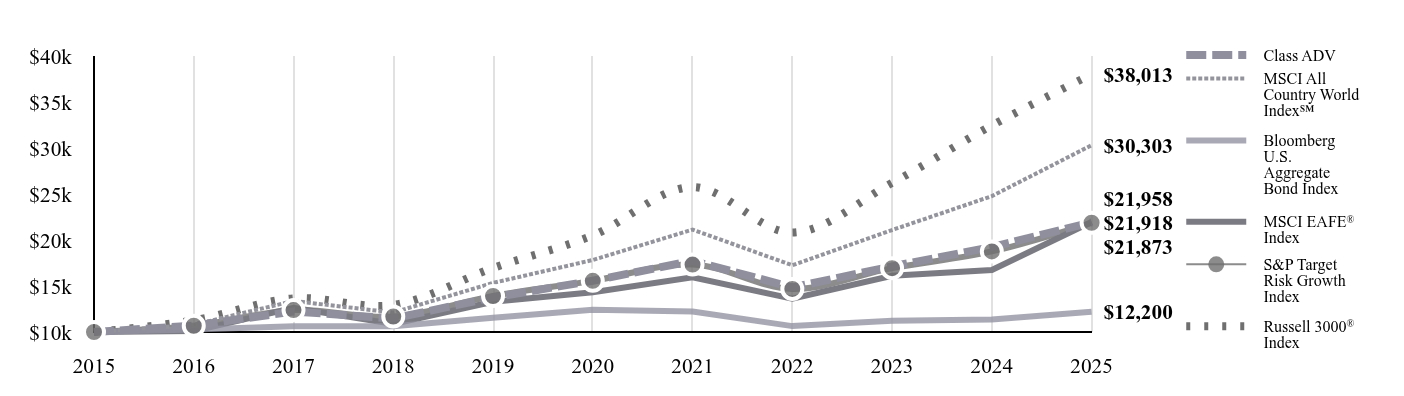
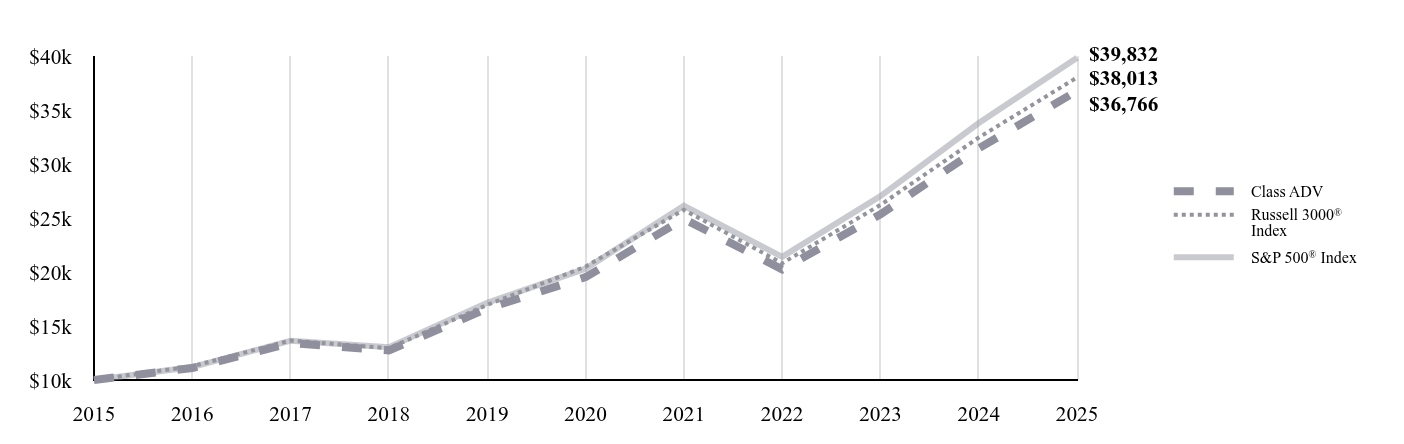
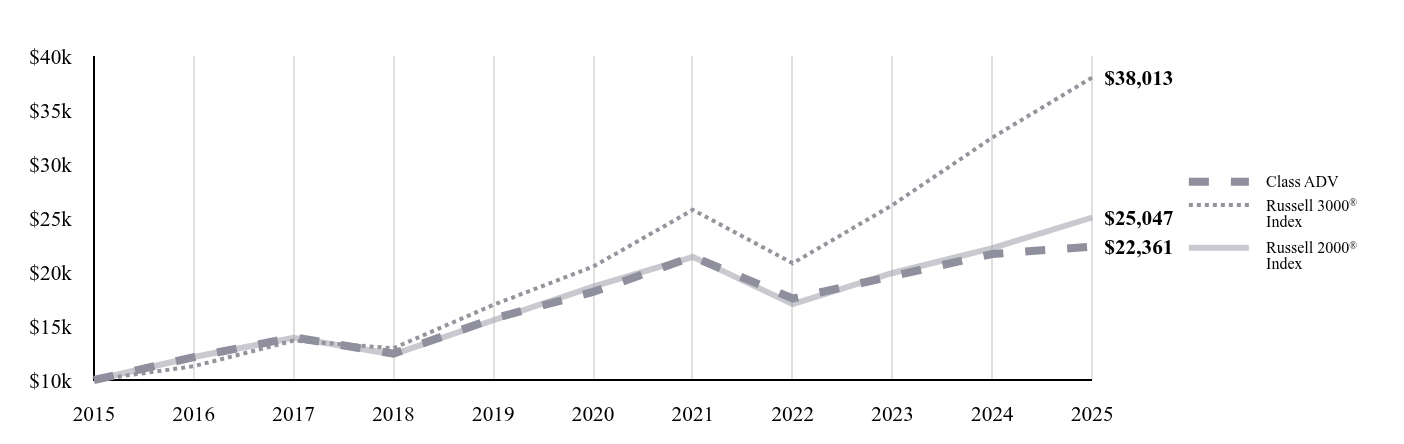
| Factors Affecting Performance [Text Block] |
How did the Fund perform in the past 12 months?For the year ended December 31, 2025, the Fund underperformed the S&P Target Risk Growth® Index. Underlying fund selection and asset allocation detracted. ↑ Top contributors to performance: An underweight in U.S. large cap equities & overweight to emerging market equities were the biggest contributors. On an individual holdings level, Voya Multi-Manager Emerging Equity, Voya Global Bond,& Voya High Yield were contributors. ↓ Top detractors from performance: Overweights to U.S. real estate investment trusts, U.S. small cap & U.S. mid cap as well as underweight in international equities were the biggest detractors. On an individual holdings level, Voya Mid Cap Opportunities, VY® CBRE Global Real Estate & Voya Small Company Portfolios were key detractors. |
| Line Graph [Table Text Block] |
| Class ADV | MSCI All Country World Index℠ | Bloomberg U.S. Aggregate Bond Index | S&P Target Risk Growth Index |
|---|
2015 | $10,000 | $10,000 | $10,000 | $10,000 |
|---|
2016 | $10,649 | $10,786 | $10,265 | $10,677 |
|---|
2017 | $12,205 | $13,371 | $10,628 | $12,378 |
|---|
2018 | $11,289 | $12,113 | $10,629 | $11,674 |
|---|
2019 | $13,317 | $15,335 | $11,556 | $13,915 |
|---|
2020 | $15,421 | $17,827 | $12,424 | $15,561 |
|---|
2021 | $16,307 | $21,132 | $12,233 | $17,330 |
|---|
2022 | $13,421 | $17,252 | $10,641 | $14,684 |
|---|
2023 | $14,789 | $21,083 | $11,230 | $16,942 |
|---|
2024 | $15,810 | $24,770 | $11,370 | $18,760 |
|---|
2025 | $18,006 | $30,303 | $12,200 | $21,873 |
|---|
|
| Average Annual Return [Table Text Block] |
Fund | 1 Year
| 5 Years
| 10 Years
|
|---|
Class ADV
| 13.89% | 3.15% | 6.06% |
|---|
MSCI All Country World Index℠ | 22.34% | 11.19% | 11.72% |
|---|
Bloomberg U.S. Aggregate Bond Index | 7.30% | -0.36% | 2.01% |
|---|
S&P Target Risk Growth Index | 16.59% | 7.05% | 8.14% |
|---|
|
| AssetsNet |
$ 9,346,502
|
| Holdings Count | Holding |
10
|
| Advisory Fees Paid, Amount |
$ 27,017
|
| InvestmentCompanyPortfolioTurnover |
37.00%
|
| Additional Fund Statistics [Text Block] |
- Total Net Assets$9,346,502
- # of Portfolio Holdings10
- Portfolio Turnover Rate37%
- Investment Advisory Fees Paid$27,017
|
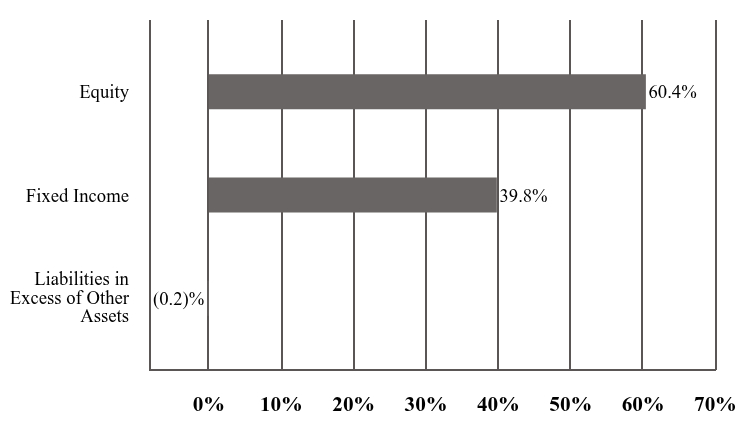
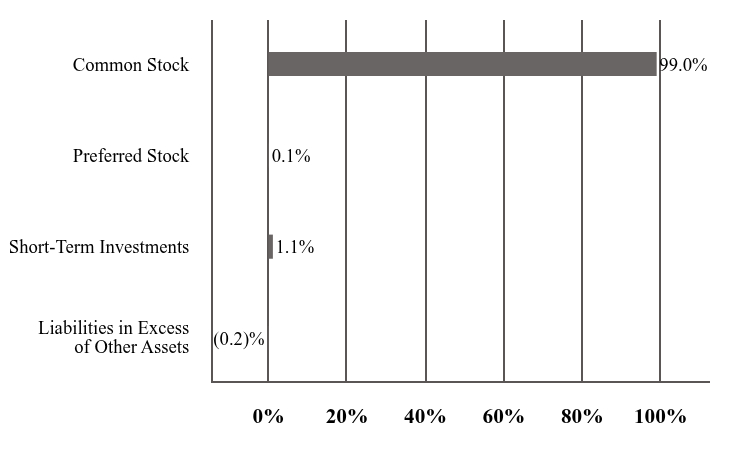
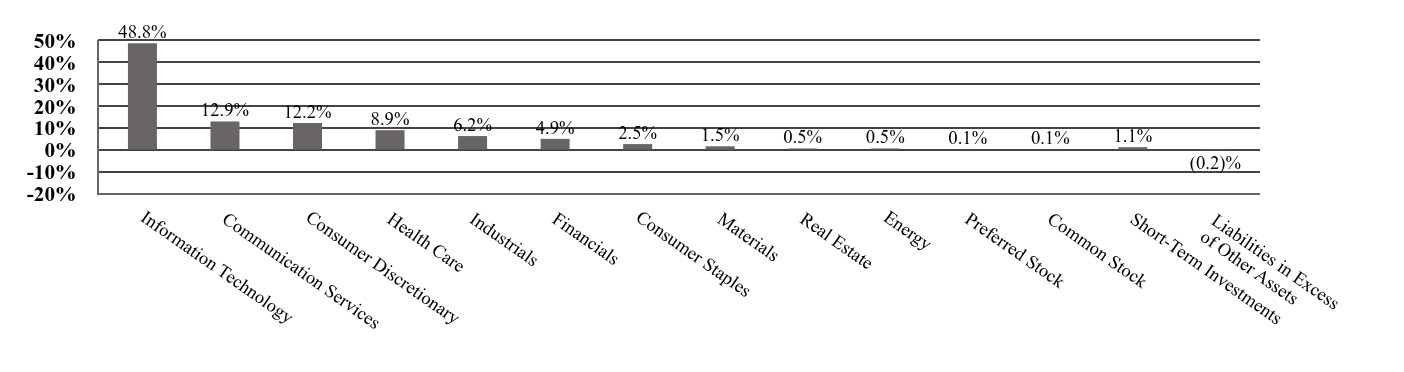
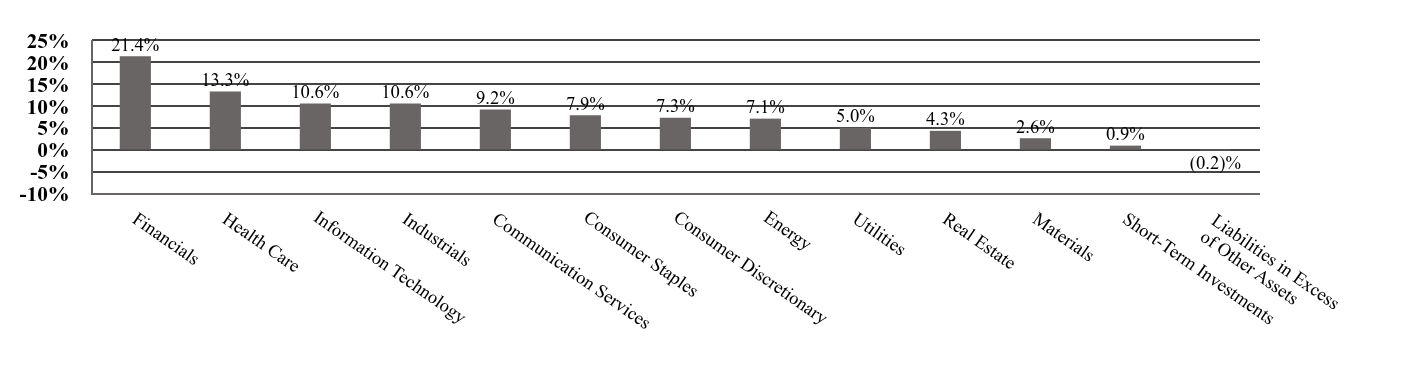
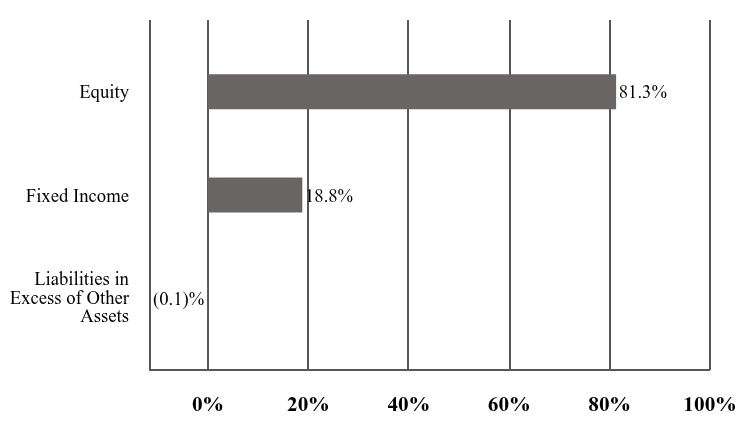
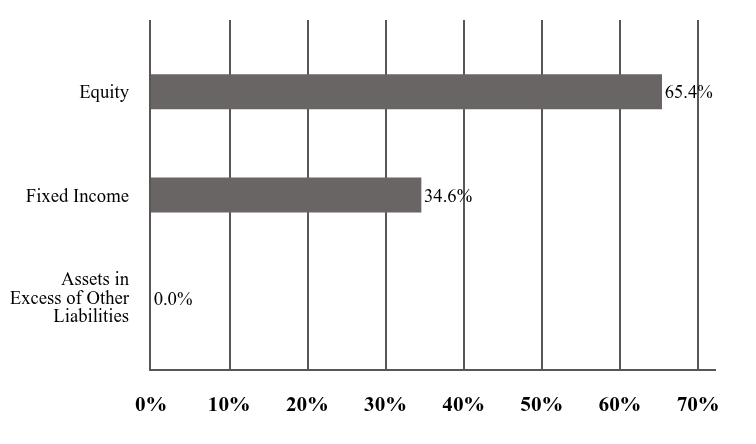
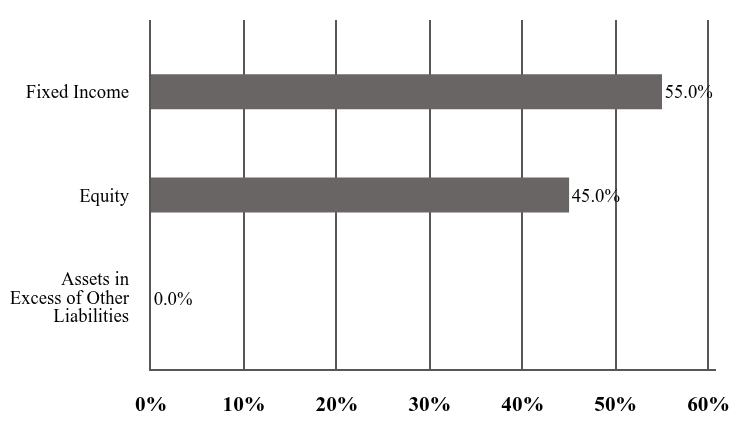
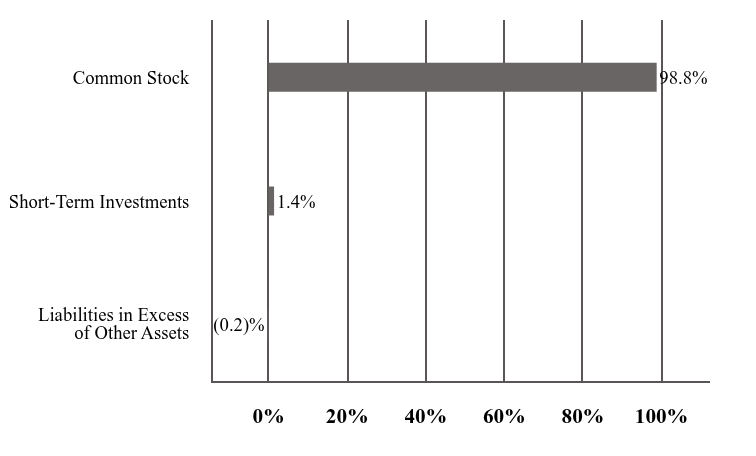
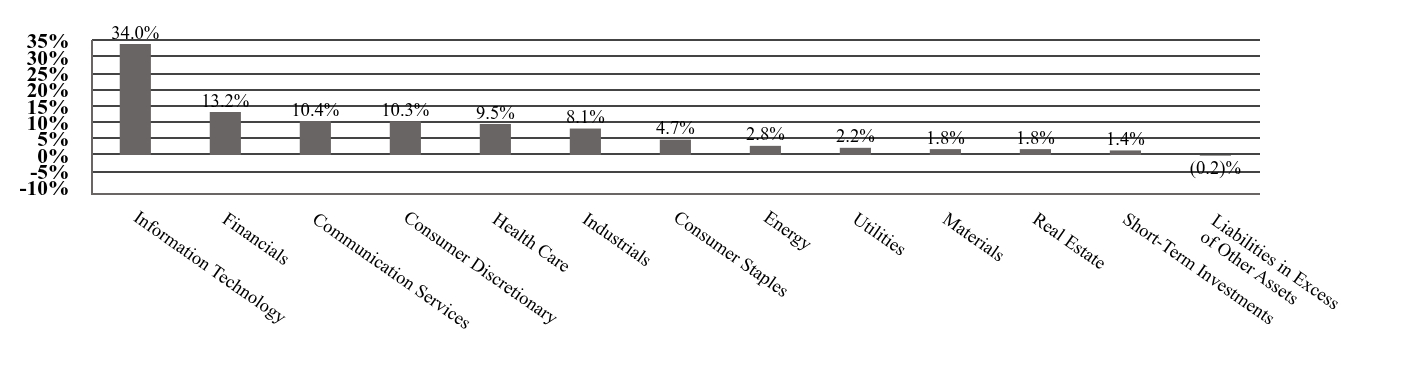
| Holdings [Text Block] |
Value | Value |
|---|
Liabilities in Excess of Other Assets | (0.2)% | Fixed Income | 39.8% | Equity | 60.4% |
|
| Largest Holdings [Text Block] |
Voya Multi-Manager Emerging Markets Equity Fund - Class I | 10.7% |
|---|
Voya International Index Portfolio - Class I | 10.3% |
|---|
Voya Small Company Portfolio - Class R6 | 10.1% |
|---|
Voya Index Plus LargeCap Portfolio - Class I | 10.1% |
|---|
Voya High Yield Portfolio - Class I | 10.0% |
|---|
Voya GNMA Income Fund - Class R6 | 10.0% |
|---|
Voya U.S. Bond Index Portfolio - Class I | 9.9% |
|---|
Voya Global Bond Fund - Class R6 | 9.9% |
|---|
VY® CBRE Global Real Estate Portfolio - Class I | 9.8% |
|---|
Voya MidCap Opportunities Portfolio - Class R6 | 9.4% |
|---|
|
| Material Fund Change [Text Block] |
This is a summary of certain changes to the Portfolio during the year ended December 31, 2025. For more complete information, you may review the Portfolio’s Prospectus, as supplemented, at https://individuals.voya.com/production/mutual-fund/prospectuses-reports. Copies of the Prospectus can be requested by calling Voya at 1-800-992-0180. Effective June 10, 2025, the Portfolio revised its prospectus to add (i) principal risks related to Environmental, Social, and Governance and sector-focused investing & (ii) include additional information about an affiliated underlying fund. |
| C000125917 |
|
| Shareholder Report [Line Items] |
|
| Fund Name |
Voya Global Perspectives<sup style="inset: 1.5px 0px 4px; box-sizing: border-box; color: rgb(0, 0, 0); display: inline; flex-wrap: nowrap; font-size: 9px; font-weight: 400; grid-area: auto; line-height: 0px; margin: 0px; overflow: visible; position: relative; text-align: left; text-align-last: auto; white-space-collapse: preserve-breaks;">®</sup> Portfolio
|
| Class Name |
Class I
|
| Trading Symbol |
IPIRX
|
| Annual or Semi-Annual Statement [Text Block] |
This annual shareholder report contains important information about Voya Global Perspectives® Portfolio for the period of January 1, 2025 to December 31, 2025.
|
| Shareholder Report Annual or Semi-Annual |
Annual Shareholder Report
|
| Material Fund Change Notice [Text Block] |
This report describes changes to the Fund that occurred during the reporting period.
|
| Additional Information Phone Number |
1-800-992-0180
|
| Expenses [Text Block] |
What were the Fund’s costs for the last year? (based on a hypothetical $10,000 investment)Class Name | Costs of $10K investment | Costs paid as % of $10K investment |
|---|
Class I | $22 | 0.21% |
|---|
|
| Expenses Paid, Amount |
$ 22
|
| Expense Ratio, Percent |
0.21%
|
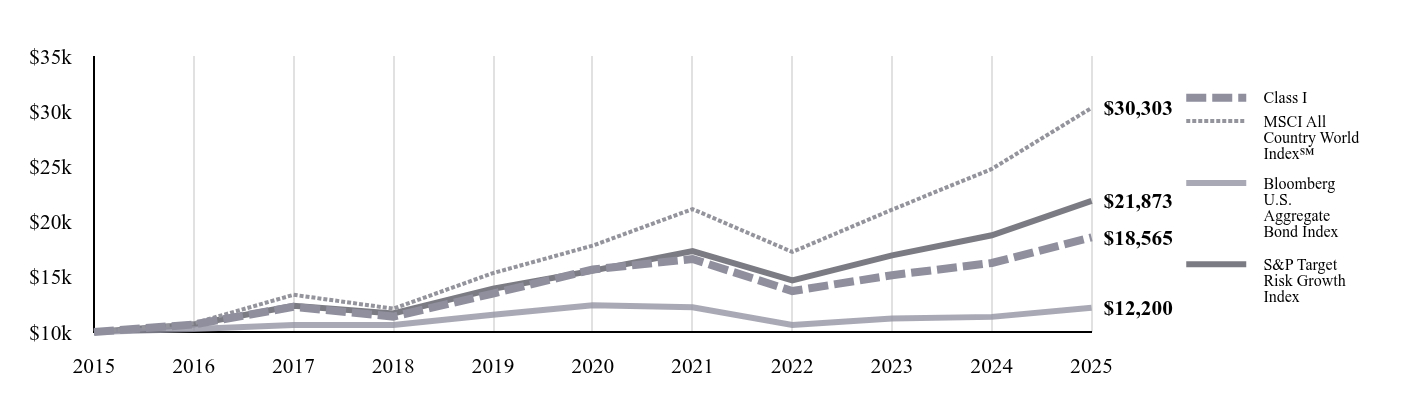
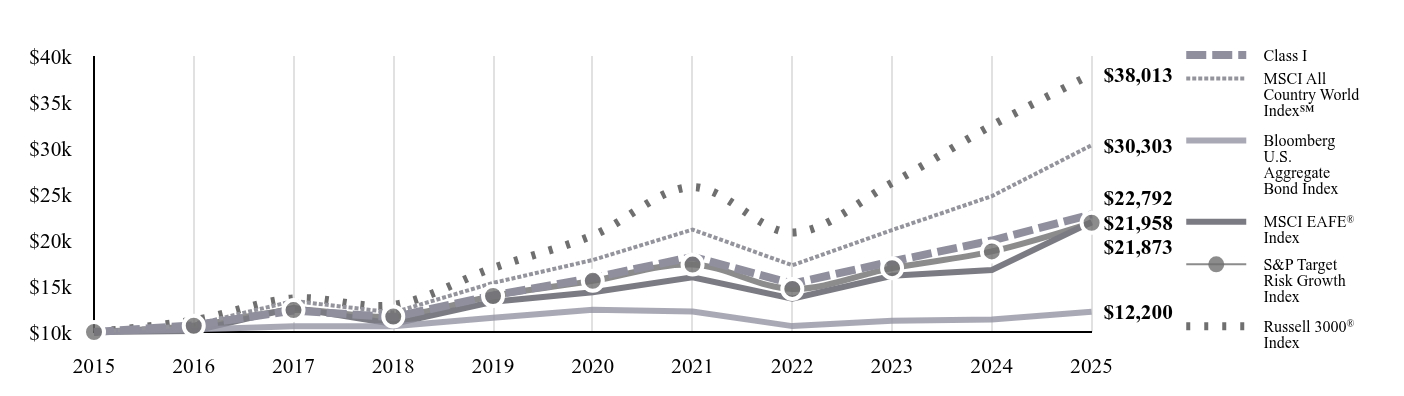
| Factors Affecting Performance [Text Block] |
How did the Fund perform in the past 12 months?For the year ended December 31, 2025, the Fund underperformed the S&P Target Risk Growth® Index. Underlying fund selection and asset allocation detracted. ↑ Top contributors to performance: An underweight in U.S. large cap equities & overweight to emerging market equities were the biggest contributors. On an individual holdings level, Voya Multi-Manager Emerging Equity, Voya Global Bond,& Voya High Yield were contributors. ↓ Top detractors from performance: Overweights to U.S. real estate investment trusts, U.S. small cap & U.S. mid cap as well as underweight in international equities were the biggest detractors. On an individual holdings level, Voya Mid Cap Opportunities, VY® CBRE Global Real Estate & Voya Small Company Portfolios were key detractors. |
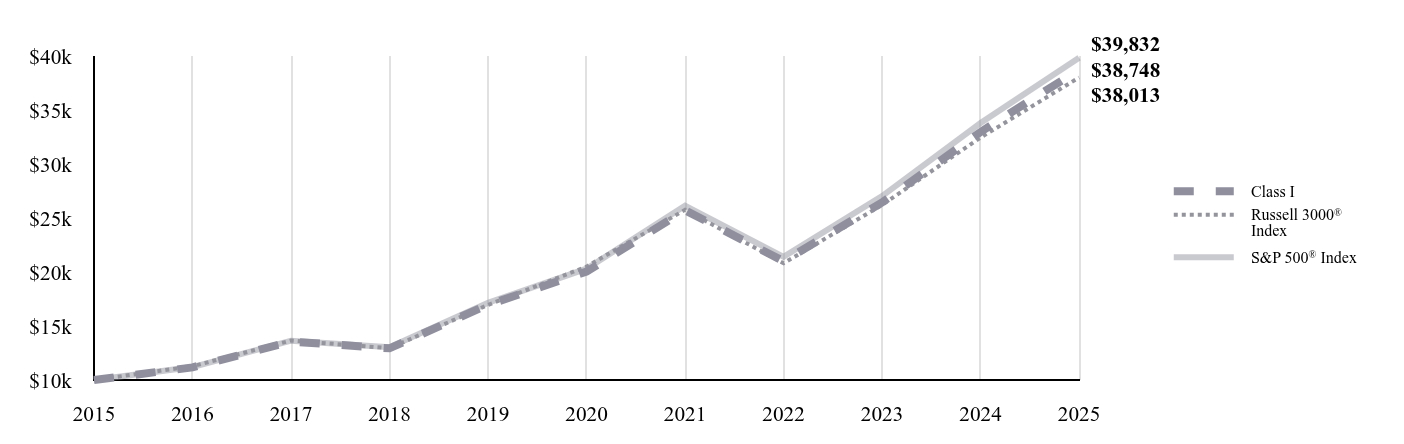
| Line Graph [Table Text Block] |
| Class I | MSCI All Country World Index℠ | Bloomberg U.S. Aggregate Bond Index | S&P Target Risk Growth Index |
|---|
2015 | $10,000 | $10,000 | $10,000 | $10,000 |
|---|
2016 | $10,681 | $10,786 | $10,265 | $10,677 |
|---|
2017 | $12,281 | $13,371 | $10,628 | $12,378 |
|---|
2018 | $11,396 | $12,113 | $10,629 | $11,674 |
|---|
2019 | $13,485 | $15,335 | $11,556 | $13,915 |
|---|
2020 | $15,661 | $17,827 | $12,424 | $15,561 |
|---|
2021 | $16,615 | $21,132 | $12,233 | $17,330 |
|---|
2022 | $13,707 | $17,252 | $10,641 | $14,684 |
|---|
2023 | $15,146 | $21,083 | $11,230 | $16,942 |
|---|
2024 | $16,253 | $24,770 | $11,370 | $18,760 |
|---|
2025 | $18,565 | $30,303 | $12,200 | $21,873 |
|---|
|
| Average Annual Return [Table Text Block] |
Fund | 1 Year
| 5 Years
| 10 Years
|
|---|
Class I
| 14.23% | 3.46% | 6.38% |
|---|
MSCI All Country World Index℠ | 22.34% | 11.19% | 11.72% |
|---|
Bloomberg U.S. Aggregate Bond Index | 7.30% | -0.36% | 2.01% |
|---|
S&P Target Risk Growth Index | 16.59% | 7.05% | 8.14% |
|---|
|
| AssetsNet |
$ 9,346,502
|
| Holdings Count | Holding |
10
|
| Advisory Fees Paid, Amount |
$ 27,017
|
| InvestmentCompanyPortfolioTurnover |
37.00%
|
| Additional Fund Statistics [Text Block] |
- Total Net Assets$9,346,502
- # of Portfolio Holdings10
- Portfolio Turnover Rate37%
- Investment Advisory Fees Paid$27,017
|
| Holdings [Text Block] |
Value | Value |
|---|
Liabilities in Excess of Other Assets | (0.2)% | Fixed Income | 39.8% | Equity | 60.4% |
|
| Largest Holdings [Text Block] |
Voya Multi-Manager Emerging Markets Equity Fund - Class I | 10.7% |
|---|
Voya International Index Portfolio - Class I | 10.3% |
|---|
Voya Small Company Portfolio - Class R6 | 10.1% |
|---|
Voya Index Plus LargeCap Portfolio - Class I | 10.1% |
|---|
Voya High Yield Portfolio - Class I | 10.0% |
|---|
Voya GNMA Income Fund - Class R6 | 10.0% |
|---|
Voya U.S. Bond Index Portfolio - Class I | 9.9% |
|---|
Voya Global Bond Fund - Class R6 | 9.9% |
|---|
VY® CBRE Global Real Estate Portfolio - Class I | 9.8% |
|---|
Voya MidCap Opportunities Portfolio - Class R6 | 9.4% |
|---|
|
| Material Fund Change [Text Block] |
This is a summary of certain changes to the Portfolio during the year ended December 31, 2025. For more complete information, you may review the Portfolio’s Prospectus, as supplemented, at https://individuals.voya.com/production/mutual-fund/prospectuses-reports. Copies of the Prospectus can be requested by calling Voya at 1-800-992-0180. Effective June 10, 2025, the Portfolio revised its prospectus to add (i) principal risks related to Environmental, Social, and Governance and sector-focused investing & (ii) include additional information about an affiliated underlying fund. |
| C000125918 |
|
| Shareholder Report [Line Items] |
|
| Fund Name |
Voya Global Perspectives<sup style="inset: 1.5px 0px 4px; box-sizing: border-box; color: rgb(0, 0, 0); display: inline; flex-wrap: nowrap; font-size: 9px; font-weight: 400; grid-area: auto; line-height: 0px; margin: 0px; overflow: visible; position: relative; text-align: left; text-align-last: auto; white-space-collapse: preserve-breaks;">®</sup> Portfolio
|
| Class Name |
Class S
|
| Trading Symbol |
IPSRX
|
| Annual or Semi-Annual Statement [Text Block] |
This annual shareholder report contains important information about Voya Global Perspectives® Portfolio for the period of January 1, 2025 to December 31, 2025.
|
| Shareholder Report Annual or Semi-Annual |
Annual Shareholder Report
|
| Material Fund Change Notice [Text Block] |
This report describes changes to the Fund that occurred during the reporting period.
|
| Additional Information Phone Number |
1-800-992-0180
|
| Expenses [Text Block] |
What were the Fund’s costs for the last year? (based on a hypothetical $10,000 investment)Class Name | Costs of $10K investment | Costs paid as % of $10K investment |
|---|
Class S | $49 | 0.46% |
|---|
|
| Expenses Paid, Amount |
$ 49
|
| Expense Ratio, Percent |
0.46%
|
| Factors Affecting Performance [Text Block] |
How did the Fund perform in the past 12 months?For the year ended December 31, 2025, the Fund underperformed the S&P Target Risk Growth® Index. Underlying fund selection and asset allocation detracted. ↑ Top contributors to performance: An underweight in U.S. large cap equities & overweight to emerging market equities were the biggest contributors. On an individual holdings level, Voya Multi-Manager Emerging Equity, Voya Global Bond,& Voya High Yield were contributors. ↓ Top detractors from performance: Overweights to U.S. real estate investment trusts, U.S. small cap & U.S. mid cap as well as underweight in international equities were the biggest detractors. On an individual holdings level, Voya Mid Cap Opportunities, VY® CBRE Global Real Estate & Voya Small Company Portfolios were key detractors. |
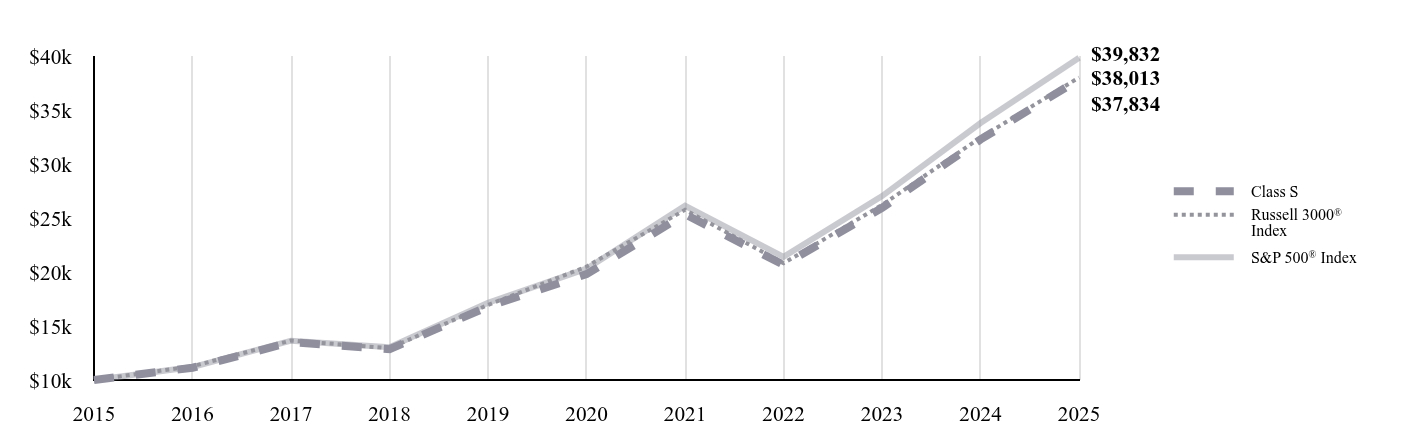
| Line Graph [Table Text Block] |
| Class S | MSCI All Country World Index℠ | Bloomberg U.S. Aggregate Bond Index | S&P Target Risk Growth Index |
|---|
2015 | $10,000 | $10,000 | $10,000 | $10,000 |
|---|
2016 | $10,655 | $10,786 | $10,265 | $10,677 |
|---|
2017 | $12,222 | $13,371 | $10,628 | $12,378 |
|---|
2018 | $11,310 | $12,113 | $10,629 | $11,674 |
|---|
2019 | $13,354 | $15,335 | $11,556 | $13,915 |
|---|
2020 | $15,463 | $17,827 | $12,424 | $15,561 |
|---|
2021 | $16,365 | $21,132 | $12,233 | $17,330 |
|---|
2022 | $13,475 | $17,252 | $10,641 | $14,684 |
|---|
2023 | $14,860 | $21,083 | $11,230 | $16,942 |
|---|
2024 | $15,882 | $24,770 | $11,370 | $18,760 |
|---|
2025 | $18,109 | $30,303 | $12,200 | $21,873 |
|---|
|
| Average Annual Return [Table Text Block] |
Fund | 1 Year
| 5 Years
| 10 Years
|
|---|
Class S
| 14.02% | 3.21% | 6.12% |
|---|
MSCI All Country World Index℠ | 22.34% | 11.19% | 11.72% |
|---|
Bloomberg U.S. Aggregate Bond Index | 7.30% | -0.36% | 2.01% |
|---|
S&P Target Risk Growth Index | 16.59% | 7.05% | 8.14% |
|---|
|
| AssetsNet |
$ 9,346,502
|
| Holdings Count | Holding |
10
|
| Advisory Fees Paid, Amount |
$ 27,017
|
| InvestmentCompanyPortfolioTurnover |
37.00%
|
| Additional Fund Statistics [Text Block] |
- Total Net Assets$9,346,502
- # of Portfolio Holdings10
- Portfolio Turnover Rate37%
- Investment Advisory Fees Paid$27,017
|
| Holdings [Text Block] |
Value | Value |
|---|
Liabilities in Excess of Other Assets | (0.2)% | Fixed Income | 39.8% | Equity | 60.4% |
|
| Largest Holdings [Text Block] |
Voya Multi-Manager Emerging Markets Equity Fund - Class I | 10.7% |
|---|
Voya International Index Portfolio - Class I | 10.3% |
|---|
Voya Small Company Portfolio - Class R6 | 10.1% |
|---|
Voya Index Plus LargeCap Portfolio - Class I | 10.1% |
|---|
Voya High Yield Portfolio - Class I | 10.0% |
|---|
Voya GNMA Income Fund - Class R6 | 10.0% |
|---|
Voya U.S. Bond Index Portfolio - Class I | 9.9% |
|---|
Voya Global Bond Fund - Class R6 | 9.9% |
|---|
VY® CBRE Global Real Estate Portfolio - Class I | 9.8% |
|---|
Voya MidCap Opportunities Portfolio - Class R6 | 9.4% |
|---|
|
| Material Fund Change [Text Block] |
This is a summary of certain changes to the Portfolio during the year ended December 31, 2025. For more complete information, you may review the Portfolio’s Prospectus, as supplemented, at https://individuals.voya.com/production/mutual-fund/prospectuses-reports. Copies of the Prospectus can be requested by calling Voya at 1-800-992-0180. Effective June 10, 2025, the Portfolio revised its prospectus to add (i) principal risks related to Environmental, Social, and Governance and sector-focused investing & (ii) include additional information about an affiliated underlying fund. |
| C000015353 |
|
| Shareholder Report [Line Items] |
|
| Fund Name |
Voya Government Liquid Assets Portfolio
|
| Class Name |
Class I
|
| Trading Symbol |
IPLXX
|
| Annual or Semi-Annual Statement [Text Block] |
This annual shareholder report contains important information about Voya Government Liquid Assets Portfolio for the period of January 1, 2025 to December 31, 2025.
|
| Shareholder Report Annual or Semi-Annual |
Annual Shareholder Report
|
| Additional Information Phone Number |
1-800-992-0180
|
| Expenses [Text Block] |
What were the Fund’s costs for the last year? (based on a hypothetical $10,000 investment)Class Name | Costs of $10K investment | Costs paid as % of $10K investment |
|---|
Class I | $29 | 0.28% |
|---|
|
| Expenses Paid, Amount |
$ 29
|
| Expense Ratio, Percent |
0.28%
|
| AssetsNet |
$ 1,243,326,721
|
| Holdings Count | Holding |
25
|
| Advisory Fees Paid, Amount |
$ 3,431,084
|
| Additional Fund Statistics [Text Block] |
- Total Net Assets$1,243,326,721
- # of Portfolio Holdings25
- Investment Advisory Fees Paid$3,431,084
|
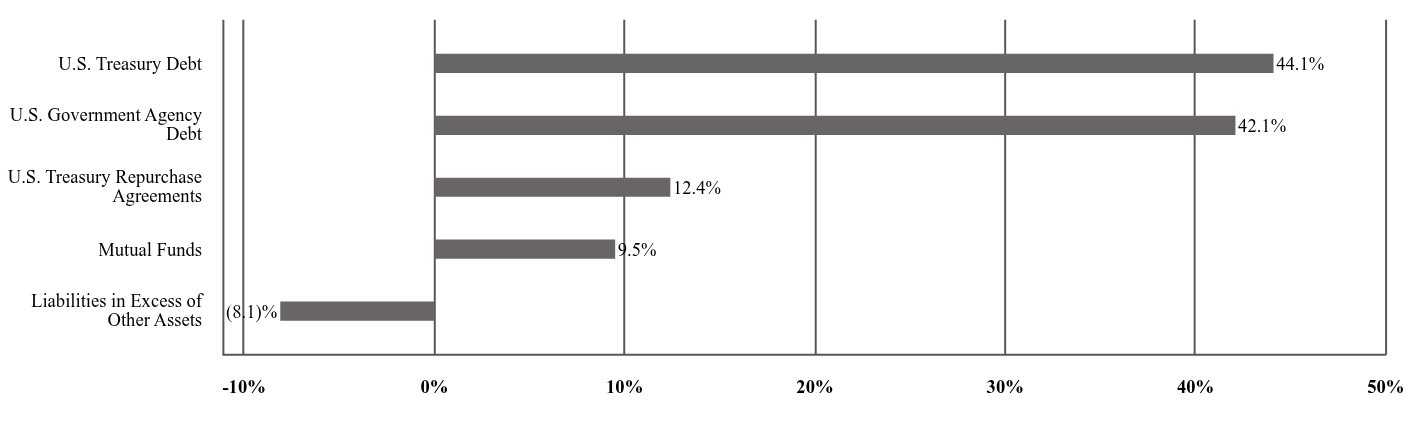
| Holdings [Text Block] |
Investment Type AllocationValue | Value |
|---|
Liabilities in Excess of Other Assets | (8.1)% | Mutual Funds | 9.5% | U.S. Treasury Repurchase Agreements | 12.4% | U.S. Government Agency Debt | 42.1% | U.S. Treasury Debt | 44.1% |
|
| C000015354 |
|
| Shareholder Report [Line Items] |
|
| Fund Name |
Voya Government Liquid Assets Portfolio
|
| Class Name |
Class S
|
| Trading Symbol |
ISPXX
|
| Annual or Semi-Annual Statement [Text Block] |
This annual shareholder report contains important information about Voya Government Liquid Assets Portfolio for the period of January 1, 2025 to December 31, 2025.
|
| Shareholder Report Annual or Semi-Annual |
Annual Shareholder Report
|
| Additional Information Phone Number |
1-800-992-0180
|
| Expenses [Text Block] |
What were the Fund’s costs for the last year? (based on a hypothetical $10,000 investment)Class Name | Costs of $10K investment | Costs paid as % of $10K investment |
|---|
Class S | $54 | 0.53% |
|---|
|
| Expenses Paid, Amount |
$ 54
|
| Expense Ratio, Percent |
0.53%
|
| AssetsNet |
$ 1,243,326,721
|
| Holdings Count | Holding |
25
|
| Advisory Fees Paid, Amount |
$ 3,431,084
|
| Additional Fund Statistics [Text Block] |
- Total Net Assets$1,243,326,721
- # of Portfolio Holdings25
- Investment Advisory Fees Paid$3,431,084
|
| Holdings [Text Block] |
Investment Type AllocationValue | Value |
|---|
Liabilities in Excess of Other Assets | (8.1)% | Mutual Funds | 9.5% | U.S. Treasury Repurchase Agreements | 12.4% | U.S. Government Agency Debt | 42.1% | U.S. Treasury Debt | 44.1% |
|
| C000015355 |
|
| Shareholder Report [Line Items] |
|
| Fund Name |
Voya Government Liquid Assets Portfolio
|
| Class Name |
Class S2
|
| Trading Symbol |
ITLXX
|
| Annual or Semi-Annual Statement [Text Block] |
This annual shareholder report contains important information about Voya Government Liquid Assets Portfolio for the period of January 1, 2025 to December 31, 2025.
|
| Shareholder Report Annual or Semi-Annual |
Annual Shareholder Report
|
| Additional Information Phone Number |
1-800-992-0180
|
| Expenses [Text Block] |
What were the Fund’s costs for the last year? (based on a hypothetical $10,000 investment)Class Name | Costs of $10K investment | Costs paid as % of $10K investment |
|---|
Class S2 | $69 | 0.68% |
|---|
|
| Expenses Paid, Amount |
$ 69
|
| Expense Ratio, Percent |
0.68%
|
| AssetsNet |
$ 1,243,326,721
|
| Holdings Count | Holding |
25
|
| Advisory Fees Paid, Amount |
$ 3,431,084
|
| Additional Fund Statistics [Text Block] |
- Total Net Assets$1,243,326,721
- # of Portfolio Holdings25
- Investment Advisory Fees Paid$3,431,084
|
| Holdings [Text Block] |
Investment Type AllocationValue | Value |
|---|
Liabilities in Excess of Other Assets | (8.1)% | Mutual Funds | 9.5% | U.S. Treasury Repurchase Agreements | 12.4% | U.S. Government Agency Debt | 42.1% | U.S. Treasury Debt | 44.1% |
|
| C000015922 |
|
| Shareholder Report [Line Items] |
|
| Fund Name |
Voya High Yield Portfolio
|
| Class Name |
Class ADV
|
| Trading Symbol |
IPYAX
|
| Annual or Semi-Annual Statement [Text Block] |
This annual shareholder report contains important information about Voya High Yield Portfolio for the period of January 1, 2025 to December 31, 2025.
|
| Shareholder Report Annual or Semi-Annual |
Annual Shareholder Report
|
| Material Fund Change Notice [Text Block] |
This report describes changes to the Fund that occurred during the reporting period.
|
| Additional Information Phone Number |
1-800-992-0180
|
| Expenses [Text Block] |
What were the Fund’s costs for the last year? (based on a hypothetical $10,000 investment)Class Name | Costs of $10K investment | Costs paid as % of $10K investment |
|---|
Class ADV | $112 | 1.08% |
|---|
|
| Expenses Paid, Amount |
$ 112
|
| Expense Ratio, Percent |
1.08%
|
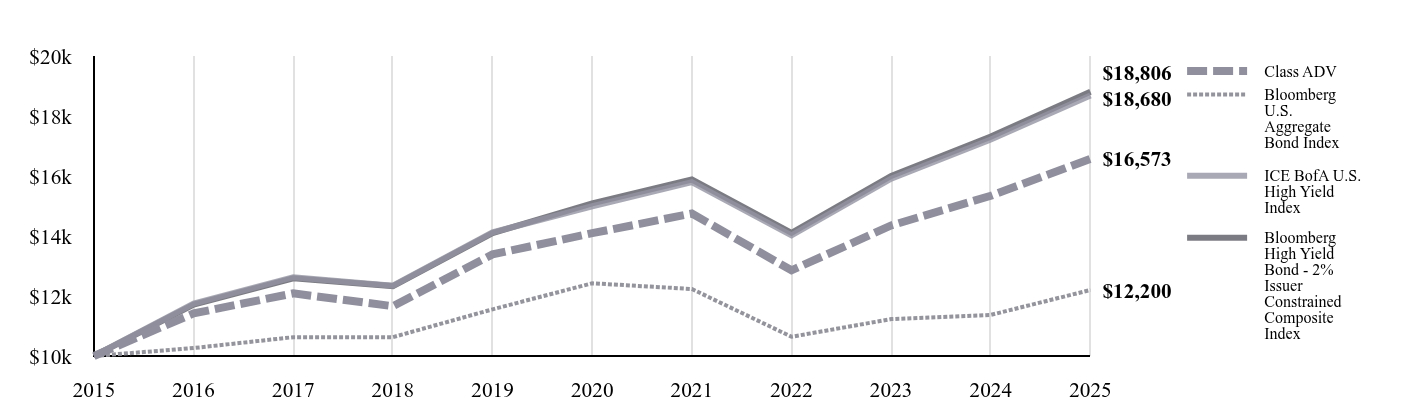
| Factors Affecting Performance [Text Block] |
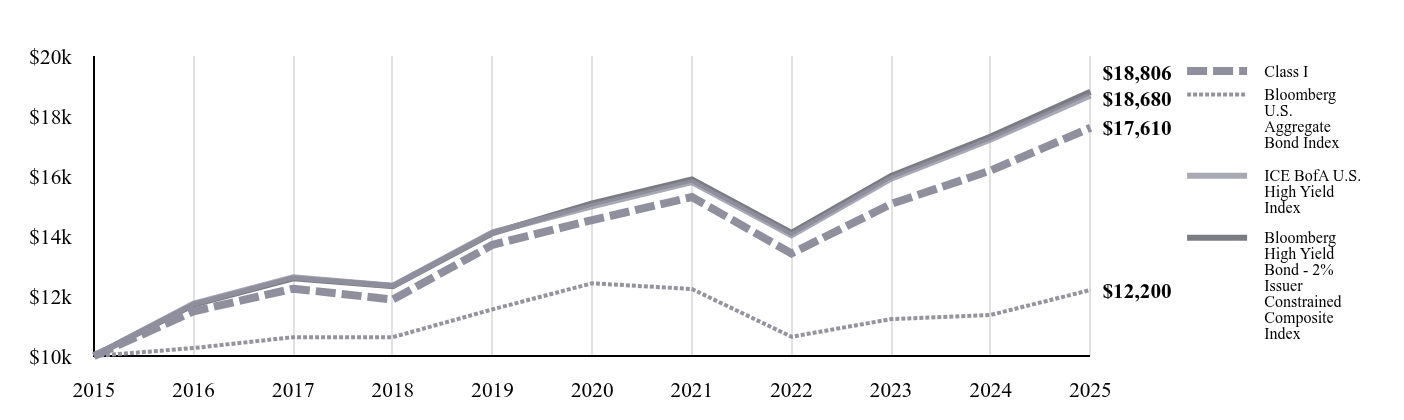
How did the Fund perform in the past 12 months?For the year ended December 31, 2025, the Fund's Class I shares outperformed the ICE BofA U.S. High Yield Index. Classes ADV, S, S2 shares underperformed. ↑ Top contributors to performance: The first half of the reporting period, contributions were from security selection within energy, retailers and wirelines. For the second of reporting period, underweights in CCC rated bonds was a relative performance tailwind. Industries helping relative performance in the period included chemicals, cable and satellite TV, & financial services. Security selection was the main source of strength in financial services. ↓ Top detractors from performance: Negative contributions included security selection within building products, followed by an underweight in wireless during the first half of the reporting period. For the second half of reporting period, industries detracting the most were healthcare, support-services, as well as basic industry and real estate. |
| Line Graph [Table Text Block] |
| Class ADV | Bloomberg U.S. Aggregate Bond Index | ICE BofA U.S. High Yield Index | Bloomberg High Yield Bond - 2% Issuer Constrained Composite Index |
|---|
2015 | $10,000 | $10,000 | $10,000 | $10,000 |
|---|
2016 | $11,421 | $10,265 | $11,749 | $11,713 |
|---|
2017 | $12,087 | $10,628 | $12,628 | $12,591 |
|---|
2018 | $11,660 | $10,629 | $12,342 | $12,330 |
|---|
2019 | $13,388 | $11,556 | $14,121 | $14,095 |
|---|
2020 | $14,093 | $12,424 | $14,992 | $15,089 |
|---|
2021 | $14,748 | $12,233 | $15,796 | $15,883 |
|---|
2022 | $12,856 | $10,641 | $14,024 | $14,107 |
|---|
2023 | $14,351 | $11,230 | $15,911 | $16,003 |
|---|
2024 | $15,341 | $11,370 | $17,216 | $17,313 |
|---|
2025 | $16,573 | $12,200 | $18,680 | $18,806 |
|---|
|
| Average Annual Return [Table Text Block] |
Fund | 1 Year
| 5 Years
| 10 Years
|
|---|
Class ADV
| 8.03% | 3.29% | 5.18% |
|---|
Bloomberg U.S. Aggregate Bond Index | 7.30% | -0.36% | 2.01% |
|---|
ICE BofA U.S. High Yield Index | 8.50% | 4.50% | 6.45% |
|---|
Bloomberg High Yield Bond - 2% Issuer Constrained Composite Index | 8.62% | 4.50% | 6.52% |
|---|
|
| AssetsNet |
$ 317,961,547
|
| Holdings Count | Holding |
106
|
| Advisory Fees Paid, Amount |
$ 1,503,502
|
| InvestmentCompanyPortfolioTurnover |
147.00%
|
| Additional Fund Statistics [Text Block] |
- Total Net Assets$317,961,547
- # of Portfolio Holdings106
- Portfolio Turnover Rate147%
- Investment Advisory Fees Paid$1,503,502
|
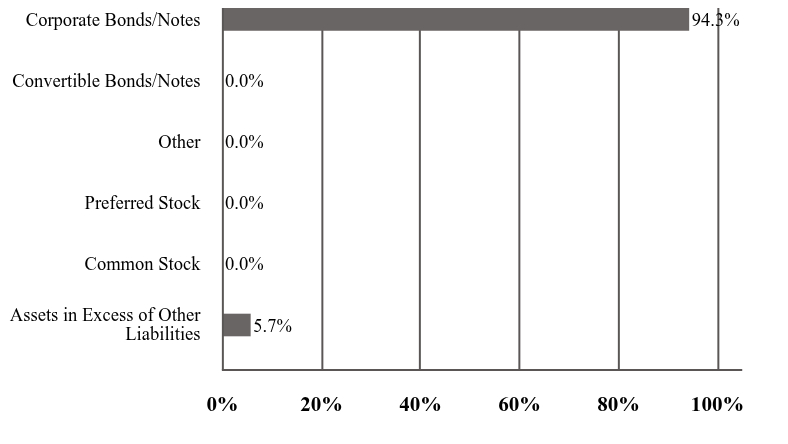
| Holdings [Text Block] |
Investment Type AllocationValue | Value |
|---|
Assets in Excess of Other Liabilities | 5.7% | Common Stock | 0.0% | Preferred Stock | 0.0% | Other | 0.0% | Convertible Bonds/Notes | 0.0% | Corporate Bonds/Notes | 94.3% |
|
| Largest Holdings [Text Block] |
OneMain Finance Corp., 7.125%, 09/15/32 | 2.2% |
|---|
Iron Mountain, Inc., 6.250%, 01/15/33 | 1.9% |
|---|
Bombardier, Inc., 6.750%, 06/15/33 | 1.5% |
|---|
Vmed O2 UK Financing I PLC, 7.750%, 04/15/32 | 1.5% |
|---|
Fortress Transportation and Infrastructure Investors LLC, 7.875%, 12/01/30 | 1.5% |
|---|
Navient Corp., 7.875%, 06/15/32 | 1.5% |
|---|
Frontier Communications Holdings LLC, 8.750%, 05/15/30 | 1.5% |
|---|
Sirius XM Radio, Inc., 5.500%, 07/01/29 | 1.5% |
|---|
Gen Digital, Inc., 6.250%, 04/01/33 | 1.4% |
|---|
Panther Escrow Issuer LLC, 7.125%, 06/01/31 | 1.4% |
|---|
|
| Material Fund Change [Text Block] |
This is a summary of certain changes to the Portfolio during the year ended December 31, 2025. For more complete information, you may review the Portfolio’s Prospectus at https://individuals.voya.com/production/mutual-fund/prospectuses-reports. Copies of the Prospectus can be requested by calling Voya at 1-800-992-0180. Effective June 16, 2025, the principal investment strategies and risks were revised to allow the Portfolio to invest in convertible securities. |
| C000015923 |
|
| Shareholder Report [Line Items] |
|
| Fund Name |
Voya High Yield Portfolio
|
| Class Name |
Class I
|
| Trading Symbol |
IPIMX
|
| Annual or Semi-Annual Statement [Text Block] |
This annual shareholder report contains important information about Voya High Yield Portfolio for the period of January 1, 2025 to December 31, 2025.
|
| Shareholder Report Annual or Semi-Annual |
Annual Shareholder Report
|
| Material Fund Change Notice [Text Block] |
This report describes changes to the Fund that occurred during the reporting period.
|
| Additional Information Phone Number |
1-800-992-0180
|
| Expenses [Text Block] |
What were the Fund’s costs for the last year? (based on a hypothetical $10,000 investment)Class Name | Costs of $10K investment | Costs paid as % of $10K investment |
|---|
Class I | $50 | 0.48% |
|---|
|
| Expenses Paid, Amount |
$ 50
|
| Expense Ratio, Percent |
0.48%
|
| Factors Affecting Performance [Text Block] |
How did the Fund perform in the past 12 months?For the year ended December 31, 2025, the Fund's Class I shares outperformed the ICE BofA U.S. High Yield Index. Classes ADV, S, S2 shares underperformed. ↑ Top contributors to performance: The first half of the reporting period, contributions were from security selection within energy, retailers and wirelines. For the second of reporting period, underweights in CCC rated bonds was a relative performance tailwind. Industries helping relative performance in the period included chemicals, cable and satellite TV, & financial services. Security selection was the main source of strength in financial services. ↓ Top detractors from performance: Negative contributions included security selection within building products, followed by an underweight in wireless during the first half of the reporting period. For the second half of reporting period, industries detracting the most were healthcare, support-services, as well as basic industry and real estate. |
| Line Graph [Table Text Block] |
| Class I | Bloomberg U.S. Aggregate Bond Index | ICE BofA U.S. High Yield Index | Bloomberg High Yield Bond - 2% Issuer Constrained Composite Index |
|---|
2015 | $10,000 | $10,000 | $10,000 | $10,000 |
|---|
2016 | $11,489 | $10,265 | $11,749 | $11,713 |
|---|
2017 | $12,244 | $10,628 | $12,628 | $12,591 |
|---|
2018 | $11,882 | $10,629 | $12,342 | $12,330 |
|---|
2019 | $13,708 | $11,556 | $14,121 | $14,095 |
|---|
2020 | $14,531 | $12,424 | $14,992 | $15,089 |
|---|
2021 | $15,298 | $12,233 | $15,796 | $15,883 |
|---|
2022 | $13,419 | $10,641 | $14,024 | $14,107 |
|---|
2023 | $15,068 | $11,230 | $15,911 | $16,003 |
|---|
2024 | $16,185 | $11,370 | $17,216 | $17,313 |
|---|
2025 | $17,610 | $12,200 | $18,680 | $18,806 |
|---|
|
| Average Annual Return [Table Text Block] |
Fund | 1 Year
| 5 Years
| 10 Years
|
|---|
Class I
| 8.80% | 3.92% | 5.82% |
|---|
Bloomberg U.S. Aggregate Bond Index | 7.30% | -0.36% | 2.01% |
|---|
ICE BofA U.S. High Yield Index | 8.50% | 4.50% | 6.45% |
|---|
Bloomberg High Yield Bond - 2% Issuer Constrained Composite Index | 8.62% | 4.50% | 6.52% |
|---|
|
| AssetsNet |
$ 317,961,547
|
| Holdings Count | Holding |
106
|
| Advisory Fees Paid, Amount |
$ 1,503,502
|
| InvestmentCompanyPortfolioTurnover |
147.00%
|
| Additional Fund Statistics [Text Block] |
- Total Net Assets$317,961,547
- # of Portfolio Holdings106
- Portfolio Turnover Rate147%
- Investment Advisory Fees Paid$1,503,502
|
| Holdings [Text Block] |
Investment Type AllocationValue | Value |
|---|
Assets in Excess of Other Liabilities | 5.7% | Common Stock | 0.0% | Preferred Stock | 0.0% | Other | 0.0% | Convertible Bonds/Notes | 0.0% | Corporate Bonds/Notes | 94.3% |
|
| Largest Holdings [Text Block] |
OneMain Finance Corp., 7.125%, 09/15/32 | 2.2% |
|---|
Iron Mountain, Inc., 6.250%, 01/15/33 | 1.9% |
|---|
Bombardier, Inc., 6.750%, 06/15/33 | 1.5% |
|---|
Vmed O2 UK Financing I PLC, 7.750%, 04/15/32 | 1.5% |
|---|
Fortress Transportation and Infrastructure Investors LLC, 7.875%, 12/01/30 | 1.5% |
|---|
Navient Corp., 7.875%, 06/15/32 | 1.5% |
|---|
Frontier Communications Holdings LLC, 8.750%, 05/15/30 | 1.5% |
|---|
Sirius XM Radio, Inc., 5.500%, 07/01/29 | 1.5% |
|---|
Gen Digital, Inc., 6.250%, 04/01/33 | 1.4% |
|---|
Panther Escrow Issuer LLC, 7.125%, 06/01/31 | 1.4% |
|---|
|
| Material Fund Change [Text Block] |
This is a summary of certain changes to the Portfolio during the year ended December 31, 2025. For more complete information, you may review the Portfolio’s Prospectus at https://individuals.voya.com/production/mutual-fund/prospectuses-reports. Copies of the Prospectus can be requested by calling Voya at 1-800-992-0180. Effective June 16, 2025, the principal investment strategies and risks were revised to allow the Portfolio to invest in convertible securities. |
| C000015924 |
|
| Shareholder Report [Line Items] |
|
| Fund Name |
Voya High Yield Portfolio
|
| Class Name |
Class S
|
| Trading Symbol |
IPHYX
|
| Annual or Semi-Annual Statement [Text Block] |
This annual shareholder report contains important information about Voya High Yield Portfolio for the period of January 1, 2025 to December 31, 2025.
|
| Shareholder Report Annual or Semi-Annual |
Annual Shareholder Report
|
| Material Fund Change Notice [Text Block] |
This report describes changes to the Fund that occurred during the reporting period.
|
| Additional Information Phone Number |
1-800-992-0180
|
| Expenses [Text Block] |
What were the Fund’s costs for the last year? (based on a hypothetical $10,000 investment)Class Name | Costs of $10K investment | Costs paid as % of $10K investment |
|---|
Class S | $76 | 0.73% |
|---|
|
| Expenses Paid, Amount |
$ 76
|
| Expense Ratio, Percent |
0.73%
|
| Factors Affecting Performance [Text Block] |
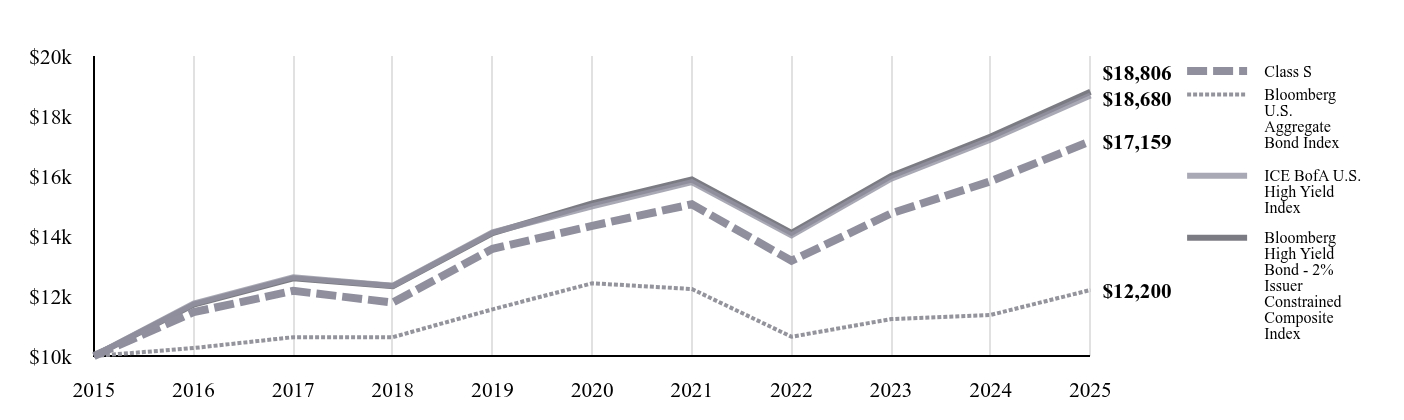
How did the Fund perform in the past 12 months?For the year ended December 31, 2025, the Fund's Class I shares outperformed the ICE BofA U.S. High Yield Index. Classes ADV, S, S2 shares underperformed. ↑ Top contributors to performance: The first half of the reporting period, contributions were from security selection within energy, retailers and wirelines. For the second of reporting period, underweights in CCC rated bonds was a relative performance tailwind. Industries helping relative performance in the period included chemicals, cable and satellite TV, & financial services. Security selection was the main source of strength in financial services. ↓ Top detractors from performance: Negative contributions included security selection within building products, followed by an underweight in wireless during the first half of the reporting period. For the second half of reporting period, industries detracting the most were healthcare, support-services, as well as basic industry and real estate. |
| Line Graph [Table Text Block] |
| Class S | Bloomberg U.S. Aggregate Bond Index | ICE BofA U.S. High Yield Index | Bloomberg High Yield Bond - 2% Issuer Constrained Composite Index |
|---|
2015 | $10,000 | $10,000 | $10,000 | $10,000 |
|---|
2016 | $11,461 | $10,265 | $11,749 | $11,713 |
|---|
2017 | $12,171 | $10,628 | $12,628 | $12,591 |
|---|
2018 | $11,782 | $10,629 | $12,342 | $12,330 |
|---|
2019 | $13,574 | $11,556 | $14,121 | $14,095 |
|---|
2020 | $14,339 | $12,424 | $14,992 | $15,089 |
|---|
2021 | $15,058 | $12,233 | $15,796 | $15,883 |
|---|
2022 | $13,173 | $10,641 | $14,024 | $14,107 |
|---|
2023 | $14,754 | $11,230 | $15,911 | $16,003 |
|---|
2024 | $15,828 | $11,370 | $17,216 | $17,313 |
|---|
2025 | $17,159 | $12,200 | $18,680 | $18,806 |
|---|
|
| Average Annual Return [Table Text Block] |
Fund | 1 Year
| 5 Years
| 10 Years
|
|---|
Class S
| 8.41% | 3.66% | 5.55% |
|---|
Bloomberg U.S. Aggregate Bond Index | 7.30% | -0.36% | 2.01% |
|---|
ICE BofA U.S. High Yield Index | 8.50% | 4.50% | 6.45% |
|---|
Bloomberg High Yield Bond - 2% Issuer Constrained Composite Index | 8.62% | 4.50% | 6.52% |
|---|
|
| AssetsNet |
$ 317,961,547
|
| Holdings Count | Holding |
106
|
| Advisory Fees Paid, Amount |
$ 1,503,502
|
| InvestmentCompanyPortfolioTurnover |
147.00%
|
| Additional Fund Statistics [Text Block] |
- Total Net Assets$317,961,547
- # of Portfolio Holdings106
- Portfolio Turnover Rate147%
- Investment Advisory Fees Paid$1,503,502
|
| Holdings [Text Block] |
Investment Type AllocationValue | Value |
|---|
Assets in Excess of Other Liabilities | 5.7% | Common Stock | 0.0% | Preferred Stock | 0.0% | Other | 0.0% | Convertible Bonds/Notes | 0.0% | Corporate Bonds/Notes | 94.3% |
|
| Largest Holdings [Text Block] |
OneMain Finance Corp., 7.125%, 09/15/32 | 2.2% |
|---|
Iron Mountain, Inc., 6.250%, 01/15/33 | 1.9% |
|---|
Bombardier, Inc., 6.750%, 06/15/33 | 1.5% |
|---|
Vmed O2 UK Financing I PLC, 7.750%, 04/15/32 | 1.5% |
|---|
Fortress Transportation and Infrastructure Investors LLC, 7.875%, 12/01/30 | 1.5% |
|---|
Navient Corp., 7.875%, 06/15/32 | 1.5% |
|---|
Frontier Communications Holdings LLC, 8.750%, 05/15/30 | 1.5% |
|---|
Sirius XM Radio, Inc., 5.500%, 07/01/29 | 1.5% |
|---|
Gen Digital, Inc., 6.250%, 04/01/33 | 1.4% |
|---|
Panther Escrow Issuer LLC, 7.125%, 06/01/31 | 1.4% |
|---|
|
| Material Fund Change [Text Block] |
This is a summary of certain changes to the Portfolio during the year ended December 31, 2025. For more complete information, you may review the Portfolio’s Prospectus at https://individuals.voya.com/production/mutual-fund/prospectuses-reports. Copies of the Prospectus can be requested by calling Voya at 1-800-992-0180. Effective June 16, 2025, the principal investment strategies and risks were revised to allow the Portfolio to invest in convertible securities. |
| C000015921 |
|
| Shareholder Report [Line Items] |
|
| Fund Name |
Voya High Yield Portfolio
|
| Class Name |
Class S2
|
| Trading Symbol |
IPYSX
|
| Annual or Semi-Annual Statement [Text Block] |
This annual shareholder report contains important information about Voya High Yield Portfolio for the period of January 1, 2025 to December 31, 2025.
|
| Shareholder Report Annual or Semi-Annual |
Annual Shareholder Report
|
| Material Fund Change Notice [Text Block] |
This report describes changes to the Fund that occurred during the reporting period.
|
| Additional Information Phone Number |
1-800-992-0180
|
| Expenses [Text Block] |
What were the Fund’s costs for the last year? (based on a hypothetical $10,000 investment)Class Name | Costs of $10K investment | Costs paid as % of $10K investment |
|---|
Class S2 | $92 | 0.88% |
|---|
|
| Expenses Paid, Amount |
$ 92
|
| Expense Ratio, Percent |
0.88%
|
| Factors Affecting Performance [Text Block] |
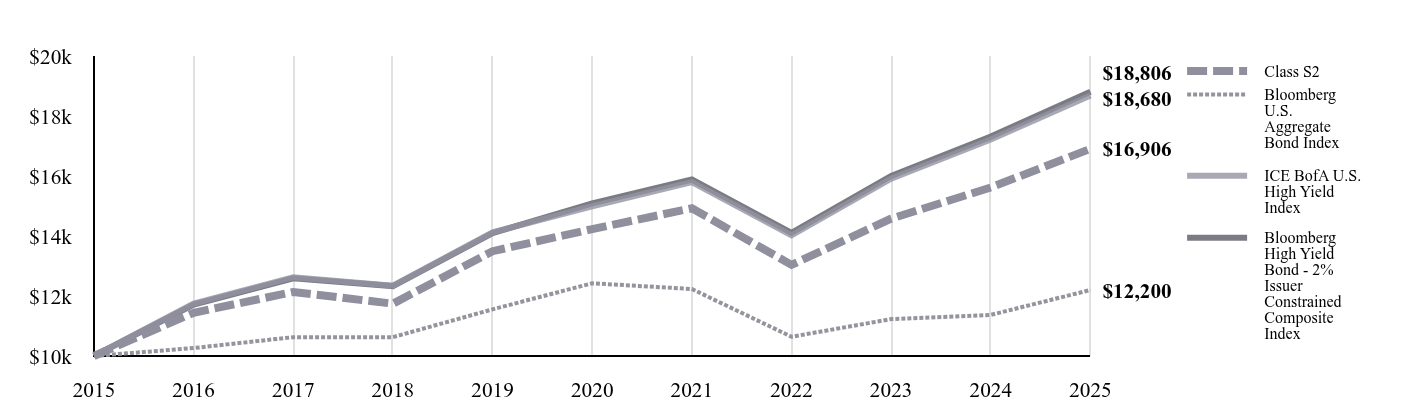
How did the Fund perform in the past 12 months?For the year ended December 31, 2025, the Fund's Class I shares outperformed the ICE BofA U.S. High Yield Index. Classes ADV, S, S2 shares underperformed. ↑ Top contributors to performance: The first half of the reporting period, contributions were from security selection within energy, retailers and wirelines. For the second of reporting period, underweights in CCC rated bonds was a relative performance tailwind. Industries helping relative performance in the period included chemicals, cable and satellite TV, & financial services. Security selection was the main source of strength in financial services. ↓ Top detractors from performance: Negative contributions included security selection within building products, followed by an underweight in wireless during the first half of the reporting period. For the second half of reporting period, industries detracting the most were healthcare, support-services, as well as basic industry and real estate. |
| Line Graph [Table Text Block] |
| Class S2 | Bloomberg U.S. Aggregate Bond Index | ICE BofA U.S. High Yield Index | Bloomberg High Yield Bond - 2% Issuer Constrained Composite Index |
|---|
2015 | $10,000 | $10,000 | $10,000 | $10,000 |
|---|
2016 | $11,443 | $10,265 | $11,749 | $11,713 |
|---|
2017 | $12,135 | $10,628 | $12,628 | $12,591 |
|---|
2018 | $11,743 | $10,629 | $12,342 | $12,330 |
|---|
2019 | $13,493 | $11,556 | $14,121 | $14,095 |
|---|
2020 | $14,232 | $12,424 | $14,992 | $15,089 |
|---|
2021 | $14,923 | $12,233 | $15,796 | $15,883 |
|---|
2022 | $13,038 | $10,641 | $14,024 | $14,107 |
|---|
2023 | $14,580 | $11,230 | $15,911 | $16,003 |
|---|
2024 | $15,618 | $11,370 | $17,216 | $17,313 |
|---|
2025 | $16,906 | $12,200 | $18,680 | $18,806 |
|---|
|
| Average Annual Return [Table Text Block] |
Fund | 1 Year
| 5 Years
| 10 Years
|
|---|
Class S2
| 8.25% | 3.50% | 5.39% |
|---|
Bloomberg U.S. Aggregate Bond Index | 7.30% | -0.36% | 2.01% |
|---|
ICE BofA U.S. High Yield Index | 8.50% | 4.50% | 6.45% |
|---|
Bloomberg High Yield Bond - 2% Issuer Constrained Composite Index | 8.62% | 4.50% | 6.52% |
|---|
|
| AssetsNet |
$ 317,961,547
|
| Holdings Count | Holding |
106
|
| Advisory Fees Paid, Amount |
$ 1,503,502
|
| InvestmentCompanyPortfolioTurnover |
147.00%
|
| Additional Fund Statistics [Text Block] |
- Total Net Assets$317,961,547
- # of Portfolio Holdings106
- Portfolio Turnover Rate147%
- Investment Advisory Fees Paid$1,503,502
|
| Holdings [Text Block] |
Investment Type AllocationValue | Value |
|---|
Assets in Excess of Other Liabilities | 5.7% | Common Stock | 0.0% | Preferred Stock | 0.0% | Other | 0.0% | Convertible Bonds/Notes | 0.0% | Corporate Bonds/Notes | 94.3% |
|
| Largest Holdings [Text Block] |
OneMain Finance Corp., 7.125%, 09/15/32 | 2.2% |
|---|
Iron Mountain, Inc., 6.250%, 01/15/33 | 1.9% |
|---|
Bombardier, Inc., 6.750%, 06/15/33 | 1.5% |
|---|
Vmed O2 UK Financing I PLC, 7.750%, 04/15/32 | 1.5% |
|---|
Fortress Transportation and Infrastructure Investors LLC, 7.875%, 12/01/30 | 1.5% |
|---|
Navient Corp., 7.875%, 06/15/32 | 1.5% |
|---|
Frontier Communications Holdings LLC, 8.750%, 05/15/30 | 1.5% |
|---|
Sirius XM Radio, Inc., 5.500%, 07/01/29 | 1.5% |
|---|
Gen Digital, Inc., 6.250%, 04/01/33 | 1.4% |
|---|
Panther Escrow Issuer LLC, 7.125%, 06/01/31 | 1.4% |
|---|
|
| Material Fund Change [Text Block] |
This is a summary of certain changes to the Portfolio during the year ended December 31, 2025. For more complete information, you may review the Portfolio’s Prospectus at https://individuals.voya.com/production/mutual-fund/prospectuses-reports. Copies of the Prospectus can be requested by calling Voya at 1-800-992-0180. Effective June 16, 2025, the principal investment strategies and risks were revised to allow the Portfolio to invest in convertible securities. |
| C000047545 |
|
| Shareholder Report [Line Items] |
|
| Fund Name |
Voya Inflation Protected Bond Plus Portfolio
|
| Class Name |
Class ADV
|
| Trading Symbol |
IBRAX
|
| Annual or Semi-Annual Statement [Text Block] |
This annual shareholder report contains important information about Voya Inflation Protected Bond Plus Portfolio for the period of January 1, 2025 to December 31, 2025.
|
| Shareholder Report Annual or Semi-Annual |
Annual Shareholder Report
|
| Additional Information Phone Number |
1-800-992-0180
|
| Expenses [Text Block] |
What were the Fund’s costs for the last year? (based on a hypothetical $10,000 investment)Class Name | Costs of $10K investment | Costs paid as % of $10K investment |
|---|
Class ADV | $123 | 1.19% |
|---|
|
| Expenses Paid, Amount |
$ 123
|
| Expense Ratio, Percent |
1.19%
|
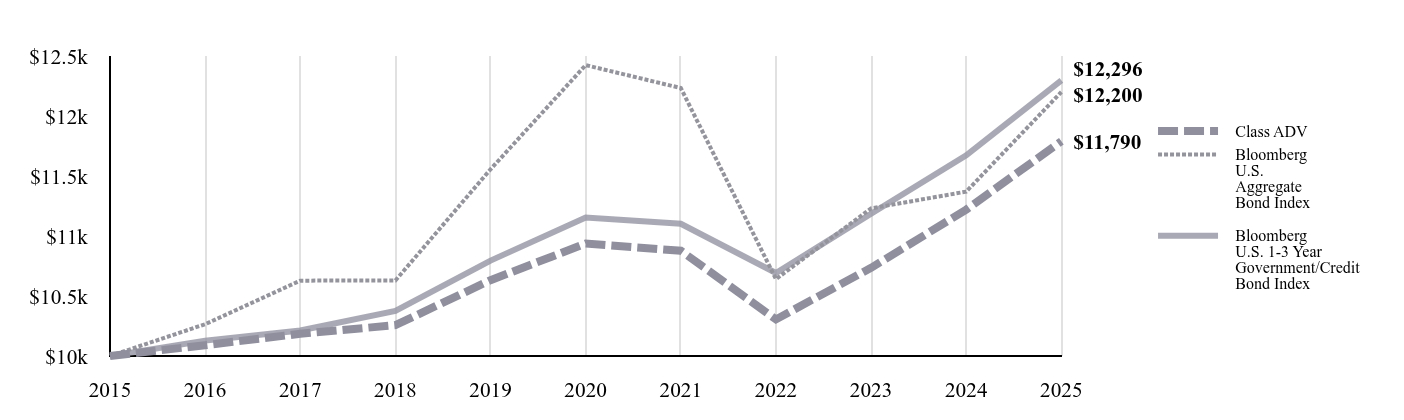
| Factors Affecting Performance [Text Block] |
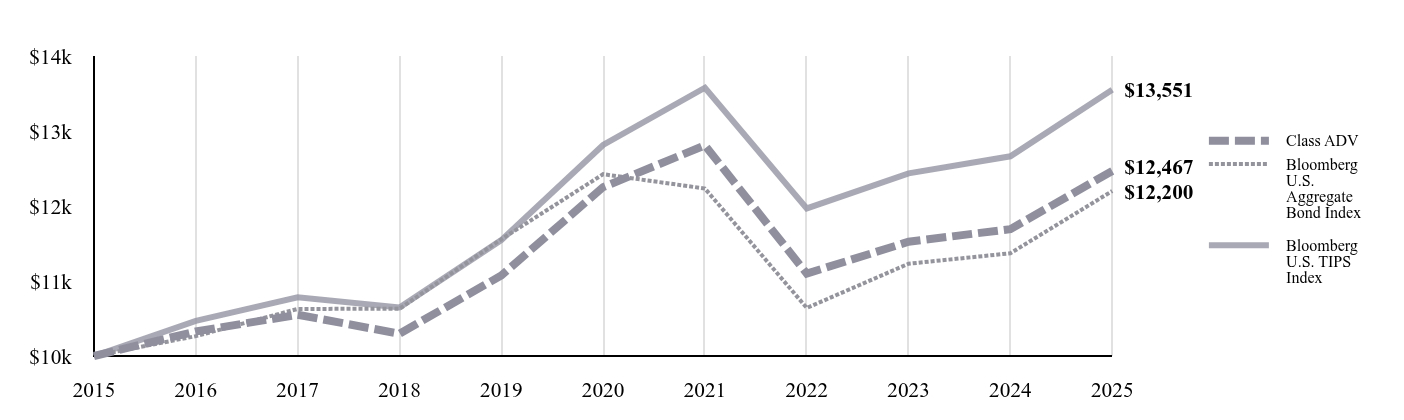
How did the Fund perform in the past 12 months?For the year ended December 31, 2025, the Fund outperformed the Bloomberg U.S. TIPS Index (before fees and expenses). ↑ Top contributors to performance: The primary positive contributors were commercial mortgage-backed securities (CMBS), investment grade corporates (IG), collateralized loan obligations (CLOs), and agency mortgage floaters. The Fund was overweight single-asset, single-borrower (SASB) deals in CMBS which contributed, & added to investment grade (IG) amid some weakness after liberation day. After the rally, allocation to the front end of the curve to harvest carry. The Fund's active allocation to agency mortgage floaters also helped performance. Derivatives contributed positively to performance. Derivatives are used to replicate duration and inflation exposure. During the Liberation Day sell-off, the Fund used CDX High Yield to add exposure which also added to performance. ↓ Top detractors from performance: Duration reflects as the primary negative contributor, this is because the Fund replicates duration using total return swaps. In practice, the Fund did not take active duration in the portfolio. |
| Line Graph [Table Text Block] |
| Class ADV | Bloomberg U.S. Aggregate Bond Index | Bloomberg U.S. TIPS Index |
|---|
2015 | $10,000 | $10,000 | $10,000 |
|---|
2016 | $10,327 | $10,265 | $10,468 |
|---|
2017 | $10,550 | $10,628 | $10,783 |
|---|
2018 | $10,297 | $10,629 | $10,647 |
|---|
2019 | $11,073 | $11,556 | $11,545 |
|---|
2020 | $12,252 | $12,424 | $12,814 |
|---|
2021 | $12,808 | $12,233 | $13,577 |
|---|
2022 | $11,099 | $10,641 | $11,968 |
|---|
2023 | $11,523 | $11,230 | $12,435 |
|---|
2024 | $11,692 | $11,370 | $12,663 |
|---|
2025 | $12,467 | $12,200 | $13,551 |
|---|
|
| Average Annual Return [Table Text Block] |
Fund | 1 Year
| 5 Years
| 10 Years
|
|---|
Class ADV
| 6.64% | 0.35% | 2.23% |
|---|
Bloomberg U.S. Aggregate Bond Index | 7.30% | -0.36% | 2.01% |
|---|
Bloomberg U.S. TIPS Index | 7.01% | 1.12% | 3.09% |
|---|
|
| AssetsNet |
$ 218,264,143
|
| Holdings Count | Holding |
419
|
| Advisory Fees Paid, Amount |
$ 941,244
|
| InvestmentCompanyPortfolioTurnover |
80.00%
|
| Additional Fund Statistics [Text Block] |
- Total Net Assets$218,264,143
- # of Portfolio Holdings419
- Portfolio Turnover Rate80%
- Investment Advisory Fees Paid$941,244
|
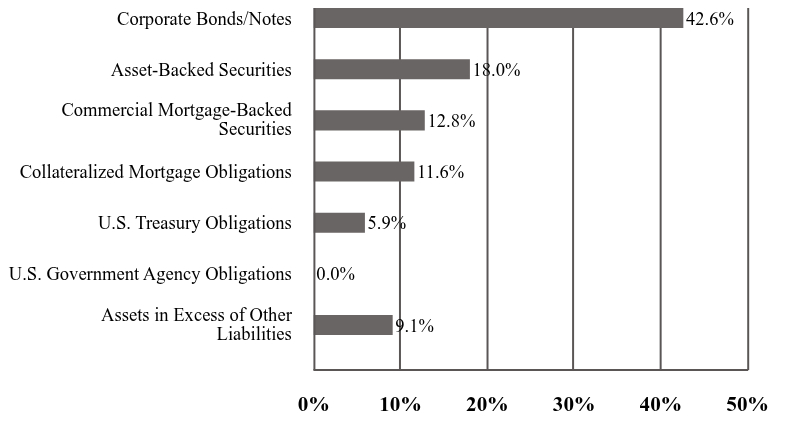
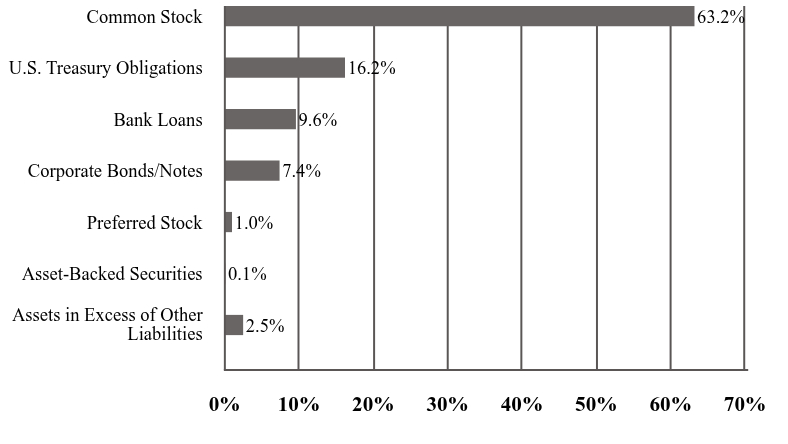
| Holdings [Text Block] |
Investment Type AllocationValue | Value |
|---|
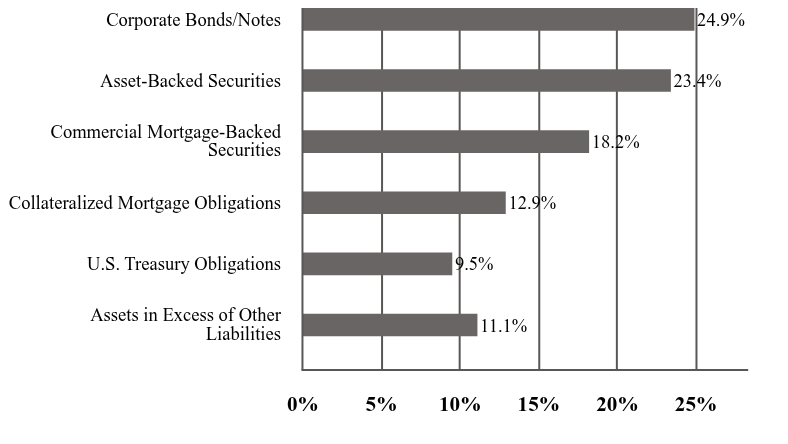
Assets in Excess of Other Liabilities | 11.1% | U.S. Treasury Obligations | 9.5% | Collateralized Mortgage Obligations | 12.9% | Commercial Mortgage-Backed Securities | 18.2% | Asset-Backed Securities | 23.4% | Corporate Bonds/Notes | 24.9% |
|
| Largest Holdings [Text Block] |
Freddie Mac REMIC Trust - Class DF, 5.324%, 05/25/54 | 2.7% |
|---|
Fannie Mae REMIC Trust - Class FD, 5.224%, 04/25/54 | 2.0% |
|---|
Fannie Mae REMIC Trust - Class FH, 5.124%, 01/25/55 | 1.9% |
|---|
Sumitomo Mitsui Banking Corp./New York, 3.940%, 01/30/26 | 1.0% |
|---|
Freddie Mac REMIC Trust - Class FH, 4.974%, 10/25/54 | 0.9% |
|---|
Zaxbys Funding LLC - Class A2, 3.238%, 07/30/51 | 0.8% |
|---|
MHP Commercial Mortgage Trust - Class A, 5.250%, 09/15/40 | 0.7% |
|---|
Pagaya AI Debt Trust - Class B, 5.688%, 01/17/33 | 0.7% |
|---|
SMB Private Education Loan Trust - Class A1A, 5.130%, 04/15/54 | 0.7% |
|---|
Pagaya AI Debt Grantor Trust - Class A2, 5.365%, 12/15/32 | 0.7% |
|---|
|
| Material Fund Change [Text Block] |
|
| C000047546 |
|
| Shareholder Report [Line Items] |
|
| Fund Name |
Voya Inflation Protected Bond Plus Portfolio
|
| Class Name |
Class I
|
| Trading Symbol |
IBRIX
|
| Annual or Semi-Annual Statement [Text Block] |
This annual shareholder report contains important information about Voya Inflation Protected Bond Plus Portfolio for the period of January 1, 2025 to December 31, 2025.
|
| Shareholder Report Annual or Semi-Annual |
Annual Shareholder Report
|
| Additional Information Phone Number |
1-800-992-0180
|
| Expenses [Text Block] |
What were the Fund’s costs for the last year? (based on a hypothetical $10,000 investment)Class Name | Costs of $10K investment | Costs paid as % of $10K investment |
|---|
Class I | $61 | 0.59% |
|---|
|
| Expenses Paid, Amount |
$ 61
|
| Expense Ratio, Percent |
0.59%
|
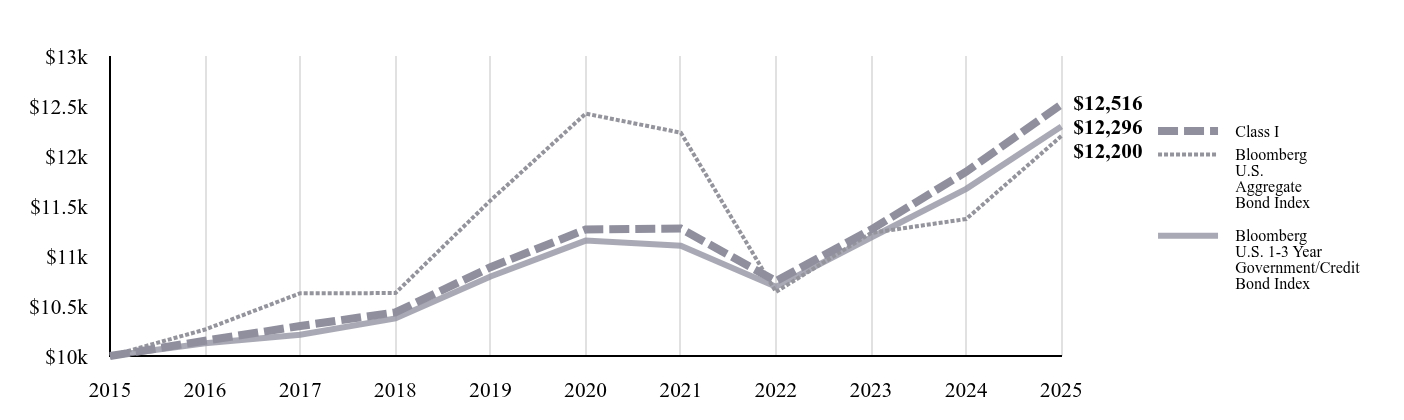
| Factors Affecting Performance [Text Block] |
How did the Fund perform in the past 12 months?For the year ended December 31, 2025, the Fund outperformed the Bloomberg U.S. TIPS Index (before fees and expenses). ↑ Top contributors to performance: The primary positive contributors were commercial mortgage-backed securities (CMBS), investment grade corporates (IG), collateralized loan obligations (CLOs), and agency mortgage floaters. The Fund was overweight single-asset, single-borrower (SASB) deals in CMBS which contributed, & added to investment grade (IG) amid some weakness after liberation day. After the rally, allocation to the front end of the curve to harvest carry. The Fund's active allocation to agency mortgage floaters also helped performance. Derivatives contributed positively to performance. Derivatives are used to replicate duration and inflation exposure. During the Liberation Day sell-off, the Fund used CDX High Yield to add exposure which also added to performance. ↓ Top detractors from performance: Duration reflects as the primary negative contributor, this is because the Fund replicates duration using total return swaps. In practice, the Fund did not take active duration in the portfolio. |
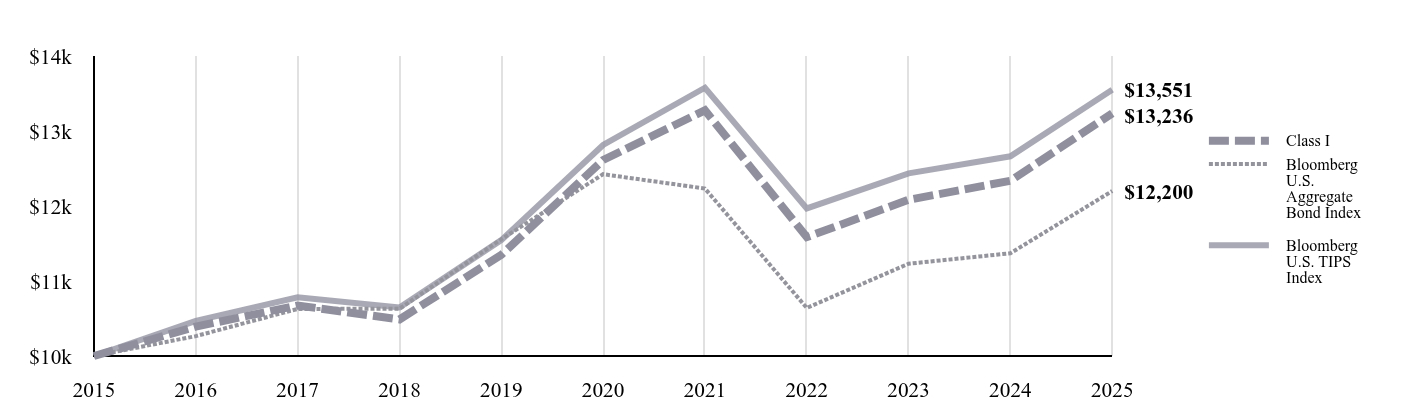
| Line Graph [Table Text Block] |
| Class I | Bloomberg U.S. Aggregate Bond Index | Bloomberg U.S. TIPS Index |
|---|
2015 | $10,000 | $10,000 | $10,000 |
|---|
2016 | $10,392 | $10,265 | $10,468 |
|---|
2017 | $10,674 | $10,628 | $10,783 |
|---|
2018 | $10,487 | $10,629 | $10,647 |
|---|
2019 | $11,348 | $11,556 | $11,545 |
|---|
2020 | $12,613 | $12,424 | $12,814 |
|---|
2021 | $13,276 | $12,233 | $13,577 |
|---|
2022 | $11,585 | $10,641 | $11,968 |
|---|
2023 | $12,083 | $11,230 | $12,435 |
|---|
2024 | $12,336 | $11,370 | $12,663 |
|---|
2025 | $13,236 | $12,200 | $13,551 |
|---|
|
| Average Annual Return [Table Text Block] |
Fund | 1 Year
| 5 Years
| 10 Years
|
|---|
Class I
| 7.30% | 0.97% | 2.84% |
|---|
Bloomberg U.S. Aggregate Bond Index | 7.30% | -0.36% | 2.01% |
|---|
Bloomberg U.S. TIPS Index | 7.01% | 1.12% | 3.09% |
|---|
|
| AssetsNet |
$ 218,264,143
|
| Holdings Count | Holding |
419
|
| Advisory Fees Paid, Amount |
$ 941,244
|
| InvestmentCompanyPortfolioTurnover |
80.00%
|
| Additional Fund Statistics [Text Block] |
- Total Net Assets$218,264,143
- # of Portfolio Holdings419
- Portfolio Turnover Rate80%
- Investment Advisory Fees Paid$941,244
|
| Holdings [Text Block] |
Investment Type AllocationValue | Value |
|---|
Assets in Excess of Other Liabilities | 11.1% | U.S. Treasury Obligations | 9.5% | Collateralized Mortgage Obligations | 12.9% | Commercial Mortgage-Backed Securities | 18.2% | Asset-Backed Securities | 23.4% | Corporate Bonds/Notes | 24.9% |
|
| Largest Holdings [Text Block] |
Freddie Mac REMIC Trust - Class DF, 5.324%, 05/25/54 | 2.7% |
|---|
Fannie Mae REMIC Trust - Class FD, 5.224%, 04/25/54 | 2.0% |
|---|
Fannie Mae REMIC Trust - Class FH, 5.124%, 01/25/55 | 1.9% |
|---|
Sumitomo Mitsui Banking Corp./New York, 3.940%, 01/30/26 | 1.0% |
|---|
Freddie Mac REMIC Trust - Class FH, 4.974%, 10/25/54 | 0.9% |
|---|
Zaxbys Funding LLC - Class A2, 3.238%, 07/30/51 | 0.8% |
|---|
MHP Commercial Mortgage Trust - Class A, 5.250%, 09/15/40 | 0.7% |
|---|
Pagaya AI Debt Trust - Class B, 5.688%, 01/17/33 | 0.7% |
|---|
SMB Private Education Loan Trust - Class A1A, 5.130%, 04/15/54 | 0.7% |
|---|
Pagaya AI Debt Grantor Trust - Class A2, 5.365%, 12/15/32 | 0.7% |
|---|
|
| Material Fund Change [Text Block] |
|
| C000047547 |
|
| Shareholder Report [Line Items] |
|
| Fund Name |
Voya Inflation Protected Bond Plus Portfolio
|
| Class Name |
Class S
|
| Trading Symbol |
IBRSX
|
| Annual or Semi-Annual Statement [Text Block] |
This annual shareholder report contains important information about Voya Inflation Protected Bond Plus Portfolio for the period of January 1, 2025 to December 31, 2025.
|
| Shareholder Report Annual or Semi-Annual |
Annual Shareholder Report
|
| Additional Information Phone Number |
1-800-992-0180
|
| Expenses [Text Block] |
What were the Fund’s costs for the last year? (based on a hypothetical $10,000 investment)Class Name | Costs of $10K investment | Costs paid as % of $10K investment |
|---|
Class S | $88 | 0.84% |
|---|
|
| Expenses Paid, Amount |
$ 88
|
| Expense Ratio, Percent |
0.84%
|
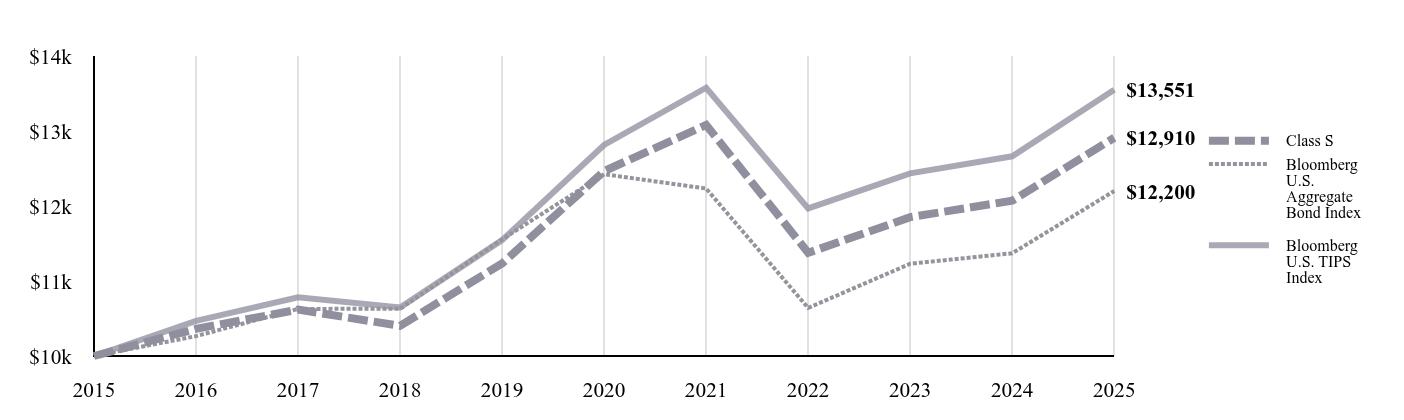
| Factors Affecting Performance [Text Block] |
How did the Fund perform in the past 12 months?For the year ended December 31, 2025, the Fund outperformed the Bloomberg U.S. TIPS Index (before fees and expenses). ↑ Top contributors to performance: The primary positive contributors were commercial mortgage-backed securities (CMBS), investment grade corporates (IG), collateralized loan obligations (CLOs), and agency mortgage floaters. The Fund was overweight single-asset, single-borrower (SASB) deals in CMBS which contributed, & added to investment grade (IG) amid some weakness after liberation day. After the rally, allocation to the front end of the curve to harvest carry. The Fund's active allocation to agency mortgage floaters also helped performance. Derivatives contributed positively to performance. Derivatives are used to replicate duration and inflation exposure. During the Liberation Day sell-off, the Fund used CDX High Yield to add exposure which also added to performance. ↓ Top detractors from performance: Duration reflects as the primary negative contributor, this is because the Fund replicates duration using total return swaps. In practice, the Fund did not take active duration in the portfolio. |
| Line Graph [Table Text Block] |
| Class S | Bloomberg U.S. Aggregate Bond Index | Bloomberg U.S. TIPS Index |
|---|
2015 | $10,000 | $10,000 | $10,000 |
|---|
2016 | $10,362 | $10,265 | $10,468 |
|---|
2017 | $10,618 | $10,628 | $10,783 |
|---|
2018 | $10,402 | $10,629 | $10,647 |
|---|
2019 | $11,234 | $11,556 | $11,545 |
|---|
2020 | $12,465 | $12,424 | $12,814 |
|---|
2021 | $13,080 | $12,233 | $13,577 |
|---|
2022 | $11,376 | $10,641 | $11,968 |
|---|
2023 | $11,851 | $11,230 | $12,435 |
|---|
2024 | $12,071 | $11,370 | $12,663 |
|---|
2025 | $12,910 | $12,200 | $13,551 |
|---|
|
| Average Annual Return [Table Text Block] |
Fund | 1 Year
| 5 Years
| 10 Years
|
|---|
Class S
| 6.96% | 0.71% | 2.59% |
|---|
Bloomberg U.S. Aggregate Bond Index | 7.30% | -0.36% | 2.01% |
|---|
Bloomberg U.S. TIPS Index | 7.01% | 1.12% | 3.09% |
|---|
|
| AssetsNet |
$ 218,264,143
|
| Holdings Count | Holding |
419
|
| Advisory Fees Paid, Amount |
$ 941,244
|
| InvestmentCompanyPortfolioTurnover |
80.00%
|
| Additional Fund Statistics [Text Block] |
- Total Net Assets$218,264,143
- # of Portfolio Holdings419
- Portfolio Turnover Rate80%
- Investment Advisory Fees Paid$941,244
|
| Holdings [Text Block] |
Investment Type AllocationValue | Value |
|---|
Assets in Excess of Other Liabilities | 11.1% | U.S. Treasury Obligations | 9.5% | Collateralized Mortgage Obligations | 12.9% | Commercial Mortgage-Backed Securities | 18.2% | Asset-Backed Securities | 23.4% | Corporate Bonds/Notes | 24.9% |
|
| Largest Holdings [Text Block] |
Freddie Mac REMIC Trust - Class DF, 5.324%, 05/25/54 | 2.7% |
|---|
Fannie Mae REMIC Trust - Class FD, 5.224%, 04/25/54 | 2.0% |
|---|
Fannie Mae REMIC Trust - Class FH, 5.124%, 01/25/55 | 1.9% |
|---|
Sumitomo Mitsui Banking Corp./New York, 3.940%, 01/30/26 | 1.0% |
|---|
Freddie Mac REMIC Trust - Class FH, 4.974%, 10/25/54 | 0.9% |
|---|
Zaxbys Funding LLC - Class A2, 3.238%, 07/30/51 | 0.8% |
|---|
MHP Commercial Mortgage Trust - Class A, 5.250%, 09/15/40 | 0.7% |
|---|
Pagaya AI Debt Trust - Class B, 5.688%, 01/17/33 | 0.7% |
|---|
SMB Private Education Loan Trust - Class A1A, 5.130%, 04/15/54 | 0.7% |
|---|
Pagaya AI Debt Grantor Trust - Class A2, 5.365%, 12/15/32 | 0.7% |
|---|
|
| Material Fund Change [Text Block] |
|
| C000015798 |
|
| Shareholder Report [Line Items] |
|
| Fund Name |
Voya Large Cap Growth Portfolio
|
| Class Name |
Class ADV
|
| Trading Symbol |
IEOPX
|
| Annual or Semi-Annual Statement [Text Block] |
This annual shareholder report contains important information about Voya Large Cap Growth Portfolio for the period of January 1, 2025 to December 31, 2025.
|
| Shareholder Report Annual or Semi-Annual |
Annual Shareholder Report
|
| Additional Information Phone Number |
1-800-992-0180
|
| Expenses [Text Block] |
What were the Fund’s costs for the last year? (based on a hypothetical $10,000 investment)Class Name | Costs of $10K investment | Costs paid as % of $10K investment |
|---|
Class ADV | $134 | 1.25% |
|---|
|
| Expenses Paid, Amount |
$ 134
|
| Expense Ratio, Percent |
1.25%
|
| Factors Affecting Performance [Text Block] |
How did the Fund perform in the past 12 months?For the year ended December 31, 2025, the Fund underperformed the Russell 1000® Growth Index due to favorable stock selection. ↑ Top contributors to performance: Stock selection in communication services, consumer staples, and real estate sectors contributed the most to performance. On an individual stock basis, owning a non-benchmark position in Micron Technology, Inc., an overweight to the combined shares of Alphabet Inc. and an overweight position in Comfort Systems USA, Inc. contributed the most to performance. ↓ Top detractors from performance: Conversely, stock selection within the health care, consumer discretionary, & financials sectors detracted the most from performance. On an individual stock basis, positioning in UnitedHealth Group Inc., Atlassian Corp., & Doximity, Inc. detracted the most from performance. |
| Line Graph [Table Text Block] |
| Class ADV | Russell 3000® Index | Russell 1000® Growth Index |
|---|
2015 | $10,000 | $10,000 | $10,000 |
|---|
2016 | $10,333 | $11,274 | $10,708 |
|---|
2017 | $13,331 | $13,656 | $13,943 |
|---|
2018 | $13,056 | $12,941 | $13,732 |
|---|
2019 | $17,220 | $16,955 | $18,730 |
|---|
2020 | $22,405 | $20,497 | $25,939 |
|---|
2021 | $26,638 | $25,756 | $33,098 |
|---|
2022 | $18,387 | $20,808 | $23,453 |
|---|
2023 | $25,202 | $26,210 | $33,462 |
|---|
2024 | $33,786 | $32,449 | $44,624 |
|---|
2025 | $38,732 | $38,013 | $52,906 |
|---|
|
| Average Annual Return [Table Text Block] |
Fund | 1 Year
| 5 Years
| 10 Years
|
|---|
Class ADV
| 14.64% | 11.57% | 14.50% |
|---|
Russell 3000® Index | 17.15% | 13.15% | 14.29% |
|---|
Russell 1000® Growth Index | 18.56% | 15.32% | 18.13% |
|---|
|
| AssetsNet |
$ 3,705,757,905
|
| Holdings Count | Holding |
69
|
| Advisory Fees Paid, Amount |
$ 14,478,058
|
| InvestmentCompanyPortfolioTurnover |
53.00%
|
| Additional Fund Statistics [Text Block] |
- Total Net Assets$3,705,757,905
- # of Portfolio Holdings69
- Portfolio Turnover Rate53%
- Investment Advisory Fees Paid$14,478,058
|
| Holdings [Text Block] |
Value | Value |
|---|
Liabilities in Excess of Other Assets | (0.2)% | Short-Term Investments | 1.1% | Preferred Stock | 0.1% | Common Stock | 99.0% |
Value | Value |
|---|
Information Technology | 48.8% | Communication Services | 12.9% | Consumer Discretionary | 12.2% | Health Care | 8.9% | Industrials | 6.2% | Financials | 4.9% | Consumer Staples | 2.5% | Materials | 1.5% | Real Estate | 0.5% | Energy | 0.5% | Preferred Stock | 0.1% | Common Stock | 0.1% | Short-Term Investments | 1.1% | Liabilities in Excess of Other Assets | (0.2)% |
|
| Largest Holdings [Text Block] |
NVIDIA Corp. | 14.1% |
|---|
Microsoft Corp. | 11.2% |
|---|
Apple, Inc. | 9.0% |
|---|
Alphabet, Inc. - Class A | 7.7% |
|---|
Broadcom, Inc. | 5.2% |
|---|
Eli Lilly & Co. | 3.5% |
|---|
Visa, Inc. - Class A | 3.5% |
|---|
Amazon.com, Inc. | 3.0% |
|---|
Tesla, Inc. | 2.9% |
|---|
Meta Platforms, Inc. - Class A | 1.8% |
|---|
|
| Material Fund Change [Text Block] |
|
| C000015799 |
|
| Shareholder Report [Line Items] |
|
| Fund Name |
Voya Large Cap Growth Portfolio
|
| Class Name |
Class I
|
| Trading Symbol |
IEOHX
|
| Annual or Semi-Annual Statement [Text Block] |
This annual shareholder report contains important information about Voya Large Cap Growth Portfolio for the period of January 1, 2025 to December 31, 2025.
|
| Shareholder Report Annual or Semi-Annual |
Annual Shareholder Report
|
| Additional Information Phone Number |
1-800-992-0180
|
| Expenses [Text Block] |
What were the Fund’s costs for the last year? (based on a hypothetical $10,000 investment)Class Name | Costs of $10K investment | Costs paid as % of $10K investment |
|---|
Class I | $72 | 0.67% |
|---|
|
| Expenses Paid, Amount |
$ 72
|
| Expense Ratio, Percent |
0.67%
|
| Factors Affecting Performance [Text Block] |
How did the Fund perform in the past 12 months?For the year ended December 31, 2025, the Fund underperformed the Russell 1000® Growth Index due to favorable stock selection. ↑ Top contributors to performance: Stock selection in communication services, consumer staples, and real estate sectors contributed the most to performance. On an individual stock basis, owning a non-benchmark position in Micron Technology, Inc., an overweight to the combined shares of Alphabet Inc. and an overweight position in Comfort Systems USA, Inc. contributed the most to performance. ↓ Top detractors from performance: Conversely, stock selection within the health care, consumer discretionary, & financials sectors detracted the most from performance. On an individual stock basis, positioning in UnitedHealth Group Inc., Atlassian Corp., & Doximity, Inc. detracted the most from performance. |
| Line Graph [Table Text Block] |
| Class I | Russell 3000® Index | Russell 1000® Growth Index |
|---|
2015 | $10,000 | $10,000 | $10,000 |
|---|
2016 | $10,396 | $11,274 | $10,708 |
|---|
2017 | $13,488 | $13,656 | $13,943 |
|---|
2018 | $13,289 | $12,941 | $13,732 |
|---|
2019 | $17,643 | $16,955 | $18,730 |
|---|
2020 | $23,092 | $20,497 | $25,939 |
|---|
2021 | $27,606 | $25,756 | $33,098 |
|---|
2022 | $19,186 | $20,808 | $23,453 |
|---|
2023 | $26,448 | $26,210 | $33,462 |
|---|
2024 | $35,653 | $32,449 | $44,624 |
|---|
2025 | $41,118 | $38,013 | $52,906 |
|---|
|
| Average Annual Return [Table Text Block] |
Fund | 1 Year
| 5 Years
| 10 Years
|
|---|
Class I
| 15.33% | 12.23% | 15.19% |
|---|
Russell 3000® Index | 17.15% | 13.15% | 14.29% |
|---|
Russell 1000® Growth Index | 18.56% | 15.32% | 18.13% |
|---|
|
| AssetsNet |
$ 3,705,757,905
|
| Holdings Count | Holding |
69
|
| Advisory Fees Paid, Amount |
$ 14,478,058
|
| InvestmentCompanyPortfolioTurnover |
53.00%
|
| Additional Fund Statistics [Text Block] |
- Total Net Assets$3,705,757,905
- # of Portfolio Holdings69
- Portfolio Turnover Rate53%
- Investment Advisory Fees Paid$14,478,058
|
| Holdings [Text Block] |
Value | Value |
|---|
Liabilities in Excess of Other Assets | (0.2)% | Short-Term Investments | 1.1% | Preferred Stock | 0.1% | Common Stock | 99.0% |
Value | Value |
|---|
Information Technology | 48.8% | Communication Services | 12.9% | Consumer Discretionary | 12.2% | Health Care | 8.9% | Industrials | 6.2% | Financials | 4.9% | Consumer Staples | 2.5% | Materials | 1.5% | Real Estate | 0.5% | Energy | 0.5% | Preferred Stock | 0.1% | Common Stock | 0.1% | Short-Term Investments | 1.1% | Liabilities in Excess of Other Assets | (0.2)% |
|
| Largest Holdings [Text Block] |
NVIDIA Corp. | 14.1% |
|---|
Microsoft Corp. | 11.2% |
|---|
Apple, Inc. | 9.0% |
|---|
Alphabet, Inc. - Class A | 7.7% |
|---|
Broadcom, Inc. | 5.2% |
|---|
Eli Lilly & Co. | 3.5% |
|---|
Visa, Inc. - Class A | 3.5% |
|---|
Amazon.com, Inc. | 3.0% |
|---|
Tesla, Inc. | 2.9% |
|---|
Meta Platforms, Inc. - Class A | 1.8% |
|---|
|
| Material Fund Change [Text Block] |
|
| C000163203 |
|
| Shareholder Report [Line Items] |
|
| Fund Name |
Voya Large Cap Growth Portfolio
|
| Class Name |
Class R6
|
| Trading Symbol |
VRLCX
|
| Annual or Semi-Annual Statement [Text Block] |
This annual shareholder report contains important information about Voya Large Cap Growth Portfolio for the period of January 1, 2025 to December 31, 2025.
|
| Shareholder Report Annual or Semi-Annual |
Annual Shareholder Report
|
| Additional Information Phone Number |
1-800-992-0180
|
| Expenses [Text Block] |
What were the Fund’s costs for the last year? (based on a hypothetical $10,000 investment)Class Name | Costs of $10K investment | Costs paid as % of $10K investment |
|---|
Class R6 | $72 | 0.67% |
|---|
|
| Expenses Paid, Amount |
$ 72
|
| Expense Ratio, Percent |
0.67%
|
| Factors Affecting Performance [Text Block] |
How did the Fund perform in the past 12 months?For the year ended December 31, 2025, the Fund underperformed the Russell 1000® Growth Index due to favorable stock selection. ↑ Top contributors to performance: Stock selection in communication services, consumer staples, and real estate sectors contributed the most to performance. On an individual stock basis, owning a non-benchmark position in Micron Technology, Inc., an overweight to the combined shares of Alphabet Inc. and an overweight position in Comfort Systems USA, Inc. contributed the most to performance. ↓ Top detractors from performance: Conversely, stock selection within the health care, consumer discretionary, & financials sectors detracted the most from performance. On an individual stock basis, positioning in UnitedHealth Group Inc., Atlassian Corp., & Doximity, Inc. detracted the most from performance. |
| Line Graph [Table Text Block] |
| Class R6 | Russell 3000® Index | Russell 1000® Growth Index |
|---|
2015 | $10,000 | $10,000 | $10,000 |
|---|
2016 | $10,395 | $11,274 | $10,708 |
|---|
2017 | $13,493 | $13,656 | $13,943 |
|---|
2018 | $13,286 | $12,941 | $13,732 |
|---|
2019 | $17,647 | $16,955 | $18,730 |
|---|
2020 | $23,093 | $20,497 | $25,939 |
|---|
2021 | $27,615 | $25,756 | $33,098 |
|---|
2022 | $19,200 | $20,808 | $23,453 |
|---|
2023 | $26,454 | $26,210 | $33,462 |
|---|
2024 | $35,666 | $32,449 | $44,624 |
|---|
2025 | $41,121 | $38,013 | $52,906 |
|---|
|
| Average Annual Return [Table Text Block] |
Fund | 1 Year
| 5 Years
| 10 Years
|
|---|
Class R6 | 15.30% | 12.23% | 15.19% |
|---|
Russell 3000® Index | 17.15% | 13.15% | 14.29% |
|---|
Russell 1000® Growth Index | 18.56% | 15.32% | 18.13% |
|---|
|
| AssetsNet |
$ 3,705,757,905
|
| Holdings Count | Holding |
69
|
| Advisory Fees Paid, Amount |
$ 14,478,058
|
| InvestmentCompanyPortfolioTurnover |
53.00%
|
| Additional Fund Statistics [Text Block] |
- Total Net Assets$3,705,757,905
- # of Portfolio Holdings69
- Portfolio Turnover Rate53%
- Investment Advisory Fees Paid$14,478,058
|
| Holdings [Text Block] |
Value | Value |
|---|
Liabilities in Excess of Other Assets | (0.2)% | Short-Term Investments | 1.1% | Preferred Stock | 0.1% | Common Stock | 99.0% |
Value | Value |
|---|
Information Technology | 48.8% | Communication Services | 12.9% | Consumer Discretionary | 12.2% | Health Care | 8.9% | Industrials | 6.2% | Financials | 4.9% | Consumer Staples | 2.5% | Materials | 1.5% | Real Estate | 0.5% | Energy | 0.5% | Preferred Stock | 0.1% | Common Stock | 0.1% | Short-Term Investments | 1.1% | Liabilities in Excess of Other Assets | (0.2)% |
|
| Largest Holdings [Text Block] |
NVIDIA Corp. | 14.1% |
|---|
Microsoft Corp. | 11.2% |
|---|
Apple, Inc. | 9.0% |
|---|
Alphabet, Inc. - Class A | 7.7% |
|---|
Broadcom, Inc. | 5.2% |
|---|
Eli Lilly & Co. | 3.5% |
|---|
Visa, Inc. - Class A | 3.5% |
|---|
Amazon.com, Inc. | 3.0% |
|---|
Tesla, Inc. | 2.9% |
|---|
Meta Platforms, Inc. - Class A | 1.8% |
|---|
|
| Material Fund Change [Text Block] |
|
| C000015800 |
|
| Shareholder Report [Line Items] |
|
| Fund Name |
Voya Large Cap Growth Portfolio
|
| Class Name |
Class S
|
| Trading Symbol |
IEOSX
|
| Annual or Semi-Annual Statement [Text Block] |
This annual shareholder report contains important information about Voya Large Cap Growth Portfolio for the period of January 1, 2025 to December 31, 2025.
|
| Shareholder Report Annual or Semi-Annual |
Annual Shareholder Report
|
| Additional Information Phone Number |
1-800-992-0180
|
| Expenses [Text Block] |
What were the Fund’s costs for the last year? (based on a hypothetical $10,000 investment)Class Name | Costs of $10K investment | Costs paid as % of $10K investment |
|---|
Class S | $99 | 0.92% |
|---|
|
| Expenses Paid, Amount |
$ 99
|
| Expense Ratio, Percent |
0.92%
|
| Factors Affecting Performance [Text Block] |
How did the Fund perform in the past 12 months?For the year ended December 31, 2025, the Fund underperformed the Russell 1000® Growth Index due to favorable stock selection. ↑ Top contributors to performance: Stock selection in communication services, consumer staples, and real estate sectors contributed the most to performance. On an individual stock basis, owning a non-benchmark position in Micron Technology, Inc., an overweight to the combined shares of Alphabet Inc. and an overweight position in Comfort Systems USA, Inc. contributed the most to performance. ↓ Top detractors from performance: Conversely, stock selection within the health care, consumer discretionary, & financials sectors detracted the most from performance. On an individual stock basis, positioning in UnitedHealth Group Inc., Atlassian Corp., & Doximity, Inc. detracted the most from performance. |
| Line Graph [Table Text Block] |
| Class S | Russell 3000® Index | Russell 1000® Growth Index |
|---|
2015 | $10,000 | $10,000 | $10,000 |
|---|
2016 | $10,369 | $11,274 | $10,708 |
|---|
2017 | $13,419 | $13,656 | $13,943 |
|---|
2018 | $13,187 | $12,941 | $13,732 |
|---|
2019 | $17,461 | $16,955 | $18,730 |
|---|
2020 | $22,802 | $20,497 | $25,939 |
|---|
2021 | $27,197 | $25,756 | $33,098 |
|---|
2022 | $18,858 | $20,808 | $23,453 |
|---|
2023 | $25,907 | $26,210 | $33,462 |
|---|
2024 | $34,852 | $32,449 | $44,624 |
|---|
2025 | $40,110 | $38,013 | $52,906 |
|---|
|
| Average Annual Return [Table Text Block] |
Fund | 1 Year
| 5 Years
| 10 Years
|
|---|
Class S
| 15.09% | 11.96% | 14.90% |
|---|
Russell 3000® Index | 17.15% | 13.15% | 14.29% |
|---|
Russell 1000® Growth Index | 18.56% | 15.32% | 18.13% |
|---|
|
| AssetsNet |
$ 3,705,757,905
|
| Holdings Count | Holding |
69
|
| Advisory Fees Paid, Amount |
$ 14,478,058
|
| InvestmentCompanyPortfolioTurnover |
53.00%
|
| Additional Fund Statistics [Text Block] |
- Total Net Assets$3,705,757,905
- # of Portfolio Holdings69
- Portfolio Turnover Rate53%
- Investment Advisory Fees Paid$14,478,058
|
| Holdings [Text Block] |
Value | Value |
|---|
Liabilities in Excess of Other Assets | (0.2)% | Short-Term Investments | 1.1% | Preferred Stock | 0.1% | Common Stock | 99.0% |
Value | Value |
|---|
Information Technology | 48.8% | Communication Services | 12.9% | Consumer Discretionary | 12.2% | Health Care | 8.9% | Industrials | 6.2% | Financials | 4.9% | Consumer Staples | 2.5% | Materials | 1.5% | Real Estate | 0.5% | Energy | 0.5% | Preferred Stock | 0.1% | Common Stock | 0.1% | Short-Term Investments | 1.1% | Liabilities in Excess of Other Assets | (0.2)% |
|
| Largest Holdings [Text Block] |
NVIDIA Corp. | 14.1% |
|---|
Microsoft Corp. | 11.2% |
|---|
Apple, Inc. | 9.0% |
|---|
Alphabet, Inc. - Class A | 7.7% |
|---|
Broadcom, Inc. | 5.2% |
|---|
Eli Lilly & Co. | 3.5% |
|---|
Visa, Inc. - Class A | 3.5% |
|---|
Amazon.com, Inc. | 3.0% |
|---|
Tesla, Inc. | 2.9% |
|---|
Meta Platforms, Inc. - Class A | 1.8% |
|---|
|
| Material Fund Change [Text Block] |
|
| C000015801 |
|
| Shareholder Report [Line Items] |
|
| Fund Name |
Voya Large Cap Growth Portfolio
|
| Class Name |
Class S2
|
| Trading Symbol |
IEOTX
|
| Annual or Semi-Annual Statement [Text Block] |
This annual shareholder report contains important information about Voya Large Cap Growth Portfolio for the period of January 1, 2025 to December 31, 2025.
|
| Shareholder Report Annual or Semi-Annual |
Annual Shareholder Report
|
| Additional Information Phone Number |
1-800-992-0180
|
| Expenses [Text Block] |
What were the Fund’s costs for the last year? (based on a hypothetical $10,000 investment)Class Name | Costs of $10K investment | Costs paid as % of $10K investment |
|---|
Class S2 | $115 | 1.07% |
|---|
|
| Expenses Paid, Amount |
$ 115
|
| Expense Ratio, Percent |
1.07%
|
| Factors Affecting Performance [Text Block] |
How did the Fund perform in the past 12 months?For the year ended December 31, 2025, the Fund underperformed the Russell 1000® Growth Index due to favorable stock selection. ↑ Top contributors to performance: Stock selection in communication services, consumer staples, and real estate sectors contributed the most to performance. On an individual stock basis, owning a non-benchmark position in Micron Technology, Inc., an overweight to the combined shares of Alphabet Inc. and an overweight position in Comfort Systems USA, Inc. contributed the most to performance. ↓ Top detractors from performance: Conversely, stock selection within the health care, consumer discretionary, & financials sectors detracted the most from performance. On an individual stock basis, positioning in UnitedHealth Group Inc., Atlassian Corp., & Doximity, Inc. detracted the most from performance. |
| Line Graph [Table Text Block] |
| Class S2 | Russell 3000® Index | Russell 1000® Growth Index |
|---|
2015 | $10,000 | $10,000 | $10,000 |
|---|
2016 | $10,357 | $11,274 | $10,708 |
|---|
2017 | $13,383 | $13,656 | $13,943 |
|---|
2018 | $13,134 | $12,941 | $13,732 |
|---|
2019 | $17,358 | $16,955 | $18,730 |
|---|
2020 | $22,639 | $20,497 | $25,939 |
|---|
2021 | $26,963 | $25,756 | $33,098 |
|---|
2022 | $18,659 | $20,808 | $23,453 |
|---|
2023 | $25,611 | $26,210 | $33,462 |
|---|
2024 | $34,406 | $32,449 | $44,624 |
|---|
2025 | $39,494 | $38,013 | $52,906 |
|---|
|
| Average Annual Return [Table Text Block] |
Fund | 1 Year
| 5 Years
| 10 Years
|
|---|
Class S2
| 14.79% | 11.77% | 14.72% |
|---|
Russell 3000® Index | 17.15% | 13.15% | 14.29% |
|---|
Russell 1000® Growth Index | 18.56% | 15.32% | 18.13% |
|---|
|
| AssetsNet |
$ 3,705,757,905
|
| Holdings Count | Holding |
69
|
| Advisory Fees Paid, Amount |
$ 14,478,058
|
| InvestmentCompanyPortfolioTurnover |
53.00%
|
| Additional Fund Statistics [Text Block] |
- Total Net Assets$3,705,757,905
- # of Portfolio Holdings69
- Portfolio Turnover Rate53%
- Investment Advisory Fees Paid$14,478,058
|
| Holdings [Text Block] |
Value | Value |
|---|
Liabilities in Excess of Other Assets | (0.2)% | Short-Term Investments | 1.1% | Preferred Stock | 0.1% | Common Stock | 99.0% |
Value | Value |
|---|
Information Technology | 48.8% | Communication Services | 12.9% | Consumer Discretionary | 12.2% | Health Care | 8.9% | Industrials | 6.2% | Financials | 4.9% | Consumer Staples | 2.5% | Materials | 1.5% | Real Estate | 0.5% | Energy | 0.5% | Preferred Stock | 0.1% | Common Stock | 0.1% | Short-Term Investments | 1.1% | Liabilities in Excess of Other Assets | (0.2)% |
|
| Largest Holdings [Text Block] |
NVIDIA Corp. | 14.1% |
|---|
Microsoft Corp. | 11.2% |
|---|
Apple, Inc. | 9.0% |
|---|
Alphabet, Inc. - Class A | 7.7% |
|---|
Broadcom, Inc. | 5.2% |
|---|
Eli Lilly & Co. | 3.5% |
|---|
Visa, Inc. - Class A | 3.5% |
|---|
Amazon.com, Inc. | 3.0% |
|---|
Tesla, Inc. | 2.9% |
|---|
Meta Platforms, Inc. - Class A | 1.8% |
|---|
|
| Material Fund Change [Text Block] |
|
| C000034673 |
|
| Shareholder Report [Line Items] |
|
| Fund Name |
Voya Large Cap Value Portfolio
|
| Class Name |
Class ADV
|
| Trading Symbol |
IPEAX
|
| Annual or Semi-Annual Statement [Text Block] |
This annual shareholder report contains important information about Voya Large Cap Value Portfolio for the period of January 1, 2025 to December 31, 2025.
|
| Shareholder Report Annual or Semi-Annual |
Annual Shareholder Report
|
| Additional Information Phone Number |
1-800-992-0180
|
| Expenses [Text Block] |
What were the Fund’s costs for the last year? (based on a hypothetical $10,000 investment)Class Name | Costs of $10K investment | Costs paid as % of $10K investment |
|---|
Class ADV | $141 | 1.33% |
|---|
|
| Expenses Paid, Amount |
$ 141
|
| Expense Ratio, Percent |
1.33%
|
| Factors Affecting Performance [Text Block] |
How did the Fund perform in the past 12 months?For the year ended December 31, 2025, the Fund underperformed the Russell 1000® Value Index due to favorable stock selection. ↑ Top contributors to performance: On the sector level the communication services, real estate, & energy sectors had the largest positive impact on performance. At the individual stock level, the biggest contributors were our overweight positions in Micron Technology, Inc., Welltower Inc., and Warner Bros. Discovery, Inc. Series A. ↓ Top detractors from performance: On the sector level health care, industrials, & information technology sectors had negative impacts on performance. At the individual stock level, the biggest detractors included overweight positions in Kenvue, Inc., Globant SA, & Centene Corp. |
| Line Graph [Table Text Block] |
| Class ADV | Russell 3000® Index | Russell 1000® Value Index |
|---|
2015 | $10,000 | $10,000 | $10,000 |
|---|
2016 | $11,320 | $11,274 | $11,734 |
|---|
2017 | $12,774 | $13,656 | $13,337 |
|---|
2018 | $11,709 | $12,941 | $12,234 |
|---|
2019 | $14,572 | $16,955 | $15,481 |
|---|
2020 | $15,389 | $20,497 | $15,914 |
|---|
2021 | $19,428 | $25,756 | $19,918 |
|---|
2022 | $18,673 | $20,808 | $18,416 |
|---|
2023 | $21,105 | $26,210 | $20,527 |
|---|
2024 | $24,565 | $32,449 | $23,477 |
|---|
2025 | $27,535 | $38,013 | $27,211 |
|---|
|
| Average Annual Return [Table Text Block] |
Fund | 1 Year
| 5 Years
| 10 Years
|
|---|
Class ADV
| 12.09% | 12.34% | 10.66% |
|---|
Russell 3000® Index | 17.15% | 13.15% | 14.29% |
|---|
Russell 1000® Value Index | 15.91% | 11.33% | 10.53% |
|---|
|
| AssetsNet |
$ 522,620,923
|
| Holdings Count | Holding |
73
|
| Advisory Fees Paid, Amount |
$ 3,044,788
|
| InvestmentCompanyPortfolioTurnover |
114.00%
|
| Additional Fund Statistics [Text Block] |
- Total Net Assets$522,620,923
- # of Portfolio Holdings73
- Portfolio Turnover Rate114%
- Investment Advisory Fees Paid$3,044,788
|
| Holdings [Text Block] |
Value | Value |
|---|
Liabilities in Excess of Other Assets | (0.2)% | Short-Term Investments | 0.9% | Common Stock | 99.3% |
Value | Value |
|---|
Financials | 21.4% | Health Care | 13.3% | Information Technology | 10.6% | Industrials | 10.6% | Communication Services | 9.2% | Consumer Staples | 7.9% | Consumer Discretionary | 7.3% | Energy | 7.1% | Utilities | 5.0% | Real Estate | 4.3% | Materials | 2.6% | Short-Term Investments | 0.9% | Liabilities in Excess of Other Assets | (0.2)% |
|
| Largest Holdings [Text Block] |
Alphabet, Inc. - Class A | 4.3% |
|---|
Chevron Corp. | 4.3% |
|---|
Bank of America Corp. | 3.1% |
|---|
Wells Fargo & Co. | 2.6% |
|---|
Amazon.com, Inc. | 2.5% |
|---|
Welltower, Inc. | 2.4% |
|---|
Duke Energy Corp. | 2.3% |
|---|
Intercontinental Exchange, Inc. | 2.3% |
|---|
Coca-Cola Co. | 2.2% |
|---|
American International Group, Inc. | 2.2% |
|---|
|
| Material Fund Change [Text Block] |
|
| C000034674 |
|
| Shareholder Report [Line Items] |
|
| Fund Name |
Voya Large Cap Value Portfolio
|
| Class Name |
Class I
|
| Trading Symbol |
IPEIX
|
| Annual or Semi-Annual Statement [Text Block] |
This annual shareholder report contains important information about Voya Large Cap Value Portfolio for the period of January 1, 2025 to December 31, 2025.
|
| Shareholder Report Annual or Semi-Annual |
Annual Shareholder Report
|
| Additional Information Phone Number |
1-800-992-0180
|
| Expenses [Text Block] |
What were the Fund’s costs for the last year? (based on a hypothetical $10,000 investment)Class Name | Costs of $10K investment | Costs paid as % of $10K investment |
|---|
Class I | $78 | 0.73% |
|---|
|
| Expenses Paid, Amount |
$ 78
|
| Expense Ratio, Percent |
0.73%
|
| Factors Affecting Performance [Text Block] |
How did the Fund perform in the past 12 months?For the year ended December 31, 2025, the Fund underperformed the Russell 1000® Value Index due to favorable stock selection. ↑ Top contributors to performance: On the sector level the communication services, real estate, & energy sectors had the largest positive impact on performance. At the individual stock level, the biggest contributors were our overweight positions in Micron Technology, Inc., Welltower Inc., and Warner Bros. Discovery, Inc. Series A. ↓ Top detractors from performance: On the sector level health care, industrials, & information technology sectors had negative impacts on performance. At the individual stock level, the biggest detractors included overweight positions in Kenvue, Inc., Globant SA, & Centene Corp. |
| Line Graph [Table Text Block] |
| Class I | Russell 3000® Index | Russell 1000® Value Index |
|---|
2015 | $10,000 | $10,000 | $10,000 |
|---|
2016 | $11,389 | $11,274 | $11,734 |
|---|
2017 | $12,932 | $13,656 | $13,337 |
|---|
2018 | $11,922 | $12,941 | $12,234 |
|---|
2019 | $14,916 | $16,955 | $15,481 |
|---|
2020 | $15,852 | $20,497 | $15,914 |
|---|
2021 | $20,131 | $25,756 | $19,918 |
|---|
2022 | $19,486 | $20,808 | $18,416 |
|---|
2023 | $22,161 | $26,210 | $20,527 |
|---|
2024 | $25,942 | $32,449 | $23,477 |
|---|
2025 | $29,246 | $38,013 | $27,211 |
|---|
|
| Average Annual Return [Table Text Block] |
Fund | 1 Year
| 5 Years
| 10 Years
|
|---|
Class I
| 12.74% | 13.03% | 11.33% |
|---|
Russell 3000® Index | 17.15% | 13.15% | 14.29% |
|---|
Russell 1000® Value Index | 15.91% | 11.33% | 10.53% |
|---|
|
| AssetsNet |
$ 522,620,923
|
| Holdings Count | Holding |
73
|
| Advisory Fees Paid, Amount |
$ 3,044,788
|
| InvestmentCompanyPortfolioTurnover |
114.00%
|
| Additional Fund Statistics [Text Block] |
- Total Net Assets$522,620,923
- # of Portfolio Holdings73
- Portfolio Turnover Rate114%
- Investment Advisory Fees Paid$3,044,788
|
| Holdings [Text Block] |
Value | Value |
|---|
Liabilities in Excess of Other Assets | (0.2)% | Short-Term Investments | 0.9% | Common Stock | 99.3% |
Value | Value |
|---|
Financials | 21.4% | Health Care | 13.3% | Information Technology | 10.6% | Industrials | 10.6% | Communication Services | 9.2% | Consumer Staples | 7.9% | Consumer Discretionary | 7.3% | Energy | 7.1% | Utilities | 5.0% | Real Estate | 4.3% | Materials | 2.6% | Short-Term Investments | 0.9% | Liabilities in Excess of Other Assets | (0.2)% |
|
| Largest Holdings [Text Block] |
Alphabet, Inc. - Class A | 4.3% |
|---|
Chevron Corp. | 4.3% |
|---|
Bank of America Corp. | 3.1% |
|---|
Wells Fargo & Co. | 2.6% |
|---|
Amazon.com, Inc. | 2.5% |
|---|
Welltower, Inc. | 2.4% |
|---|
Duke Energy Corp. | 2.3% |
|---|
Intercontinental Exchange, Inc. | 2.3% |
|---|
Coca-Cola Co. | 2.2% |
|---|
American International Group, Inc. | 2.2% |
|---|
|
| Material Fund Change [Text Block] |
|
| C000163204 |
|
| Shareholder Report [Line Items] |
|
| Fund Name |
Voya Large Cap Value Portfolio
|
| Class Name |
Class R6
|
| Trading Symbol |
VLCRX
|
| Annual or Semi-Annual Statement [Text Block] |
This annual shareholder report contains important information about Voya Large Cap Value Portfolio for the period of January 1, 2025 to December 31, 2025.
|
| Shareholder Report Annual or Semi-Annual |
Annual Shareholder Report
|
| Additional Information Phone Number |
1-800-992-0180
|
| Expenses [Text Block] |
What were the Fund’s costs for the last year? (based on a hypothetical $10,000 investment)Class Name | Costs of $10K investment | Costs paid as % of $10K investment |
|---|
Class R6 | $78 | 0.73% |
|---|
|
| Expenses Paid, Amount |
$ 78
|
| Expense Ratio, Percent |
0.73%
|
| Factors Affecting Performance [Text Block] |
How did the Fund perform in the past 12 months?For the year ended December 31, 2025, the Fund underperformed the Russell 1000® Value Index due to favorable stock selection. ↑ Top contributors to performance: On the sector level the communication services, real estate, & energy sectors had the largest positive impact on performance. At the individual stock level, the biggest contributors were our overweight positions in Micron Technology, Inc., Welltower Inc., and Warner Bros. Discovery, Inc. Series A. ↓ Top detractors from performance: On the sector level health care, industrials, & information technology sectors had negative impacts on performance. At the individual stock level, the biggest detractors included overweight positions in Kenvue, Inc., Globant SA, & Centene Corp. |
| Line Graph [Table Text Block] |
| Class R6 | Russell 3000® Index | Russell 1000® Value Index |
|---|
2015 | $10,000 | $10,000 | $10,000 |
|---|
2016 | $11,380 | $11,274 | $11,734 |
|---|
2017 | $12,914 | $13,656 | $13,337 |
|---|
2018 | $11,914 | $12,941 | $12,234 |
|---|
2019 | $14,909 | $16,955 | $15,481 |
|---|
2020 | $15,844 | $20,497 | $15,914 |
|---|
2021 | $20,126 | $25,756 | $19,918 |
|---|
2022 | $19,469 | $20,808 | $18,416 |
|---|
2023 | $22,156 | $26,210 | $20,527 |
|---|
2024 | $25,920 | $32,449 | $23,477 |
|---|
2025 | $29,252 | $38,013 | $27,211 |
|---|
|
| Average Annual Return [Table Text Block] |
Fund | 1 Year
| 5 Years
| 10 Years
|
|---|
Class R6 | 12.86% | 13.05% | 11.33% |
|---|
Russell 3000® Index | 17.15% | 13.15% | 14.29% |
|---|
Russell 1000® Value Index | 15.91% | 11.33% | 10.53% |
|---|
|
| AssetsNet |
$ 522,620,923
|
| Holdings Count | Holding |
73
|
| Advisory Fees Paid, Amount |
$ 3,044,788
|
| InvestmentCompanyPortfolioTurnover |
114.00%
|
| Additional Fund Statistics [Text Block] |
- Total Net Assets$522,620,923
- # of Portfolio Holdings73
- Portfolio Turnover Rate114%
- Investment Advisory Fees Paid$3,044,788
|
| Holdings [Text Block] |
Value | Value |
|---|
Liabilities in Excess of Other Assets | (0.2)% | Short-Term Investments | 0.9% | Common Stock | 99.3% |
Value | Value |
|---|
Financials | 21.4% | Health Care | 13.3% | Information Technology | 10.6% | Industrials | 10.6% | Communication Services | 9.2% | Consumer Staples | 7.9% | Consumer Discretionary | 7.3% | Energy | 7.1% | Utilities | 5.0% | Real Estate | 4.3% | Materials | 2.6% | Short-Term Investments | 0.9% | Liabilities in Excess of Other Assets | (0.2)% |
|
| Largest Holdings [Text Block] |
Alphabet, Inc. - Class A | 4.3% |
|---|
Chevron Corp. | 4.3% |
|---|
Bank of America Corp. | 3.1% |
|---|
Wells Fargo & Co. | 2.6% |
|---|
Amazon.com, Inc. | 2.5% |
|---|
Welltower, Inc. | 2.4% |
|---|
Duke Energy Corp. | 2.3% |
|---|
Intercontinental Exchange, Inc. | 2.3% |
|---|
Coca-Cola Co. | 2.2% |
|---|
American International Group, Inc. | 2.2% |
|---|
|
| Material Fund Change [Text Block] |
|
| C000034675 |
|
| Shareholder Report [Line Items] |
|
| Fund Name |
Voya Large Cap Value Portfolio
|
| Class Name |
Class S
|
| Trading Symbol |
IPESX
|
| Annual or Semi-Annual Statement [Text Block] |
This annual shareholder report contains important information about Voya Large Cap Value Portfolio for the period of January 1, 2025 to December 31, 2025.
|
| Shareholder Report Annual or Semi-Annual |
Annual Shareholder Report
|
| Additional Information Phone Number |
1-800-992-0180
|
| Expenses [Text Block] |
What were the Fund’s costs for the last year? (based on a hypothetical $10,000 investment)Class Name | Costs of $10K investment | Costs paid as % of $10K investment |
|---|
Class S | $104 | 0.98% |
|---|
|
| Expenses Paid, Amount |
$ 104
|
| Expense Ratio, Percent |
0.98%
|
| Factors Affecting Performance [Text Block] |
How did the Fund perform in the past 12 months?For the year ended December 31, 2025, the Fund underperformed the Russell 1000® Value Index due to favorable stock selection. ↑ Top contributors to performance: On the sector level the communication services, real estate, & energy sectors had the largest positive impact on performance. At the individual stock level, the biggest contributors were our overweight positions in Micron Technology, Inc., Welltower Inc., and Warner Bros. Discovery, Inc. Series A. ↓ Top detractors from performance: On the sector level health care, industrials, & information technology sectors had negative impacts on performance. At the individual stock level, the biggest detractors included overweight positions in Kenvue, Inc., Globant SA, & Centene Corp. |
| Line Graph [Table Text Block] |
| Class S | Russell 3000® Index | Russell 1000® Value Index |
|---|
2015 | $10,000 | $10,000 | $10,000 |
|---|
2016 | $11,358 | $11,274 | $11,734 |
|---|
2017 | $12,861 | $13,656 | $13,337 |
|---|
2018 | $11,831 | $12,941 | $12,234 |
|---|
2019 | $14,763 | $16,955 | $15,481 |
|---|
2020 | $15,644 | $20,497 | $15,914 |
|---|
2021 | $19,817 | $25,756 | $19,918 |
|---|
2022 | $19,128 | $20,808 | $18,416 |
|---|
2023 | $21,669 | $26,210 | $20,527 |
|---|
2024 | $25,328 | $32,449 | $23,477 |
|---|
2025 | $28,539 | $38,013 | $27,211 |
|---|
|
| Average Annual Return [Table Text Block] |
Fund | 1 Year
| 5 Years
| 10 Years
|
|---|
Class S
| 12.68% | 12.78% | 11.06% |
|---|
Russell 3000® Index | 17.15% | 13.15% | 14.29% |
|---|
Russell 1000® Value Index | 15.91% | 11.33% | 10.53% |
|---|
|
| AssetsNet |
$ 522,620,923
|
| Holdings Count | Holding |
73
|
| Advisory Fees Paid, Amount |
$ 3,044,788
|
| InvestmentCompanyPortfolioTurnover |
114.00%
|
| Additional Fund Statistics [Text Block] |
- Total Net Assets$522,620,923
- # of Portfolio Holdings73
- Portfolio Turnover Rate114%
- Investment Advisory Fees Paid$3,044,788
|
| Holdings [Text Block] |
Value | Value |
|---|
Liabilities in Excess of Other Assets | (0.2)% | Short-Term Investments | 0.9% | Common Stock | 99.3% |
Value | Value |
|---|
Financials | 21.4% | Health Care | 13.3% | Information Technology | 10.6% | Industrials | 10.6% | Communication Services | 9.2% | Consumer Staples | 7.9% | Consumer Discretionary | 7.3% | Energy | 7.1% | Utilities | 5.0% | Real Estate | 4.3% | Materials | 2.6% | Short-Term Investments | 0.9% | Liabilities in Excess of Other Assets | (0.2)% |
|
| Largest Holdings [Text Block] |
Alphabet, Inc. - Class A | 4.3% |
|---|
Chevron Corp. | 4.3% |
|---|
Bank of America Corp. | 3.1% |
|---|
Wells Fargo & Co. | 2.6% |
|---|
Amazon.com, Inc. | 2.5% |
|---|
Welltower, Inc. | 2.4% |
|---|
Duke Energy Corp. | 2.3% |
|---|
Intercontinental Exchange, Inc. | 2.3% |
|---|
Coca-Cola Co. | 2.2% |
|---|
American International Group, Inc. | 2.2% |
|---|
|
| Material Fund Change [Text Block] |
|
| C000034676 |
|
| Shareholder Report [Line Items] |
|
| Fund Name |
Voya Large Cap Value Portfolio
|
| Class Name |
Class S2
|
| Trading Symbol |
IPETX
|
| Annual or Semi-Annual Statement [Text Block] |
This annual shareholder report contains important information about Voya Large Cap Value Portfolio for the period of January 1, 2025 to December 31, 2025.
|
| Shareholder Report Annual or Semi-Annual |
Annual Shareholder Report
|
| Additional Information Phone Number |
1-800-992-0180
|
| Expenses [Text Block] |
What were the Fund’s costs for the last year? (based on a hypothetical $10,000 investment)Class Name | Costs of $10K investment | Costs paid as % of $10K investment |
|---|
Class S2 | $120 | 1.13% |
|---|
|
| Expenses Paid, Amount |
$ 120
|
| Expense Ratio, Percent |
1.13%
|
| Factors Affecting Performance [Text Block] |
How did the Fund perform in the past 12 months?For the year ended December 31, 2025, the Fund underperformed the Russell 1000® Value Index due to favorable stock selection. ↑ Top contributors to performance: On the sector level the communication services, real estate, & energy sectors had the largest positive impact on performance. At the individual stock level, the biggest contributors were our overweight positions in Micron Technology, Inc., Welltower Inc., and Warner Bros. Discovery, Inc. Series A. ↓ Top detractors from performance: On the sector level health care, industrials, & information technology sectors had negative impacts on performance. At the individual stock level, the biggest detractors included overweight positions in Kenvue, Inc., Globant SA, & Centene Corp. |
| Line Graph [Table Text Block] |
| Class S2 | Russell 3000® Index | Russell 1000® Value Index |
|---|
2015 | $10,000 | $10,000 | $10,000 |
|---|
2016 | $11,340 | $11,274 | $11,734 |
|---|
2017 | $12,825 | $13,656 | $13,337 |
|---|
2018 | $11,783 | $12,941 | $12,234 |
|---|
2019 | $14,686 | $16,955 | $15,481 |
|---|
2020 | $15,546 | $20,497 | $15,914 |
|---|
2021 | $19,656 | $25,756 | $19,918 |
|---|
2022 | $18,931 | $20,808 | $18,416 |
|---|
2023 | $21,437 | $26,210 | $20,527 |
|---|
2024 | $25,023 | $32,449 | $23,477 |
|---|
2025 | $28,134 | $38,013 | $27,211 |
|---|
|
| Average Annual Return [Table Text Block] |
Fund | 1 Year
| 5 Years
| 10 Years
|
|---|
Class S2
| 12.43% | 12.60% | 10.90% |
|---|
Russell 3000® Index | 17.15% | 13.15% | 14.29% |
|---|
Russell 1000® Value Index | 15.91% | 11.33% | 10.53% |
|---|
|
| AssetsNet |
$ 522,620,923
|
| Holdings Count | Holding |
73
|
| Advisory Fees Paid, Amount |
$ 3,044,788
|
| InvestmentCompanyPortfolioTurnover |
114.00%
|
| Additional Fund Statistics [Text Block] |
- Total Net Assets$522,620,923
- # of Portfolio Holdings73
- Portfolio Turnover Rate114%
- Investment Advisory Fees Paid$3,044,788
|
| Holdings [Text Block] |
Value | Value |
|---|
Liabilities in Excess of Other Assets | (0.2)% | Short-Term Investments | 0.9% | Common Stock | 99.3% |
Value | Value |
|---|
Financials | 21.4% | Health Care | 13.3% | Information Technology | 10.6% | Industrials | 10.6% | Communication Services | 9.2% | Consumer Staples | 7.9% | Consumer Discretionary | 7.3% | Energy | 7.1% | Utilities | 5.0% | Real Estate | 4.3% | Materials | 2.6% | Short-Term Investments | 0.9% | Liabilities in Excess of Other Assets | (0.2)% |
|
| Largest Holdings [Text Block] |
Alphabet, Inc. - Class A | 4.3% |
|---|
Chevron Corp. | 4.3% |
|---|
Bank of America Corp. | 3.1% |
|---|
Wells Fargo & Co. | 2.6% |
|---|
Amazon.com, Inc. | 2.5% |
|---|
Welltower, Inc. | 2.4% |
|---|
Duke Energy Corp. | 2.3% |
|---|
Intercontinental Exchange, Inc. | 2.3% |
|---|
Coca-Cola Co. | 2.2% |
|---|
American International Group, Inc. | 2.2% |
|---|
|
| Material Fund Change [Text Block] |
|
| C000015349 |
|
| Shareholder Report [Line Items] |
|
| Fund Name |
Voya Limited Maturity Bond Portfolio
|
| Class Name |
Class ADV
|
| Trading Symbol |
IMBAX
|
| Annual or Semi-Annual Statement [Text Block] |
This annual shareholder report contains important information about Voya Limited Maturity Bond Portfolio for the period of January 1, 2025 to December 31, 2025.
|
| Shareholder Report Annual or Semi-Annual |
Annual Shareholder Report
|
| Additional Information Phone Number |
1-800-992-0180
|
| Expenses [Text Block] |
What were the Fund’s costs for the last year? (based on a hypothetical $10,000 investment)Class Name | Costs of $10K investment | Costs paid as % of $10K investment |
|---|
Class ADV | $90 | 0.88% |
|---|
|
| Expenses Paid, Amount |
$ 90
|
| Expense Ratio, Percent |
0.88%
|
| Factors Affecting Performance [Text Block] |
How did the Fund perform in the past 12 months?For the year ended December 31, 2025, the Fund outperformed the Bloomberg U.S 1-3 Year Government/Credit Bond Index on a net asset value basis. Sector allocation contributed the most to performance, followed by duration & curve positioning. Meanwhile, security selection decisions detracted. ↑ Top contributors to performance: Sector allocation contributed the most to performance. Contributions came primarily from non-agency commercial mortgage-backed securities (CMBS) and an allocation to agency MBS. The general positive macro backdrop was positive for investment grade corporate allocations, as spreads grinded tighter and the steepening of the yield curve in 2025 contributed given our longer duration position established in the second half of the year. ↓ Top detractors from performance: Security selection detracted. |
| Line Graph [Table Text Block] |
| Class ADV | Bloomberg U.S. Aggregate Bond Index | Bloomberg U.S. 1-3 Year Government/Credit Bond Index |
|---|
2015 | $10,000 | $10,000 | $10,000 |
|---|
2016 | $10,090 | $10,265 | $10,128 |
|---|
2017 | $10,185 | $10,628 | $10,213 |
|---|
2018 | $10,257 | $10,629 | $10,376 |
|---|
2019 | $10,632 | $11,556 | $10,795 |
|---|
2020 | $10,937 | $12,424 | $11,154 |
|---|
2021 | $10,877 | $12,233 | $11,102 |
|---|
2022 | $10,305 | $10,641 | $10,692 |
|---|
2023 | $10,735 | $11,230 | $11,185 |
|---|
2024 | $11,220 | $11,370 | $11,672 |
|---|
2025 | $11,790 | $12,200 | $12,296 |
|---|
|
| Average Annual Return [Table Text Block] |
Fund | 1 Year
| 5 Years
| 10 Years
|
|---|
Class ADV
| 5.08% | 1.51% | 1.66% |
|---|
Bloomberg U.S. Aggregate Bond Index | 7.30% | -0.36% | 2.01% |
|---|
Bloomberg U.S. 1-3 Year Government/Credit Bond Index | 5.35% | 1.97% | 2.09% |
|---|
|
| AssetsNet |
$ 284,425,693
|
| Holdings Count | Holding |
562
|
| Advisory Fees Paid, Amount |
$ 744,719
|
| InvestmentCompanyPortfolioTurnover |
196.00%
|
| Additional Fund Statistics [Text Block] |
- Total Net Assets$284,425,693
- # of Portfolio Holdings562
- Portfolio Turnover Rate196%
- Investment Advisory Fees Paid$744,719
|
| Holdings [Text Block] |
Investment Type AllocationValue | Value |
|---|
Assets in Excess of Other Liabilities | 9.1% | U.S. Government Agency Obligations | 0.0% | U.S. Treasury Obligations | 5.9% | Collateralized Mortgage Obligations | 11.6% | Commercial Mortgage-Backed Securities | 12.8% | Asset-Backed Securities | 18.0% | Corporate Bonds/Notes | 42.6% |
|
| Largest Holdings [Text Block] |
United States Treasury Notes, 4.000%, 01/15/27 | 2.3% |
|---|
Freddie Mac REMIC Trust - Class DF, 5.324%, 05/25/54 | 1.6% |
|---|
Fannie Mae REMIC Trust - Class FH, 5.124%, 01/25/55 | 1.3% |
|---|
United States Treasury Notes, 3.375%, 12/31/27 | 1.3% |
|---|
Fannie Mae REMIC Trust - Class FD, 5.224%, 04/25/54 | 1.2% |
|---|
Fannie Mae REMIC Trust - Class DF, 5.124%, 12/25/54 | 1.0% |
|---|
Ginnie Mae - Class FC, 4.564%, 07/20/70 | 0.8% |
|---|
Freddie Mac REMIC Trust - Class FG, 5.274%, 02/25/55 | 0.7% |
|---|
United States Treasury Notes, 3.875%, 12/31/32 | 0.7% |
|---|
BXSC Commercial Mortgage Trust - Class B, 5.843%, 03/15/35 | 0.6% |
|---|
|
| Material Fund Change [Text Block] |
|
| C000015350 |
|
| Shareholder Report [Line Items] |
|
| Fund Name |
Voya Limited Maturity Bond Portfolio
|
| Class Name |
Class I
|
| Trading Symbol |
ILBPX
|
| Annual or Semi-Annual Statement [Text Block] |
This annual shareholder report contains important information about Voya Limited Maturity Bond Portfolio for the period of January 1, 2025 to December 31, 2025.
|
| Shareholder Report Annual or Semi-Annual |
Annual Shareholder Report
|
| Additional Information Phone Number |
1-800-992-0180
|
| Expenses [Text Block] |
What were the Fund’s costs for the last year? (based on a hypothetical $10,000 investment)Class Name | Costs of $10K investment | Costs paid as % of $10K investment |
|---|
Class I | $29 | 0.28% |
|---|
|
| Expenses Paid, Amount |
$ 29
|
| Expense Ratio, Percent |
0.28%
|
| Factors Affecting Performance [Text Block] |
How did the Fund perform in the past 12 months?For the year ended December 31, 2025, the Fund outperformed the Bloomberg U.S 1-3 Year Government/Credit Bond Index on a net asset value basis. Sector allocation contributed the most to performance, followed by duration & curve positioning. Meanwhile, security selection decisions detracted. ↑ Top contributors to performance: Sector allocation contributed the most to performance. Contributions came primarily from non-agency commercial mortgage-backed securities (CMBS) and an allocation to agency MBS. The general positive macro backdrop was positive for investment grade corporate allocations, as spreads grinded tighter and the steepening of the yield curve in 2025 contributed given our longer duration position established in the second half of the year. ↓ Top detractors from performance: Security selection detracted. |
| Line Graph [Table Text Block] |
| Class I | Bloomberg U.S. Aggregate Bond Index | Bloomberg U.S. 1-3 Year Government/Credit Bond Index |
|---|
2015 | $10,000 | $10,000 | $10,000 |
|---|
2016 | $10,153 | $10,265 | $10,128 |
|---|
2017 | $10,300 | $10,628 | $10,213 |
|---|
2018 | $10,436 | $10,629 | $10,376 |
|---|
2019 | $10,888 | $11,556 | $10,795 |
|---|
2020 | $11,265 | $12,424 | $11,154 |
|---|
2021 | $11,274 | $12,233 | $11,102 |
|---|
2022 | $10,749 | $10,641 | $10,692 |
|---|
2023 | $11,264 | $11,230 | $11,185 |
|---|
2024 | $11,843 | $11,370 | $11,672 |
|---|
2025 | $12,516 | $12,200 | $12,296 |
|---|
|
| Average Annual Return [Table Text Block] |
Fund | 1 Year
| 5 Years
| 10 Years
|
|---|
Class I
| 5.69% | 2.13% | 2.27% |
|---|
Bloomberg U.S. Aggregate Bond Index | 7.30% | -0.36% | 2.01% |
|---|
Bloomberg U.S. 1-3 Year Government/Credit Bond Index | 5.35% | 1.97% | 2.09% |
|---|
|
| AssetsNet |
$ 284,425,693
|
| Holdings Count | Holding |
562
|
| Advisory Fees Paid, Amount |
$ 744,719
|
| InvestmentCompanyPortfolioTurnover |
196.00%
|
| Additional Fund Statistics [Text Block] |
- Total Net Assets$284,425,693
- # of Portfolio Holdings562
- Portfolio Turnover Rate196%
- Investment Advisory Fees Paid$744,719
|
| Holdings [Text Block] |
Investment Type AllocationValue | Value |
|---|
Assets in Excess of Other Liabilities | 9.1% | U.S. Government Agency Obligations | 0.0% | U.S. Treasury Obligations | 5.9% | Collateralized Mortgage Obligations | 11.6% | Commercial Mortgage-Backed Securities | 12.8% | Asset-Backed Securities | 18.0% | Corporate Bonds/Notes | 42.6% |
|
| Largest Holdings [Text Block] |
United States Treasury Notes, 4.000%, 01/15/27 | 2.3% |
|---|
Freddie Mac REMIC Trust - Class DF, 5.324%, 05/25/54 | 1.6% |
|---|
Fannie Mae REMIC Trust - Class FH, 5.124%, 01/25/55 | 1.3% |
|---|
United States Treasury Notes, 3.375%, 12/31/27 | 1.3% |
|---|
Fannie Mae REMIC Trust - Class FD, 5.224%, 04/25/54 | 1.2% |
|---|
Fannie Mae REMIC Trust - Class DF, 5.124%, 12/25/54 | 1.0% |
|---|
Ginnie Mae - Class FC, 4.564%, 07/20/70 | 0.8% |
|---|
Freddie Mac REMIC Trust - Class FG, 5.274%, 02/25/55 | 0.7% |
|---|
United States Treasury Notes, 3.875%, 12/31/32 | 0.7% |
|---|
BXSC Commercial Mortgage Trust - Class B, 5.843%, 03/15/35 | 0.6% |
|---|
|
| Material Fund Change [Text Block] |
|
| C000015351 |
|
| Shareholder Report [Line Items] |
|
| Fund Name |
Voya Limited Maturity Bond Portfolio
|
| Class Name |
Class S
|
| Trading Symbol |
ILMBX
|
| Annual or Semi-Annual Statement [Text Block] |
This annual shareholder report contains important information about Voya Limited Maturity Bond Portfolio for the period of January 1, 2025 to December 31, 2025.
|
| Shareholder Report Annual or Semi-Annual |
Annual Shareholder Report
|
| Additional Information Phone Number |
1-800-992-0180
|
| Expenses [Text Block] |
What were the Fund’s costs for the last year? (based on a hypothetical $10,000 investment)Class Name | Costs of $10K investment | Costs paid as % of $10K investment |
|---|
Class S | $54 | 0.53% |
|---|
|
| Expenses Paid, Amount |
$ 54
|
| Expense Ratio, Percent |
0.53%
|
| Factors Affecting Performance [Text Block] |
How did the Fund perform in the past 12 months?For the year ended December 31, 2025, the Fund outperformed the Bloomberg U.S 1-3 Year Government/Credit Bond Index on a net asset value basis. Sector allocation contributed the most to performance, followed by duration & curve positioning. Meanwhile, security selection decisions detracted. ↑ Top contributors to performance: Sector allocation contributed the most to performance. Contributions came primarily from non-agency commercial mortgage-backed securities (CMBS) and an allocation to agency MBS. The general positive macro backdrop was positive for investment grade corporate allocations, as spreads grinded tighter and the steepening of the yield curve in 2025 contributed given our longer duration position established in the second half of the year. ↓ Top detractors from performance: Security selection detracted. |
| Line Graph [Table Text Block] |
| Class S | Bloomberg U.S. Aggregate Bond Index | Bloomberg U.S. 1-3 Year Government/Credit Bond Index |
|---|
2015 | $10,000 | $10,000 | $10,000 |
|---|
2016 | $10,128 | $10,265 | $10,128 |
|---|
2017 | $10,250 | $10,628 | $10,213 |
|---|
2018 | $10,360 | $10,629 | $10,376 |
|---|
2019 | $10,780 | $11,556 | $10,795 |
|---|
2020 | $11,124 | $12,424 | $11,154 |
|---|
2021 | $11,107 | $12,233 | $11,102 |
|---|
2022 | $10,558 | $10,641 | $10,692 |
|---|
2023 | $11,035 | $11,230 | $11,185 |
|---|
2024 | $11,573 | $11,370 | $11,672 |
|---|
2025 | $12,200 | $12,200 | $12,296 |
|---|
|
| Average Annual Return [Table Text Block] |
Fund | 1 Year
| 5 Years
| 10 Years
|
|---|
Class S
| 5.42% | 1.86% | 2.01% |
|---|
Bloomberg U.S. Aggregate Bond Index | 7.30% | -0.36% | 2.01% |
|---|
Bloomberg U.S. 1-3 Year Government/Credit Bond Index | 5.35% | 1.97% | 2.09% |
|---|
|
| AssetsNet |
$ 284,425,693
|
| Holdings Count | Holding |
562
|
| Advisory Fees Paid, Amount |
$ 744,719
|
| InvestmentCompanyPortfolioTurnover |
196.00%
|
| Additional Fund Statistics [Text Block] |
- Total Net Assets$284,425,693
- # of Portfolio Holdings562
- Portfolio Turnover Rate196%
- Investment Advisory Fees Paid$744,719
|
| Holdings [Text Block] |
Investment Type AllocationValue | Value |
|---|
Assets in Excess of Other Liabilities | 9.1% | U.S. Government Agency Obligations | 0.0% | U.S. Treasury Obligations | 5.9% | Collateralized Mortgage Obligations | 11.6% | Commercial Mortgage-Backed Securities | 12.8% | Asset-Backed Securities | 18.0% | Corporate Bonds/Notes | 42.6% |
|
| Largest Holdings [Text Block] |
United States Treasury Notes, 4.000%, 01/15/27 | 2.3% |
|---|
Freddie Mac REMIC Trust - Class DF, 5.324%, 05/25/54 | 1.6% |
|---|
Fannie Mae REMIC Trust - Class FH, 5.124%, 01/25/55 | 1.3% |
|---|
United States Treasury Notes, 3.375%, 12/31/27 | 1.3% |
|---|
Fannie Mae REMIC Trust - Class FD, 5.224%, 04/25/54 | 1.2% |
|---|
Fannie Mae REMIC Trust - Class DF, 5.124%, 12/25/54 | 1.0% |
|---|
Ginnie Mae - Class FC, 4.564%, 07/20/70 | 0.8% |
|---|
Freddie Mac REMIC Trust - Class FG, 5.274%, 02/25/55 | 0.7% |
|---|
United States Treasury Notes, 3.875%, 12/31/32 | 0.7% |
|---|
BXSC Commercial Mortgage Trust - Class B, 5.843%, 03/15/35 | 0.6% |
|---|
|
| Material Fund Change [Text Block] |
|
| C000079016 |
|
| Shareholder Report [Line Items] |
|
| Fund Name |
Voya Retirement Conservative Portfolio
|
| Class Name |
Class ADV
|
| Trading Symbol |
IRCAX
|
| Annual or Semi-Annual Statement [Text Block] |
This annual shareholder report contains important information about Voya Retirement Conservative Portfolio for the period of January 1, 2025 to December 31, 2025.
|
| Shareholder Report Annual or Semi-Annual |
Annual Shareholder Report
|
| Additional Information Phone Number |
1-800-992-0180
|
| Expenses [Text Block] |
What were the Fund’s costs for the last year? (based on a hypothetical $10,000 investment)Class Name | Costs of $10K investment | Costs paid as % of $10K investment |
|---|
Class ADV | $59 | 0.56% |
|---|
|
| Expenses Paid, Amount |
$ 59
|
| Expense Ratio, Percent |
0.56%
|
| Factors Affecting Performance [Text Block] |
How did the Fund perform in the past 12 months?For the year ended December 31, 2025, the Portfolio underperformed the S&P Target Risk® Conservative Index. ↑ Top contributors to performance: Underlying fund selection & tactical asset allocation had positive impacts. On an individual holdings level, Voya Multi-Manager Emerging Market Equity was the key contributor. Futures were utilized to avoid significant underlying manager disruption and provided liquidity. The impact of the derivatives was in line with expectations of the tactical asset allocation positions. ↓ Top detractors from performance: On an individual holdings level, Vanguard FTSE Emerging Market ETF was the key detractor. |
| Line Graph [Table Text Block] |
| Class ADV | MSCI All Country World Index℠ | Bloomberg U.S. Aggregate Bond Index | S&P Target Risk® Conservative Index |
|---|
2015 | $10,000 | $10,000 | $10,000 | $10,000 |
|---|
2016 | $10,468 | $10,786 | $10,265 | $10,526 |
|---|
2017 | $11,280 | $13,371 | $10,628 | $11,547 |
|---|
2018 | $10,971 | $12,113 | $10,629 | $11,232 |
|---|
2019 | $12,463 | $15,335 | $11,556 | $12,803 |
|---|
2020 | $13,751 | $17,827 | $12,424 | $14,041 |
|---|
2021 | $14,396 | $21,132 | $12,233 | $14,742 |
|---|
2022 | $12,382 | $17,252 | $10,641 | $12,679 |
|---|
2023 | $13,470 | $21,083 | $11,230 | $14,066 |
|---|
2024 | $14,235 | $24,770 | $11,370 | $14,993 |
|---|
2025 | $15,549 | $30,303 | $12,200 | $16,754 |
|---|
|
| Average Annual Return [Table Text Block] |
Fund | 1 Year
| 5 Years
| 10 Years
|
|---|
Class ADV
| 9.23% | 2.49% | 4.51% |
|---|
MSCI All Country World Index℠ | 22.34% | 11.19% | 11.72% |
|---|
Bloomberg U.S. Aggregate Bond Index | 7.30% | -0.36% | 2.01% |
|---|
S&P Target Risk® Conservative Index | 11.74% | 3.60% | 5.30% |
|---|
|
| AssetsNet |
$ 84,291,998
|
| Holdings Count | Holding |
10
|
| Advisory Fees Paid, Amount |
$ 494,714
|
| InvestmentCompanyPortfolioTurnover |
19.00%
|
| Additional Fund Statistics [Text Block] |
- Total Net Assets$84,291,998
- # of Portfolio Holdings10
- Portfolio Turnover Rate19%
- Investment Advisory Fees Paid$494,714
|
| Holdings [Text Block] |
Value | Value |
|---|
Assets in Excess of Other Liabilities | 0.1% | Equity | 25.8% | Fixed Income | 74.1% |
|
| Largest Holdings [Text Block] |
Voya U.S. Bond Index Portfolio - Class I | 46.5% |
|---|
Voya U.S. Stock Index Portfolio - Class I | 18.6% |
|---|
Voya Short Duration Bond Fund - Class R6 | 13.9% |
|---|
Vanguard Short-Term Bond ETF | 4.9% |
|---|
Voya High Yield Bond Fund - Class R6 | 4.0% |
|---|
Voya International Index Portfolio - Class I | 3.1% |
|---|
Schwab U.S. TIPS ETF | 2.9% |
|---|
Voya Multi-Manager Emerging Markets Equity Fund - Class I | 2.2% |
|---|
Voya Russell™ Mid Cap Index Portfolio - Class I | 1.9% |
|---|
Vanguard Long-Term Treasury ETF | 1.9% |
|---|
|
| Material Fund Change [Text Block] |
|
| C000079017 |
|
| Shareholder Report [Line Items] |
|
| Fund Name |
Voya Retirement Conservative Portfolio
|
| Class Name |
Class I
|
| Trading Symbol |
IRCPX
|
| Annual or Semi-Annual Statement [Text Block] |
This annual shareholder report contains important information about Voya Retirement Conservative Portfolio for the period of January 1, 2025 to December 31, 2025.
|
| Shareholder Report Annual or Semi-Annual |
Annual Shareholder Report
|
| Additional Information Phone Number |
1-800-992-0180
|
| Expenses [Text Block] |
What were the Fund’s costs for the last year? (based on a hypothetical $10,000 investment)Class Name | Costs of $10K investment | Costs paid as % of $10K investment |
|---|
Class I | $34 | 0.32% |
|---|
|
| Expenses Paid, Amount |
$ 34
|
| Expense Ratio, Percent |
0.32%
|
| Factors Affecting Performance [Text Block] |
How did the Fund perform in the past 12 months?For the year ended December 31, 2025, the Portfolio underperformed the S&P Target Risk® Conservative Index. ↑ Top contributors to performance: Underlying fund selection & tactical asset allocation had positive impacts. On an individual holdings level, Voya Multi-Manager Emerging Market Equity was the key contributor. Futures were utilized to avoid significant underlying manager disruption and provided liquidity. The impact of the derivatives was in line with expectations of the tactical asset allocation positions. ↓ Top detractors from performance: On an individual holdings level, Vanguard FTSE Emerging Market ETF was the key detractor. |
| Line Graph [Table Text Block] |
| Class I | MSCI All Country World Index℠ | Bloomberg U.S. Aggregate Bond Index | S&P Target Risk® Conservative Index |
|---|
2015 | $10,000 | $10,000 | $10,000 | $10,000 |
|---|
2016 | $10,473 | $10,786 | $10,265 | $10,526 |
|---|
2017 | $11,291 | $13,371 | $10,628 | $11,547 |
|---|
2018 | $11,004 | $12,113 | $10,629 | $11,232 |
|---|
2019 | $12,523 | $15,335 | $11,556 | $12,803 |
|---|
2020 | $13,873 | $17,827 | $12,424 | $14,041 |
|---|
2021 | $14,549 | $21,132 | $12,233 | $14,742 |
|---|
2022 | $12,559 | $17,252 | $10,641 | $12,679 |
|---|
2023 | $13,697 | $21,083 | $11,230 | $14,066 |
|---|
2024 | $14,498 | $24,770 | $11,370 | $14,993 |
|---|
2025 | $15,880 | $30,303 | $12,200 | $16,754 |
|---|
|
| Average Annual Return [Table Text Block] |
Fund | 1 Year
| 5 Years
| 10 Years
|
|---|
Class I
| 9.53% | 2.74% | 4.73% |
|---|
MSCI All Country World Index℠ | 22.34% | 11.19% | 11.72% |
|---|
Bloomberg U.S. Aggregate Bond Index | 7.30% | -0.36% | 2.01% |
|---|
S&P Target Risk® Conservative Index | 11.74% | 3.60% | 5.30% |
|---|
|
| AssetsNet |
$ 84,291,998
|
| Holdings Count | Holding |
10
|
| Advisory Fees Paid, Amount |
$ 494,714
|
| InvestmentCompanyPortfolioTurnover |
19.00%
|
| Additional Fund Statistics [Text Block] |
- Total Net Assets$84,291,998
- # of Portfolio Holdings10
- Portfolio Turnover Rate19%
- Investment Advisory Fees Paid$494,714
|
| Holdings [Text Block] |
Value | Value |
|---|
Assets in Excess of Other Liabilities | 0.1% | Equity | 25.8% | Fixed Income | 74.1% |
|
| Largest Holdings [Text Block] |
Voya U.S. Bond Index Portfolio - Class I | 46.5% |
|---|
Voya U.S. Stock Index Portfolio - Class I | 18.6% |
|---|
Voya Short Duration Bond Fund - Class R6 | 13.9% |
|---|
Vanguard Short-Term Bond ETF | 4.9% |
|---|
Voya High Yield Bond Fund - Class R6 | 4.0% |
|---|
Voya International Index Portfolio - Class I | 3.1% |
|---|
Schwab U.S. TIPS ETF | 2.9% |
|---|
Voya Multi-Manager Emerging Markets Equity Fund - Class I | 2.2% |
|---|
Voya Russell™ Mid Cap Index Portfolio - Class I | 1.9% |
|---|
Vanguard Long-Term Treasury ETF | 1.9% |
|---|
|
| Material Fund Change [Text Block] |
|
| C000079018 |
|
| Shareholder Report [Line Items] |
|
| Fund Name |
Voya Retirement Aggressive Portfolio
|
| Class Name |
Class ADV
|
| Trading Symbol |
IRGPX
|
| Annual or Semi-Annual Statement [Text Block] |
This annual shareholder report contains important information about Voya Retirement Aggressive Portfolio for the period of January 1, 2025 to December 31, 2025.
|
| Shareholder Report Annual or Semi-Annual |
Annual Shareholder Report
|
| Material Fund Change Notice [Text Block] |
This report describes changes to the Fund that occurred during the reporting period.
|
| Additional Information Phone Number |
1-800-992-0180
|
| Expenses [Text Block] |
What were the Fund’s costs for the last year? (based on a hypothetical $10,000 investment)Class Name | Costs of $10K investment | Costs paid as % of $10K investment |
|---|
Class ADV | $75 | 0.70% |
|---|
|
| Expenses Paid, Amount |
$ 75
|
| Expense Ratio, Percent |
0.70%
|
| Factors Affecting Performance [Text Block] |
How did the Fund perform in the past 12 months?For the year ended December 31, 2025, the Fund underperformed the S&P Target Risk Aggressive® Index. ↑ Top contributors to performance: Underlying fund selection had a positive impact. On an individual holdings level, Voya Multi-Manager Emerging Market Equity was the key contributor. ↓ Top detractors from performance: On an individual holdings level, Vanguard FTSE Emerging Market ETF was the key detractor. |
| Line Graph [Table Text Block] |
| Class ADV | MSCI All Country World Index℠ | Bloomberg U.S. Aggregate Bond Index | MSCI EAFE® Index
| S&P Target Risk Aggressive® Index | Russell 3000® Index |
|---|
2015 | $10,000 | $10,000 | $10,000 | $10,000 | $10,000 | $10,000 |
|---|
2016 | $10,731 | $10,786 | $10,265 | $10,100 | $10,771 | $11,274 |
|---|
2017 | $12,519 | $13,371 | $10,628 | $12,628 | $12,932 | $13,656 |
|---|
2018 | $11,584 | $12,113 | $10,629 | $10,887 | $11,942 | $12,941 |
|---|
2019 | $14,080 | $15,335 | $11,556 | $13,283 | $14,664 | $16,955 |
|---|
2020 | $16,001 | $17,827 | $12,424 | $14,321 | $16,584 | $20,497 |
|---|
2021 | $18,485 | $21,132 | $12,233 | $15,934 | $19,174 | $25,756 |
|---|
2022 | $15,395 | $17,252 | $10,641 | $13,632 | $16,081 | $20,808 |
|---|
2023 | $18,139 | $21,083 | $11,230 | $16,118 | $19,040 | $26,210 |
|---|
2024 | $20,779 | $24,770 | $11,370 | $16,734 | $21,610 | $32,449 |
|---|
2025 | $24,012 | $30,303 | $12,200 | $21,958 | $25,878 | $38,013 |
|---|
|
| Average Annual Return [Table Text Block] |
Fund | 1 Year
| 5 Years
| 10 Years
|
|---|
Class ADV
| 15.56% | 8.46% | 9.15% |
|---|
MSCI All Country World Index℠ | 22.34% | 11.19% | 11.72% |
|---|
Bloomberg U.S. Aggregate Bond Index | 7.30% | -0.36% | 2.01% |
|---|
MSCI EAFE® Index
| 31.22% | 8.92% | 8.18% |
|---|
S&P Target Risk Aggressive® Index | 19.75% | 9.31% | 9.97% |
|---|
Russell 3000® Index | 17.15% | 13.15% | 14.29% |
|---|
|
| AssetsNet |
$ 159,402,112
|
| Holdings Count | Holding |
8
|
| Advisory Fees Paid, Amount |
$ 2,956,416
|
| InvestmentCompanyPortfolioTurnover |
35.00%
|
| Additional Fund Statistics [Text Block] |
- Total Net Assets$159,402,112
- # of Portfolio Holdings8
- Portfolio Turnover Rate35%
- Investment Advisory Fees Paid$2,956,416
|
| Holdings [Text Block] |
Value | Value |
|---|
Liabilities in Excess of Other Assets | (0.1)% | Fixed Income | 18.8% | Equity | 81.3% |
|
| Largest Holdings [Text Block] |
Voya U.S. Stock Index Portfolio - Class I | 56.9% |
|---|
Voya U.S. Bond Index Portfolio - Class I | 12.0% |
|---|
Voya Russell™ Mid Cap Index Portfolio - Class I | 11.6% |
|---|
Voya International Index Portfolio - Class I | 8.5% |
|---|
Voya Short Duration Bond Fund - Class R6 | 4.8% |
|---|
Voya Multi-Manager Emerging Markets Equity Fund - Class I | 2.2% |
|---|
Voya Russell™ Small Cap Index Portfolio - Class I | 2.1% |
|---|
Voya High Yield Bond Fund - Class R6 | 2.0% |
|---|
|
| Material Fund Change [Text Block] |
This is a summary of certain changes to the Portfolio during the year ended December 31, 2025. For more complete information, you may review the Portfolio’s Prospectus at https://individuals.voya.com/production/mutual-fund/prospectuses-reports. Copies of the Prospectus can be requested by calling Voya at 1-800-992-0180. Effective May 1, 2025, the name of the Portfolio changed from "Voya Retirement Growth Portfolio." |
| C000079019 |
|
| Shareholder Report [Line Items] |
|
| Fund Name |
Voya Retirement Aggressive Portfolio
|
| Class Name |
Class I
|
| Trading Symbol |
IIRGX
|
| Annual or Semi-Annual Statement [Text Block] |
This annual shareholder report contains important information about Voya Retirement Aggressive Portfolio for the period of January 1, 2025 to December 31, 2025.
|
| Shareholder Report Annual or Semi-Annual |
Annual Shareholder Report
|
| Material Fund Change Notice [Text Block] |
This report describes changes to the Fund that occurred during the reporting period.
|
| Additional Information Phone Number |
1-800-992-0180
|
| Expenses [Text Block] |
What were the Fund’s costs for the last year? (based on a hypothetical $10,000 investment)Class Name | Costs of $10K investment | Costs paid as % of $10K investment |
|---|
Class I | $37 | 0.34% |
|---|
|
| Expenses Paid, Amount |
$ 37
|
| Expense Ratio, Percent |
0.34%
|
| Factors Affecting Performance [Text Block] |
How did the Fund perform in the past 12 months?For the year ended December 31, 2025, the Fund underperformed the S&P Target Risk Aggressive® Index. ↑ Top contributors to performance: Underlying fund selection had a positive impact. On an individual holdings level, Voya Multi-Manager Emerging Market Equity was the key contributor. ↓ Top detractors from performance: On an individual holdings level, Vanguard FTSE Emerging Market ETF was the key detractor. |
| Line Graph [Table Text Block] |
| Class I | MSCI All Country World Index℠ | Bloomberg U.S. Aggregate Bond Index | MSCI EAFE® Index
| S&P Target Risk Aggressive® Index | Russell 3000® Index |
|---|
2015 | $10,000 | $10,000 | $10,000 | $10,000 | $10,000 | $10,000 |
|---|
2016 | $10,780 | $10,786 | $10,265 | $10,100 | $10,771 | $11,274 |
|---|
2017 | $12,624 | $13,371 | $10,628 | $12,628 | $12,932 | $13,656 |
|---|
2018 | $11,734 | $12,113 | $10,629 | $10,887 | $11,942 | $12,941 |
|---|
2019 | $14,326 | $15,335 | $11,556 | $13,283 | $14,664 | $16,955 |
|---|
2020 | $16,347 | $17,827 | $12,424 | $14,321 | $16,584 | $20,497 |
|---|
2021 | $18,957 | $21,132 | $12,233 | $15,934 | $19,174 | $25,756 |
|---|
2022 | $15,863 | $17,252 | $10,641 | $13,632 | $16,081 | $20,808 |
|---|
2023 | $18,779 | $21,083 | $11,230 | $16,118 | $19,040 | $26,210 |
|---|
2024 | $21,588 | $24,770 | $11,370 | $16,734 | $21,610 | $32,449 |
|---|
2025 | $25,060 | $30,303 | $12,200 | $21,958 | $25,878 | $38,013 |
|---|
|
| Average Annual Return [Table Text Block] |
Fund | 1 Year
| 5 Years
| 10 Years
|
|---|
Class I
| 16.08% | 8.92% | 9.62% |
|---|
MSCI All Country World Index℠ | 22.34% | 11.19% | 11.72% |
|---|
Bloomberg U.S. Aggregate Bond Index | 7.30% | -0.36% | 2.01% |
|---|
MSCI EAFE® Index
| 31.22% | 8.92% | 8.18% |
|---|
S&P Target Risk Aggressive® Index | 19.75% | 9.31% | 9.97% |
|---|
Russell 3000® Index | 17.15% | 13.15% | 14.29% |
|---|
|
| AssetsNet |
$ 159,402,112
|
| Holdings Count | Holding |
8
|
| Advisory Fees Paid, Amount |
$ 2,956,416
|
| InvestmentCompanyPortfolioTurnover |
35.00%
|
| Additional Fund Statistics [Text Block] |
- Total Net Assets$159,402,112
- # of Portfolio Holdings8
- Portfolio Turnover Rate35%
- Investment Advisory Fees Paid$2,956,416
|
| Holdings [Text Block] |
Value | Value |
|---|
Liabilities in Excess of Other Assets | (0.1)% | Fixed Income | 18.8% | Equity | 81.3% |
|
| Largest Holdings [Text Block] |
Voya U.S. Stock Index Portfolio - Class I | 56.9% |
|---|
Voya U.S. Bond Index Portfolio - Class I | 12.0% |
|---|
Voya Russell™ Mid Cap Index Portfolio - Class I | 11.6% |
|---|
Voya International Index Portfolio - Class I | 8.5% |
|---|
Voya Short Duration Bond Fund - Class R6 | 4.8% |
|---|
Voya Multi-Manager Emerging Markets Equity Fund - Class I | 2.2% |
|---|
Voya Russell™ Small Cap Index Portfolio - Class I | 2.1% |
|---|
Voya High Yield Bond Fund - Class R6 | 2.0% |
|---|
|
| Material Fund Change [Text Block] |
This is a summary of certain changes to the Portfolio during the year ended December 31, 2025. For more complete information, you may review the Portfolio’s Prospectus at https://individuals.voya.com/production/mutual-fund/prospectuses-reports. Copies of the Prospectus can be requested by calling Voya at 1-800-992-0180. Effective May 1, 2025, the name of the Portfolio changed from "Voya Retirement Growth Portfolio." |
| C000079020 |
|
| Shareholder Report [Line Items] |
|
| Fund Name |
Voya Retirement Moderately Aggressive Portfolio
|
| Class Name |
Class ADV
|
| Trading Symbol |
IRMGX
|
| Annual or Semi-Annual Statement [Text Block] |
This annual shareholder report contains important information about Voya Retirement Moderately Aggressive Portfolio for the period of January 1, 2025 to December 31, 2025.
|
| Shareholder Report Annual or Semi-Annual |
Annual Shareholder Report
|
| Material Fund Change Notice [Text Block] |
This report describes changes to the Fund that occurred during the reporting period.
|
| Additional Information Phone Number |
1-800-992-0180
|
| Expenses [Text Block] |
What were the Fund’s costs for the last year? (based on a hypothetical $10,000 investment)Class Name | Costs of $10K investment | Costs paid as % of $10K investment |
|---|
Class ADV | $72 | 0.67% |
|---|
|
| Expenses Paid, Amount |
$ 72
|
| Expense Ratio, Percent |
0.67%
|
| Factors Affecting Performance [Text Block] |
How did the Fund perform in the past 12 months?For the year ended December 31, 2025, the Fund underperformed the S&P Target Risk Growth Index. ↑ Top contributors to performance: Underlying fund selection & tactical asset allocation had positive impacts. On an individual holdings level, Voya Multi-Manager Emerging Market Equity was the key contributor. Futures were utilized to avoid significant underlying manager disruption and provided liquidity. The impact of the derivatives was in line with expectations of the tactical asset allocation positions. ↓ Top detractors from performance: On an individual holdings level, Vanguard FTSE Emerging Market ETF was the key detractor. |
| Line Graph [Table Text Block] |
| Class ADV | MSCI All Country World Index℠ | Bloomberg U.S. Aggregate Bond Index | MSCI EAFE® Index
| S&P Target Risk Growth Index | Russell 3000® Index |
|---|
2015 | $10,000 | $10,000 | $10,000 | $10,000 | $10,000 | $10,000 |
|---|
2016 | $10,681 | $10,786 | $10,265 | $10,100 | $10,677 | $11,274 |
|---|
2017 | $12,235 | $13,371 | $10,628 | $12,628 | $12,378 | $13,656 |
|---|
2018 | $11,464 | $12,113 | $10,629 | $10,887 | $11,674 | $12,941 |
|---|
2019 | $13,759 | $15,335 | $11,556 | $13,283 | $13,915 | $16,955 |
|---|
2020 | $15,569 | $17,827 | $12,424 | $14,321 | $15,561 | $20,497 |
|---|
2021 | $17,736 | $21,132 | $12,233 | $15,934 | $17,330 | $25,756 |
|---|
2022 | $14,844 | $17,252 | $10,641 | $13,632 | $14,684 | $20,808 |
|---|
2023 | $17,126 | $21,083 | $11,230 | $16,118 | $16,942 | $26,210 |
|---|
2024 | $19,237 | $24,770 | $11,370 | $16,734 | $18,760 | $32,449 |
|---|
2025 | $21,918 | $30,303 | $12,200 | $21,958 | $21,873 | $38,013 |
|---|
|
| Average Annual Return [Table Text Block] |
Fund | 1 Year
| 5 Years
| 10 Years
|
|---|
Class ADV
| 13.94% | 7.08% | 8.16% |
|---|
MSCI All Country World Index℠ | 22.34% | 11.19% | 11.72% |
|---|
Bloomberg U.S. Aggregate Bond Index | 7.30% | -0.36% | 2.01% |
|---|
MSCI EAFE® Index
| 31.22% | 8.92% | 8.18% |
|---|
S&P Target Risk Growth Index | 16.59% | 7.05% | 8.14% |
|---|
Russell 3000® Index | 17.15% | 13.15% | 14.29% |
|---|
|
| AssetsNet |
$ 151,366,862
|
| Holdings Count | Holding |
7
|
| Advisory Fees Paid, Amount |
$ 2,038,604
|
| InvestmentCompanyPortfolioTurnover |
29.00%
|
| Additional Fund Statistics [Text Block] |
- Total Net Assets$151,366,862
- # of Portfolio Holdings7
- Portfolio Turnover Rate29%
- Investment Advisory Fees Paid$2,038,604
|
| Holdings [Text Block] |
Value | Value |
|---|
Assets in Excess of Other Liabilities | 0.0% | Fixed Income | 34.6% | Equity | 65.4% |
|
| Largest Holdings [Text Block] |
Voya U.S. Stock Index Portfolio - Class I | 52.9% |
|---|
Voya U.S. Bond Index Portfolio - Class I | 24.8% |
|---|
Voya Short Duration Bond Fund - Class R6 | 7.8% |
|---|
Voya International Index Portfolio - Class I | 5.5% |
|---|
Voya Russell™ Mid Cap Index Portfolio - Class I | 4.8% |
|---|
Voya Multi-Manager Emerging Markets Equity Fund - Class I | 2.2% |
|---|
Voya High Yield Bond Fund - Class R6 | 2.0% |
|---|
|
| Material Fund Change [Text Block] |
This is a summary of certain changes to the Portfolio during the year ended December 31, 2025. For more complete information, you may review the Portfolio’s Prospectus at https://individuals.voya.com/production/mutual-fund/prospectuses-reports. Copies of the Prospectus can be requested by calling Voya at 1-800-992-0180. Effective May 1, 2025, the name of the Portfolio changed from "Voya Retirement Moderate Growth Portfolio." |
| C000079021 |
|
| Shareholder Report [Line Items] |
|
| Fund Name |
Voya Retirement Moderately Aggressive Portfolio
|
| Class Name |
Class I
|
| Trading Symbol |
IRGMX
|
| Annual or Semi-Annual Statement [Text Block] |
This annual shareholder report contains important information about Voya Retirement Moderately Aggressive Portfolio for the period of January 1, 2025 to December 31, 2025.
|
| Shareholder Report Annual or Semi-Annual |
Annual Shareholder Report
|
| Material Fund Change Notice [Text Block] |
This report describes changes to the Fund that occurred during the reporting period.
|
| Additional Information Phone Number |
1-800-992-0180
|
| Expenses [Text Block] |
What were the Fund’s costs for the last year? (based on a hypothetical $10,000 investment)Class Name | Costs of $10K investment | Costs paid as % of $10K investment |
|---|
Class I | $35 | 0.33% |
|---|
|
| Expenses Paid, Amount |
$ 35
|
| Expense Ratio, Percent |
0.33%
|
| Factors Affecting Performance [Text Block] |
How did the Fund perform in the past 12 months?For the year ended December 31, 2025, the Fund underperformed the S&P Target Risk Growth Index. ↑ Top contributors to performance: Underlying fund selection & tactical asset allocation had positive impacts. On an individual holdings level, Voya Multi-Manager Emerging Market Equity was the key contributor. Futures were utilized to avoid significant underlying manager disruption and provided liquidity. The impact of the derivatives was in line with expectations of the tactical asset allocation positions. ↓ Top detractors from performance: On an individual holdings level, Vanguard FTSE Emerging Market ETF was the key detractor. |
| Line Graph [Table Text Block] |
| Class I | MSCI All Country World Index℠ | Bloomberg U.S. Aggregate Bond Index | MSCI EAFE® Index
| S&P Target Risk Growth Index | Russell 3000® Index |
|---|
2015 | $10,000 | $10,000 | $10,000 | $10,000 | $10,000 | $10,000 |
|---|
2016 | $10,725 | $10,786 | $10,265 | $10,100 | $10,677 | $11,274 |
|---|
2017 | $12,339 | $13,371 | $10,628 | $12,628 | $12,378 | $13,656 |
|---|
2018 | $11,611 | $12,113 | $10,629 | $10,887 | $11,674 | $12,941 |
|---|
2019 | $13,979 | $15,335 | $11,556 | $13,283 | $13,915 | $16,955 |
|---|
2020 | $15,879 | $17,827 | $12,424 | $14,321 | $15,561 | $20,497 |
|---|
2021 | $18,167 | $21,132 | $12,233 | $15,934 | $17,330 | $25,756 |
|---|
2022 | $15,258 | $17,252 | $10,641 | $13,632 | $14,684 | $20,808 |
|---|
2023 | $17,666 | $21,083 | $11,230 | $16,118 | $16,942 | $26,210 |
|---|
2024 | $19,942 | $24,770 | $11,370 | $16,734 | $18,760 | $32,449 |
|---|
2025 | $22,792 | $30,303 | $12,200 | $21,958 | $21,873 | $38,013 |
|---|
|
| Average Annual Return [Table Text Block] |
Fund | 1 Year
| 5 Years
| 10 Years
|
|---|
Class I
| 14.29% | 7.50% | 8.59% |
|---|
MSCI All Country World Index℠ | 22.34% | 11.19% | 11.72% |
|---|
Bloomberg U.S. Aggregate Bond Index | 7.30% | -0.36% | 2.01% |
|---|
MSCI EAFE® Index
| 31.22% | 8.92% | 8.18% |
|---|
S&P Target Risk Growth Index | 16.59% | 7.05% | 8.14% |
|---|
Russell 3000® Index | 17.15% | 13.15% | 14.29% |
|---|
|
| AssetsNet |
$ 151,366,862
|
| Holdings Count | Holding |
7
|
| Advisory Fees Paid, Amount |
$ 2,038,604
|
| InvestmentCompanyPortfolioTurnover |
29.00%
|
| Additional Fund Statistics [Text Block] |
- Total Net Assets$151,366,862
- # of Portfolio Holdings7
- Portfolio Turnover Rate29%
- Investment Advisory Fees Paid$2,038,604
|
| Holdings [Text Block] |
Value | Value |
|---|
Assets in Excess of Other Liabilities | 0.0% | Fixed Income | 34.6% | Equity | 65.4% |
|
| Largest Holdings [Text Block] |
Voya U.S. Stock Index Portfolio - Class I | 52.9% |
|---|
Voya U.S. Bond Index Portfolio - Class I | 24.8% |
|---|
Voya Short Duration Bond Fund - Class R6 | 7.8% |
|---|
Voya International Index Portfolio - Class I | 5.5% |
|---|
Voya Russell™ Mid Cap Index Portfolio - Class I | 4.8% |
|---|
Voya Multi-Manager Emerging Markets Equity Fund - Class I | 2.2% |
|---|
Voya High Yield Bond Fund - Class R6 | 2.0% |
|---|
|
| Material Fund Change [Text Block] |
This is a summary of certain changes to the Portfolio during the year ended December 31, 2025. For more complete information, you may review the Portfolio’s Prospectus at https://individuals.voya.com/production/mutual-fund/prospectuses-reports. Copies of the Prospectus can be requested by calling Voya at 1-800-992-0180. Effective May 1, 2025, the name of the Portfolio changed from "Voya Retirement Moderate Growth Portfolio." |
| C000079022 |
|
| Shareholder Report [Line Items] |
|
| Fund Name |
Voya Retirement Moderate Portfolio
|
| Class Name |
Class ADV
|
| Trading Symbol |
IRMPX
|
| Annual or Semi-Annual Statement [Text Block] |
This annual shareholder report contains important information about Voya Retirement Moderate Portfolio for the period of January 1, 2025 to December 31, 2025.
|
| Shareholder Report Annual or Semi-Annual |
Annual Shareholder Report
|
| Additional Information Phone Number |
1-800-992-0180
|
| Expenses [Text Block] |
What were the Fund’s costs for the last year? (based on a hypothetical $10,000 investment)Class Name | Costs of $10K investment | Costs paid as % of $10K investment |
|---|
Class ADV | $67 | 0.63% |
|---|
|
| Expenses Paid, Amount |
$ 67
|
| Expense Ratio, Percent |
0.63%
|
| Factors Affecting Performance [Text Block] |
How did the Fund perform in the past 12 months?For the year ended December 31, 2025, the Fund underperformed the S&P Target Risk® Moderate Index. ↑ Top contributors to performance: Underlying fund selection & tactical asset allocation had positive impacts. On an individual holdings level, Voya Multi-Manager Emerging Market Equity was the key contributor. Futures were utilized to avoid significant underlying manager disruption and provided liquidity. The impact of the derivatives was in line with expectations of the tactical asset allocation positions. ↓ Top detractors from performance: On an individual holdings level, Vanguard FTSE Emerging Market ETF was the key detractor. |
| Line Graph [Table Text Block] |
| Class ADV | MSCI All Country World Index℠ | Bloomberg U.S. Aggregate Bond Index | MSCI EAFE® Index
| S&P Target Risk® Moderate Index | Russell 3000® Index |
|---|
2015 | $10,000 | $10,000 | $10,000 | $10,000 | $10,000 | $10,000 |
|---|
2016 | $10,578 | $10,786 | $10,265 | $10,100 | $10,577 | $11,274 |
|---|
2017 | $11,828 | $13,371 | $10,628 | $12,628 | $11,823 | $13,656 |
|---|
2018 | $11,229 | $12,113 | $10,629 | $10,887 | $11,383 | $12,941 |
|---|
2019 | $13,154 | $15,335 | $11,556 | $13,283 | $13,171 | $16,955 |
|---|
2020 | $14,754 | $17,827 | $12,424 | $14,321 | $14,544 | $20,497 |
|---|
2021 | $16,177 | $21,132 | $12,233 | $15,934 | $15,579 | $25,756 |
|---|
2022 | $13,723 | $17,252 | $10,641 | $13,632 | $13,334 | $20,808 |
|---|
2023 | $15,265 | $21,083 | $11,230 | $16,118 | $14,989 | $26,210 |
|---|
2024 | $16,458 | $24,770 | $11,370 | $16,734 | $16,183 | $32,449 |
|---|
2025 | $18,387 | $30,303 | $12,200 | $21,958 | $18,348 | $38,013 |
|---|
|
| Average Annual Return [Table Text Block] |
Fund | 1 Year
| 5 Years
| 10 Years
|
|---|
Class ADV
| 11.72% | 4.50% | 6.28% |
|---|
MSCI All Country World Index℠ | 22.34% | 11.19% | 11.72% |
|---|
Bloomberg U.S. Aggregate Bond Index | 7.30% | -0.36% | 2.01% |
|---|
MSCI EAFE® Index
| 31.22% | 8.92% | 8.18% |
|---|
S&P Target Risk® Moderate Index | 13.37% | 4.75% | 6.26% |
|---|
Russell 3000® Index | 17.15% | 13.15% | 14.29% |
|---|
|
| AssetsNet |
$ 131,783,929
|
| Holdings Count | Holding |
8
|
| Advisory Fees Paid, Amount |
$ 1,147,419
|
| InvestmentCompanyPortfolioTurnover |
24.00%
|
| Additional Fund Statistics [Text Block] |
- Total Net Assets$131,783,929
- # of Portfolio Holdings8
- Portfolio Turnover Rate24%
- Investment Advisory Fees Paid$1,147,419
|
| Holdings [Text Block] |
Value | Value |
|---|
Assets in Excess of Other Liabilities | 0.0% | Equity | 45.0% | Fixed Income | 55.0% |
|
| Largest Holdings [Text Block] |
Voya U.S. Bond Index Portfolio - Class I | 37.4% |
|---|
Voya U.S. Stock Index Portfolio - Class I | 33.8% |
|---|
Voya Short Duration Bond Fund - Class R6 | 11.7% |
|---|
Voya International Index Portfolio - Class I | 6.1% |
|---|
Voya High Yield Bond Fund - Class R6 | 4.0% |
|---|
Voya Russell™ Mid Cap Index Portfolio - Class I | 2.9% |
|---|
Voya Multi-Manager Emerging Markets Equity Fund - Class I | 2.2% |
|---|
Schwab U.S. TIPS ETF | 1.9% |
|---|
|
| Material Fund Change [Text Block] |
|
| C000079023 |
|
| Shareholder Report [Line Items] |
|
| Fund Name |
Voya Retirement Moderate Portfolio
|
| Class Name |
Class I
|
| Trading Symbol |
IRMIX
|
| Annual or Semi-Annual Statement [Text Block] |
This annual shareholder report contains important information about Voya Retirement Moderate Portfolio for the period of January 1, 2025 to December 31, 2025.
|
| Shareholder Report Annual or Semi-Annual |
Annual Shareholder Report
|
| Additional Information Phone Number |
1-800-992-0180
|
| Expenses [Text Block] |
What were the Fund’s costs for the last year? (based on a hypothetical $10,000 investment)Class Name | Costs of $10K investment | Costs paid as % of $10K investment |
|---|
Class I | $34 | 0.32% |
|---|
|
| Expenses Paid, Amount |
$ 34
|
| Expense Ratio, Percent |
0.32%
|
| Factors Affecting Performance [Text Block] |
How did the Fund perform in the past 12 months?For the year ended December 31, 2025, the Fund underperformed the S&P Target Risk® Moderate Index. ↑ Top contributors to performance: Underlying fund selection & tactical asset allocation had positive impacts. On an individual holdings level, Voya Multi-Manager Emerging Market Equity was the key contributor. Futures were utilized to avoid significant underlying manager disruption and provided liquidity. The impact of the derivatives was in line with expectations of the tactical asset allocation positions. ↓ Top detractors from performance: On an individual holdings level, Vanguard FTSE Emerging Market ETF was the key detractor. |
| Line Graph [Table Text Block] |
| Class I | MSCI All Country World Index℠ | Bloomberg U.S. Aggregate Bond Index | MSCI EAFE® Index
| S&P Target Risk® Moderate Index | Russell 3000® Index |
|---|
2015 | $10,000 | $10,000 | $10,000 | $10,000 | $10,000 | $10,000 |
|---|
2016 | $10,612 | $10,786 | $10,265 | $10,100 | $10,577 | $11,274 |
|---|
2017 | $11,908 | $13,371 | $10,628 | $12,628 | $11,823 | $13,656 |
|---|
2018 | $11,344 | $12,113 | $10,629 | $10,887 | $11,383 | $12,941 |
|---|
2019 | $13,337 | $15,335 | $11,556 | $13,283 | $13,171 | $16,955 |
|---|
2020 | $15,004 | $17,827 | $12,424 | $14,321 | $14,544 | $20,497 |
|---|
2021 | $16,512 | $21,132 | $12,233 | $15,934 | $15,579 | $25,756 |
|---|
2022 | $14,056 | $17,252 | $10,641 | $13,632 | $13,334 | $20,808 |
|---|
2023 | $15,687 | $21,083 | $11,230 | $16,118 | $14,989 | $26,210 |
|---|
2024 | $16,972 | $24,770 | $11,370 | $16,734 | $16,183 | $32,449 |
|---|
2025 | $19,024 | $30,303 | $12,200 | $21,958 | $18,348 | $38,013 |
|---|
|
| Average Annual Return [Table Text Block] |
Fund | 1 Year
| 5 Years
| 10 Years
|
|---|
Class I
| 12.09% | 4.86% | 6.64% |
|---|
MSCI All Country World Index℠ | 22.34% | 11.19% | 11.72% |
|---|
Bloomberg U.S. Aggregate Bond Index | 7.30% | -0.36% | 2.01% |
|---|
MSCI EAFE® Index
| 31.22% | 8.92% | 8.18% |
|---|
S&P Target Risk® Moderate Index | 13.37% | 4.75% | 6.26% |
|---|
Russell 3000® Index | 17.15% | 13.15% | 14.29% |
|---|
|
| AssetsNet |
$ 131,783,929
|
| Holdings Count | Holding |
8
|
| Advisory Fees Paid, Amount |
$ 1,147,419
|
| InvestmentCompanyPortfolioTurnover |
24.00%
|
| Additional Fund Statistics [Text Block] |
- Total Net Assets$131,783,929
- # of Portfolio Holdings8
- Portfolio Turnover Rate24%
- Investment Advisory Fees Paid$1,147,419
|
| Holdings [Text Block] |
Value | Value |
|---|
Assets in Excess of Other Liabilities | 0.0% | Equity | 45.0% | Fixed Income | 55.0% |
|
| Largest Holdings [Text Block] |
Voya U.S. Bond Index Portfolio - Class I | 37.4% |
|---|
Voya U.S. Stock Index Portfolio - Class I | 33.8% |
|---|
Voya Short Duration Bond Fund - Class R6 | 11.7% |
|---|
Voya International Index Portfolio - Class I | 6.1% |
|---|
Voya High Yield Bond Fund - Class R6 | 4.0% |
|---|
Voya Russell™ Mid Cap Index Portfolio - Class I | 2.9% |
|---|
Voya Multi-Manager Emerging Markets Equity Fund - Class I | 2.2% |
|---|
Schwab U.S. TIPS ETF | 1.9% |
|---|
|
| Material Fund Change [Text Block] |
|
| C000075972 |
|
| Shareholder Report [Line Items] |
|
| Fund Name |
Voya U.S. Stock Index Portfolio
|
| Class Name |
Class ADV
|
| Trading Symbol |
ISIVX
|
| Annual or Semi-Annual Statement [Text Block] |
This annual shareholder report contains important information about Voya U.S. Stock Index Portfolio for the period of January 1, 2025 to December 31, 2025.
|
| Shareholder Report Annual or Semi-Annual |
Annual Shareholder Report
|
| Material Fund Change Notice [Text Block] |
This report describes changes to the Fund that occurred during the reporting period.
|
| Additional Information Phone Number |
1-800-992-0180
|
| Expenses [Text Block] |
What were the Fund’s costs for the last year? (based on a hypothetical $10,000 investment)Class Name | Costs of $10K investment | Costs paid as % of $10K investment |
|---|
Class ADV | $87 | 0.80% |
|---|
|
| Expenses Paid, Amount |
$ 87
|
| Expense Ratio, Percent |
0.80%
|
| Factors Affecting Performance [Text Block] |
How did the Fund perform in the past 12 months?The Fund employs a “passive management” approach designed to track the performance of the S&P 500® Index. The Fund attempts to track the S&P 500® Index by principally investing in stocks that make up the S&P 500® Index. ↑ Top contributors to performance: For the reporting period, all sectors posted positive returns. Absolute performance was strongest within communication services, information technology, industrials and utilities. ↓ Top detractors from performance: Real estate and consumer staples were the bottom absolute performing sectors for the reporting period. |
| Line Graph [Table Text Block] |
| Class ADV | Russell 3000® Index | S&P 500® Index |
|---|
2015 | $10,000 | $10,000 | $10,000 |
|---|
2016 | $11,111 | $11,274 | $11,196 |
|---|
2017 | $13,424 | $13,656 | $13,640 |
|---|
2018 | $12,739 | $12,941 | $13,043 |
|---|
2019 | $16,616 | $16,955 | $17,150 |
|---|
2020 | $19,521 | $20,497 | $20,305 |
|---|
2021 | $24,920 | $25,756 | $26,135 |
|---|
2022 | $20,239 | $20,808 | $21,402 |
|---|
2023 | $25,349 | $26,210 | $27,028 |
|---|
2024 | $31,449 | $32,449 | $33,790 |
|---|
2025 | $36,766 | $38,013 | $39,832 |
|---|
|
| Average Annual Return [Table Text Block] |
Fund | 1 Year
| 5 Years
| 10 Years
|
|---|
Class ADV
| 16.91% | 13.50% | 13.91% |
|---|
Russell 3000® Index | 17.15% | 13.15% | 14.29% |
|---|
S&P 500® Index | 17.88% | 14.42% | 14.82% |
|---|
|
| AssetsNet |
$ 2,651,762,031
|
| Holdings Count | Holding |
506
|
| Advisory Fees Paid, Amount |
$ 9,401,783
|
| InvestmentCompanyPortfolioTurnover |
7.00%
|
| Additional Fund Statistics [Text Block] |
- Total Net Assets$2,651,762,031
- # of Portfolio Holdings506
- Portfolio Turnover Rate7%
- Investment Advisory Fees Paid$9,401,783
|
| Holdings [Text Block] |
Value | Value |
|---|
Liabilities in Excess of Other Assets | (0.2)% | Short-Term Investments | 1.4% | Common Stock | 98.8% |
Value | Value |
|---|
Information Technology | 34.0% | Financials | 13.2% | Communication Services | 10.4% | Consumer Discretionary | 10.3% | Health Care | 9.5% | Industrials | 8.1% | Consumer Staples | 4.7% | Energy | 2.8% | Utilities | 2.2% | Materials | 1.8% | Real Estate | 1.8% | Short-Term Investments | 1.4% | Liabilities in Excess of Other Assets | (0.2)% |
|
| Largest Holdings [Text Block] |
NVIDIA Corp. | 7.7% |
|---|
Apple, Inc. | 6.8% |
|---|
Microsoft Corp. | 6.1% |
|---|
Amazon.com, Inc. | 3.8% |
|---|
Alphabet, Inc. - Class A | 3.1% |
|---|
Broadcom, Inc. | 2.8% |
|---|
Alphabet, Inc. - Class C | 2.5% |
|---|
Meta Platforms, Inc. - Class A | 2.4% |
|---|
Tesla, Inc. | 2.1% |
|---|
Berkshire Hathaway, Inc. - Class B | 1.6% |
|---|
|
| Material Fund Change [Text Block] |
This is a summary of certain changes to the Portfolio during the year ended December 31, 2025. For more complete information, you may review the Portfolio’s Prospectus at https://individuals.voya.com/production/mutual-fund/prospectuses-reports. Copies of the Prospectus can be requested by calling Voya at 1-800-992-0180. Effective May 1, 2025, the Portfolio amended its principal investment strategies to clarify the types of equity securities that the Portfolio may invest in, and made corresponding changes to its risks. |
| C000015822 |
|
| Shareholder Report [Line Items] |
|
| Fund Name |
Voya U.S. Stock Index Portfolio
|
| Class Name |
Class I
|
| Trading Symbol |
INGIX
|
| Annual or Semi-Annual Statement [Text Block] |
This annual shareholder report contains important information about Voya U.S. Stock Index Portfolio for the period of January 1, 2025 to December 31, 2025.
|
| Shareholder Report Annual or Semi-Annual |
Annual Shareholder Report
|
| Material Fund Change Notice [Text Block] |
This report describes changes to the Fund that occurred during the reporting period.
|
| Additional Information Phone Number |
1-800-992-0180
|
| Expenses [Text Block] |
What were the Fund’s costs for the last year? (based on a hypothetical $10,000 investment)Class Name | Costs of $10K investment | Costs paid as % of $10K investment |
|---|
Class I | $29 | 0.27% |
|---|
|
| Expenses Paid, Amount |
$ 29
|
| Expense Ratio, Percent |
0.27%
|
| Factors Affecting Performance [Text Block] |
How did the Fund perform in the past 12 months?The Fund employs a “passive management” approach designed to track the performance of the S&P 500® Index. The Fund attempts to track the S&P 500® Index by principally investing in stocks that make up the S&P 500® Index. ↑ Top contributors to performance: For the reporting period, all sectors posted positive returns. Absolute performance was strongest within communication services, information technology, industrials and utilities. ↓ Top detractors from performance: Real estate and consumer staples were the bottom absolute performing sectors for the reporting period. |
| Line Graph [Table Text Block] |
| Class I | Russell 3000® Index | S&P 500® Index |
|---|
2015 | $10,000 | $10,000 | $10,000 |
|---|
2016 | $11,165 | $11,274 | $11,196 |
|---|
2017 | $13,561 | $13,656 | $13,640 |
|---|
2018 | $12,934 | $12,941 | $13,043 |
|---|
2019 | $16,960 | $16,955 | $17,150 |
|---|
2020 | $20,032 | $20,497 | $20,305 |
|---|
2021 | $25,716 | $25,756 | $26,135 |
|---|
2022 | $20,997 | $20,808 | $21,402 |
|---|
2023 | $26,442 | $26,210 | $27,028 |
|---|
2024 | $32,967 | $32,449 | $33,790 |
|---|
2025 | $38,748 | $38,013 | $39,832 |
|---|
|
| Average Annual Return [Table Text Block] |
Fund | 1 Year
| 5 Years
| 10 Years
|
|---|
Class I
| 17.53% | 14.10% | 14.51% |
|---|
Russell 3000® Index | 17.15% | 13.15% | 14.29% |
|---|
S&P 500® Index | 17.88% | 14.42% | 14.82% |
|---|
|
| AssetsNet |
$ 2,651,762,031
|
| Holdings Count | Holding |
506
|
| Advisory Fees Paid, Amount |
$ 9,401,783
|
| InvestmentCompanyPortfolioTurnover |
7.00%
|
| Additional Fund Statistics [Text Block] |
- Total Net Assets$2,651,762,031
- # of Portfolio Holdings506
- Portfolio Turnover Rate7%
- Investment Advisory Fees Paid$9,401,783
|
| Holdings [Text Block] |
Value | Value |
|---|
Liabilities in Excess of Other Assets | (0.2)% | Short-Term Investments | 1.4% | Common Stock | 98.8% |
Value | Value |
|---|
Information Technology | 34.0% | Financials | 13.2% | Communication Services | 10.4% | Consumer Discretionary | 10.3% | Health Care | 9.5% | Industrials | 8.1% | Consumer Staples | 4.7% | Energy | 2.8% | Utilities | 2.2% | Materials | 1.8% | Real Estate | 1.8% | Short-Term Investments | 1.4% | Liabilities in Excess of Other Assets | (0.2)% |
|
| Largest Holdings [Text Block] |
NVIDIA Corp. | 7.7% |
|---|
Apple, Inc. | 6.8% |
|---|
Microsoft Corp. | 6.1% |
|---|
Amazon.com, Inc. | 3.8% |
|---|
Alphabet, Inc. - Class A | 3.1% |
|---|
Broadcom, Inc. | 2.8% |
|---|
Alphabet, Inc. - Class C | 2.5% |
|---|
Meta Platforms, Inc. - Class A | 2.4% |
|---|
Tesla, Inc. | 2.1% |
|---|
Berkshire Hathaway, Inc. - Class B | 1.6% |
|---|
|
| Material Fund Change [Text Block] |
This is a summary of certain changes to the Portfolio during the year ended December 31, 2025. For more complete information, you may review the Portfolio’s Prospectus at https://individuals.voya.com/production/mutual-fund/prospectuses-reports. Copies of the Prospectus can be requested by calling Voya at 1-800-992-0180. Effective May 1, 2025, the Portfolio amended its principal investment strategies to clarify the types of equity securities that the Portfolio may invest in, and made corresponding changes to its risks. |
| C000047554 |
|
| Shareholder Report [Line Items] |
|
| Fund Name |
Voya U.S. Stock Index Portfolio
|
| Class Name |
Class S
|
| Trading Symbol |
ISJBX
|
| Annual or Semi-Annual Statement [Text Block] |
This annual shareholder report contains important information about Voya U.S. Stock Index Portfolio for the period of January 1, 2025 to December 31, 2025.
|
| Shareholder Report Annual or Semi-Annual |
Annual Shareholder Report
|
| Material Fund Change Notice [Text Block] |
This report describes changes to the Fund that occurred during the reporting period.
|
| Additional Information Phone Number |
1-800-992-0180
|
| Expenses [Text Block] |
What were the Fund’s costs for the last year? (based on a hypothetical $10,000 investment)Class Name | Costs of $10K investment | Costs paid as % of $10K investment |
|---|
Class S | $55 | 0.51% |
|---|
|
| Expenses Paid, Amount |
$ 55
|
| Expense Ratio, Percent |
0.51%
|
| Factors Affecting Performance [Text Block] |
How did the Fund perform in the past 12 months?The Fund employs a “passive management” approach designed to track the performance of the S&P 500® Index. The Fund attempts to track the S&P 500® Index by principally investing in stocks that make up the S&P 500® Index. ↑ Top contributors to performance: For the reporting period, all sectors posted positive returns. Absolute performance was strongest within communication services, information technology, industrials and utilities. ↓ Top detractors from performance: Real estate and consumer staples were the bottom absolute performing sectors for the reporting period. |
| Line Graph [Table Text Block] |
| Class S | Russell 3000® Index | S&P 500® Index |
|---|
2015 | $10,000 | $10,000 | $10,000 |
|---|
2016 | $11,135 | $11,274 | $11,196 |
|---|
2017 | $13,498 | $13,656 | $13,640 |
|---|
2018 | $12,846 | $12,941 | $13,043 |
|---|
2019 | $16,799 | $16,955 | $17,150 |
|---|
2020 | $19,800 | $20,497 | $20,305 |
|---|
2021 | $25,349 | $25,756 | $26,135 |
|---|
2022 | $20,659 | $20,808 | $21,402 |
|---|
2023 | $25,939 | $26,210 | $27,028 |
|---|
2024 | $32,275 | $32,449 | $33,790 |
|---|
2025 | $37,834 | $38,013 | $39,832 |
|---|
|
| Average Annual Return [Table Text Block] |
Fund | 1 Year
| 5 Years
| 10 Years
|
|---|
Class S
| 17.23% | 13.83% | 14.23% |
|---|
Russell 3000® Index | 17.15% | 13.15% | 14.29% |
|---|
S&P 500® Index | 17.88% | 14.42% | 14.82% |
|---|
|
| AssetsNet |
$ 2,651,762,031
|
| Holdings Count | Holding |
506
|
| Advisory Fees Paid, Amount |
$ 9,401,783
|
| InvestmentCompanyPortfolioTurnover |
7.00%
|
| Additional Fund Statistics [Text Block] |
- Total Net Assets$2,651,762,031
- # of Portfolio Holdings506
- Portfolio Turnover Rate7%
- Investment Advisory Fees Paid$9,401,783
|
| Holdings [Text Block] |
Value | Value |
|---|
Liabilities in Excess of Other Assets | (0.2)% | Short-Term Investments | 1.4% | Common Stock | 98.8% |
Value | Value |
|---|
Information Technology | 34.0% | Financials | 13.2% | Communication Services | 10.4% | Consumer Discretionary | 10.3% | Health Care | 9.5% | Industrials | 8.1% | Consumer Staples | 4.7% | Energy | 2.8% | Utilities | 2.2% | Materials | 1.8% | Real Estate | 1.8% | Short-Term Investments | 1.4% | Liabilities in Excess of Other Assets | (0.2)% |
|
| Largest Holdings [Text Block] |
NVIDIA Corp. | 7.7% |
|---|
Apple, Inc. | 6.8% |
|---|
Microsoft Corp. | 6.1% |
|---|
Amazon.com, Inc. | 3.8% |
|---|
Alphabet, Inc. - Class A | 3.1% |
|---|
Broadcom, Inc. | 2.8% |
|---|
Alphabet, Inc. - Class C | 2.5% |
|---|
Meta Platforms, Inc. - Class A | 2.4% |
|---|
Tesla, Inc. | 2.1% |
|---|
Berkshire Hathaway, Inc. - Class B | 1.6% |
|---|
|
| Material Fund Change [Text Block] |
This is a summary of certain changes to the Portfolio during the year ended December 31, 2025. For more complete information, you may review the Portfolio’s Prospectus at https://individuals.voya.com/production/mutual-fund/prospectuses-reports. Copies of the Prospectus can be requested by calling Voya at 1-800-992-0180. Effective May 1, 2025, the Portfolio amended its principal investment strategies to clarify the types of equity securities that the Portfolio may invest in, and made corresponding changes to its risks. |
| C000053098 |
|
| Shareholder Report [Line Items] |
|
| Fund Name |
Voya U.S. Stock Index Portfolio
|
| Class Name |
Class S2
|
| Trading Symbol |
ISIPX
|
| Annual or Semi-Annual Statement [Text Block] |
This annual shareholder report contains important information about Voya U.S. Stock Index Portfolio for the period of January 1, 2025 to December 31, 2025.
|
| Shareholder Report Annual or Semi-Annual |
Annual Shareholder Report
|
| Material Fund Change Notice [Text Block] |
This report describes changes to the Fund that occurred during the reporting period.
|
| Additional Information Phone Number |
1-800-992-0180
|
| Expenses [Text Block] |
What were the Fund’s costs for the last year? (based on a hypothetical $10,000 investment)Class Name | Costs of $10K investment | Costs paid as % of $10K investment |
|---|
Class S2 | $73 | 0.67% |
|---|
|
| Expenses Paid, Amount |
$ 73
|
| Expense Ratio, Percent |
0.67%
|
| Factors Affecting Performance [Text Block] |
How did the Fund perform in the past 12 months?The Fund employs a “passive management” approach designed to track the performance of the S&P 500® Index. The Fund attempts to track the S&P 500® Index by principally investing in stocks that make up the S&P 500® Index. ↑ Top contributors to performance: For the reporting period, all sectors posted positive returns. Absolute performance was strongest within communication services, information technology, industrials and utilities. ↓ Top detractors from performance: Real estate and consumer staples were the bottom absolute performing sectors for the reporting period. |
| Line Graph [Table Text Block] |
| Class S2 | Russell 3000® Index | S&P 500® Index |
|---|
2015 | $10,000 | $10,000 | $10,000 |
|---|
2016 | $11,119 | $11,274 | $11,196 |
|---|
2017 | $13,457 | $13,656 | $13,640 |
|---|
2018 | $12,781 | $12,941 | $13,043 |
|---|
2019 | $16,691 | $16,955 | $17,150 |
|---|
2020 | $19,632 | $20,497 | $20,305 |
|---|
2021 | $25,100 | $25,756 | $26,135 |
|---|
2022 | $20,424 | $20,808 | $21,402 |
|---|
2023 | $25,608 | $26,210 | $27,028 |
|---|
2024 | $31,800 | $32,449 | $33,790 |
|---|
2025 | $37,231 | $38,013 | $39,832 |
|---|
|
| Average Annual Return [Table Text Block] |
Fund | 1 Year
| 5 Years
| 10 Years
|
|---|
Class S2
| 17.08% | 13.65% | 14.05% |
|---|
Russell 3000® Index | 17.15% | 13.15% | 14.29% |
|---|
S&P 500® Index | 17.88% | 14.42% | 14.82% |
|---|
|
| AssetsNet |
$ 2,651,762,031
|
| Holdings Count | Holding |
506
|
| Advisory Fees Paid, Amount |
$ 9,401,783
|
| InvestmentCompanyPortfolioTurnover |
7.00%
|
| Additional Fund Statistics [Text Block] |
- Total Net Assets$2,651,762,031
- # of Portfolio Holdings506
- Portfolio Turnover Rate7%
- Investment Advisory Fees Paid$9,401,783
|
| Holdings [Text Block] |
Value | Value |
|---|
Liabilities in Excess of Other Assets | (0.2)% | Short-Term Investments | 1.4% | Common Stock | 98.8% |
Value | Value |
|---|
Information Technology | 34.0% | Financials | 13.2% | Communication Services | 10.4% | Consumer Discretionary | 10.3% | Health Care | 9.5% | Industrials | 8.1% | Consumer Staples | 4.7% | Energy | 2.8% | Utilities | 2.2% | Materials | 1.8% | Real Estate | 1.8% | Short-Term Investments | 1.4% | Liabilities in Excess of Other Assets | (0.2)% |
|
| Largest Holdings [Text Block] |
NVIDIA Corp. | 7.7% |
|---|
Apple, Inc. | 6.8% |
|---|
Microsoft Corp. | 6.1% |
|---|
Amazon.com, Inc. | 3.8% |
|---|
Alphabet, Inc. - Class A | 3.1% |
|---|
Broadcom, Inc. | 2.8% |
|---|
Alphabet, Inc. - Class C | 2.5% |
|---|
Meta Platforms, Inc. - Class A | 2.4% |
|---|
Tesla, Inc. | 2.1% |
|---|
Berkshire Hathaway, Inc. - Class B | 1.6% |
|---|
|
| Material Fund Change [Text Block] |
This is a summary of certain changes to the Portfolio during the year ended December 31, 2025. For more complete information, you may review the Portfolio’s Prospectus at https://individuals.voya.com/production/mutual-fund/prospectuses-reports. Copies of the Prospectus can be requested by calling Voya at 1-800-992-0180. Effective May 1, 2025, the Portfolio amended its principal investment strategies to clarify the types of equity securities that the Portfolio may invest in, and made corresponding changes to its risks. |
| C000240437 |
|
| Shareholder Report [Line Items] |
|
| Fund Name |
Voya VACS Index Series S Portfolio
|
| Class Name |
Portfolio
|
| Trading Symbol |
VVIPX
|
| Annual or Semi-Annual Statement [Text Block] |
This annual shareholder report contains important information about Voya VACS Index Series S Portfolio for the period of January 1, 2025 to December 31, 2025.
|
| Shareholder Report Annual or Semi-Annual |
Annual Shareholder Report
|
| Additional Information Phone Number |
1-800-992-0180
|
| Expenses [Text Block] |
What were the Fund’s costs for the last year? (based on a hypothetical $10,000 investment)Class Name | Costs of $10K investment | Costs paid as % of $10K investment |
|---|
VACS Index Series | $17 | 0.16% |
|---|
|
| Expenses Paid, Amount |
$ 17
|
| Expense Ratio, Percent |
0.16%
|
| Factors Affecting Performance [Text Block] |
How did the Fund perform in the past 12 months?The Fund employs a “passive management” approach designed to track the performance of the S&P 500® Index. The Fund attempts to track the S&P 500® Index by principally investing in stocks that make up the S&P 500® Index. The Fund may not always hold all of the same securities as the S&P 500® Index. ↑ Top contributors to performance: While all sectors posted positive returns for the reporting period, absolute performance was strongest within communication services, information technology & industrials. ↓ Top detractors from performance: Real estate and consumer staples were the bottom absolute performing sectors for the reporting period. |
| Line Graph [Table Text Block] |
| Voya VACS Index Series S Portfolio | Russell 3000® Index | S&P 500® Index |
|---|
1/27/2023 | $10,000 | $10,000 | $10,000 |
|---|
2023 | $11,880 | $11,814 | $11,901 |
|---|
2024 | $14,824 | $14,627 | $14,879 |
|---|
2025 | $17,444 | $17,134 | $17,539 |
|---|
|
| Average Annual Return [Table Text Block] |
Fund | 1 Year
| Since Inception (1/27/2023)
|
|---|
Voya VACS Index Series S Portfolio
| 17.67% | 20.94% |
|---|
Russell 3000® Index | 17.15% | 20.20% |
|---|
S&P 500® Index | 17.88% | 21.16% |
|---|
|
| AssetsNet |
$ 4,197,827,957
|
| Holdings Count | Holding |
506
|
| Advisory Fees Paid, Amount |
$ 6,043,055
|
| InvestmentCompanyPortfolioTurnover |
7.00%
|
| Additional Fund Statistics [Text Block] |
- Total Net Assets$4,197,827,957
- # of Portfolio Holdings506
- Portfolio Turnover Rate7%
- Investment Advisory Fees Paid$6,043,055
|
| Holdings [Text Block] |
Value | Value |
|---|
Assets in Excess of Other Liabilities | 0.1% | Short-Term Investments | 0.9% | Common Stock | 99.0% |
Value | Value |
|---|
Information Technology | 34.1% | Financials | 13.2% | Communication Services | 10.5% | Consumer Discretionary | 10.3% | Health Care | 9.5% | Industrials | 8.1% | Consumer Staples | 4.7% | Energy | 2.8% | Utilities | 2.2% | Materials | 1.8% | Real Estate | 1.8% | Short-Term Investments | 0.9% | Assets in Excess of Other Liabilities | 0.1% |
|
| Largest Holdings [Text Block] |
NVIDIA Corp. | 7.7% |
|---|
Apple, Inc. | 6.8% |
|---|
Microsoft Corp. | 6.1% |
|---|
Amazon.com, Inc. | 3.8% |
|---|
Alphabet, Inc. - Class A | 3.1% |
|---|
Broadcom, Inc. | 2.8% |
|---|
Alphabet, Inc. - Class C | 2.5% |
|---|
Meta Platforms, Inc. - Class A | 2.4% |
|---|
Tesla, Inc. | 2.2% |
|---|
Berkshire Hathaway, Inc. - Class B | 1.6% |
|---|
|
| Material Fund Change [Text Block] |
|
| C000015417 |
|
| Shareholder Report [Line Items] |
|
| Fund Name |
VY<sup style="inset: 1.5px 0px 4px; box-sizing: border-box; color: rgb(0, 0, 0); display: inline; flex-wrap: nowrap; font-size: 9px; font-weight: 400; grid-area: auto; line-height: 0px; margin: 0px; overflow: visible; position: relative; text-align: left; text-align-last: auto; white-space-collapse: preserve-breaks;">®</sup> CBRE Global Real Estate Portfolio
|
| Class Name |
Class ADV
|
| Trading Symbol |
ICRNX
|
| Annual or Semi-Annual Statement [Text Block] |
This annual shareholder report contains important information about VY® CBRE Global Real Estate Portfolio for the period of January 1, 2025 to December 31, 2025.
|
| Shareholder Report Annual or Semi-Annual |
Annual Shareholder Report
|
| Material Fund Change Notice [Text Block] |
This report describes changes to the Fund that occurred during the reporting period.
|
| Additional Information Phone Number |
1-800-992-0180
|
| Expenses [Text Block] |
What were the Fund’s costs for the last year? (based on a hypothetical $10,000 investment)Class Name | Costs of $10K investment | Costs paid as % of $10K investment |
|---|
Class ADV | $156 | 1.51% |
|---|
|
| Expenses Paid, Amount |
$ 156
|
| Expense Ratio, Percent |
1.51%
|
| Factors Affecting Performance [Text Block] |
How did the Fund perform in the past 12 months?For the year ended December 31, 2025, the Fund underperformed the FTSE EPRA Nareit Developed Index due to negative stock selection and sector allocation. ↑ Top contributors to performance: On a sector level, – U.S. Residential, Continental Europe, and U.S. Net Lease contributed. Positioning in Continental Europe, Australia, and Hong Kong were additive. Key individual contributors included Unibail-Rodamco-Westfield, Charter Hall Group & Klepierre. ↓ Top detractors from performance: On a sector level, U.S. Net Lease, U.S. Industrial, Japan REOCs detracted. Positioning in the U.S., Japan,& Canada hurt performance. Key individual detractors included Mitsubishi Estate Company, Prologis, and VICI Properties. |
| Line Graph [Table Text Block] |
| Class ADV | MSCI All Country World Index℠ | S&P 500® Index | FTSE EPRA Nareit Developed Index |
|---|
2015 | $10,000 | $10,000 | $10,000 | $10,000 |
|---|
2016 | $10,023 | $10,786 | $11,196 | $10,406 |
|---|
2017 | $11,045 | $13,371 | $13,640 | $11,484 |
|---|
2018 | $10,040 | $12,113 | $13,043 | $10,838 |
|---|
2019 | $12,449 | $15,335 | $17,150 | $13,212 |
|---|
2020 | $11,780 | $17,827 | $20,305 | $12,018 |
|---|
2021 | $15,734 | $21,132 | $26,135 | $15,153 |
|---|
2022 | $11,739 | $17,252 | $21,402 | $11,351 |
|---|
2023 | $13,145 | $21,083 | $27,028 | $12,449 |
|---|
2024 | $13,113 | $24,770 | $33,790 | $12,566 |
|---|
2025 | $13,927 | $30,303 | $39,832 | $13,769 |
|---|
|
| Average Annual Return [Table Text Block] |
Fund | 1 Year
| 5 Years
| 10 Years
|
|---|
Class ADV
| 6.21% | 3.41% | 3.37% |
|---|
MSCI All Country World Index℠ | 22.34% | 11.19% | 11.72% |
|---|
S&P 500® Index | 17.88% | 14.42% | 14.82% |
|---|
FTSE EPRA Nareit Developed Index | 9.58% | 2.76% | 3.25% |
|---|
|
| AssetsNet |
$ 132,935,914
|
| Holdings Count | Holding |
89
|
| Advisory Fees Paid, Amount |
$ 1,017,881
|
| InvestmentCompanyPortfolioTurnover |
101.00%
|
| Additional Fund Statistics [Text Block] |
- Total Net Assets$132,935,914
- # of Portfolio Holdings89
- Portfolio Turnover Rate101%
- Investment Advisory Fees Paid$1,017,881
|
| Holdings [Text Block] |
Value | Value |
|---|
Assets in Excess of Other Liabilities | 1.6% | Countries-Other | 0.9% | Netherlands | 0.7% | Belgium | 0.9% | Germany | 1.3% | Hong Kong | 2.3% | Canada | 3.1% | France | 4.0% | Singapore | 4.2% | United Kingdom | 4.3% | Australia | 6.9% | Japan | 9.5% | United States | 60.3% |
|
| Largest Holdings [Text Block] |
Welltower, Inc. | 8.9% |
|---|
Equinix, Inc. | 5.4% |
|---|
Simon Property Group, Inc. | 5.4% |
|---|
VICI Properties, Inc. | 3.6% |
|---|
Public Storage | 2.8% |
|---|
Mitsui Fudosan Co. Ltd. | 2.6% |
|---|
Prologis, Inc. | 2.6% |
|---|
Ventas, Inc. | 2.4% |
|---|
UDR, Inc. | 2.4% |
|---|
American Homes 4 Rent - Class A | 2.3% |
|---|
|
| Material Fund Change [Text Block] |
This is a summary of certain changes to the Portfolio during the year ended December 31, 2025. For more complete information, you may review the Portfolio’s Prospectus at https://individuals.voya.com/production/mutual-fund/prospectuses-reports. Copies of the Prospectus can be requested by calling Voya at 1-800-992-0180. Effective May 1, 2025, the Portfolio amended its investment policies in accordance with the investment focus that the Portfolio’s name suggests. Corresponding changes were also made to the Portfolio’s principal investment strategies and risks. |
| C000015418 |
|
| Shareholder Report [Line Items] |
|
| Fund Name |
VY<sup style="inset: 1.5px 0px 4px; box-sizing: border-box; color: rgb(0, 0, 0); display: inline; flex-wrap: nowrap; font-size: 9px; font-weight: 400; grid-area: auto; line-height: 0px; margin: 0px; overflow: visible; position: relative; text-align: left; text-align-last: auto; white-space-collapse: preserve-breaks;">®</sup> CBRE Global Real Estate Portfolio
|
| Class Name |
Class I
|
| Trading Symbol |
IRGIX
|
| Annual or Semi-Annual Statement [Text Block] |
This annual shareholder report contains important information about VY® CBRE Global Real Estate Portfolio for the period of January 1, 2025 to December 31, 2025.
|
| Shareholder Report Annual or Semi-Annual |
Annual Shareholder Report
|
| Material Fund Change Notice [Text Block] |
This report describes changes to the Fund that occurred during the reporting period.
|
| Additional Information Phone Number |
1-800-992-0180
|
| Expenses [Text Block] |
What were the Fund’s costs for the last year? (based on a hypothetical $10,000 investment)Class Name | Costs of $10K investment | Costs paid as % of $10K investment |
|---|
Class I | $94 | 0.91% |
|---|
|
| Expenses Paid, Amount |
$ 94
|
| Expense Ratio, Percent |
0.91%
|
| Factors Affecting Performance [Text Block] |
How did the Fund perform in the past 12 months?For the year ended December 31, 2025, the Fund underperformed the FTSE EPRA Nareit Developed Index due to negative stock selection and sector allocation. ↑ Top contributors to performance: On a sector level, – U.S. Residential, Continental Europe, and U.S. Net Lease contributed. Positioning in Continental Europe, Australia, and Hong Kong were additive. Key individual contributors included Unibail-Rodamco-Westfield, Charter Hall Group & Klepierre. ↓ Top detractors from performance: On a sector level, U.S. Net Lease, U.S. Industrial, Japan REOCs detracted. Positioning in the U.S., Japan,& Canada hurt performance. Key individual detractors included Mitsubishi Estate Company, Prologis, and VICI Properties. |
| Line Graph [Table Text Block] |
| Class I | MSCI All Country World Index℠ | S&P 500® Index | FTSE EPRA Nareit Developed Index |
|---|
2015 | $10,000 | $10,000 | $10,000 | $10,000 |
|---|
2016 | $10,089 | $10,786 | $11,196 | $10,406 |
|---|
2017 | $11,175 | $13,371 | $13,640 | $11,484 |
|---|
2018 | $10,223 | $12,113 | $13,043 | $10,838 |
|---|
2019 | $12,753 | $15,335 | $17,150 | $13,212 |
|---|
2020 | $12,137 | $17,827 | $20,305 | $12,018 |
|---|
2021 | $16,320 | $21,132 | $26,135 | $15,153 |
|---|
2022 | $12,248 | $17,252 | $21,402 | $11,351 |
|---|
2023 | $13,791 | $21,083 | $27,028 | $12,449 |
|---|
2024 | $13,843 | $24,770 | $33,790 | $12,566 |
|---|
2025 | $14,786 | $30,303 | $39,832 | $13,769 |
|---|
|
| Average Annual Return [Table Text Block] |
Fund | 1 Year
| 5 Years
| 10 Years
|
|---|
Class I
| 6.82% | 4.03% | 3.99% |
|---|
MSCI All Country World Index℠ | 22.34% | 11.19% | 11.72% |
|---|
S&P 500® Index | 17.88% | 14.42% | 14.82% |
|---|
FTSE EPRA Nareit Developed Index | 9.58% | 2.76% | 3.25% |
|---|
|
| AssetsNet |
$ 132,935,914
|
| Holdings Count | Holding |
89
|
| Advisory Fees Paid, Amount |
$ 1,017,881
|
| InvestmentCompanyPortfolioTurnover |
101.00%
|
| Additional Fund Statistics [Text Block] |
- Total Net Assets$132,935,914
- # of Portfolio Holdings89
- Portfolio Turnover Rate101%
- Investment Advisory Fees Paid$1,017,881
|
| Holdings [Text Block] |
Value | Value |
|---|
Assets in Excess of Other Liabilities | 1.6% | Countries-Other | 0.9% | Netherlands | 0.7% | Belgium | 0.9% | Germany | 1.3% | Hong Kong | 2.3% | Canada | 3.1% | France | 4.0% | Singapore | 4.2% | United Kingdom | 4.3% | Australia | 6.9% | Japan | 9.5% | United States | 60.3% |
|
| Largest Holdings [Text Block] |
Welltower, Inc. | 8.9% |
|---|
Equinix, Inc. | 5.4% |
|---|
Simon Property Group, Inc. | 5.4% |
|---|
VICI Properties, Inc. | 3.6% |
|---|
Public Storage | 2.8% |
|---|
Mitsui Fudosan Co. Ltd. | 2.6% |
|---|
Prologis, Inc. | 2.6% |
|---|
Ventas, Inc. | 2.4% |
|---|
UDR, Inc. | 2.4% |
|---|
American Homes 4 Rent - Class A | 2.3% |
|---|
|
| Material Fund Change [Text Block] |
This is a summary of certain changes to the Portfolio during the year ended December 31, 2025. For more complete information, you may review the Portfolio’s Prospectus at https://individuals.voya.com/production/mutual-fund/prospectuses-reports. Copies of the Prospectus can be requested by calling Voya at 1-800-992-0180. Effective May 1, 2025, the Portfolio amended its investment policies in accordance with the investment focus that the Portfolio’s name suggests. Corresponding changes were also made to the Portfolio’s principal investment strategies and risks. |
| C000015419 |
|
| Shareholder Report [Line Items] |
|
| Fund Name |
VY<sup style="inset: 1.5px 0px 4px; box-sizing: border-box; color: rgb(0, 0, 0); display: inline; flex-wrap: nowrap; font-size: 9px; font-weight: 400; grid-area: auto; line-height: 0px; margin: 0px; overflow: visible; position: relative; text-align: left; text-align-last: auto; white-space-collapse: preserve-breaks;">®</sup> CBRE Global Real Estate Portfolio
|
| Class Name |
Class S
|
| Trading Symbol |
IRGTX
|
| Annual or Semi-Annual Statement [Text Block] |
This annual shareholder report contains important information about VY® CBRE Global Real Estate Portfolio for the period of January 1, 2025 to December 31, 2025.
|
| Shareholder Report Annual or Semi-Annual |
Annual Shareholder Report
|
| Material Fund Change Notice [Text Block] |
This report describes changes to the Fund that occurred during the reporting period.
|
| Additional Information Phone Number |
1-800-992-0180
|
| Expenses [Text Block] |
What were the Fund’s costs for the last year? (based on a hypothetical $10,000 investment)Class Name | Costs of $10K investment | Costs paid as % of $10K investment |
|---|
Class S | $120 | 1.16% |
|---|
|
| Expenses Paid, Amount |
$ 120
|
| Expense Ratio, Percent |
1.16%
|
| Factors Affecting Performance [Text Block] |
How did the Fund perform in the past 12 months?For the year ended December 31, 2025, the Fund underperformed the FTSE EPRA Nareit Developed Index due to negative stock selection and sector allocation. ↑ Top contributors to performance: On a sector level, – U.S. Residential, Continental Europe, and U.S. Net Lease contributed. Positioning in Continental Europe, Australia, and Hong Kong were additive. Key individual contributors included Unibail-Rodamco-Westfield, Charter Hall Group & Klepierre. ↓ Top detractors from performance: On a sector level, U.S. Net Lease, U.S. Industrial, Japan REOCs detracted. Positioning in the U.S., Japan,& Canada hurt performance. Key individual detractors included Mitsubishi Estate Company, Prologis, and VICI Properties. |
| Line Graph [Table Text Block] |
| Class S | MSCI All Country World Index℠ | S&P 500® Index | FTSE EPRA Nareit Developed Index |
|---|
2015 | $10,000 | $10,000 | $10,000 | $10,000 |
|---|
2016 | $10,062 | $10,786 | $11,196 | $10,406 |
|---|
2017 | $11,119 | $13,371 | $13,640 | $11,484 |
|---|
2018 | $10,146 | $12,113 | $13,043 | $10,838 |
|---|
2019 | $12,617 | $15,335 | $17,150 | $13,212 |
|---|
2020 | $11,981 | $17,827 | $20,305 | $12,018 |
|---|
2021 | $16,071 | $21,132 | $26,135 | $15,153 |
|---|
2022 | $12,033 | $17,252 | $21,402 | $11,351 |
|---|
2023 | $13,517 | $21,083 | $27,028 | $12,449 |
|---|
2024 | $13,533 | $24,770 | $33,790 | $12,566 |
|---|
2025 | $14,417 | $30,303 | $39,832 | $13,769 |
|---|
|
| Average Annual Return [Table Text Block] |
Fund | 1 Year
| 5 Years
| 10 Years
|
|---|
Class S
| 6.53% | 3.77% | 3.73% |
|---|
MSCI All Country World Index℠ | 22.34% | 11.19% | 11.72% |
|---|
S&P 500® Index | 17.88% | 14.42% | 14.82% |
|---|
FTSE EPRA Nareit Developed Index | 9.58% | 2.76% | 3.25% |
|---|
|
| AssetsNet |
$ 132,935,914
|
| Holdings Count | Holding |
89
|
| Advisory Fees Paid, Amount |
$ 1,017,881
|
| InvestmentCompanyPortfolioTurnover |
101.00%
|
| Additional Fund Statistics [Text Block] |
- Total Net Assets$132,935,914
- # of Portfolio Holdings89
- Portfolio Turnover Rate101%
- Investment Advisory Fees Paid$1,017,881
|
| Holdings [Text Block] |
Value | Value |
|---|
Assets in Excess of Other Liabilities | 1.6% | Countries-Other | 0.9% | Netherlands | 0.7% | Belgium | 0.9% | Germany | 1.3% | Hong Kong | 2.3% | Canada | 3.1% | France | 4.0% | Singapore | 4.2% | United Kingdom | 4.3% | Australia | 6.9% | Japan | 9.5% | United States | 60.3% |
|
| Largest Holdings [Text Block] |
Welltower, Inc. | 8.9% |
|---|
Equinix, Inc. | 5.4% |
|---|
Simon Property Group, Inc. | 5.4% |
|---|
VICI Properties, Inc. | 3.6% |
|---|
Public Storage | 2.8% |
|---|
Mitsui Fudosan Co. Ltd. | 2.6% |
|---|
Prologis, Inc. | 2.6% |
|---|
Ventas, Inc. | 2.4% |
|---|
UDR, Inc. | 2.4% |
|---|
American Homes 4 Rent - Class A | 2.3% |
|---|
|
| Material Fund Change [Text Block] |
This is a summary of certain changes to the Portfolio during the year ended December 31, 2025. For more complete information, you may review the Portfolio’s Prospectus at https://individuals.voya.com/production/mutual-fund/prospectuses-reports. Copies of the Prospectus can be requested by calling Voya at 1-800-992-0180. Effective May 1, 2025, the Portfolio amended its investment policies in accordance with the investment focus that the Portfolio’s name suggests. Corresponding changes were also made to the Portfolio’s principal investment strategies and risks. |
| C000015420 |
|
| Shareholder Report [Line Items] |
|
| Fund Name |
VY<sup style="inset: 1.5px 0px 4px; box-sizing: border-box; color: rgb(0, 0, 0); display: inline; flex-wrap: nowrap; font-size: 9px; font-weight: 400; grid-area: auto; line-height: 0px; margin: 0px; overflow: visible; position: relative; text-align: left; text-align-last: auto; white-space-collapse: preserve-breaks;">®</sup> CBRE Global Real Estate Portfolio
|
| Class Name |
Class S2
|
| Trading Symbol |
IRGSX
|
| Annual or Semi-Annual Statement [Text Block] |
This annual shareholder report contains important information about VY® CBRE Global Real Estate Portfolio for the period of January 1, 2025 to December 31, 2025.
|
| Shareholder Report Annual or Semi-Annual |
Annual Shareholder Report
|
| Material Fund Change Notice [Text Block] |
This report describes changes to the Fund that occurred during the reporting period.
|
| Additional Information Phone Number |
1-800-992-0180
|
| Expenses [Text Block] |
What were the Fund’s costs for the last year? (based on a hypothetical $10,000 investment)Class Name | Costs of $10K investment | Costs paid as % of $10K investment |
|---|
Class S2 | $135 | 1.31% |
|---|
|
| Expenses Paid, Amount |
$ 135
|
| Expense Ratio, Percent |
1.31%
|
| Factors Affecting Performance [Text Block] |
How did the Fund perform in the past 12 months?For the year ended December 31, 2025, the Fund underperformed the FTSE EPRA Nareit Developed Index due to negative stock selection and sector allocation. ↑ Top contributors to performance: On a sector level, – U.S. Residential, Continental Europe, and U.S. Net Lease contributed. Positioning in Continental Europe, Australia, and Hong Kong were additive. Key individual contributors included Unibail-Rodamco-Westfield, Charter Hall Group & Klepierre. ↓ Top detractors from performance: On a sector level, U.S. Net Lease, U.S. Industrial, Japan REOCs detracted. Positioning in the U.S., Japan,& Canada hurt performance. Key individual detractors included Mitsubishi Estate Company, Prologis, and VICI Properties. |
| Line Graph [Table Text Block] |
| Class S2 | MSCI All Country World Index℠ | S&P 500® Index | FTSE EPRA Nareit Developed Index |
|---|
2015 | $10,000 | $10,000 | $10,000 | $10,000 |
|---|
2016 | $10,043 | $10,786 | $11,196 | $10,406 |
|---|
2017 | $11,090 | $13,371 | $13,640 | $11,484 |
|---|
2018 | $10,110 | $12,113 | $13,043 | $10,838 |
|---|
2019 | $12,551 | $15,335 | $17,150 | $13,212 |
|---|
2020 | $11,900 | $17,827 | $20,305 | $12,018 |
|---|
2021 | $15,934 | $21,132 | $26,135 | $15,153 |
|---|
2022 | $11,911 | $17,252 | $21,402 | $11,351 |
|---|
2023 | $13,354 | $21,083 | $27,028 | $12,449 |
|---|
2024 | $13,351 | $24,770 | $33,790 | $12,566 |
|---|
2025 | $14,198 | $30,303 | $39,832 | $13,769 |
|---|
|
| Average Annual Return [Table Text Block] |
Fund | 1 Year
| 5 Years
| 10 Years
|
|---|
Class S2
| 6.35% | 3.60% | 3.57% |
|---|
MSCI All Country World Index℠ | 22.34% | 11.19% | 11.72% |
|---|
S&P 500® Index | 17.88% | 14.42% | 14.82% |
|---|
FTSE EPRA Nareit Developed Index | 9.58% | 2.76% | 3.25% |
|---|
|
| AssetsNet |
$ 132,935,914
|
| Holdings Count | Holding |
89
|
| Advisory Fees Paid, Amount |
$ 1,017,881
|
| InvestmentCompanyPortfolioTurnover |
101.00%
|
| Additional Fund Statistics [Text Block] |
- Total Net Assets$132,935,914
- # of Portfolio Holdings89
- Portfolio Turnover Rate101%
- Investment Advisory Fees Paid$1,017,881
|
| Holdings [Text Block] |
Value | Value |
|---|
Assets in Excess of Other Liabilities | 1.6% | Countries-Other | 0.9% | Netherlands | 0.7% | Belgium | 0.9% | Germany | 1.3% | Hong Kong | 2.3% | Canada | 3.1% | France | 4.0% | Singapore | 4.2% | United Kingdom | 4.3% | Australia | 6.9% | Japan | 9.5% | United States | 60.3% |
|
| Largest Holdings [Text Block] |
Welltower, Inc. | 8.9% |
|---|
Equinix, Inc. | 5.4% |
|---|
Simon Property Group, Inc. | 5.4% |
|---|
VICI Properties, Inc. | 3.6% |
|---|
Public Storage | 2.8% |
|---|
Mitsui Fudosan Co. Ltd. | 2.6% |
|---|
Prologis, Inc. | 2.6% |
|---|
Ventas, Inc. | 2.4% |
|---|
UDR, Inc. | 2.4% |
|---|
American Homes 4 Rent - Class A | 2.3% |
|---|
|
| Material Fund Change [Text Block] |
This is a summary of certain changes to the Portfolio during the year ended December 31, 2025. For more complete information, you may review the Portfolio’s Prospectus at https://individuals.voya.com/production/mutual-fund/prospectuses-reports. Copies of the Prospectus can be requested by calling Voya at 1-800-992-0180. Effective May 1, 2025, the Portfolio amended its investment policies in accordance with the investment focus that the Portfolio’s name suggests. Corresponding changes were also made to the Portfolio’s principal investment strategies and risks. |
| C000015784 |
|
| Shareholder Report [Line Items] |
|
| Fund Name |
VY<sup style="inset: 1.5px 0px 4px; box-sizing: border-box; color: rgb(0, 0, 0); display: inline; flex-wrap: nowrap; font-size: 9px; font-weight: 400; grid-area: auto; line-height: 0px; margin: 0px; overflow: visible; position: relative; text-align: left; text-align-last: auto; white-space-collapse: preserve-breaks;">®</sup> CBRE Real Estate Portfolio
|
| Class Name |
Class ADV
|
| Trading Symbol |
ICRPX
|
| Annual or Semi-Annual Statement [Text Block] |
This annual shareholder report contains important information about VY® CBRE Real Estate Portfolio for the period of January 1, 2025 to December 31, 2025.
|
| Shareholder Report Annual or Semi-Annual |
Annual Shareholder Report
|
| Material Fund Change Notice [Text Block] |
This report describes changes to the Fund that occurred during the reporting period.
|
| Additional Information Phone Number |
1-800-992-0180
|
| Expenses [Text Block] |
What were the Fund’s costs for the last year? (based on a hypothetical $10,000 investment)Class Name | Costs of $10K investment | Costs paid as % of $10K investment |
|---|
Class ADV | $141 | 1.41% |
|---|
|
| Expenses Paid, Amount |
$ 141
|
| Expense Ratio, Percent |
1.41%
|
| Factors Affecting Performance [Text Block] |
How did the Fund perform in the past 12 months? For the year ended December 31, 2025, the Fund underperformed the MSCI U.S. REIT Index on due to negative stock selection and sector allocation. ↑ Top contributors to performance: Sector allocation was positive in the residential, towers and mall sectors. Individual names contributing to performance were American Healthcare REIT, Ventas, & Public Storage. ↓ Top detractors from performance: Stock selection accounted for most of the relative underperformance, which was concentrated in the hotel, net lease & shopping center sectors. Sector allocation was hurt by positioning in the shopping center, healthcare & hotel sectors. Individual names hurting performance were Welltower, Prologis & UDR. |
| Line Graph [Table Text Block] |
| Class ADV | Russell 3000® Index | MSCI U.S. REIT® Index |
|---|
2015 | $10,000 | $10,000 | $10,000 |
|---|
2016 | $10,386 | $11,274 | $10,860 |
|---|
2017 | $10,887 | $13,656 | $11,411 |
|---|
2018 | $10,019 | $12,941 | $10,889 |
|---|
2019 | $12,796 | $16,955 | $13,703 |
|---|
2020 | $11,915 | $20,497 | $12,666 |
|---|
2021 | $18,046 | $25,756 | $18,119 |
|---|
2022 | $13,102 | $20,808 | $13,678 |
|---|
2023 | $14,886 | $26,210 | $15,558 |
|---|
2024 | $15,473 | $32,449 | $16,920 |
|---|
2025 | $15,425 | $38,013 | $17,419 |
|---|
|
| Average Annual Return [Table Text Block] |
Fund | 1 Year
| 5 Years
| 10 Years
|
|---|
Class ADV
| -0.31% | 5.30% | 4.43% |
|---|
Russell 3000® Index | 17.15% | 13.15% | 14.29% |
|---|
MSCI U.S. REIT® Index | 2.95% | 6.58% | 5.71% |
|---|
|
| AssetsNet |
$ 142,885,063
|
| Holdings Count | Holding |
40
|
| Advisory Fees Paid, Amount |
$ 790,751
|
| InvestmentCompanyPortfolioTurnover |
97.00%
|
| Additional Fund Statistics [Text Block] |
- Total Net Assets$142,885,063
- # of Portfolio Holdings40
- Portfolio Turnover Rate97%
- Investment Advisory Fees Paid$790,751
|
| Holdings [Text Block] |
Value | Value |
|---|
Health Care REITs | 20.9% | Industrial REITs | 17.6% | Specialized REITs | 16.0% | Retail REITs | 15.7% | Residential REITs | 6.3% | Self-Storage REITs | 5.7% | Office REITs | 3.8% | Other Specialized REITs | 3.0% | Single-Family Residential REITs | 2.9% | Diversified REITs | 2.5% | Multi-Family Residential REITs | 2.2% | REITs-Other | 2.1% | Assets in Excess of Other Liabilities | 1.3% |
|
| Largest Holdings [Text Block] |
Welltower, Inc. | 12.7% |
|---|
Equinix, Inc. | 9.8% |
|---|
Prologis, Inc. | 8.8% |
|---|
Simon Property Group, Inc. | 6.6% |
|---|
UDR, Inc. | 3.8% |
|---|
VICI Properties, Inc. | 3.7% |
|---|
CubeSmart | 3.5% |
|---|
Brixmor Property Group, Inc. | 3.4% |
|---|
Iron Mountain, Inc. | 3.0% |
|---|
First Industrial Realty Trust, Inc. | 2.8% |
|---|
|
| Material Fund Change [Text Block] |
This is a summary of certain changes to the Portfolio during the year ended December 31, 2025. For more complete information, you may review the Portfolio’s Prospectus at https://individuals.voya.com/production/mutual-fund/prospectuses-reports. Copies of the Prospectus can be requested by calling Voya at 1-800-992-0180. Effective May 1, 2025, the Portfolio amended its investment policies in accordance with the investment focus that the Portfolio’s name suggests. Corresponding changes were also made to the Portfolio’s principal investment strategies and risks. |
| C000015785 |
|
| Shareholder Report [Line Items] |
|
| Fund Name |
VY<sup style="inset: 1.5px 0px 4px; box-sizing: border-box; color: rgb(0, 0, 0); display: inline; flex-wrap: nowrap; font-size: 9px; font-weight: 400; grid-area: auto; line-height: 0px; margin: 0px; overflow: visible; position: relative; text-align: left; text-align-last: auto; white-space-collapse: preserve-breaks;">®</sup> CBRE Real Estate Portfolio
|
| Class Name |
Class I
|
| Trading Symbol |
IVRIX
|
| Annual or Semi-Annual Statement [Text Block] |
This annual shareholder report contains important information about VY® CBRE Real Estate Portfolio for the period of January 1, 2025 to December 31, 2025.
|
| Shareholder Report Annual or Semi-Annual |
Annual Shareholder Report
|
| Material Fund Change Notice [Text Block] |
This report describes changes to the Fund that occurred during the reporting period.
|
| Additional Information Phone Number |
1-800-992-0180
|
| Expenses [Text Block] |
What were the Fund’s costs for the last year? (based on a hypothetical $10,000 investment)Class Name | Costs of $10K investment | Costs paid as % of $10K investment |
|---|
Class I | $81 | 0.81% |
|---|
|
| Expenses Paid, Amount |
$ 81
|
| Expense Ratio, Percent |
0.81%
|
| Factors Affecting Performance [Text Block] |
How did the Fund perform in the past 12 months? For the year ended December 31, 2025, the Fund underperformed the MSCI U.S. REIT Index on due to negative stock selection and sector allocation. ↑ Top contributors to performance: Sector allocation was positive in the residential, towers and mall sectors. Individual names contributing to performance were American Healthcare REIT, Ventas, & Public Storage. ↓ Top detractors from performance: Stock selection accounted for most of the relative underperformance, which was concentrated in the hotel, net lease & shopping center sectors. Sector allocation was hurt by positioning in the shopping center, healthcare & hotel sectors. Individual names hurting performance were Welltower, Prologis & UDR. |
| Line Graph [Table Text Block] |
| Class I | Russell 3000® Index | MSCI U.S. REIT® Index |
|---|
2015 | $10,000 | $10,000 | $10,000 |
|---|
2016 | $10,447 | $11,274 | $10,860 |
|---|
2017 | $11,018 | $13,656 | $11,411 |
|---|
2018 | $10,201 | $12,941 | $10,889 |
|---|
2019 | $13,106 | $16,955 | $13,703 |
|---|
2020 | $12,278 | $20,497 | $12,666 |
|---|
2021 | $18,704 | $25,756 | $18,119 |
|---|
2022 | $13,659 | $20,808 | $13,678 |
|---|
2023 | $15,614 | $26,210 | $15,558 |
|---|
2024 | $16,328 | $32,449 | $16,920 |
|---|
2025 | $16,378 | $38,013 | $17,419 |
|---|
|
| Average Annual Return [Table Text Block] |
Fund | 1 Year
| 5 Years
| 10 Years
|
|---|
Class I
| 0.30% | 5.93% | 5.06% |
|---|
Russell 3000® Index | 17.15% | 13.15% | 14.29% |
|---|
MSCI U.S. REIT® Index | 2.95% | 6.58% | 5.71% |
|---|
|
| AssetsNet |
$ 142,885,063
|
| Holdings Count | Holding |
40
|
| Advisory Fees Paid, Amount |
$ 790,751
|
| InvestmentCompanyPortfolioTurnover |
97.00%
|
| Additional Fund Statistics [Text Block] |
- Total Net Assets$142,885,063
- # of Portfolio Holdings40
- Portfolio Turnover Rate97%
- Investment Advisory Fees Paid$790,751
|
| Holdings [Text Block] |
Value | Value |
|---|
Health Care REITs | 20.9% | Industrial REITs | 17.6% | Specialized REITs | 16.0% | Retail REITs | 15.7% | Residential REITs | 6.3% | Self-Storage REITs | 5.7% | Office REITs | 3.8% | Other Specialized REITs | 3.0% | Single-Family Residential REITs | 2.9% | Diversified REITs | 2.5% | Multi-Family Residential REITs | 2.2% | REITs-Other | 2.1% | Assets in Excess of Other Liabilities | 1.3% |
|
| Largest Holdings [Text Block] |
Welltower, Inc. | 12.7% |
|---|
Equinix, Inc. | 9.8% |
|---|
Prologis, Inc. | 8.8% |
|---|
Simon Property Group, Inc. | 6.6% |
|---|
UDR, Inc. | 3.8% |
|---|
VICI Properties, Inc. | 3.7% |
|---|
CubeSmart | 3.5% |
|---|
Brixmor Property Group, Inc. | 3.4% |
|---|
Iron Mountain, Inc. | 3.0% |
|---|
First Industrial Realty Trust, Inc. | 2.8% |
|---|
|
| Material Fund Change [Text Block] |
This is a summary of certain changes to the Portfolio during the year ended December 31, 2025. For more complete information, you may review the Portfolio’s Prospectus at https://individuals.voya.com/production/mutual-fund/prospectuses-reports. Copies of the Prospectus can be requested by calling Voya at 1-800-992-0180. Effective May 1, 2025, the Portfolio amended its investment policies in accordance with the investment focus that the Portfolio’s name suggests. Corresponding changes were also made to the Portfolio’s principal investment strategies and risks. |
| C000015786 |
|
| Shareholder Report [Line Items] |
|
| Fund Name |
VY<sup style="inset: 1.5px 0px 4px; box-sizing: border-box; color: rgb(0, 0, 0); display: inline; flex-wrap: nowrap; font-size: 9px; font-weight: 400; grid-area: auto; line-height: 0px; margin: 0px; overflow: visible; position: relative; text-align: left; text-align-last: auto; white-space-collapse: preserve-breaks;">®</sup> CBRE Real Estate Portfolio
|
| Class Name |
Class S
|
| Trading Symbol |
IVRSX
|
| Annual or Semi-Annual Statement [Text Block] |
This annual shareholder report contains important information about VY® CBRE Real Estate Portfolio for the period of January 1, 2025 to December 31, 2025.
|
| Shareholder Report Annual or Semi-Annual |
Annual Shareholder Report
|
| Material Fund Change Notice [Text Block] |
This report describes changes to the Fund that occurred during the reporting period.
|
| Additional Information Phone Number |
1-800-992-0180
|
| Expenses [Text Block] |
What were the Fund’s costs for the last year? (based on a hypothetical $10,000 investment)Class Name | Costs of $10K investment | Costs paid as % of $10K investment |
|---|
Class S | $106 | 1.06% |
|---|
|
| Expenses Paid, Amount |
$ 106
|
| Expense Ratio, Percent |
1.06%
|
| Factors Affecting Performance [Text Block] |
How did the Fund perform in the past 12 months? For the year ended December 31, 2025, the Fund underperformed the MSCI U.S. REIT Index on due to negative stock selection and sector allocation. ↑ Top contributors to performance: Sector allocation was positive in the residential, towers and mall sectors. Individual names contributing to performance were American Healthcare REIT, Ventas, & Public Storage. ↓ Top detractors from performance: Stock selection accounted for most of the relative underperformance, which was concentrated in the hotel, net lease & shopping center sectors. Sector allocation was hurt by positioning in the shopping center, healthcare & hotel sectors. Individual names hurting performance were Welltower, Prologis & UDR. |
| Line Graph [Table Text Block] |
| Class S | Russell 3000® Index | MSCI U.S. REIT® Index |
|---|
2015 | $10,000 | $10,000 | $10,000 |
|---|
2016 | $10,424 | $11,274 | $10,860 |
|---|
2017 | $10,964 | $13,656 | $11,411 |
|---|
2018 | $10,126 | $12,941 | $10,889 |
|---|
2019 | $12,976 | $16,955 | $13,703 |
|---|
2020 | $12,128 | $20,497 | $12,666 |
|---|
2021 | $18,429 | $25,756 | $18,119 |
|---|
2022 | $13,427 | $20,808 | $13,678 |
|---|
2023 | $15,312 | $26,210 | $15,558 |
|---|
2024 | $15,971 | $32,449 | $16,920 |
|---|
2025 | $15,976 | $38,013 | $17,419 |
|---|
|
| Average Annual Return [Table Text Block] |
Fund | 1 Year
| 5 Years
| 10 Years
|
|---|
Class S
| 0.03% | 5.67% | 4.80% |
|---|
Russell 3000® Index | 17.15% | 13.15% | 14.29% |
|---|
MSCI U.S. REIT® Index | 2.95% | 6.58% | 5.71% |
|---|
|
| AssetsNet |
$ 142,885,063
|
| Holdings Count | Holding |
40
|
| Advisory Fees Paid, Amount |
$ 790,751
|
| InvestmentCompanyPortfolioTurnover |
97.00%
|
| Additional Fund Statistics [Text Block] |
- Total Net Assets$142,885,063
- # of Portfolio Holdings40
- Portfolio Turnover Rate97%
- Investment Advisory Fees Paid$790,751
|
| Holdings [Text Block] |
Value | Value |
|---|
Health Care REITs | 20.9% | Industrial REITs | 17.6% | Specialized REITs | 16.0% | Retail REITs | 15.7% | Residential REITs | 6.3% | Self-Storage REITs | 5.7% | Office REITs | 3.8% | Other Specialized REITs | 3.0% | Single-Family Residential REITs | 2.9% | Diversified REITs | 2.5% | Multi-Family Residential REITs | 2.2% | REITs-Other | 2.1% | Assets in Excess of Other Liabilities | 1.3% |
|
| Largest Holdings [Text Block] |
Welltower, Inc. | 12.7% |
|---|
Equinix, Inc. | 9.8% |
|---|
Prologis, Inc. | 8.8% |
|---|
Simon Property Group, Inc. | 6.6% |
|---|
UDR, Inc. | 3.8% |
|---|
VICI Properties, Inc. | 3.7% |
|---|
CubeSmart | 3.5% |
|---|
Brixmor Property Group, Inc. | 3.4% |
|---|
Iron Mountain, Inc. | 3.0% |
|---|
First Industrial Realty Trust, Inc. | 2.8% |
|---|
|
| Material Fund Change [Text Block] |
This is a summary of certain changes to the Portfolio during the year ended December 31, 2025. For more complete information, you may review the Portfolio’s Prospectus at https://individuals.voya.com/production/mutual-fund/prospectuses-reports. Copies of the Prospectus can be requested by calling Voya at 1-800-992-0180. Effective May 1, 2025, the Portfolio amended its investment policies in accordance with the investment focus that the Portfolio’s name suggests. Corresponding changes were also made to the Portfolio’s principal investment strategies and risks. |
| C000015787 |
|
| Shareholder Report [Line Items] |
|
| Fund Name |
VY<sup style="inset: 1.5px 0px 4px; box-sizing: border-box; color: rgb(0, 0, 0); display: inline; flex-wrap: nowrap; font-size: 9px; font-weight: 400; grid-area: auto; line-height: 0px; margin: 0px; overflow: visible; position: relative; text-align: left; text-align-last: auto; white-space-collapse: preserve-breaks;">®</sup> CBRE Real Estate Portfolio
|
| Class Name |
Class S2
|
| Trading Symbol |
IVRTX
|
| Annual or Semi-Annual Statement [Text Block] |
This annual shareholder report contains important information about VY® CBRE Real Estate Portfolio for the period of January 1, 2025 to December 31, 2025.
|
| Shareholder Report Annual or Semi-Annual |
Annual Shareholder Report
|
| Material Fund Change Notice [Text Block] |
This report describes changes to the Fund that occurred during the reporting period.
|
| Additional Information Phone Number |
1-800-992-0180
|
| Expenses [Text Block] |
What were the Fund’s costs for the last year? (based on a hypothetical $10,000 investment)Class Name | Costs of $10K investment | Costs paid as % of $10K investment |
|---|
Class S2 | $121 | 1.21% |
|---|
|
| Expenses Paid, Amount |
$ 121
|
| Expense Ratio, Percent |
1.21%
|
| Factors Affecting Performance [Text Block] |
How did the Fund perform in the past 12 months? For the year ended December 31, 2025, the Fund underperformed the MSCI U.S. REIT Index on due to negative stock selection and sector allocation. ↑ Top contributors to performance: Sector allocation was positive in the residential, towers and mall sectors. Individual names contributing to performance were American Healthcare REIT, Ventas, & Public Storage. ↓ Top detractors from performance: Stock selection accounted for most of the relative underperformance, which was concentrated in the hotel, net lease & shopping center sectors. Sector allocation was hurt by positioning in the shopping center, healthcare & hotel sectors. Individual names hurting performance were Welltower, Prologis & UDR. |
| Line Graph [Table Text Block] |
| Class S2 | Russell 3000® Index | MSCI U.S. REIT® Index |
|---|
2015 | $10,000 | $10,000 | $10,000 |
|---|
2016 | $10,407 | $11,274 | $10,860 |
|---|
2017 | $10,929 | $13,656 | $11,411 |
|---|
2018 | $10,079 | $12,941 | $10,889 |
|---|
2019 | $12,898 | $16,955 | $13,703 |
|---|
2020 | $12,035 | $20,497 | $12,666 |
|---|
2021 | $18,261 | $25,756 | $18,119 |
|---|
2022 | $13,286 | $20,808 | $13,678 |
|---|
2023 | $15,126 | $26,210 | $15,558 |
|---|
2024 | $15,753 | $32,449 | $16,920 |
|---|
2025 | $15,737 | $38,013 | $17,419 |
|---|
|
| Average Annual Return [Table Text Block] |
Fund | 1 Year
| 5 Years
| 10 Years
|
|---|
Class S2
| -0.10% | 5.51% | 4.64% |
|---|
Russell 3000® Index | 17.15% | 13.15% | 14.29% |
|---|
MSCI U.S. REIT® Index | 2.95% | 6.58% | 5.71% |
|---|
|
| AssetsNet |
$ 142,885,063
|
| Holdings Count | Holding |
40
|
| Advisory Fees Paid, Amount |
$ 790,751
|
| InvestmentCompanyPortfolioTurnover |
97.00%
|
| Additional Fund Statistics [Text Block] |
- Total Net Assets$142,885,063
- # of Portfolio Holdings40
- Portfolio Turnover Rate97%
- Investment Advisory Fees Paid$790,751
|
| Holdings [Text Block] |
Value | Value |
|---|
Health Care REITs | 20.9% | Industrial REITs | 17.6% | Specialized REITs | 16.0% | Retail REITs | 15.7% | Residential REITs | 6.3% | Self-Storage REITs | 5.7% | Office REITs | 3.8% | Other Specialized REITs | 3.0% | Single-Family Residential REITs | 2.9% | Diversified REITs | 2.5% | Multi-Family Residential REITs | 2.2% | REITs-Other | 2.1% | Assets in Excess of Other Liabilities | 1.3% |
|
| Largest Holdings [Text Block] |
Welltower, Inc. | 12.7% |
|---|
Equinix, Inc. | 9.8% |
|---|
Prologis, Inc. | 8.8% |
|---|
Simon Property Group, Inc. | 6.6% |
|---|
UDR, Inc. | 3.8% |
|---|
VICI Properties, Inc. | 3.7% |
|---|
CubeSmart | 3.5% |
|---|
Brixmor Property Group, Inc. | 3.4% |
|---|
Iron Mountain, Inc. | 3.0% |
|---|
First Industrial Realty Trust, Inc. | 2.8% |
|---|
|
| Material Fund Change [Text Block] |
This is a summary of certain changes to the Portfolio during the year ended December 31, 2025. For more complete information, you may review the Portfolio’s Prospectus at https://individuals.voya.com/production/mutual-fund/prospectuses-reports. Copies of the Prospectus can be requested by calling Voya at 1-800-992-0180. Effective May 1, 2025, the Portfolio amended its investment policies in accordance with the investment focus that the Portfolio’s name suggests. Corresponding changes were also made to the Portfolio’s principal investment strategies and risks. |
| C000015780 |
|
| Shareholder Report [Line Items] |
|
| Fund Name |
VY<sup style="inset: 1.5px 0px 4px; box-sizing: border-box; color: rgb(0, 0, 0); display: inline; flex-wrap: nowrap; font-size: 9px; font-weight: 400; grid-area: auto; line-height: 0px; margin: 0px; overflow: visible; position: relative; text-align: left; text-align-last: auto; white-space-collapse: preserve-breaks;">®</sup> Invesco Growth and Income Portfolio
|
| Class Name |
Class ADV
|
| Trading Symbol |
IVGAX
|
| Annual or Semi-Annual Statement [Text Block] |
This annual shareholder report contains important information about VY® Invesco Growth and Income Portfolio for the period of January 1, 2025 to December 31, 2025.
|
| Shareholder Report Annual or Semi-Annual |
Annual Shareholder Report
|
| Additional Information Phone Number |
1-800-992-0180
|
| Expenses [Text Block] |
What were the Fund’s costs for the last year? (based on a hypothetical $10,000 investment)Class Name | Costs of $10K investment | Costs paid as % of $10K investment |
|---|
Class ADV | $133 | 1.24% |
|---|
|
| Expenses Paid, Amount |
$ 133
|
| Expense Ratio, Percent |
1.24%
|
| Factors Affecting Performance [Text Block] |
How did the Fund perform in the past 12 months?For the year ended December 31, 2025, the Fund underperformed the Russell 1000® Value Index. ↑ Top contributors to performance: Stock selection in industrials drove outperformance, due to strong performance from Johnson Controls and Vertiv. Stock selection & an underweight position in real estate also helped relative performance. The Fund’s only holding in the sector, CBRE, was a strong contributor. Lastly, stock selection in health care, consumer staples, consumer discretionary, energy & utilities also made a positive contributions. ↓ Top detractors from performance: Stock selection in the communication services sector was the largest detractor from the fund's relative return. Stock selection in financials also detracted from relative returns, due in large part to Fiserv. The materials and information technology sectors also detracted. Within IT, Marvel Technology was a key detractor. |
| Line Graph [Table Text Block] |
| Class ADV | Russell 3000® Index | Russell 1000® Value Index |
|---|
2015 | $10,000 | $10,000 | $10,000 |
|---|
2016 | $11,952 | $11,274 | $11,734 |
|---|
2017 | $13,560 | $13,656 | $13,337 |
|---|
2018 | $11,678 | $12,941 | $12,234 |
|---|
2019 | $14,515 | $16,955 | $15,481 |
|---|
2020 | $14,886 | $20,497 | $15,914 |
|---|
2021 | $19,127 | $25,756 | $19,918 |
|---|
2022 | $17,950 | $20,808 | $18,416 |
|---|
2023 | $20,092 | $26,210 | $20,527 |
|---|
2024 | $23,255 | $32,449 | $23,477 |
|---|
2025 | $26,727 | $38,013 | $27,211 |
|---|
|
| Average Annual Return [Table Text Block] |
Fund | 1 Year
| 5 Years
| 10 Years
|
|---|
Class ADV
| 14.93% | 12.42% | 10.33% |
|---|
Russell 3000® Index | 17.15% | 13.15% | 14.29% |
|---|
Russell 1000® Value Index | 15.91% | 11.33% | 10.53% |
|---|
|
| AssetsNet |
$ 160,977,881
|
| Holdings Count | Holding |
77
|
| Advisory Fees Paid, Amount |
$ 968,980
|
| InvestmentCompanyPortfolioTurnover |
27.00%
|
| Additional Fund Statistics [Text Block] |
- Total Net Assets$160,977,881
- # of Portfolio Holdings77
- Portfolio Turnover Rate27%
- Investment Advisory Fees Paid$968,980
|
| Holdings [Text Block] |
Value | Value |
|---|
Assets in Excess of Other Liabilities | 0.0% | Short-Term Investments | 2.7% | Common Stock | 97.3% |
Value | Value |
|---|
Financials | 19.3% | Health Care | 15.4% | Information Technology | 14.7% | Industrials | 13.4% | Consumer Staples | 7.1% | Energy | 6.9% | Consumer Discretionary | 6.6% | Communication Services | 5.8% | Utilities | 4.2% | Materials | 2.2% | Real Estate | 1.7% | Short-Term Investments | 2.7% | Assets in Excess of Other Liabilities | 0.0% |
|
| Largest Holdings [Text Block] |
Wells Fargo & Co. | 3.3% |
|---|
Bank of America Corp. | 3.1% |
|---|
Amazon.com, Inc. | 2.5% |
|---|
Philip Morris International, Inc. | 2.4% |
|---|
Microsoft Corp. | 2.2% |
|---|
Alphabet, Inc. - Class A | 2.2% |
|---|
Charles Schwab Corp. | 2.1% |
|---|
Parker-Hannifin Corp. | 2.1% |
|---|
Walt Disney Co. | 2.0% |
|---|
Citizens Financial Group, Inc. | 2.0% |
|---|
|
| Material Fund Change [Text Block] |
|
| C000015781 |
|
| Shareholder Report [Line Items] |
|
| Fund Name |
VY<sup style="inset: 1.5px 0px 4px; box-sizing: border-box; color: rgb(0, 0, 0); display: inline; flex-wrap: nowrap; font-size: 9px; font-weight: 400; grid-area: auto; line-height: 0px; margin: 0px; overflow: visible; position: relative; text-align: left; text-align-last: auto; white-space-collapse: preserve-breaks;">®</sup> Invesco Growth and Income Portfolio
|
| Class Name |
Class I
|
| Trading Symbol |
IVGIX
|
| Annual or Semi-Annual Statement [Text Block] |
This annual shareholder report contains important information about VY® Invesco Growth and Income Portfolio for the period of January 1, 2025 to December 31, 2025.
|
| Shareholder Report Annual or Semi-Annual |
Annual Shareholder Report
|
| Additional Information Phone Number |
1-800-992-0180
|
| Expenses [Text Block] |
What were the Fund’s costs for the last year? (based on a hypothetical $10,000 investment)Class Name | Costs of $10K investment | Costs paid as % of $10K investment |
|---|
Class I | $69 | 0.64% |
|---|
|
| Expenses Paid, Amount |
$ 69
|
| Expense Ratio, Percent |
0.64%
|
| Factors Affecting Performance [Text Block] |
How did the Fund perform in the past 12 months?For the year ended December 31, 2025, the Fund underperformed the Russell 1000® Value Index. ↑ Top contributors to performance: Stock selection in industrials drove outperformance, due to strong performance from Johnson Controls and Vertiv. Stock selection & an underweight position in real estate also helped relative performance. The Fund’s only holding in the sector, CBRE, was a strong contributor. Lastly, stock selection in health care, consumer staples, consumer discretionary, energy & utilities also made a positive contributions. ↓ Top detractors from performance: Stock selection in the communication services sector was the largest detractor from the fund's relative return. Stock selection in financials also detracted from relative returns, due in large part to Fiserv. The materials and information technology sectors also detracted. Within IT, Marvel Technology was a key detractor. |
| Line Graph [Table Text Block] |
| Class I | Russell 3000® Index | Russell 1000® Value Index |
|---|
2015 | $10,000 | $10,000 | $10,000 |
|---|
2016 | $12,023 | $11,274 | $11,734 |
|---|
2017 | $13,723 | $13,656 | $13,337 |
|---|
2018 | $11,896 | $12,941 | $12,234 |
|---|
2019 | $14,867 | $16,955 | $15,481 |
|---|
2020 | $15,346 | $20,497 | $15,914 |
|---|
2021 | $19,828 | $25,756 | $19,918 |
|---|
2022 | $18,720 | $20,808 | $18,416 |
|---|
2023 | $21,082 | $26,210 | $20,527 |
|---|
2024 | $24,545 | $32,449 | $23,477 |
|---|
2025 | $28,382 | $38,013 | $27,211 |
|---|
|
| Average Annual Return [Table Text Block] |
Fund | 1 Year
| 5 Years
| 10 Years
|
|---|
Class I
| 15.63% | 13.09% | 11.00% |
|---|
Russell 3000® Index | 17.15% | 13.15% | 14.29% |
|---|
Russell 1000® Value Index | 15.91% | 11.33% | 10.53% |
|---|
|
| AssetsNet |
$ 160,977,881
|
| Holdings Count | Holding |
77
|
| Advisory Fees Paid, Amount |
$ 968,980
|
| InvestmentCompanyPortfolioTurnover |
27.00%
|
| Additional Fund Statistics [Text Block] |
- Total Net Assets$160,977,881
- # of Portfolio Holdings77
- Portfolio Turnover Rate27%
- Investment Advisory Fees Paid$968,980
|
| Holdings [Text Block] |
Value | Value |
|---|
Assets in Excess of Other Liabilities | 0.0% | Short-Term Investments | 2.7% | Common Stock | 97.3% |
Value | Value |
|---|
Financials | 19.3% | Health Care | 15.4% | Information Technology | 14.7% | Industrials | 13.4% | Consumer Staples | 7.1% | Energy | 6.9% | Consumer Discretionary | 6.6% | Communication Services | 5.8% | Utilities | 4.2% | Materials | 2.2% | Real Estate | 1.7% | Short-Term Investments | 2.7% | Assets in Excess of Other Liabilities | 0.0% |
|
| Largest Holdings [Text Block] |
Wells Fargo & Co. | 3.3% |
|---|
Bank of America Corp. | 3.1% |
|---|
Amazon.com, Inc. | 2.5% |
|---|
Philip Morris International, Inc. | 2.4% |
|---|
Microsoft Corp. | 2.2% |
|---|
Alphabet, Inc. - Class A | 2.2% |
|---|
Charles Schwab Corp. | 2.1% |
|---|
Parker-Hannifin Corp. | 2.1% |
|---|
Walt Disney Co. | 2.0% |
|---|
Citizens Financial Group, Inc. | 2.0% |
|---|
|
| Material Fund Change [Text Block] |
|
| C000015782 |
|
| Shareholder Report [Line Items] |
|
| Fund Name |
VY<sup style="inset: 1.5px 0px 4px; box-sizing: border-box; color: rgb(0, 0, 0); display: inline; flex-wrap: nowrap; font-size: 9px; font-weight: 400; grid-area: auto; line-height: 0px; margin: 0px; overflow: visible; position: relative; text-align: left; text-align-last: auto; white-space-collapse: preserve-breaks;">®</sup> Invesco Growth and Income Portfolio
|
| Class Name |
Class S
|
| Trading Symbol |
IVGSX
|
| Annual or Semi-Annual Statement [Text Block] |
This annual shareholder report contains important information about VY® Invesco Growth and Income Portfolio for the period of January 1, 2025 to December 31, 2025.
|
| Shareholder Report Annual or Semi-Annual |
Annual Shareholder Report
|
| Additional Information Phone Number |
1-800-992-0180
|
| Expenses [Text Block] |
What were the Fund’s costs for the last year? (based on a hypothetical $10,000 investment)Class Name | Costs of $10K investment | Costs paid as % of $10K investment |
|---|
Class S | $96 | 0.89% |
|---|
|
| Expenses Paid, Amount |
$ 96
|
| Expense Ratio, Percent |
0.89%
|
| Factors Affecting Performance [Text Block] |
How did the Fund perform in the past 12 months?For the year ended December 31, 2025, the Fund underperformed the Russell 1000® Value Index. ↑ Top contributors to performance: Stock selection in industrials drove outperformance, due to strong performance from Johnson Controls and Vertiv. Stock selection & an underweight position in real estate also helped relative performance. The Fund’s only holding in the sector, CBRE, was a strong contributor. Lastly, stock selection in health care, consumer staples, consumer discretionary, energy & utilities also made a positive contributions. ↓ Top detractors from performance: Stock selection in the communication services sector was the largest detractor from the fund's relative return. Stock selection in financials also detracted from relative returns, due in large part to Fiserv. The materials and information technology sectors also detracted. Within IT, Marvel Technology was a key detractor. |
| Line Graph [Table Text Block] |
| Class S | Russell 3000® Index | Russell 1000® Value Index |
|---|
2015 | $10,000 | $10,000 | $10,000 |
|---|
2016 | $11,992 | $11,274 | $11,734 |
|---|
2017 | $13,658 | $13,656 | $13,337 |
|---|
2018 | $11,803 | $12,941 | $12,234 |
|---|
2019 | $14,722 | $16,955 | $15,481 |
|---|
2020 | $15,149 | $20,497 | $15,914 |
|---|
2021 | $19,536 | $25,756 | $19,918 |
|---|
2022 | $18,395 | $20,808 | $18,416 |
|---|
2023 | $20,665 | $26,210 | $20,527 |
|---|
2024 | $24,001 | $32,449 | $23,477 |
|---|
2025 | $27,686 | $38,013 | $27,211 |
|---|
|
| Average Annual Return [Table Text Block] |
Fund | 1 Year
| 5 Years
| 10 Years
|
|---|
Class S
| 15.35% | 12.82% | 10.72% |
|---|
Russell 3000® Index | 17.15% | 13.15% | 14.29% |
|---|
Russell 1000® Value Index | 15.91% | 11.33% | 10.53% |
|---|
|
| AssetsNet |
$ 160,977,881
|
| Holdings Count | Holding |
77
|
| Advisory Fees Paid, Amount |
$ 968,980
|
| InvestmentCompanyPortfolioTurnover |
27.00%
|
| Additional Fund Statistics [Text Block] |
- Total Net Assets$160,977,881
- # of Portfolio Holdings77
- Portfolio Turnover Rate27%
- Investment Advisory Fees Paid$968,980
|
| Holdings [Text Block] |
Value | Value |
|---|
Assets in Excess of Other Liabilities | 0.0% | Short-Term Investments | 2.7% | Common Stock | 97.3% |
Value | Value |
|---|
Financials | 19.3% | Health Care | 15.4% | Information Technology | 14.7% | Industrials | 13.4% | Consumer Staples | 7.1% | Energy | 6.9% | Consumer Discretionary | 6.6% | Communication Services | 5.8% | Utilities | 4.2% | Materials | 2.2% | Real Estate | 1.7% | Short-Term Investments | 2.7% | Assets in Excess of Other Liabilities | 0.0% |
|
| Largest Holdings [Text Block] |
Wells Fargo & Co. | 3.3% |
|---|
Bank of America Corp. | 3.1% |
|---|
Amazon.com, Inc. | 2.5% |
|---|
Philip Morris International, Inc. | 2.4% |
|---|
Microsoft Corp. | 2.2% |
|---|
Alphabet, Inc. - Class A | 2.2% |
|---|
Charles Schwab Corp. | 2.1% |
|---|
Parker-Hannifin Corp. | 2.1% |
|---|
Walt Disney Co. | 2.0% |
|---|
Citizens Financial Group, Inc. | 2.0% |
|---|
|
| Material Fund Change [Text Block] |
|
| C000015783 |
|
| Shareholder Report [Line Items] |
|
| Fund Name |
VY<sup style="inset: 1.5px 0px 4px; box-sizing: border-box; color: rgb(0, 0, 0); display: inline; flex-wrap: nowrap; font-size: 9px; font-weight: 400; grid-area: auto; line-height: 0px; margin: 0px; overflow: visible; position: relative; text-align: left; text-align-last: auto; white-space-collapse: preserve-breaks;">®</sup> Invesco Growth and Income Portfolio
|
| Class Name |
Class S2
|
| Trading Symbol |
IVITX
|
| Annual or Semi-Annual Statement [Text Block] |
This annual shareholder report contains important information about VY® Invesco Growth and Income Portfolio for the period of January 1, 2025 to December 31, 2025.
|
| Shareholder Report Annual or Semi-Annual |
Annual Shareholder Report
|
| Additional Information Phone Number |
1-800-992-0180
|
| Expenses [Text Block] |
What were the Fund’s costs for the last year? (based on a hypothetical $10,000 investment)Class Name | Costs of $10K investment | Costs paid as % of $10K investment |
|---|
Class S2 | $112 | 1.04% |
|---|
|
| Expenses Paid, Amount |
$ 112
|
| Expense Ratio, Percent |
1.04%
|
| Factors Affecting Performance [Text Block] |
How did the Fund perform in the past 12 months?For the year ended December 31, 2025, the Fund underperformed the Russell 1000® Value Index. ↑ Top contributors to performance: Stock selection in industrials drove outperformance, due to strong performance from Johnson Controls and Vertiv. Stock selection & an underweight position in real estate also helped relative performance. The Fund’s only holding in the sector, CBRE, was a strong contributor. Lastly, stock selection in health care, consumer staples, consumer discretionary, energy & utilities also made a positive contributions. ↓ Top detractors from performance: Stock selection in the communication services sector was the largest detractor from the fund's relative return. Stock selection in financials also detracted from relative returns, due in large part to Fiserv. The materials and information technology sectors also detracted. Within IT, Marvel Technology was a key detractor. |
| Line Graph [Table Text Block] |
| Class S2 | Russell 3000® Index | Russell 1000® Value Index |
|---|
2015 | $10,000 | $10,000 | $10,000 |
|---|
2016 | $11,980 | $11,274 | $11,734 |
|---|
2017 | $13,618 | $13,656 | $13,337 |
|---|
2018 | $11,756 | $12,941 | $12,234 |
|---|
2019 | $14,632 | $16,955 | $15,481 |
|---|
2020 | $15,038 | $20,497 | $15,914 |
|---|
2021 | $19,367 | $25,756 | $19,918 |
|---|
2022 | $18,208 | $20,808 | $18,416 |
|---|
2023 | $20,425 | $26,210 | $20,527 |
|---|
2024 | $23,682 | $32,449 | $23,477 |
|---|
2025 | $27,277 | $38,013 | $27,211 |
|---|
|
| Average Annual Return [Table Text Block] |
Fund | 1 Year
| 5 Years
| 10 Years
|
|---|
Class S2
| 15.18% | 12.65% | 10.56% |
|---|
Russell 3000® Index | 17.15% | 13.15% | 14.29% |
|---|
Russell 1000® Value Index | 15.91% | 11.33% | 10.53% |
|---|
|
| AssetsNet |
$ 160,977,881
|
| Holdings Count | Holding |
77
|
| Advisory Fees Paid, Amount |
$ 968,980
|
| InvestmentCompanyPortfolioTurnover |
27.00%
|
| Additional Fund Statistics [Text Block] |
- Total Net Assets$160,977,881
- # of Portfolio Holdings77
- Portfolio Turnover Rate27%
- Investment Advisory Fees Paid$968,980
|
| Holdings [Text Block] |
Value | Value |
|---|
Assets in Excess of Other Liabilities | 0.0% | Short-Term Investments | 2.7% | Common Stock | 97.3% |
Value | Value |
|---|
Financials | 19.3% | Health Care | 15.4% | Information Technology | 14.7% | Industrials | 13.4% | Consumer Staples | 7.1% | Energy | 6.9% | Consumer Discretionary | 6.6% | Communication Services | 5.8% | Utilities | 4.2% | Materials | 2.2% | Real Estate | 1.7% | Short-Term Investments | 2.7% | Assets in Excess of Other Liabilities | 0.0% |
|
| Largest Holdings [Text Block] |
Wells Fargo & Co. | 3.3% |
|---|
Bank of America Corp. | 3.1% |
|---|
Amazon.com, Inc. | 2.5% |
|---|
Philip Morris International, Inc. | 2.4% |
|---|
Microsoft Corp. | 2.2% |
|---|
Alphabet, Inc. - Class A | 2.2% |
|---|
Charles Schwab Corp. | 2.1% |
|---|
Parker-Hannifin Corp. | 2.1% |
|---|
Walt Disney Co. | 2.0% |
|---|
Citizens Financial Group, Inc. | 2.0% |
|---|
|
| Material Fund Change [Text Block] |
|
| C000015329 |
|
| Shareholder Report [Line Items] |
|
| Fund Name |
VY<sup style="inset: 1.5px 0px 4px; box-sizing: border-box; color: rgb(0, 0, 0); display: inline; flex-wrap: nowrap; font-size: 9px; font-weight: 400; grid-area: auto; line-height: 0px; margin: 0px; overflow: visible; position: relative; text-align: left; text-align-last: auto; white-space-collapse: preserve-breaks;">®</sup> JPMorgan Emerging Markets Equity Portfolio
|
| Class Name |
Class ADV
|
| Trading Symbol |
IJEAX
|
| Annual or Semi-Annual Statement [Text Block] |
This annual shareholder report contains important information about VY® JPMorgan Emerging Markets Equity Portfolio for the period of January 1, 2025 to December 31, 2025.
|
| Shareholder Report Annual or Semi-Annual |
Annual Shareholder Report
|
| Additional Information Phone Number |
1-800-992-0180
|
| Expenses [Text Block] |
What were the Fund’s costs for the last year? (based on a hypothetical $10,000 investment)Class Name | Costs of $10K investment | Costs paid as % of $10K investment |
|---|
Class ADV | $214 | 1.79% |
|---|
|
| Expenses Paid, Amount |
$ 214
|
| Expense Ratio, Percent |
1.79%
|
| Factors Affecting Performance [Text Block] |
How did the Fund perform in the past 12 months?For the year ended December 31, 2025, the Fund outperformed the MSCI Emerging Markets IndexSM, primarily due to favorable stock selection and country allocation. ↑ Top contributors to performance: Stock selection in information technology boosted relative performance. At a country level, stock selection in South Korea was additive. On an individual level, exposure to overweight exposure to SK Hynix, a Korean memory company, boosted returns. ↓ Top detractors from performance: Stock selection in consumer discretionary detracted from relative returns. Stock selection in Argentina hurt result. Key individual detractors included underweight exposure to Alibaba. |
| Line Graph [Table Text Block] |
| Class ADV | MSCI All Country World Ex-U.S. Index℠
| MSCI Emerging Markets Index℠
|
|---|
2015 | $10,000 | $10,000 | $10,000 |
|---|
2016 | $11,262 | $10,450 | $11,119 |
|---|
2017 | $16,055 | $13,291 | $15,264 |
|---|
2018 | $13,307 | $11,404 | $13,040 |
|---|
2019 | $17,494 | $13,857 | $15,442 |
|---|
2020 | $23,216 | $15,333 | $18,270 |
|---|
2021 | $20,826 | $16,532 | $17,806 |
|---|
2022 | $15,338 | $13,887 | $14,228 |
|---|
2023 | $16,276 | $16,055 | $15,627 |
|---|
2024 | $16,537 | $16,944 | $16,799 |
|---|
2025 | $22,919 | $22,431 | $22,438 |
|---|
|
| Average Annual Return [Table Text Block] |
Fund | 1 Year
| 5 Years
| 10 Years
|
|---|
Class ADV
| 38.59% | -0.26% | 8.65% |
|---|
MSCI All Country World Ex-U.S. Index℠ | 32.39% | 7.91% | 8.41% |
|---|
MSCI Emerging Markets Index℠ | 33.57% | 4.20% | 8.42% |
|---|
|
| AssetsNet |
$ 151,816,454
|
| Holdings Count | Holding |
81
|
| Advisory Fees Paid, Amount |
$ 2,738,141
|
| InvestmentCompanyPortfolioTurnover |
37.00%
|
| Additional Fund Statistics [Text Block] |
- Total Net Assets$151,816,454
- # of Portfolio Holdings81
- Portfolio Turnover Rate37%
- Investment Advisory Fees Paid$2,738,141
|
| Holdings [Text Block] |
Value | Value |
|---|
Assets in Excess of Other Liabilities | 0.8% | Countries-Other | 8.4% | Mexico | 1.6% | Singapore | 1.7% | United States | 2.1% | Spain | 2.2% | Hong Kong | 2.8% | Turkey | 3.2% | Brazil | 11.1% | India | 11.6% | South Korea | 12.4% | Taiwan | 17.8% | China | 24.3% |
|
| Largest Holdings [Text Block] |
Taiwan Semiconductor Manufacturing Co. Ltd. | 12.9% |
|---|
Tencent Holdings Ltd. | 6.1% |
|---|
SK Hynix, Inc. | 5.9% |
|---|
Samsung Electronics Co. Ltd. | 3.3% |
|---|
Alibaba Group Holding Ltd. | 2.7% |
|---|
Banco Bilbao Vizcaya Argentaria SA | 2.2% |
|---|
Hanwha Aerospace Co. Ltd. | 2.1% |
|---|
NU Holdings Ltd./Cayman Islands - Class A | 2.0% |
|---|
Coforge Ltd. | 1.9% |
|---|
AIA Group Ltd. | 1.8% |
|---|
|
| Material Fund Change [Text Block] |
|
| C000015330 |
|
| Shareholder Report [Line Items] |
|
| Fund Name |
VY<sup style="inset: 1.5px 0px 4px; box-sizing: border-box; color: rgb(0, 0, 0); display: inline; flex-wrap: nowrap; font-size: 9px; font-weight: 400; grid-area: auto; line-height: 0px; margin: 0px; overflow: visible; position: relative; text-align: left; text-align-last: auto; white-space-collapse: preserve-breaks;">®</sup> JPMorgan Emerging Markets Equity Portfolio
|
| Class Name |
Class I
|
| Trading Symbol |
IJEMX
|
| Annual or Semi-Annual Statement [Text Block] |
This annual shareholder report contains important information about VY® JPMorgan Emerging Markets Equity Portfolio for the period of January 1, 2025 to December 31, 2025.
|
| Shareholder Report Annual or Semi-Annual |
Annual Shareholder Report
|
| Additional Information Phone Number |
1-800-992-0180
|
| Expenses [Text Block] |
What were the Fund’s costs for the last year? (based on a hypothetical $10,000 investment)Class Name | Costs of $10K investment | Costs paid as % of $10K investment |
|---|
Class I | $142 | 1.19% |
|---|
|
| Expenses Paid, Amount |
$ 142
|
| Expense Ratio, Percent |
1.19%
|
| Factors Affecting Performance [Text Block] |
How did the Fund perform in the past 12 months?For the year ended December 31, 2025, the Fund outperformed the MSCI Emerging Markets IndexSM, primarily due to favorable stock selection and country allocation. ↑ Top contributors to performance: Stock selection in information technology boosted relative performance. At a country level, stock selection in South Korea was additive. On an individual level, exposure to overweight exposure to SK Hynix, a Korean memory company, boosted returns. ↓ Top detractors from performance: Stock selection in consumer discretionary detracted from relative returns. Stock selection in Argentina hurt result. Key individual detractors included underweight exposure to Alibaba. |
| Line Graph [Table Text Block] |
| Class I | MSCI All Country World Ex-U.S. Index℠
| MSCI Emerging Markets Index℠
|
|---|
2015 | $10,000 | $10,000 | $10,000 |
|---|
2016 | $11,327 | $10,450 | $11,119 |
|---|
2017 | $16,248 | $13,291 | $15,264 |
|---|
2018 | $13,554 | $11,404 | $13,040 |
|---|
2019 | $17,923 | $13,857 | $15,442 |
|---|
2020 | $23,931 | $15,333 | $18,270 |
|---|
2021 | $21,591 | $16,532 | $17,806 |
|---|
2022 | $16,001 | $13,887 | $14,228 |
|---|
2023 | $17,090 | $16,055 | $15,627 |
|---|
2024 | $17,456 | $16,944 | $16,799 |
|---|
2025 | $24,275 | $22,431 | $22,438 |
|---|
|
| Average Annual Return [Table Text Block] |
Fund | 1 Year
| 5 Years
| 10 Years
|
|---|
Class I
| 39.06% | 0.29% | 9.27% |
|---|
MSCI All Country World Ex-U.S. Index℠ | 32.39% | 7.91% | 8.41% |
|---|
MSCI Emerging Markets Index℠ | 33.57% | 4.20% | 8.42% |
|---|
|
| AssetsNet |
$ 151,816,454
|
| Holdings Count | Holding |
81
|
| Advisory Fees Paid, Amount |
$ 2,738,141
|
| InvestmentCompanyPortfolioTurnover |
37.00%
|
| Additional Fund Statistics [Text Block] |
- Total Net Assets$151,816,454
- # of Portfolio Holdings81
- Portfolio Turnover Rate37%
- Investment Advisory Fees Paid$2,738,141
|
| Holdings [Text Block] |
Value | Value |
|---|
Assets in Excess of Other Liabilities | 0.8% | Countries-Other | 8.4% | Mexico | 1.6% | Singapore | 1.7% | United States | 2.1% | Spain | 2.2% | Hong Kong | 2.8% | Turkey | 3.2% | Brazil | 11.1% | India | 11.6% | South Korea | 12.4% | Taiwan | 17.8% | China | 24.3% |
|
| Largest Holdings [Text Block] |
Taiwan Semiconductor Manufacturing Co. Ltd. | 12.9% |
|---|
Tencent Holdings Ltd. | 6.1% |
|---|
SK Hynix, Inc. | 5.9% |
|---|
Samsung Electronics Co. Ltd. | 3.3% |
|---|
Alibaba Group Holding Ltd. | 2.7% |
|---|
Banco Bilbao Vizcaya Argentaria SA | 2.2% |
|---|
Hanwha Aerospace Co. Ltd. | 2.1% |
|---|
NU Holdings Ltd./Cayman Islands - Class A | 2.0% |
|---|
Coforge Ltd. | 1.9% |
|---|
AIA Group Ltd. | 1.8% |
|---|
|
| Material Fund Change [Text Block] |
|
| C000015331 |
|
| Shareholder Report [Line Items] |
|
| Fund Name |
VY<sup style="inset: 1.5px 0px 4px; box-sizing: border-box; color: rgb(0, 0, 0); display: inline; flex-wrap: nowrap; font-size: 9px; font-weight: 400; grid-area: auto; line-height: 0px; margin: 0px; overflow: visible; position: relative; text-align: left; text-align-last: auto; white-space-collapse: preserve-breaks;">®</sup> JPMorgan Emerging Markets Equity Portfolio
|
| Class Name |
Class S
|
| Trading Symbol |
IJPIX
|
| Annual or Semi-Annual Statement [Text Block] |
This annual shareholder report contains important information about VY® JPMorgan Emerging Markets Equity Portfolio for the period of January 1, 2025 to December 31, 2025.
|
| Shareholder Report Annual or Semi-Annual |
Annual Shareholder Report
|
| Additional Information Phone Number |
1-800-992-0180
|
| Expenses [Text Block] |
What were the Fund’s costs for the last year? (based on a hypothetical $10,000 investment)Class Name | Costs of $10K investment | Costs paid as % of $10K investment |
|---|
Class S | $172 | 1.44% |
|---|
|
| Expenses Paid, Amount |
$ 172
|
| Expense Ratio, Percent |
1.44%
|
| Factors Affecting Performance [Text Block] |
How did the Fund perform in the past 12 months?For the year ended December 31, 2025, the Fund outperformed the MSCI Emerging Markets IndexSM, primarily due to favorable stock selection and country allocation. ↑ Top contributors to performance: Stock selection in information technology boosted relative performance. At a country level, stock selection in South Korea was additive. On an individual level, exposure to overweight exposure to SK Hynix, a Korean memory company, boosted returns. ↓ Top detractors from performance: Stock selection in consumer discretionary detracted from relative returns. Stock selection in Argentina hurt result. Key individual detractors included underweight exposure to Alibaba. |
| Line Graph [Table Text Block] |
| Class S | MSCI All Country World Ex-U.S. Index℠
| MSCI Emerging Markets Index℠
|
|---|
2015 | $10,000 | $10,000 | $10,000 |
|---|
2016 | $11,295 | $10,450 | $11,119 |
|---|
2017 | $16,164 | $13,291 | $15,264 |
|---|
2018 | $13,446 | $11,404 | $13,040 |
|---|
2019 | $17,737 | $13,857 | $15,442 |
|---|
2020 | $23,631 | $15,333 | $18,270 |
|---|
2021 | $21,267 | $16,532 | $17,806 |
|---|
2022 | $15,714 | $13,887 | $14,228 |
|---|
2023 | $16,744 | $16,055 | $15,627 |
|---|
2024 | $17,065 | $16,944 | $16,799 |
|---|
2025 | $23,680 | $22,431 | $22,438 |
|---|
|
| Average Annual Return [Table Text Block] |
Fund | 1 Year
| 5 Years
| 10 Years
|
|---|
Class S
| 38.77% | 0.04% | 9.00% |
|---|
MSCI All Country World Ex-U.S. Index℠ | 32.39% | 7.91% | 8.41% |
|---|
MSCI Emerging Markets Index℠ | 33.57% | 4.20% | 8.42% |
|---|
|
| AssetsNet |
$ 151,816,454
|
| Holdings Count | Holding |
81
|
| Advisory Fees Paid, Amount |
$ 2,738,141
|
| InvestmentCompanyPortfolioTurnover |
37.00%
|
| Additional Fund Statistics [Text Block] |
- Total Net Assets$151,816,454
- # of Portfolio Holdings81
- Portfolio Turnover Rate37%
- Investment Advisory Fees Paid$2,738,141
|
| Holdings [Text Block] |
Value | Value |
|---|
Assets in Excess of Other Liabilities | 0.8% | Countries-Other | 8.4% | Mexico | 1.6% | Singapore | 1.7% | United States | 2.1% | Spain | 2.2% | Hong Kong | 2.8% | Turkey | 3.2% | Brazil | 11.1% | India | 11.6% | South Korea | 12.4% | Taiwan | 17.8% | China | 24.3% |
|
| Largest Holdings [Text Block] |
Taiwan Semiconductor Manufacturing Co. Ltd. | 12.9% |
|---|
Tencent Holdings Ltd. | 6.1% |
|---|
SK Hynix, Inc. | 5.9% |
|---|
Samsung Electronics Co. Ltd. | 3.3% |
|---|
Alibaba Group Holding Ltd. | 2.7% |
|---|
Banco Bilbao Vizcaya Argentaria SA | 2.2% |
|---|
Hanwha Aerospace Co. Ltd. | 2.1% |
|---|
NU Holdings Ltd./Cayman Islands - Class A | 2.0% |
|---|
Coforge Ltd. | 1.9% |
|---|
AIA Group Ltd. | 1.8% |
|---|
|
| Material Fund Change [Text Block] |
|
| C000015332 |
|
| Shareholder Report [Line Items] |
|
| Fund Name |
VY<sup style="inset: 1.5px 0px 4px; box-sizing: border-box; color: rgb(0, 0, 0); display: inline; flex-wrap: nowrap; font-size: 9px; font-weight: 400; grid-area: auto; line-height: 0px; margin: 0px; overflow: visible; position: relative; text-align: left; text-align-last: auto; white-space-collapse: preserve-breaks;">®</sup> JPMorgan Emerging Markets Equity Portfolio
|
| Class Name |
Class S2
|
| Trading Symbol |
IJPTX
|
| Annual or Semi-Annual Statement [Text Block] |
This annual shareholder report contains important information about VY® JPMorgan Emerging Markets Equity Portfolio for the period of January 1, 2025 to December 31, 2025.
|
| Shareholder Report Annual or Semi-Annual |
Annual Shareholder Report
|
| Additional Information Phone Number |
1-800-992-0180
|
| Expenses [Text Block] |
What were the Fund’s costs for the last year? (based on a hypothetical $10,000 investment)Class Name | Costs of $10K investment | Costs paid as % of $10K investment |
|---|
Class S2 | $190 | 1.59% |
|---|
|
| Expenses Paid, Amount |
$ 190
|
| Expense Ratio, Percent |
1.59%
|
| Factors Affecting Performance [Text Block] |
How did the Fund perform in the past 12 months?For the year ended December 31, 2025, the Fund outperformed the MSCI Emerging Markets IndexSM, primarily due to favorable stock selection and country allocation. ↑ Top contributors to performance: Stock selection in information technology boosted relative performance. At a country level, stock selection in South Korea was additive. On an individual level, exposure to overweight exposure to SK Hynix, a Korean memory company, boosted returns. ↓ Top detractors from performance: Stock selection in consumer discretionary detracted from relative returns. Stock selection in Argentina hurt result. Key individual detractors included underweight exposure to Alibaba. |
| Line Graph [Table Text Block] |
| Class S2 | MSCI All Country World Ex-U.S. Index℠
| MSCI Emerging Markets Index℠
|
|---|
2015 | $10,000 | $10,000 | $10,000 |
|---|
2016 | $11,279 | $10,450 | $11,119 |
|---|
2017 | $16,112 | $13,291 | $15,264 |
|---|
2018 | $13,387 | $11,404 | $13,040 |
|---|
2019 | $17,623 | $13,857 | $15,442 |
|---|
2020 | $23,444 | $15,333 | $18,270 |
|---|
2021 | $21,074 | $16,532 | $17,806 |
|---|
2022 | $15,547 | $13,887 | $14,228 |
|---|
2023 | $16,547 | $16,055 | $15,627 |
|---|
2024 | $16,842 | $16,944 | $16,799 |
|---|
2025 | $23,383 | $22,431 | $22,438 |
|---|
|
| Average Annual Return [Table Text Block] |
Fund | 1 Year
| 5 Years
| 10 Years
|
|---|
Class S2
| 38.84% | -0.05% | 8.87% |
|---|
MSCI All Country World Ex-U.S. Index℠ | 32.39% | 7.91% | 8.41% |
|---|
MSCI Emerging Markets Index℠ | 33.57% | 4.20% | 8.42% |
|---|
|
| AssetsNet |
$ 151,816,454
|
| Holdings Count | Holding |
81
|
| Advisory Fees Paid, Amount |
$ 2,738,141
|
| InvestmentCompanyPortfolioTurnover |
37.00%
|
| Additional Fund Statistics [Text Block] |
- Total Net Assets$151,816,454
- # of Portfolio Holdings81
- Portfolio Turnover Rate37%
- Investment Advisory Fees Paid$2,738,141
|
| Holdings [Text Block] |
Value | Value |
|---|
Assets in Excess of Other Liabilities | 0.8% | Countries-Other | 8.4% | Mexico | 1.6% | Singapore | 1.7% | United States | 2.1% | Spain | 2.2% | Hong Kong | 2.8% | Turkey | 3.2% | Brazil | 11.1% | India | 11.6% | South Korea | 12.4% | Taiwan | 17.8% | China | 24.3% |
|
| Largest Holdings [Text Block] |
Taiwan Semiconductor Manufacturing Co. Ltd. | 12.9% |
|---|
Tencent Holdings Ltd. | 6.1% |
|---|
SK Hynix, Inc. | 5.9% |
|---|
Samsung Electronics Co. Ltd. | 3.3% |
|---|
Alibaba Group Holding Ltd. | 2.7% |
|---|
Banco Bilbao Vizcaya Argentaria SA | 2.2% |
|---|
Hanwha Aerospace Co. Ltd. | 2.1% |
|---|
NU Holdings Ltd./Cayman Islands - Class A | 2.0% |
|---|
Coforge Ltd. | 1.9% |
|---|
AIA Group Ltd. | 1.8% |
|---|
|
| Material Fund Change [Text Block] |
|
| C000028903 |
|
| Shareholder Report [Line Items] |
|
| Fund Name |
VY<sup style="inset: 1.5px 0px 4px; box-sizing: border-box; color: rgb(0, 0, 0); display: inline; flex-wrap: nowrap; font-size: 9px; font-weight: 400; grid-area: auto; line-height: 0px; margin: 0px; overflow: visible; position: relative; text-align: left; text-align-last: auto; white-space-collapse: preserve-breaks;">®</sup> JPMorgan Small Cap Core Equity Portfolio
|
| Class Name |
Class ADV
|
| Trading Symbol |
IJSAX
|
| Annual or Semi-Annual Statement [Text Block] |
This annual shareholder report contains important information about VY® JPMorgan Small Cap Core Equity Portfolio for the period of January 1, 2025 to December 31, 2025.
|
| Shareholder Report Annual or Semi-Annual |
Annual Shareholder Report
|
| Additional Information Phone Number |
1-800-992-0180
|
| Expenses [Text Block] |
What were the Fund’s costs for the last year? (based on a hypothetical $10,000 investment)Class Name | Costs of $10K investment | Costs paid as % of $10K investment |
|---|
Class ADV | $151 | 1.49% |
|---|
|
| Expenses Paid, Amount |
$ 151
|
| Expense Ratio, Percent |
1.49%
|
| Factors Affecting Performance [Text Block] |
How did the Fund perform in the past 12 months?For the year ended December 31, 2025, the Fund underperformed the Russell 2000® Index due to stock selection. ↑ Top contributors to performance: Stock selection in the finance and software & services sectors contributed to performance. Overweight allocations in Cipher Mining and Terns Pharmaceutical were top contributors. ↓ Top detractors from performance: Stock selection in pharmaceuticals and consumer cyclical sectors detracted most from performance. Underweight allocations in Guardant Health and Bloom Energy were top detractors. |
| Line Graph [Table Text Block] |
| Class ADV | Russell 3000® Index | Russell 2000® Index |
|---|
2015 | $10,000 | $10,000 | $10,000 |
|---|
2016 | $12,117 | $11,274 | $12,131 |
|---|
2017 | $13,955 | $13,656 | $13,908 |
|---|
2018 | $12,445 | $12,941 | $12,377 |
|---|
2019 | $15,675 | $16,955 | $15,535 |
|---|
2020 | $18,158 | $20,497 | $18,636 |
|---|
2021 | $21,416 | $25,756 | $21,398 |
|---|
2022 | $17,543 | $20,808 | $17,024 |
|---|
2023 | $19,627 | $26,210 | $19,907 |
|---|
2024 | $21,665 | $32,449 | $22,203 |
|---|
2025 | $22,361 | $38,013 | $25,047 |
|---|
|
| Average Annual Return [Table Text Block] |
Fund | 1 Year
| 5 Years
| 10 Years
|
|---|
Class ADV
| 3.21% | 4.25% | 8.38% |
|---|
Russell 3000® Index | 17.15% | 13.15% | 14.29% |
|---|
Russell 2000® Index | 12.81% | 6.09% | 9.62% |
|---|
|
| AssetsNet |
$ 290,910,897
|
| Holdings Count | Holding |
702
|
| Advisory Fees Paid, Amount |
$ 2,805,475
|
| InvestmentCompanyPortfolioTurnover |
81.00%
|
| Additional Fund Statistics [Text Block] |
- Total Net Assets$290,910,897
- # of Portfolio Holdings702
- Portfolio Turnover Rate81%
- Investment Advisory Fees Paid$2,805,475
|
| Holdings [Text Block] |
Value | Value |
|---|
Liabilities in Excess of Other Assets | (5.3)% | Short-Term Investments | 8.1% | Common Stock | 97.2% |
Value | Value |
|---|
Industrials | 19.6% | Financials | 19.0% | Health Care | 13.2% | Information Technology | 13.0% | Consumer Discretionary | 10.7% | Materials | 5.6% | Real Estate | 5.4% | Energy | 4.2% | Consumer Staples | 3.2% | Utilities | 2.1% | Communication Services | 1.2% | Short-Term Investments | 8.1% | Liabilities in Excess of Other Assets | (5.3)% |
|
| Largest Holdings [Text Block] |
MSA Safety, Inc. | 1.0% |
|---|
Hayward Holdings, Inc. | 0.9% |
|---|
Modine Manufacturing Co. | 0.9% |
|---|
Fabrinet | 0.9% |
|---|
Ryman Hospitality Properties, Inc. | 0.9% |
|---|
MACOM Technology Solutions Holdings, Inc. | 0.9% |
|---|
Applied Industrial Technologies, Inc. | 0.8% |
|---|
Novanta, Inc. | 0.8% |
|---|
Element Solutions, Inc. | 0.8% |
|---|
Wintrust Financial Corp. | 0.8% |
|---|
|
| Material Fund Change [Text Block] |
|
| C000015333 |
|
| Shareholder Report [Line Items] |
|
| Fund Name |
VY<sup style="inset: 1.5px 0px 4px; box-sizing: border-box; color: rgb(0, 0, 0); display: inline; flex-wrap: nowrap; font-size: 9px; font-weight: 400; grid-area: auto; line-height: 0px; margin: 0px; overflow: visible; position: relative; text-align: left; text-align-last: auto; white-space-collapse: preserve-breaks;">®</sup> JPMorgan Small Cap Core Equity Portfolio
|
| Class Name |
Class I
|
| Trading Symbol |
IJSIX
|
| Annual or Semi-Annual Statement [Text Block] |
This annual shareholder report contains important information about VY® JPMorgan Small Cap Core Equity Portfolio for the period of January 1, 2025 to December 31, 2025.
|
| Shareholder Report Annual or Semi-Annual |
Annual Shareholder Report
|
| Additional Information Phone Number |
1-800-992-0180
|
| Expenses [Text Block] |
What were the Fund’s costs for the last year? (based on a hypothetical $10,000 investment)Class Name | Costs of $10K investment | Costs paid as % of $10K investment |
|---|
Class I | $91 | 0.89% |
|---|
|
| Expenses Paid, Amount |
$ 91
|
| Expense Ratio, Percent |
0.89%
|
| Factors Affecting Performance [Text Block] |
How did the Fund perform in the past 12 months?For the year ended December 31, 2025, the Fund underperformed the Russell 2000® Index due to stock selection. ↑ Top contributors to performance: Stock selection in the finance and software & services sectors contributed to performance. Overweight allocations in Cipher Mining and Terns Pharmaceutical were top contributors. ↓ Top detractors from performance: Stock selection in pharmaceuticals and consumer cyclical sectors detracted most from performance. Underweight allocations in Guardant Health and Bloom Energy were top detractors. |
| Line Graph [Table Text Block] |
| Class I | Russell 3000® Index | Russell 2000® Index |
|---|
2015 | $10,000 | $10,000 | $10,000 |
|---|
2016 | $12,192 | $11,274 | $12,131 |
|---|
2017 | $14,126 | $13,656 | $13,908 |
|---|
2018 | $12,665 | $12,941 | $12,377 |
|---|
2019 | $16,053 | $16,955 | $15,535 |
|---|
2020 | $18,707 | $20,497 | $18,636 |
|---|
2021 | $22,207 | $25,756 | $21,398 |
|---|
2022 | $18,305 | $20,808 | $17,024 |
|---|
2023 | $20,587 | $26,210 | $19,907 |
|---|
2024 | $22,870 | $32,449 | $22,203 |
|---|
2025 | $23,753 | $38,013 | $25,047 |
|---|
|
| Average Annual Return [Table Text Block] |
Fund | 1 Year
| 5 Years
| 10 Years
|
|---|
Class I
| 3.86% | 4.89% | 9.04% |
|---|
Russell 3000® Index | 17.15% | 13.15% | 14.29% |
|---|
Russell 2000® Index | 12.81% | 6.09% | 9.62% |
|---|
|
| AssetsNet |
$ 290,910,897
|
| Holdings Count | Holding |
702
|
| Advisory Fees Paid, Amount |
$ 2,805,475
|
| InvestmentCompanyPortfolioTurnover |
81.00%
|
| Additional Fund Statistics [Text Block] |
- Total Net Assets$290,910,897
- # of Portfolio Holdings702
- Portfolio Turnover Rate81%
- Investment Advisory Fees Paid$2,805,475
|
| Holdings [Text Block] |
Value | Value |
|---|
Liabilities in Excess of Other Assets | (5.3)% | Short-Term Investments | 8.1% | Common Stock | 97.2% |
Value | Value |
|---|
Industrials | 19.6% | Financials | 19.0% | Health Care | 13.2% | Information Technology | 13.0% | Consumer Discretionary | 10.7% | Materials | 5.6% | Real Estate | 5.4% | Energy | 4.2% | Consumer Staples | 3.2% | Utilities | 2.1% | Communication Services | 1.2% | Short-Term Investments | 8.1% | Liabilities in Excess of Other Assets | (5.3)% |
|
| Largest Holdings [Text Block] |
MSA Safety, Inc. | 1.0% |
|---|
Hayward Holdings, Inc. | 0.9% |
|---|
Modine Manufacturing Co. | 0.9% |
|---|
Fabrinet | 0.9% |
|---|
Ryman Hospitality Properties, Inc. | 0.9% |
|---|
MACOM Technology Solutions Holdings, Inc. | 0.9% |
|---|
Applied Industrial Technologies, Inc. | 0.8% |
|---|
Novanta, Inc. | 0.8% |
|---|
Element Solutions, Inc. | 0.8% |
|---|
Wintrust Financial Corp. | 0.8% |
|---|
|
| Material Fund Change [Text Block] |
|
| C000168687 |
|
| Shareholder Report [Line Items] |
|
| Fund Name |
VY<sup style="inset: 1.5px 0px 4px; box-sizing: border-box; color: rgb(0, 0, 0); display: inline; flex-wrap: nowrap; font-size: 9px; font-weight: 400; grid-area: auto; line-height: 0px; margin: 0px; overflow: visible; position: relative; text-align: left; text-align-last: auto; white-space-collapse: preserve-breaks;">®</sup> JPMorgan Small Cap Core Equity Portfolio
|
| Class Name |
Class R6
|
| Trading Symbol |
VPRSX
|
| Annual or Semi-Annual Statement [Text Block] |
This annual shareholder report contains important information about VY® JPMorgan Small Cap Core Equity Portfolio for the period of January 1, 2025 to December 31, 2025.
|
| Shareholder Report Annual or Semi-Annual |
Annual Shareholder Report
|
| Additional Information Phone Number |
1-800-992-0180
|
| Expenses [Text Block] |
What were the Fund’s costs for the last year? (based on a hypothetical $10,000 investment)Class Name | Costs of $10K investment | Costs paid as % of $10K investment |
|---|
Class R6 | $91 | 0.89% |
|---|
|
| Expenses Paid, Amount |
$ 91
|
| Expense Ratio, Percent |
0.89%
|
| Factors Affecting Performance [Text Block] |
How did the Fund perform in the past 12 months?For the year ended December 31, 2025, the Fund underperformed the Russell 2000® Index due to stock selection. ↑ Top contributors to performance: Stock selection in the finance and software & services sectors contributed to performance. Overweight allocations in Cipher Mining and Terns Pharmaceutical were top contributors. ↓ Top detractors from performance: Stock selection in pharmaceuticals and consumer cyclical sectors detracted most from performance. Underweight allocations in Guardant Health and Bloom Energy were top detractors. |
| Line Graph [Table Text Block] |
| Class R6 | Russell 3000® Index | Russell 2000® Index |
|---|
5/3/2016 | $10,000 | $10,000 | $10,000 |
|---|
2016 | $12,104 | $11,120 | $12,225 |
|---|
2017 | $14,024 | $13,470 | $14,016 |
|---|
2018 | $12,574 | $12,764 | $12,473 |
|---|
2019 | $15,941 | $16,723 | $15,656 |
|---|
2020 | $18,568 | $20,217 | $18,781 |
|---|
2021 | $22,035 | $25,404 | $21,564 |
|---|
2022 | $18,168 | $20,524 | $17,156 |
|---|
2023 | $20,436 | $25,852 | $20,061 |
|---|
2024 | $22,706 | $32,006 | $22,375 |
|---|
2025 | $23,584 | $37,494 | $25,241 |
|---|
|
| Average Annual Return [Table Text Block] |
Fund | 1 Year
| 5 Years
| Since Inception (5/3/2016)
|
|---|
Class R6 | 3.87% | 4.90% | 9.29% |
|---|
Russell 3000® Index | 17.15% | 13.15% | 14.66% |
|---|
Russell 2000® Index | 12.81% | 6.09% | 10.06% |
|---|
|
| AssetsNet |
$ 290,910,897
|
| Holdings Count | Holding |
702
|
| Advisory Fees Paid, Amount |
$ 2,805,475
|
| InvestmentCompanyPortfolioTurnover |
81.00%
|
| Additional Fund Statistics [Text Block] |
- Total Net Assets$290,910,897
- # of Portfolio Holdings702
- Portfolio Turnover Rate81%
- Investment Advisory Fees Paid$2,805,475
|
| Holdings [Text Block] |
Value | Value |
|---|
Liabilities in Excess of Other Assets | (5.3)% | Short-Term Investments | 8.1% | Common Stock | 97.2% |
Value | Value |
|---|
Industrials | 19.6% | Financials | 19.0% | Health Care | 13.2% | Information Technology | 13.0% | Consumer Discretionary | 10.7% | Materials | 5.6% | Real Estate | 5.4% | Energy | 4.2% | Consumer Staples | 3.2% | Utilities | 2.1% | Communication Services | 1.2% | Short-Term Investments | 8.1% | Liabilities in Excess of Other Assets | (5.3)% |
|
| Largest Holdings [Text Block] |
MSA Safety, Inc. | 1.0% |
|---|
Hayward Holdings, Inc. | 0.9% |
|---|
Modine Manufacturing Co. | 0.9% |
|---|
Fabrinet | 0.9% |
|---|
Ryman Hospitality Properties, Inc. | 0.9% |
|---|
MACOM Technology Solutions Holdings, Inc. | 0.9% |
|---|
Applied Industrial Technologies, Inc. | 0.8% |
|---|
Novanta, Inc. | 0.8% |
|---|
Element Solutions, Inc. | 0.8% |
|---|
Wintrust Financial Corp. | 0.8% |
|---|
|
| Material Fund Change [Text Block] |
|
| C000015334 |
|
| Shareholder Report [Line Items] |
|
| Fund Name |
VY<sup style="inset: 1.5px 0px 4px; box-sizing: border-box; color: rgb(0, 0, 0); display: inline; flex-wrap: nowrap; font-size: 9px; font-weight: 400; grid-area: auto; line-height: 0px; margin: 0px; overflow: visible; position: relative; text-align: left; text-align-last: auto; white-space-collapse: preserve-breaks;">®</sup> JPMorgan Small Cap Core Equity Portfolio
|
| Class Name |
Class S
|
| Trading Symbol |
IJSSX
|
| Annual or Semi-Annual Statement [Text Block] |
This annual shareholder report contains important information about VY® JPMorgan Small Cap Core Equity Portfolio for the period of January 1, 2025 to December 31, 2025.
|
| Shareholder Report Annual or Semi-Annual |
Annual Shareholder Report
|
| Additional Information Phone Number |
1-800-992-0180
|
| Expenses [Text Block] |
What were the Fund’s costs for the last year? (based on a hypothetical $10,000 investment)Class Name | Costs of $10K investment | Costs paid as % of $10K investment |
|---|
Class S | $116 | 1.14% |
|---|
|
| Expenses Paid, Amount |
$ 116
|
| Expense Ratio, Percent |
1.14%
|
| Factors Affecting Performance [Text Block] |
How did the Fund perform in the past 12 months?For the year ended December 31, 2025, the Fund underperformed the Russell 2000® Index due to stock selection. ↑ Top contributors to performance: Stock selection in the finance and software & services sectors contributed to performance. Overweight allocations in Cipher Mining and Terns Pharmaceutical were top contributors. ↓ Top detractors from performance: Stock selection in pharmaceuticals and consumer cyclical sectors detracted most from performance. Underweight allocations in Guardant Health and Bloom Energy were top detractors. |
| Line Graph [Table Text Block] |
| Class S | Russell 3000® Index | Russell 2000® Index |
|---|
2015 | $10,000 | $10,000 | $10,000 |
|---|
2016 | $12,159 | $11,274 | $12,131 |
|---|
2017 | $14,050 | $13,656 | $13,908 |
|---|
2018 | $12,572 | $12,941 | $12,377 |
|---|
2019 | $15,889 | $16,955 | $15,535 |
|---|
2020 | $18,480 | $20,497 | $18,636 |
|---|
2021 | $21,865 | $25,756 | $21,398 |
|---|
2022 | $17,981 | $20,808 | $17,024 |
|---|
2023 | $20,186 | $26,210 | $19,907 |
|---|
2024 | $22,353 | $32,449 | $22,203 |
|---|
2025 | $23,170 | $38,013 | $25,047 |
|---|
|
| Average Annual Return [Table Text Block] |
Fund | 1 Year
| 5 Years
| 10 Years
|
|---|
Class S
| 3.65% | 4.63% | 8.77% |
|---|
Russell 3000® Index | 17.15% | 13.15% | 14.29% |
|---|
Russell 2000® Index | 12.81% | 6.09% | 9.62% |
|---|
|
| AssetsNet |
$ 290,910,897
|
| Holdings Count | Holding |
702
|
| Advisory Fees Paid, Amount |
$ 2,805,475
|
| InvestmentCompanyPortfolioTurnover |
81.00%
|
| Additional Fund Statistics [Text Block] |
- Total Net Assets$290,910,897
- # of Portfolio Holdings702
- Portfolio Turnover Rate81%
- Investment Advisory Fees Paid$2,805,475
|
| Holdings [Text Block] |
Value | Value |
|---|
Liabilities in Excess of Other Assets | (5.3)% | Short-Term Investments | 8.1% | Common Stock | 97.2% |
Value | Value |
|---|
Industrials | 19.6% | Financials | 19.0% | Health Care | 13.2% | Information Technology | 13.0% | Consumer Discretionary | 10.7% | Materials | 5.6% | Real Estate | 5.4% | Energy | 4.2% | Consumer Staples | 3.2% | Utilities | 2.1% | Communication Services | 1.2% | Short-Term Investments | 8.1% | Liabilities in Excess of Other Assets | (5.3)% |
|
| Largest Holdings [Text Block] |
MSA Safety, Inc. | 1.0% |
|---|
Hayward Holdings, Inc. | 0.9% |
|---|
Modine Manufacturing Co. | 0.9% |
|---|
Fabrinet | 0.9% |
|---|
Ryman Hospitality Properties, Inc. | 0.9% |
|---|
MACOM Technology Solutions Holdings, Inc. | 0.9% |
|---|
Applied Industrial Technologies, Inc. | 0.8% |
|---|
Novanta, Inc. | 0.8% |
|---|
Element Solutions, Inc. | 0.8% |
|---|
Wintrust Financial Corp. | 0.8% |
|---|
|
| Material Fund Change [Text Block] |
|
| C000015335 |
|
| Shareholder Report [Line Items] |
|
| Fund Name |
VY<sup style="inset: 1.5px 0px 4px; box-sizing: border-box; color: rgb(0, 0, 0); display: inline; flex-wrap: nowrap; font-size: 9px; font-weight: 400; grid-area: auto; line-height: 0px; margin: 0px; overflow: visible; position: relative; text-align: left; text-align-last: auto; white-space-collapse: preserve-breaks;">®</sup> JPMorgan Small Cap Core Equity Portfolio
|
| Class Name |
Class S2
|
| Trading Symbol |
IJSTX
|
| Annual or Semi-Annual Statement [Text Block] |
This annual shareholder report contains important information about VY® JPMorgan Small Cap Core Equity Portfolio for the period of January 1, 2025 to December 31, 2025.
|
| Shareholder Report Annual or Semi-Annual |
Annual Shareholder Report
|
| Additional Information Phone Number |
1-800-992-0180
|
| Expenses [Text Block] |
What were the Fund’s costs for the last year? (based on a hypothetical $10,000 investment)Class Name | Costs of $10K investment | Costs paid as % of $10K investment |
|---|
Class S2 | $131 | 1.29% |
|---|
|
| Expenses Paid, Amount |
$ 131
|
| Expense Ratio, Percent |
1.29%
|
| Factors Affecting Performance [Text Block] |
How did the Fund perform in the past 12 months?For the year ended December 31, 2025, the Fund underperformed the Russell 2000® Index due to stock selection. ↑ Top contributors to performance: Stock selection in the finance and software & services sectors contributed to performance. Overweight allocations in Cipher Mining and Terns Pharmaceutical were top contributors. ↓ Top detractors from performance: Stock selection in pharmaceuticals and consumer cyclical sectors detracted most from performance. Underweight allocations in Guardant Health and Bloom Energy were top detractors. |
| Line Graph [Table Text Block] |
| Class S2 | Russell 3000® Index | Russell 2000® Index |
|---|
2015 | $10,000 | $10,000 | $10,000 |
|---|
2016 | $12,139 | $11,274 | $12,131 |
|---|
2017 | $14,012 | $13,656 | $13,908 |
|---|
2018 | $12,521 | $12,941 | $12,377 |
|---|
2019 | $15,801 | $16,955 | $15,535 |
|---|
2020 | $18,341 | $20,497 | $18,636 |
|---|
2021 | $21,673 | $25,756 | $21,398 |
|---|
2022 | $17,801 | $20,808 | $17,024 |
|---|
2023 | $19,938 | $26,210 | $19,907 |
|---|
2024 | $22,052 | $32,449 | $22,203 |
|---|
2025 | $22,821 | $38,013 | $25,047 |
|---|
|
| Average Annual Return [Table Text Block] |
Fund | 1 Year
| 5 Years
| 10 Years
|
|---|
Class S2
| 3.49% | 4.47% | 8.60% |
|---|
Russell 3000® Index | 17.15% | 13.15% | 14.29% |
|---|
Russell 2000® Index | 12.81% | 6.09% | 9.62% |
|---|
|
| AssetsNet |
$ 290,910,897
|
| Holdings Count | Holding |
702
|
| Advisory Fees Paid, Amount |
$ 2,805,475
|
| InvestmentCompanyPortfolioTurnover |
81.00%
|
| Additional Fund Statistics [Text Block] |
- Total Net Assets$290,910,897
- # of Portfolio Holdings702
- Portfolio Turnover Rate81%
- Investment Advisory Fees Paid$2,805,475
|
| Holdings [Text Block] |
Value | Value |
|---|
Liabilities in Excess of Other Assets | (5.3)% | Short-Term Investments | 8.1% | Common Stock | 97.2% |
Value | Value |
|---|
Industrials | 19.6% | Financials | 19.0% | Health Care | 13.2% | Information Technology | 13.0% | Consumer Discretionary | 10.7% | Materials | 5.6% | Real Estate | 5.4% | Energy | 4.2% | Consumer Staples | 3.2% | Utilities | 2.1% | Communication Services | 1.2% | Short-Term Investments | 8.1% | Liabilities in Excess of Other Assets | (5.3)% |
|
| Largest Holdings [Text Block] |
MSA Safety, Inc. | 1.0% |
|---|
Hayward Holdings, Inc. | 0.9% |
|---|
Modine Manufacturing Co. | 0.9% |
|---|
Fabrinet | 0.9% |
|---|
Ryman Hospitality Properties, Inc. | 0.9% |
|---|
MACOM Technology Solutions Holdings, Inc. | 0.9% |
|---|
Applied Industrial Technologies, Inc. | 0.8% |
|---|
Novanta, Inc. | 0.8% |
|---|
Element Solutions, Inc. | 0.8% |
|---|
Wintrust Financial Corp. | 0.8% |
|---|
|
| Material Fund Change [Text Block] |
|
| C000015776 |
|
| Shareholder Report [Line Items] |
|
| Fund Name |
VY<sup style="inset: 1.5px 0px 4px; box-sizing: border-box; color: rgb(0, 0, 0); display: inline; flex-wrap: nowrap; font-size: 9px; font-weight: 400; grid-area: auto; line-height: 0px; margin: 0px; overflow: visible; position: relative; text-align: left; text-align-last: auto; white-space-collapse: preserve-breaks;">®</sup> Morgan Stanley Global Franchise Portfolio
|
| Class Name |
Class ADV
|
| Trading Symbol |
IGFAX
|
| Annual or Semi-Annual Statement [Text Block] |
This annual shareholder report contains important information about VY® Morgan Stanley Global Franchise Portfolio for the period of January 1, 2025 to December 31, 2025.
|
| Shareholder Report Annual or Semi-Annual |
Annual Shareholder Report
|
| Additional Information Phone Number |
1-800-992-0180
|
| Expenses [Text Block] |
What were the Fund’s costs for the last year? (based on a hypothetical $10,000 investment)Class Name | Costs of $10K investment | Costs paid as % of $10K investment |
|---|
Class ADV | $158 | 1.58% |
|---|
|
| Expenses Paid, Amount |
$ 158
|
| Expense Ratio, Percent |
1.58%
|
| Factors Affecting Performance [Text Block] |
How did the Fund perform in the past 12 months?For the year ended December 31, 2025, the Fund underperformed the MSCI World IndexSM. ↑ Top contributors to performance: Largest contributors to absolute performance were cloud hyperscalers, led by Alphabet and Microsofte. Oracle also contributed positively before its third-quarter exit. In Consumer Staples, L’Oréal outperformed on reaccelerating growth, while Visa benefited from resilient consumer spending and cross-border volume growth. ↓ Top detractors from performance: Accenture was the largest absolute detractor, reflecting weak industry growth, U.S. government cost cutting and concerns over profitability, prompting an exit in the fourth quarter. In Health Care, UnitedHealth and Becton Dickinson disappointed and were sold, while Zoetis struggled near term despite solid long-term fundamentals. Constellation Brands detracted before an early-year exit. |
| Line Graph [Table Text Block] |
| Class ADV | MSCI All Country World Index℠ | MSCI World Index℠ |
|---|
2015 | $10,000 | $10,000 | $10,000 |
|---|
2016 | $10,494 | $10,786 | $10,751 |
|---|
2017 | $13,167 | $13,371 | $13,159 |
|---|
2018 | $12,894 | $12,113 | $12,013 |
|---|
2019 | $16,619 | $15,335 | $15,337 |
|---|
2020 | $18,759 | $17,827 | $17,776 |
|---|
2021 | $22,746 | $21,132 | $21,654 |
|---|
2022 | $18,674 | $17,252 | $17,726 |
|---|
2023 | $21,571 | $21,083 | $21,943 |
|---|
2024 | $23,363 | $24,770 | $26,040 |
|---|
2025 | $23,315 | $30,303 | $31,532 |
|---|
|
| Average Annual Return [Table Text Block] |
Fund | 1 Year
| 5 Years
| 10 Years
|
|---|
Class ADV
| -0.20% | 4.44% | 8.83% |
|---|
MSCI All Country World Index℠ | 22.34% | 11.19% | 11.72% |
|---|
MSCI World Index℠ | 21.09% | 12.15% | 12.17% |
|---|
|
| AssetsNet |
$ 82,205,964
|
| Holdings Count | Holding |
33
|
| Advisory Fees Paid, Amount |
$ 2,134,313
|
| InvestmentCompanyPortfolioTurnover |
32.00%
|
| Additional Fund Statistics [Text Block] |
- Total Net Assets$82,205,964
- # of Portfolio Holdings33
- Portfolio Turnover Rate32%
- Investment Advisory Fees Paid$2,134,313
|
| Holdings [Text Block] |
Value | Value |
|---|
Assets in Excess of Other Liabilities | 2.6% | Italy | 2.3% | France | 3.5% | United Kingdom | 4.2% | Germany | 7.4% | United States | 80.0% |
|
| Largest Holdings [Text Block] |
Microsoft Corp. | 8.6% |
|---|
SAP SE | 7.4% |
|---|
Visa, Inc. - Class A | 5.2% |
|---|
Alphabet, Inc. - Class A | 5.0% |
|---|
Coca-Cola Co. | 4.0% |
|---|
RELX PLC - GBP | 3.6% |
|---|
L'Oreal SA | 3.5% |
|---|
Arthur J Gallagher & Co. | 3.5% |
|---|
Intercontinental Exchange, Inc. | 3.5% |
|---|
S&P Global, Inc. | 3.4% |
|---|
|
| Material Fund Change [Text Block] |
|
| C000168690 |
|
| Shareholder Report [Line Items] |
|
| Fund Name |
VY<sup style="inset: 1.5px 0px 4px; box-sizing: border-box; color: rgb(0, 0, 0); display: inline; flex-wrap: nowrap; font-size: 9px; font-weight: 400; grid-area: auto; line-height: 0px; margin: 0px; overflow: visible; position: relative; text-align: left; text-align-last: auto; white-space-collapse: preserve-breaks;">®</sup> Morgan Stanley Global Franchise Portfolio
|
| Class Name |
Class R6
|
| Trading Symbol |
VPRDX
|
| Annual or Semi-Annual Statement [Text Block] |
This annual shareholder report contains important information about VY® Morgan Stanley Global Franchise Portfolio for the period of January 1, 2025 to December 31, 2025.
|
| Shareholder Report Annual or Semi-Annual |
Annual Shareholder Report
|
| Additional Information Phone Number |
1-800-992-0180
|
| Expenses [Text Block] |
What were the Fund’s costs for the last year? (based on a hypothetical $10,000 investment)Class Name | Costs of $10K investment | Costs paid as % of $10K investment |
|---|
Class R6 | $98 | 0.98% |
|---|
|
| Expenses Paid, Amount |
$ 98
|
| Expense Ratio, Percent |
0.98%
|
| Factors Affecting Performance [Text Block] |
How did the Fund perform in the past 12 months?For the year ended December 31, 2025, the Fund underperformed the MSCI World IndexSM. ↑ Top contributors to performance: Largest contributors to absolute performance were cloud hyperscalers, led by Alphabet and Microsofte. Oracle also contributed positively before its third-quarter exit. In Consumer Staples, L’Oréal outperformed on reaccelerating growth, while Visa benefited from resilient consumer spending and cross-border volume growth. ↓ Top detractors from performance: Accenture was the largest absolute detractor, reflecting weak industry growth, U.S. government cost cutting and concerns over profitability, prompting an exit in the fourth quarter. In Health Care, UnitedHealth and Becton Dickinson disappointed and were sold, while Zoetis struggled near term despite solid long-term fundamentals. Constellation Brands detracted before an early-year exit. |
| Line Graph [Table Text Block] |
| Class R6 | MSCI All Country World Index℠ | MSCI World Index℠ |
|---|
5/3/2016 | $10,000 | $10,000 | $10,000 |
|---|
2016 | $10,146 | $10,505 | $10,696 |
|---|
2017 | $12,800 | $13,023 | $13,092 |
|---|
2018 | $12,606 | $11,798 | $11,952 |
|---|
2019 | $16,354 | $14,936 | $15,259 |
|---|
2020 | $18,570 | $17,363 | $17,685 |
|---|
2021 | $22,657 | $20,582 | $21,544 |
|---|
2022 | $18,707 | $16,803 | $17,636 |
|---|
2023 | $21,755 | $20,534 | $21,831 |
|---|
2024 | $23,686 | $24,125 | $25,906 |
|---|
2025 | $23,765 | $29,513 | $31,371 |
|---|
|
| Average Annual Return [Table Text Block] |
Fund | 1 Year
| 5 Years
| Since Inception (5/3/2016)
|
|---|
Class R6 | 0.33% | 5.06% | 9.37% |
|---|
MSCI All Country World Index℠ | 22.34% | 11.19% | 11.98% |
|---|
MSCI World Index℠ | 21.09% | 12.15% | 12.57% |
|---|
|
| AssetsNet |
$ 82,205,964
|
| Holdings Count | Holding |
33
|
| Advisory Fees Paid, Amount |
$ 2,134,313
|
| InvestmentCompanyPortfolioTurnover |
32.00%
|
| Additional Fund Statistics [Text Block] |
- Total Net Assets$82,205,964
- # of Portfolio Holdings33
- Portfolio Turnover Rate32%
- Investment Advisory Fees Paid$2,134,313
|
| Holdings [Text Block] |
Value | Value |
|---|
Assets in Excess of Other Liabilities | 2.6% | Italy | 2.3% | France | 3.5% | United Kingdom | 4.2% | Germany | 7.4% | United States | 80.0% |
|
| Largest Holdings [Text Block] |
Microsoft Corp. | 8.6% |
|---|
SAP SE | 7.4% |
|---|
Visa, Inc. - Class A | 5.2% |
|---|
Alphabet, Inc. - Class A | 5.0% |
|---|
Coca-Cola Co. | 4.0% |
|---|
RELX PLC - GBP | 3.6% |
|---|
L'Oreal SA | 3.5% |
|---|
Arthur J Gallagher & Co. | 3.5% |
|---|
Intercontinental Exchange, Inc. | 3.5% |
|---|
S&P Global, Inc. | 3.4% |
|---|
|
| Material Fund Change [Text Block] |
|
| C000015778 |
|
| Shareholder Report [Line Items] |
|
| Fund Name |
VY<sup style="inset: 1.5px 0px 4px; box-sizing: border-box; color: rgb(0, 0, 0); display: inline; flex-wrap: nowrap; font-size: 9px; font-weight: 400; grid-area: auto; line-height: 0px; margin: 0px; overflow: visible; position: relative; text-align: left; text-align-last: auto; white-space-collapse: preserve-breaks;">®</sup> Morgan Stanley Global Franchise Portfolio
|
| Class Name |
Class S
|
| Trading Symbol |
IVGTX
|
| Annual or Semi-Annual Statement [Text Block] |
This annual shareholder report contains important information about VY® Morgan Stanley Global Franchise Portfolio for the period of January 1, 2025 to December 31, 2025.
|
| Shareholder Report Annual or Semi-Annual |
Annual Shareholder Report
|
| Additional Information Phone Number |
1-800-992-0180
|
| Expenses [Text Block] |
What were the Fund’s costs for the last year? (based on a hypothetical $10,000 investment)Class Name | Costs of $10K investment | Costs paid as % of $10K investment |
|---|
Class S | $122 | 1.22% |
|---|
|
| Expenses Paid, Amount |
$ 122
|
| Expense Ratio, Percent |
1.22%
|
| Factors Affecting Performance [Text Block] |
How did the Fund perform in the past 12 months?For the year ended December 31, 2025, the Fund underperformed the MSCI World IndexSM. ↑ Top contributors to performance: Largest contributors to absolute performance were cloud hyperscalers, led by Alphabet and Microsofte. Oracle also contributed positively before its third-quarter exit. In Consumer Staples, L’Oréal outperformed on reaccelerating growth, while Visa benefited from resilient consumer spending and cross-border volume growth. ↓ Top detractors from performance: Accenture was the largest absolute detractor, reflecting weak industry growth, U.S. government cost cutting and concerns over profitability, prompting an exit in the fourth quarter. In Health Care, UnitedHealth and Becton Dickinson disappointed and were sold, while Zoetis struggled near term despite solid long-term fundamentals. Constellation Brands detracted before an early-year exit. |
| Line Graph [Table Text Block] |
| Class S | MSCI All Country World Index℠ | MSCI World Index℠ |
|---|
2015 | $10,000 | $10,000 | $10,000 |
|---|
2016 | $10,530 | $10,786 | $10,751 |
|---|
2017 | $13,249 | $13,371 | $13,159 |
|---|
2018 | $13,025 | $12,113 | $12,013 |
|---|
2019 | $16,847 | $15,335 | $15,337 |
|---|
2020 | $19,083 | $17,827 | $17,776 |
|---|
2021 | $23,217 | $21,132 | $21,654 |
|---|
2022 | $19,135 | $17,252 | $17,726 |
|---|
2023 | $22,179 | $21,083 | $21,943 |
|---|
2024 | $24,101 | $24,770 | $26,040 |
|---|
2025 | $24,125 | $30,303 | $31,532 |
|---|
|
| Average Annual Return [Table Text Block] |
Fund | 1 Year
| 5 Years
| 10 Years
|
|---|
Class S
| 0.10% | 4.80% | 9.21% |
|---|
MSCI All Country World Index℠ | 22.34% | 11.19% | 11.72% |
|---|
MSCI World Index℠ | 21.09% | 12.15% | 12.17% |
|---|
|
| AssetsNet |
$ 82,205,964
|
| Holdings Count | Holding |
33
|
| Advisory Fees Paid, Amount |
$ 2,134,313
|
| InvestmentCompanyPortfolioTurnover |
32.00%
|
| Additional Fund Statistics [Text Block] |
- Total Net Assets$82,205,964
- # of Portfolio Holdings33
- Portfolio Turnover Rate32%
- Investment Advisory Fees Paid$2,134,313
|
| Holdings [Text Block] |
Value | Value |
|---|
Assets in Excess of Other Liabilities | 2.6% | Italy | 2.3% | France | 3.5% | United Kingdom | 4.2% | Germany | 7.4% | United States | 80.0% |
|
| Largest Holdings [Text Block] |
Microsoft Corp. | 8.6% |
|---|
SAP SE | 7.4% |
|---|
Visa, Inc. - Class A | 5.2% |
|---|
Alphabet, Inc. - Class A | 5.0% |
|---|
Coca-Cola Co. | 4.0% |
|---|
RELX PLC - GBP | 3.6% |
|---|
L'Oreal SA | 3.5% |
|---|
Arthur J Gallagher & Co. | 3.5% |
|---|
Intercontinental Exchange, Inc. | 3.5% |
|---|
S&P Global, Inc. | 3.4% |
|---|
|
| Material Fund Change [Text Block] |
|
| C000015779 |
|
| Shareholder Report [Line Items] |
|
| Fund Name |
VY<sup style="inset: 1.5px 0px 4px; box-sizing: border-box; color: rgb(0, 0, 0); display: inline; flex-wrap: nowrap; font-size: 9px; font-weight: 400; grid-area: auto; line-height: 0px; margin: 0px; overflow: visible; position: relative; text-align: left; text-align-last: auto; white-space-collapse: preserve-breaks;">®</sup> Morgan Stanley Global Franchise Portfolio
|
| Class Name |
Class S2
|
| Trading Symbol |
IGFSX
|
| Annual or Semi-Annual Statement [Text Block] |
This annual shareholder report contains important information about VY® Morgan Stanley Global Franchise Portfolio for the period of January 1, 2025 to December 31, 2025.
|
| Shareholder Report Annual or Semi-Annual |
Annual Shareholder Report
|
| Additional Information Phone Number |
1-800-992-0180
|
| Expenses [Text Block] |
What were the Fund’s costs for the last year? (based on a hypothetical $10,000 investment)Class Name | Costs of $10K investment | Costs paid as % of $10K investment |
|---|
Class S2 | $137 | 1.37% |
|---|
|
| Expenses Paid, Amount |
$ 137
|
| Expense Ratio, Percent |
1.37%
|
| Factors Affecting Performance [Text Block] |
How did the Fund perform in the past 12 months?For the year ended December 31, 2025, the Fund underperformed the MSCI World IndexSM. ↑ Top contributors to performance: Largest contributors to absolute performance were cloud hyperscalers, led by Alphabet and Microsofte. Oracle also contributed positively before its third-quarter exit. In Consumer Staples, L’Oréal outperformed on reaccelerating growth, while Visa benefited from resilient consumer spending and cross-border volume growth. ↓ Top detractors from performance: Accenture was the largest absolute detractor, reflecting weak industry growth, U.S. government cost cutting and concerns over profitability, prompting an exit in the fourth quarter. In Health Care, UnitedHealth and Becton Dickinson disappointed and were sold, while Zoetis struggled near term despite solid long-term fundamentals. Constellation Brands detracted before an early-year exit. |
| Line Graph [Table Text Block] |
| Class S2 | MSCI All Country World Index℠ | MSCI World Index℠ |
|---|
2015 | $10,000 | $10,000 | $10,000 |
|---|
2016 | $10,516 | $10,786 | $10,751 |
|---|
2017 | $13,218 | $13,371 | $13,159 |
|---|
2018 | $12,968 | $12,113 | $12,013 |
|---|
2019 | $16,749 | $15,335 | $15,337 |
|---|
2020 | $18,937 | $17,827 | $17,776 |
|---|
2021 | $23,013 | $21,132 | $21,654 |
|---|
2022 | $18,936 | $17,252 | $17,726 |
|---|
2023 | $21,928 | $21,083 | $21,943 |
|---|
2024 | $23,777 | $24,770 | $26,040 |
|---|
2025 | $23,783 | $30,303 | $31,532 |
|---|
|
| Average Annual Return [Table Text Block] |
Fund | 1 Year
| 5 Years
| 10 Years
|
|---|
Class S2
| 0.02% | 4.66% | 9.05% |
|---|
MSCI All Country World Index℠ | 22.34% | 11.19% | 11.72% |
|---|
MSCI World Index℠ | 21.09% | 12.15% | 12.17% |
|---|
|
| AssetsNet |
$ 82,205,964
|
| Holdings Count | Holding |
33
|
| Advisory Fees Paid, Amount |
$ 2,134,313
|
| InvestmentCompanyPortfolioTurnover |
32.00%
|
| Additional Fund Statistics [Text Block] |
- Total Net Assets$82,205,964
- # of Portfolio Holdings33
- Portfolio Turnover Rate32%
- Investment Advisory Fees Paid$2,134,313
|
| Holdings [Text Block] |
Value | Value |
|---|
Assets in Excess of Other Liabilities | 2.6% | Italy | 2.3% | France | 3.5% | United Kingdom | 4.2% | Germany | 7.4% | United States | 80.0% |
|
| Largest Holdings [Text Block] |
Microsoft Corp. | 8.6% |
|---|
SAP SE | 7.4% |
|---|
Visa, Inc. - Class A | 5.2% |
|---|
Alphabet, Inc. - Class A | 5.0% |
|---|
Coca-Cola Co. | 4.0% |
|---|
RELX PLC - GBP | 3.6% |
|---|
L'Oreal SA | 3.5% |
|---|
Arthur J Gallagher & Co. | 3.5% |
|---|
Intercontinental Exchange, Inc. | 3.5% |
|---|
S&P Global, Inc. | 3.4% |
|---|
|
| Material Fund Change [Text Block] |
|
| C000015823 |
|
| Shareholder Report [Line Items] |
|
| Fund Name |
VY<sup style="inset: 1.5px 0px 4px; box-sizing: border-box; color: rgb(0, 0, 0); display: inline; flex-wrap: nowrap; font-size: 9px; font-weight: 400; grid-area: auto; line-height: 0px; margin: 0px; overflow: visible; position: relative; text-align: left; text-align-last: auto; white-space-collapse: preserve-breaks;">®</sup> T. Rowe Price Capital Appreciation Portfolio
|
| Class Name |
Class ADV
|
| Trading Symbol |
ITRAX
|
| Annual or Semi-Annual Statement [Text Block] |
This annual shareholder report contains important information about VY® T. Rowe Price Capital Appreciation Portfolio for the period of January 1, 2025 to December 31, 2025.
|
| Shareholder Report Annual or Semi-Annual |
Annual Shareholder Report
|
| Additional Information Phone Number |
1-800-992-0180
|
| Expenses [Text Block] |
What were the Fund’s costs for the last year? (based on a hypothetical $10,000 investment)Class Name | Costs of $10K investment | Costs paid as % of $10K investment |
|---|
Class ADV | $132 | 1.25% |
|---|
|
| Expenses Paid, Amount |
$ 132
|
| Expense Ratio, Percent |
1.25%
|
| Factors Affecting Performance [Text Block] |
How did the Fund perform in the past 12 months?For the year ended December 31, 2025, the Fund underperformed the S&P 500® Index primarily due to underperformance within the Fund’s equity allocation. ↑ Top contributors to performance: The leading contributor to relative performance was an underweight allocation to consumer staples, as the sector lagged the broader benchmark. Portfolio positioning in the industrials & business services sector also added value. ↓ Top detractors from performance: Stock selection in health care was the leading detractor from relative results. Within the sector, positions in Becton, Dickinson & Company and Revvity weighed on relative results. Stock selection in the information technology sector also weighed on relative results, driven by positions in Aurora Innovations and Roper. |
| Line Graph [Table Text Block] |
| Class ADV | MSCI All Country World Index℠ | Bloomberg U.S. Aggregate Bond Index | S&P 500® Index | Bloomberg U.S. Government/Credit Index | 60% S&P 500® Index / 40% Bloomberg U.S. Government/Credit Bond Index |
|---|
2015 | $10,000 | $10,000 | $10,000 | $10,000 | $10,000 | $10,000 |
|---|
2016 | $10,765 | $10,786 | $10,265 | $11,196 | $10,305 | $10,848 |
|---|
2017 | $12,349 | $13,371 | $10,628 | $13,640 | $10,717 | $12,411 |
|---|
2018 | $12,363 | $12,113 | $10,629 | $13,043 | $10,672 | $12,098 |
|---|
2019 | $15,328 | $15,335 | $11,556 | $17,150 | $11,708 | $14,838 |
|---|
2020 | $18,016 | $17,827 | $12,424 | $20,305 | $12,754 | $17,108 |
|---|
2021 | $21,255 | $21,132 | $12,233 | $26,135 | $12,531 | $19,804 |
|---|
2022 | $18,604 | $17,252 | $10,641 | $21,402 | $10,829 | $16,635 |
|---|
2023 | $21,983 | $21,083 | $11,230 | $27,028 | $11,449 | $19,589 |
|---|
2024 | $24,645 | $24,770 | $11,370 | $33,790 | $11,583 | $22,530 |
|---|
2025 | $27,508 | $30,303 | $12,200 | $39,832 | $12,380 | $25,576 |
|---|
|
| Average Annual Return [Table Text Block] |
Fund | 1 Year
| 5 Years
| 10 Years
|
|---|
Class ADV
| 11.62% | 8.83% | 10.65% |
|---|
MSCI All Country World Index℠ | 22.34% | 11.19% | 11.72% |
|---|
Bloomberg U.S. Aggregate Bond Index | 7.30% | -0.36% | 2.01% |
|---|
S&P 500® Index | 17.88% | 14.42% | 14.82% |
|---|
Bloomberg U.S. Government/Credit Index | 6.88% | -0.59% | 2.16% |
|---|
60% S&P 500® Index / 40% Bloomberg U.S. Government/Credit Bond Index | 13.52% | 8.37% | 9.85% |
|---|
|
| AssetsNet |
$ 6,986,211,733
|
| Holdings Count | Holding |
207
|
| Advisory Fees Paid, Amount |
$ 43,549,289
|
| InvestmentCompanyPortfolioTurnover |
131.00%
|
| Additional Fund Statistics [Text Block] |
- Total Net Assets$6,986,211,733
- # of Portfolio Holdings207
- Portfolio Turnover Rate131%
- Investment Advisory Fees Paid$43,549,289
|
| Holdings [Text Block] |
Investment Type AllocationValue | Value |
|---|
Assets in Excess of Other Liabilities | 2.5% | Asset-Backed Securities | 0.1% | Preferred Stock | 1.0% | Corporate Bonds/Notes | 7.4% | Bank Loans | 9.6% | U.S. Treasury Obligations | 16.2% | Common Stock | 63.2% |
|
| Largest Holdings [Text Block] |
Microsoft Corp. | 4.6% |
|---|
NVIDIA Corp. | 4.4% |
|---|
Apple, Inc. | 4.0% |
|---|
Alphabet, Inc. - Class A | 3.9% |
|---|
Amazon.com, Inc. | 3.6% |
|---|
United States Treasury Notes, 3.625%, 10/31/30 | 3.5% |
|---|
United States Treasury Notes, 3.500%, 11/30/30 | 3.3% |
|---|
United States Treasury Notes, 3.875%, 07/31/30 | 3.2% |
|---|
Becton Dickinson and Co. | 2.5% |
|---|
Revvity, Inc. | 2.0% |
|---|
|
| Material Fund Change [Text Block] |
|
| C000015824 |
|
| Shareholder Report [Line Items] |
|
| Fund Name |
VY<sup style="inset: 1.5px 0px 4px; box-sizing: border-box; color: rgb(0, 0, 0); display: inline; flex-wrap: nowrap; font-size: 9px; font-weight: 400; grid-area: auto; line-height: 0px; margin: 0px; overflow: visible; position: relative; text-align: left; text-align-last: auto; white-space-collapse: preserve-breaks;">®</sup> T. Rowe Price Capital Appreciation Portfolio
|
| Class Name |
Class I
|
| Trading Symbol |
ITRIX
|
| Annual or Semi-Annual Statement [Text Block] |
This annual shareholder report contains important information about VY® T. Rowe Price Capital Appreciation Portfolio for the period of January 1, 2025 to December 31, 2025.
|
| Shareholder Report Annual or Semi-Annual |
Annual Shareholder Report
|
| Additional Information Phone Number |
1-800-992-0180
|
| Expenses [Text Block] |
What were the Fund’s costs for the last year? (based on a hypothetical $10,000 investment)Class Name | Costs of $10K investment | Costs paid as % of $10K investment |
|---|
Class I | $69 | 0.65% |
|---|
|
| Expenses Paid, Amount |
$ 69
|
| Expense Ratio, Percent |
0.65%
|
| Factors Affecting Performance [Text Block] |
How did the Fund perform in the past 12 months?For the year ended December 31, 2025, the Fund underperformed the S&P 500® Index primarily due to underperformance within the Fund’s equity allocation. ↑ Top contributors to performance: The leading contributor to relative performance was an underweight allocation to consumer staples, as the sector lagged the broader benchmark. Portfolio positioning in the industrials & business services sector also added value. ↓ Top detractors from performance: Stock selection in health care was the leading detractor from relative results. Within the sector, positions in Becton, Dickinson & Company and Revvity weighed on relative results. Stock selection in the information technology sector also weighed on relative results, driven by positions in Aurora Innovations and Roper. |
| Line Graph [Table Text Block] |
| Class I | MSCI All Country World Index℠ | Bloomberg U.S. Aggregate Bond Index | S&P 500® Index | Bloomberg U.S. Government/Credit Index | 60% S&P 500® Index / 40% Bloomberg U.S. Government/Credit Bond Index |
|---|
2015 | $10,000 | $10,000 | $10,000 | $10,000 | $10,000 | $10,000 |
|---|
2016 | $10,831 | $10,786 | $10,265 | $11,196 | $10,305 | $10,848 |
|---|
2017 | $12,498 | $13,371 | $10,628 | $13,640 | $10,717 | $12,411 |
|---|
2018 | $12,590 | $12,113 | $10,629 | $13,043 | $10,672 | $12,098 |
|---|
2019 | $15,700 | $15,335 | $11,556 | $17,150 | $11,708 | $14,838 |
|---|
2020 | $18,570 | $17,827 | $12,424 | $20,305 | $12,754 | $17,108 |
|---|
2021 | $22,037 | $21,132 | $12,233 | $26,135 | $12,531 | $19,804 |
|---|
2022 | $19,401 | $17,252 | $10,641 | $21,402 | $10,829 | $16,635 |
|---|
2023 | $23,072 | $21,083 | $11,230 | $27,028 | $11,449 | $19,589 |
|---|
2024 | $26,012 | $24,770 | $11,370 | $33,790 | $11,583 | $22,530 |
|---|
2025 | $29,217 | $30,303 | $12,200 | $39,832 | $12,380 | $25,576 |
|---|
|
| Average Annual Return [Table Text Block] |
Fund | 1 Year
| 5 Years
| 10 Years
|
|---|
Class I
| 12.32% | 9.49% | 11.32% |
|---|
MSCI All Country World Index℠ | 22.34% | 11.19% | 11.72% |
|---|
Bloomberg U.S. Aggregate Bond Index | 7.30% | -0.36% | 2.01% |
|---|
S&P 500® Index | 17.88% | 14.42% | 14.82% |
|---|
Bloomberg U.S. Government/Credit Index | 6.88% | -0.59% | 2.16% |
|---|
60% S&P 500® Index / 40% Bloomberg U.S. Government/Credit Bond Index | 13.52% | 8.37% | 9.85% |
|---|
|
| AssetsNet |
$ 6,986,211,733
|
| Holdings Count | Holding |
207
|
| Advisory Fees Paid, Amount |
$ 43,549,289
|
| InvestmentCompanyPortfolioTurnover |
131.00%
|
| Additional Fund Statistics [Text Block] |
- Total Net Assets$6,986,211,733
- # of Portfolio Holdings207
- Portfolio Turnover Rate131%
- Investment Advisory Fees Paid$43,549,289
|
| Holdings [Text Block] |
Investment Type AllocationValue | Value |
|---|
Assets in Excess of Other Liabilities | 2.5% | Asset-Backed Securities | 0.1% | Preferred Stock | 1.0% | Corporate Bonds/Notes | 7.4% | Bank Loans | 9.6% | U.S. Treasury Obligations | 16.2% | Common Stock | 63.2% |
|
| Largest Holdings [Text Block] |
Microsoft Corp. | 4.6% |
|---|
NVIDIA Corp. | 4.4% |
|---|
Apple, Inc. | 4.0% |
|---|
Alphabet, Inc. - Class A | 3.9% |
|---|
Amazon.com, Inc. | 3.6% |
|---|
United States Treasury Notes, 3.625%, 10/31/30 | 3.5% |
|---|
United States Treasury Notes, 3.500%, 11/30/30 | 3.3% |
|---|
United States Treasury Notes, 3.875%, 07/31/30 | 3.2% |
|---|
Becton Dickinson and Co. | 2.5% |
|---|
Revvity, Inc. | 2.0% |
|---|
|
| Material Fund Change [Text Block] |
|
| C000168694 |
|
| Shareholder Report [Line Items] |
|
| Fund Name |
VY<sup style="inset: 1.5px 0px 4px; box-sizing: border-box; color: rgb(0, 0, 0); display: inline; flex-wrap: nowrap; font-size: 9px; font-weight: 400; grid-area: auto; line-height: 0px; margin: 0px; overflow: visible; position: relative; text-align: left; text-align-last: auto; white-space-collapse: preserve-breaks;">®</sup> T. Rowe Price Capital Appreciation Portfolio
|
| Class Name |
Class R6
|
| Trading Symbol |
VPRAX
|
| Annual or Semi-Annual Statement [Text Block] |
This annual shareholder report contains important information about VY® T. Rowe Price Capital Appreciation Portfolio for the period of January 1, 2025 to December 31, 2025.
|
| Shareholder Report Annual or Semi-Annual |
Annual Shareholder Report
|
| Additional Information Phone Number |
1-800-992-0180
|
| Expenses [Text Block] |
What were the Fund’s costs for the last year? (based on a hypothetical $10,000 investment)Class Name | Costs of $10K investment | Costs paid as % of $10K investment |
|---|
Class R6 | $69 | 0.65% |
|---|
|
| Expenses Paid, Amount |
$ 69
|
| Expense Ratio, Percent |
0.65%
|
| Factors Affecting Performance [Text Block] |
How did the Fund perform in the past 12 months?For the year ended December 31, 2025, the Fund underperformed the S&P 500® Index primarily due to underperformance within the Fund’s equity allocation. ↑ Top contributors to performance: The leading contributor to relative performance was an underweight allocation to consumer staples, as the sector lagged the broader benchmark. Portfolio positioning in the industrials & business services sector also added value. ↓ Top detractors from performance: Stock selection in health care was the leading detractor from relative results. Within the sector, positions in Becton, Dickinson & Company and Revvity weighed on relative results. Stock selection in the information technology sector also weighed on relative results, driven by positions in Aurora Innovations and Roper. |
| Line Graph [Table Text Block] |
| Class R6 | MSCI All Country World Index℠ | Bloomberg U.S. Aggregate Bond Index | S&P 500® Index | Bloomberg U.S. Government/Credit Index | 60% S&P 500 Index / 40% Bloomberg U.S. Government/Credit Bond Index |
|---|
5/3/2016 | $10,000 | $10,000 | $10,000 | $10,000 | $10,000 | $10,000 |
|---|
2016 | $10,478 | $10,505 | $9,918 | $11,014 | $9,905 | $10,565 |
|---|
2017 | $12,098 | $13,023 | $10,269 | $13,418 | $10,301 | $12,087 |
|---|
2018 | $12,183 | $11,798 | $10,270 | $12,831 | $10,258 | $11,783 |
|---|
2019 | $15,197 | $14,936 | $11,166 | $16,871 | $11,254 | $14,450 |
|---|
2020 | $17,973 | $17,363 | $12,004 | $19,975 | $12,259 | $16,661 |
|---|
2021 | $21,326 | $20,582 | $11,819 | $25,710 | $12,044 | $19,287 |
|---|
2022 | $18,777 | $16,803 | $10,282 | $21,054 | $10,409 | $16,201 |
|---|
2023 | $22,327 | $20,534 | $10,850 | $26,589 | $11,004 | $19,078 |
|---|
2024 | $25,179 | $24,125 | $10,986 | $33,241 | $11,134 | $21,942 |
|---|
2025 | $28,277 | $29,513 | $11,788 | $39,185 | $11,899 | $24,909 |
|---|
|
| Average Annual Return [Table Text Block] |
Fund | 1 Year
| 5 Years
| Since Inception (5/3/2016)
|
|---|
Class R6 | 12.31% | 9.49% | 11.36% |
|---|
MSCI All Country World Index℠ | 22.34% | 11.19% | 11.98% |
|---|
Bloomberg U.S. Aggregate Bond Index | 7.30% | -0.36% | 1.72% |
|---|
S&P 500® Index | 17.88% | 14.42% | 15.19% |
|---|
Bloomberg U.S. Government/Credit Index | 6.88% | -0.59% | 1.82% |
|---|
60% S&P 500 Index / 40% Bloomberg U.S. Government/Credit Bond Index | 13.52% | 8.37% | 9.91% |
|---|
|
| AssetsNet |
$ 6,986,211,733
|
| Holdings Count | Holding |
207
|
| Advisory Fees Paid, Amount |
$ 43,549,289
|
| InvestmentCompanyPortfolioTurnover |
131.00%
|
| Additional Fund Statistics [Text Block] |
- Total Net Assets$6,986,211,733
- # of Portfolio Holdings207
- Portfolio Turnover Rate131%
- Investment Advisory Fees Paid$43,549,289
|
| Holdings [Text Block] |
Investment Type AllocationValue | Value |
|---|
Assets in Excess of Other Liabilities | 2.5% | Asset-Backed Securities | 0.1% | Preferred Stock | 1.0% | Corporate Bonds/Notes | 7.4% | Bank Loans | 9.6% | U.S. Treasury Obligations | 16.2% | Common Stock | 63.2% |
|
| Largest Holdings [Text Block] |
Microsoft Corp. | 4.6% |
|---|
NVIDIA Corp. | 4.4% |
|---|
Apple, Inc. | 4.0% |
|---|
Alphabet, Inc. - Class A | 3.9% |
|---|
Amazon.com, Inc. | 3.6% |
|---|
United States Treasury Notes, 3.625%, 10/31/30 | 3.5% |
|---|
United States Treasury Notes, 3.500%, 11/30/30 | 3.3% |
|---|
United States Treasury Notes, 3.875%, 07/31/30 | 3.2% |
|---|
Becton Dickinson and Co. | 2.5% |
|---|
Revvity, Inc. | 2.0% |
|---|
|
| Material Fund Change [Text Block] |
|
| C000015825 |
|
| Shareholder Report [Line Items] |
|
| Fund Name |
VY<sup style="inset: 1.5px 0px 4px; box-sizing: border-box; color: rgb(0, 0, 0); display: inline; flex-wrap: nowrap; font-size: 9px; font-weight: 400; grid-area: auto; line-height: 0px; margin: 0px; overflow: visible; position: relative; text-align: left; text-align-last: auto; white-space-collapse: preserve-breaks;">®</sup> T. Rowe Price Capital Appreciation Portfolio
|
| Class Name |
Class S
|
| Trading Symbol |
ITCSX
|
| Annual or Semi-Annual Statement [Text Block] |
This annual shareholder report contains important information about VY® T. Rowe Price Capital Appreciation Portfolio for the period of January 1, 2025 to December 31, 2025.
|
| Shareholder Report Annual or Semi-Annual |
Annual Shareholder Report
|
| Additional Information Phone Number |
1-800-992-0180
|
| Expenses [Text Block] |
What were the Fund’s costs for the last year? (based on a hypothetical $10,000 investment)Class Name | Costs of $10K investment | Costs paid as % of $10K investment |
|---|
Class S | $95 | 0.90% |
|---|
|
| Expenses Paid, Amount |
$ 95
|
| Expense Ratio, Percent |
0.90%
|
| Factors Affecting Performance [Text Block] |
How did the Fund perform in the past 12 months?For the year ended December 31, 2025, the Fund underperformed the S&P 500® Index primarily due to underperformance within the Fund’s equity allocation. ↑ Top contributors to performance: The leading contributor to relative performance was an underweight allocation to consumer staples, as the sector lagged the broader benchmark. Portfolio positioning in the industrials & business services sector also added value. ↓ Top detractors from performance: Stock selection in health care was the leading detractor from relative results. Within the sector, positions in Becton, Dickinson & Company and Revvity weighed on relative results. Stock selection in the information technology sector also weighed on relative results, driven by positions in Aurora Innovations and Roper. |
| Line Graph [Table Text Block] |
| Class S | MSCI All Country World Index℠ | Bloomberg U.S. Aggregate Bond Index | S&P 500® Index | Bloomberg U.S. Government/Credit Index | 60% S&P 500® Index / 40% Bloomberg U.S. Government/Credit Bond Index |
|---|
2015 | $10,000 | $10,000 | $10,000 | $10,000 | $10,000 | $10,000 |
|---|
2016 | $10,805 | $10,786 | $10,265 | $11,196 | $10,305 | $10,848 |
|---|
2017 | $12,436 | $13,371 | $10,628 | $13,640 | $10,717 | $12,411 |
|---|
2018 | $12,500 | $12,113 | $10,629 | $13,043 | $10,672 | $12,098 |
|---|
2019 | $15,544 | $15,335 | $11,556 | $17,150 | $11,708 | $14,838 |
|---|
2020 | $18,338 | $17,827 | $12,424 | $20,305 | $12,754 | $17,108 |
|---|
2021 | $21,713 | $21,132 | $12,233 | $26,135 | $12,531 | $19,804 |
|---|
2022 | $19,068 | $17,252 | $10,641 | $21,402 | $10,829 | $16,635 |
|---|
2023 | $22,614 | $21,083 | $11,230 | $27,028 | $11,449 | $19,589 |
|---|
2024 | $25,438 | $24,770 | $11,370 | $33,790 | $11,583 | $22,530 |
|---|
2025 | $28,497 | $30,303 | $12,200 | $39,832 | $12,380 | $25,576 |
|---|
|
| Average Annual Return [Table Text Block] |
Fund | 1 Year
| 5 Years
| 10 Years
|
|---|
Class S
| 12.02% | 9.22% | 11.04% |
|---|
MSCI All Country World Index℠ | 22.34% | 11.19% | 11.72% |
|---|
Bloomberg U.S. Aggregate Bond Index | 7.30% | -0.36% | 2.01% |
|---|
S&P 500® Index | 17.88% | 14.42% | 14.82% |
|---|
Bloomberg U.S. Government/Credit Index | 6.88% | -0.59% | 2.16% |
|---|
60% S&P 500® Index / 40% Bloomberg U.S. Government/Credit Bond Index | 13.52% | 8.37% | 9.85% |
|---|
|
| AssetsNet |
$ 6,986,211,733
|
| Holdings Count | Holding |
207
|
| Advisory Fees Paid, Amount |
$ 43,549,289
|
| InvestmentCompanyPortfolioTurnover |
131.00%
|
| Additional Fund Statistics [Text Block] |
- Total Net Assets$6,986,211,733
- # of Portfolio Holdings207
- Portfolio Turnover Rate131%
- Investment Advisory Fees Paid$43,549,289
|
| Holdings [Text Block] |
Investment Type AllocationValue | Value |
|---|
Assets in Excess of Other Liabilities | 2.5% | Asset-Backed Securities | 0.1% | Preferred Stock | 1.0% | Corporate Bonds/Notes | 7.4% | Bank Loans | 9.6% | U.S. Treasury Obligations | 16.2% | Common Stock | 63.2% |
|
| Largest Holdings [Text Block] |
Microsoft Corp. | 4.6% |
|---|
NVIDIA Corp. | 4.4% |
|---|
Apple, Inc. | 4.0% |
|---|
Alphabet, Inc. - Class A | 3.9% |
|---|
Amazon.com, Inc. | 3.6% |
|---|
United States Treasury Notes, 3.625%, 10/31/30 | 3.5% |
|---|
United States Treasury Notes, 3.500%, 11/30/30 | 3.3% |
|---|
United States Treasury Notes, 3.875%, 07/31/30 | 3.2% |
|---|
Becton Dickinson and Co. | 2.5% |
|---|
Revvity, Inc. | 2.0% |
|---|
|
| Material Fund Change [Text Block] |
|
| C000015826 |
|
| Shareholder Report [Line Items] |
|
| Fund Name |
VY<sup style="inset: 1.5px 0px 4px; box-sizing: border-box; color: rgb(0, 0, 0); display: inline; flex-wrap: nowrap; font-size: 9px; font-weight: 400; grid-area: auto; line-height: 0px; margin: 0px; overflow: visible; position: relative; text-align: left; text-align-last: auto; white-space-collapse: preserve-breaks;">®</sup> T. Rowe Price Capital Appreciation Portfolio
|
| Class Name |
Class S2
|
| Trading Symbol |
ITCTX
|
| Annual or Semi-Annual Statement [Text Block] |
This annual shareholder report contains important information about VY® T. Rowe Price Capital Appreciation Portfolio for the period of January 1, 2025 to December 31, 2025.
|
| Shareholder Report Annual or Semi-Annual |
Annual Shareholder Report
|
| Additional Information Phone Number |
1-800-992-0180
|
| Expenses [Text Block] |
What were the Fund’s costs for the last year? (based on a hypothetical $10,000 investment)Class Name | Costs of $10K investment | Costs paid as % of $10K investment |
|---|
Class S2 | $111 | 1.05% |
|---|
|
| Expenses Paid, Amount |
$ 111
|
| Expense Ratio, Percent |
1.05%
|
| Factors Affecting Performance [Text Block] |
How did the Fund perform in the past 12 months?For the year ended December 31, 2025, the Fund underperformed the S&P 500® Index primarily due to underperformance within the Fund’s equity allocation. ↑ Top contributors to performance: The leading contributor to relative performance was an underweight allocation to consumer staples, as the sector lagged the broader benchmark. Portfolio positioning in the industrials & business services sector also added value. ↓ Top detractors from performance: Stock selection in health care was the leading detractor from relative results. Within the sector, positions in Becton, Dickinson & Company and Revvity weighed on relative results. Stock selection in the information technology sector also weighed on relative results, driven by positions in Aurora Innovations and Roper. |
| Line Graph [Table Text Block] |
| Class S2 | MSCI All Country World Index℠ | Bloomberg U.S. Aggregate Bond Index | S&P 500® Index | Bloomberg U.S. Government/Credit Index | 60% S&P 500® Index / 40% Bloomberg U.S. Government/Credit Bond Index |
|---|
2015 | $10,000 | $10,000 | $10,000 | $10,000 | $10,000 | $10,000 |
|---|
2016 | $10,786 | $10,786 | $10,265 | $11,196 | $10,305 | $10,848 |
|---|
2017 | $12,399 | $13,371 | $10,628 | $13,640 | $10,717 | $12,411 |
|---|
2018 | $12,440 | $12,113 | $10,629 | $13,043 | $10,672 | $12,098 |
|---|
2019 | $15,449 | $15,335 | $11,556 | $17,150 | $11,708 | $14,838 |
|---|
2020 | $18,201 | $17,827 | $12,424 | $20,305 | $12,754 | $17,108 |
|---|
2021 | $21,513 | $21,132 | $12,233 | $26,135 | $12,531 | $19,804 |
|---|
2022 | $18,868 | $17,252 | $10,641 | $21,402 | $10,829 | $16,635 |
|---|
2023 | $22,343 | $21,083 | $11,230 | $27,028 | $11,449 | $19,589 |
|---|
2024 | $25,088 | $24,770 | $11,370 | $33,790 | $11,583 | $22,530 |
|---|
2025 | $28,056 | $30,303 | $12,200 | $39,832 | $12,380 | $25,576 |
|---|
|
| Average Annual Return [Table Text Block] |
Fund | 1 Year
| 5 Years
| 10 Years
|
|---|
Class S2
| 11.83% | 9.04% | 10.87% |
|---|
MSCI All Country World Index℠ | 22.34% | 11.19% | 11.72% |
|---|
Bloomberg U.S. Aggregate Bond Index | 7.30% | -0.36% | 2.01% |
|---|
S&P 500® Index | 17.88% | 14.42% | 14.82% |
|---|
Bloomberg U.S. Government/Credit Index | 6.88% | -0.59% | 2.16% |
|---|
60% S&P 500® Index / 40% Bloomberg U.S. Government/Credit Bond Index | 13.52% | 8.37% | 9.85% |
|---|
|
| AssetsNet |
$ 6,986,211,733
|
| Holdings Count | Holding |
207
|
| Advisory Fees Paid, Amount |
$ 43,549,289
|
| InvestmentCompanyPortfolioTurnover |
131.00%
|
| Additional Fund Statistics [Text Block] |
- Total Net Assets$6,986,211,733
- # of Portfolio Holdings207
- Portfolio Turnover Rate131%
- Investment Advisory Fees Paid$43,549,289
|
| Holdings [Text Block] |
Investment Type AllocationValue | Value |
|---|
Assets in Excess of Other Liabilities | 2.5% | Asset-Backed Securities | 0.1% | Preferred Stock | 1.0% | Corporate Bonds/Notes | 7.4% | Bank Loans | 9.6% | U.S. Treasury Obligations | 16.2% | Common Stock | 63.2% |
|
| Largest Holdings [Text Block] |
Microsoft Corp. | 4.6% |
|---|
NVIDIA Corp. | 4.4% |
|---|
Apple, Inc. | 4.0% |
|---|
Alphabet, Inc. - Class A | 3.9% |
|---|
Amazon.com, Inc. | 3.6% |
|---|
United States Treasury Notes, 3.625%, 10/31/30 | 3.5% |
|---|
United States Treasury Notes, 3.500%, 11/30/30 | 3.3% |
|---|
United States Treasury Notes, 3.875%, 07/31/30 | 3.2% |
|---|
Becton Dickinson and Co. | 2.5% |
|---|
Revvity, Inc. | 2.0% |
|---|
|
| Material Fund Change [Text Block] |
|
| C000015827 |
|
| Shareholder Report [Line Items] |
|
| Fund Name |
VY<sup style="inset: 1.5px 0px 4px; box-sizing: border-box; color: rgb(0, 0, 0); display: inline; flex-wrap: nowrap; font-size: 9px; font-weight: 400; grid-area: auto; line-height: 0px; margin: 0px; overflow: visible; position: relative; text-align: left; text-align-last: auto; white-space-collapse: preserve-breaks;">®</sup> T. Rowe Price Equity Income Portfolio
|
| Class Name |
Class ADV
|
| Trading Symbol |
ITEAX
|
| Annual or Semi-Annual Statement [Text Block] |
This annual shareholder report contains important information about VY® T. Rowe Price Equity Income Portfolio for the period of January 1, 2025 to December 31, 2025.
|
| Shareholder Report Annual or Semi-Annual |
Annual Shareholder Report
|
| Additional Information Phone Number |
1-800-992-0180
|
| Expenses [Text Block] |
What were the Fund’s costs for the last year? (based on a hypothetical $10,000 investment)Class Name | Costs of $10K investment | Costs paid as % of $10K investment |
|---|
Class ADV | $134 | 1.25% |
|---|
|
| Expenses Paid, Amount |
$ 134
|
| Expense Ratio, Percent |
1.25%
|
| Factors Affecting Performance [Text Block] |
How did the Fund perform in the past 12 months?For the year ended December 31, 2025, the Fund underperformed the Russell 1000® Value primarily due to unfavorable sector allocation and stock selection. ↑ Top contributors to performance: Stock selection in the industrials & business services sector contributed the most to relative performance. An underweight allocation & stock selection in the consumer discretionary sector also supported relative results. Individual holdings that contributed to relative performance included Samsung Electronics, GE Aerospace, Citigroup, & L3Harris Technologies. ↓ Top detractors from performance: Stock selection in the materials sector detracted the most from relative performance. Security choices in the consumer staples sector also hampered relative results. Individual holdings that detracted from relative performance included Fiserv, Johnson & Johnson, and JPMorgan Chase. A zero-weight allocation to Micron Technology was also a significant relative detractor. |
| Line Graph [Table Text Block] |
| Class ADV | Russell 3000® Index | S&P 500® Index | Russell 1000® Value Index |
|---|
2015 | $10,000 | $10,000 | $10,000 | $10,000 |
|---|
2016 | $11,830 | $11,274 | $11,196 | $11,734 |
|---|
2017 | $13,709 | $13,656 | $13,640 | $13,337 |
|---|
2018 | $12,381 | $12,941 | $13,043 | $12,234 |
|---|
2019 | $15,591 | $16,955 | $17,150 | $15,481 |
|---|
2020 | $15,691 | $20,497 | $20,305 | $15,914 |
|---|
2021 | $19,609 | $25,756 | $26,135 | $19,918 |
|---|
2022 | $18,855 | $20,808 | $21,402 | $18,416 |
|---|
2023 | $20,540 | $26,210 | $27,028 | $20,527 |
|---|
2024 | $22,827 | $32,449 | $33,790 | $23,477 |
|---|
2025 | $25,978 | $38,013 | $39,832 | $27,211 |
|---|
|
| Average Annual Return [Table Text Block] |
Fund | 1 Year
| 5 Years
| 10 Years
|
|---|
Class ADV
| 13.80% | 10.61% | 10.02% |
|---|
Russell 3000® Index | 17.15% | 13.15% | 14.29% |
|---|
S&P 500® Index | 17.88% | 14.42% | 14.82% |
|---|
Russell 1000® Value Index | 15.91% | 11.33% | 10.53% |
|---|
|
| AssetsNet |
$ 288,365,638
|
| Holdings Count | Holding |
125
|
| Advisory Fees Paid, Amount |
$ 1,763,057
|
| InvestmentCompanyPortfolioTurnover |
24.00%
|
| Additional Fund Statistics [Text Block] |
- Total Net Assets$288,365,638
- # of Portfolio Holdings125
- Portfolio Turnover Rate24%
- Investment Advisory Fees Paid$1,763,057
|
| Holdings [Text Block] |
Value | Value |
|---|
Assets in Excess of Other Liabilities | 0.6% | Short-Term Investments | 0.4% | Preferred Stock | 0.8% | Common Stock | 98.2% |
Value | Value |
|---|
Financials | 22.6% | Industrials | 14.2% | Health Care | 13.5% | Information Technology | 10.1% | Energy | 8.3% | Communication Services | 6.8% | Consumer Staples | 6.8% | Utilities | 6.1% | Consumer Discretionary | 4.2% | Real Estate | 3.5% | Materials | 2.9% | Short-Term Investments | 0.4% | Assets in Excess of Other Liabilities | 0.6% |
|
| Largest Holdings [Text Block] |
Qualcomm, Inc. | 2.0% |
|---|
Citigroup, Inc. | 2.0% |
|---|
MetLife, Inc. | 2.0% |
|---|
Alphabet, Inc. - Class A | 2.0% |
|---|
Southern Co. | 1.9% |
|---|
JPMorgan Chase & Co. | 1.9% |
|---|
Charles Schwab Corp. | 1.9% |
|---|
Bank of America Corp. | 1.7% |
|---|
TotalEnergies SE | 1.6% |
|---|
L3Harris Technologies, Inc. | 1.6% |
|---|
|
| Material Fund Change [Text Block] |
|
| C000015828 |
|
| Shareholder Report [Line Items] |
|
| Fund Name |
VY<sup style="inset: 1.5px 0px 4px; box-sizing: border-box; color: rgb(0, 0, 0); display: inline; flex-wrap: nowrap; font-size: 9px; font-weight: 400; grid-area: auto; line-height: 0px; margin: 0px; overflow: visible; position: relative; text-align: left; text-align-last: auto; white-space-collapse: preserve-breaks;">®</sup> T. Rowe Price Equity Income Portfolio
|
| Class Name |
Class I
|
| Trading Symbol |
ITEIX
|
| Annual or Semi-Annual Statement [Text Block] |
This annual shareholder report contains important information about VY® T. Rowe Price Equity Income Portfolio for the period of January 1, 2025 to December 31, 2025.
|
| Shareholder Report Annual or Semi-Annual |
Annual Shareholder Report
|
| Additional Information Phone Number |
1-800-992-0180
|
| Expenses [Text Block] |
What were the Fund’s costs for the last year? (based on a hypothetical $10,000 investment)Class Name | Costs of $10K investment | Costs paid as % of $10K investment |
|---|
Class I | $70 | 0.65% |
|---|
|
| Expenses Paid, Amount |
$ 70
|
| Expense Ratio, Percent |
0.65%
|
| Factors Affecting Performance [Text Block] |
How did the Fund perform in the past 12 months?For the year ended December 31, 2025, the Fund underperformed the Russell 1000® Value primarily due to unfavorable sector allocation and stock selection. ↑ Top contributors to performance: Stock selection in the industrials & business services sector contributed the most to relative performance. An underweight allocation & stock selection in the consumer discretionary sector also supported relative results. Individual holdings that contributed to relative performance included Samsung Electronics, GE Aerospace, Citigroup, & L3Harris Technologies. ↓ Top detractors from performance: Stock selection in the materials sector detracted the most from relative performance. Security choices in the consumer staples sector also hampered relative results. Individual holdings that detracted from relative performance included Fiserv, Johnson & Johnson, and JPMorgan Chase. A zero-weight allocation to Micron Technology was also a significant relative detractor. |
| Line Graph [Table Text Block] |
| Class I | Russell 3000® Index | S&P 500® Index | Russell 1000® Value Index |
|---|
2015 | $10,000 | $10,000 | $10,000 | $10,000 |
|---|
2016 | $11,907 | $11,274 | $11,196 | $11,734 |
|---|
2017 | $13,869 | $13,656 | $13,640 | $13,337 |
|---|
2018 | $12,608 | $12,941 | $13,043 | $12,234 |
|---|
2019 | $15,969 | $16,955 | $17,150 | $15,481 |
|---|
2020 | $16,173 | $20,497 | $20,305 | $15,914 |
|---|
2021 | $20,322 | $25,756 | $26,135 | $19,918 |
|---|
2022 | $19,669 | $20,808 | $21,402 | $18,416 |
|---|
2023 | $21,551 | $26,210 | $27,028 | $20,527 |
|---|
2024 | $24,084 | $32,449 | $33,790 | $23,477 |
|---|
2025 | $27,592 | $38,013 | $39,832 | $27,211 |
|---|
|
| Average Annual Return [Table Text Block] |
Fund | 1 Year
| 5 Years
| 10 Years
|
|---|
Class I
| 14.57% | 11.28% | 10.68% |
|---|
Russell 3000® Index | 17.15% | 13.15% | 14.29% |
|---|
S&P 500® Index | 17.88% | 14.42% | 14.82% |
|---|
Russell 1000® Value Index | 15.91% | 11.33% | 10.53% |
|---|
|
| AssetsNet |
$ 288,365,638
|
| Holdings Count | Holding |
125
|
| Advisory Fees Paid, Amount |
$ 1,763,057
|
| InvestmentCompanyPortfolioTurnover |
24.00%
|
| Additional Fund Statistics [Text Block] |
- Total Net Assets$288,365,638
- # of Portfolio Holdings125
- Portfolio Turnover Rate24%
- Investment Advisory Fees Paid$1,763,057
|
| Holdings [Text Block] |
Value | Value |
|---|
Assets in Excess of Other Liabilities | 0.6% | Short-Term Investments | 0.4% | Preferred Stock | 0.8% | Common Stock | 98.2% |
Value | Value |
|---|
Financials | 22.6% | Industrials | 14.2% | Health Care | 13.5% | Information Technology | 10.1% | Energy | 8.3% | Communication Services | 6.8% | Consumer Staples | 6.8% | Utilities | 6.1% | Consumer Discretionary | 4.2% | Real Estate | 3.5% | Materials | 2.9% | Short-Term Investments | 0.4% | Assets in Excess of Other Liabilities | 0.6% |
|
| Largest Holdings [Text Block] |
Qualcomm, Inc. | 2.0% |
|---|
Citigroup, Inc. | 2.0% |
|---|
MetLife, Inc. | 2.0% |
|---|
Alphabet, Inc. - Class A | 2.0% |
|---|
Southern Co. | 1.9% |
|---|
JPMorgan Chase & Co. | 1.9% |
|---|
Charles Schwab Corp. | 1.9% |
|---|
Bank of America Corp. | 1.7% |
|---|
TotalEnergies SE | 1.6% |
|---|
L3Harris Technologies, Inc. | 1.6% |
|---|
|
| Material Fund Change [Text Block] |
|
| C000015829 |
|
| Shareholder Report [Line Items] |
|
| Fund Name |
VY<sup style="inset: 1.5px 0px 4px; box-sizing: border-box; color: rgb(0, 0, 0); display: inline; flex-wrap: nowrap; font-size: 9px; font-weight: 400; grid-area: auto; line-height: 0px; margin: 0px; overflow: visible; position: relative; text-align: left; text-align-last: auto; white-space-collapse: preserve-breaks;">®</sup> T. Rowe Price Equity Income Portfolio
|
| Class Name |
Class S
|
| Trading Symbol |
IRPSX
|
| Annual or Semi-Annual Statement [Text Block] |
This annual shareholder report contains important information about VY® T. Rowe Price Equity Income Portfolio for the period of January 1, 2025 to December 31, 2025.
|
| Shareholder Report Annual or Semi-Annual |
Annual Shareholder Report
|
| Additional Information Phone Number |
1-800-992-0180
|
| Expenses [Text Block] |
What were the Fund’s costs for the last year? (based on a hypothetical $10,000 investment)Class Name | Costs of $10K investment | Costs paid as % of $10K investment |
|---|
Class S | $96 | 0.90% |
|---|
|
| Expenses Paid, Amount |
$ 96
|
| Expense Ratio, Percent |
0.90%
|
| Factors Affecting Performance [Text Block] |
How did the Fund perform in the past 12 months?For the year ended December 31, 2025, the Fund underperformed the Russell 1000® Value primarily due to unfavorable sector allocation and stock selection. ↑ Top contributors to performance: Stock selection in the industrials & business services sector contributed the most to relative performance. An underweight allocation & stock selection in the consumer discretionary sector also supported relative results. Individual holdings that contributed to relative performance included Samsung Electronics, GE Aerospace, Citigroup, & L3Harris Technologies. ↓ Top detractors from performance: Stock selection in the materials sector detracted the most from relative performance. Security choices in the consumer staples sector also hampered relative results. Individual holdings that detracted from relative performance included Fiserv, Johnson & Johnson, and JPMorgan Chase. A zero-weight allocation to Micron Technology was also a significant relative detractor. |
| Line Graph [Table Text Block] |
| Class S | Russell 3000® Index | S&P 500® Index | Russell 1000® Value Index |
|---|
2015 | $10,000 | $10,000 | $10,000 | $10,000 |
|---|
2016 | $11,877 | $11,274 | $11,196 | $11,734 |
|---|
2017 | $13,806 | $13,656 | $13,640 | $13,337 |
|---|
2018 | $12,518 | $12,941 | $13,043 | $12,234 |
|---|
2019 | $15,826 | $16,955 | $17,150 | $15,481 |
|---|
2020 | $15,977 | $20,497 | $20,305 | $15,914 |
|---|
2021 | $20,014 | $25,756 | $26,135 | $19,918 |
|---|
2022 | $19,331 | $20,808 | $21,402 | $18,416 |
|---|
2023 | $21,135 | $26,210 | $27,028 | $20,527 |
|---|
2024 | $23,555 | $32,449 | $33,790 | $23,477 |
|---|
2025 | $26,925 | $38,013 | $39,832 | $27,211 |
|---|
|
| Average Annual Return [Table Text Block] |
Fund | 1 Year
| 5 Years
| 10 Years
|
|---|
Class S
| 14.31% | 11.00% | 10.41% |
|---|
Russell 3000® Index | 17.15% | 13.15% | 14.29% |
|---|
S&P 500® Index | 17.88% | 14.42% | 14.82% |
|---|
Russell 1000® Value Index | 15.91% | 11.33% | 10.53% |
|---|
|
| AssetsNet |
$ 288,365,638
|
| Holdings Count | Holding |
125
|
| Advisory Fees Paid, Amount |
$ 1,763,057
|
| InvestmentCompanyPortfolioTurnover |
24.00%
|
| Additional Fund Statistics [Text Block] |
- Total Net Assets$288,365,638
- # of Portfolio Holdings125
- Portfolio Turnover Rate24%
- Investment Advisory Fees Paid$1,763,057
|
| Holdings [Text Block] |
Value | Value |
|---|
Assets in Excess of Other Liabilities | 0.6% | Short-Term Investments | 0.4% | Preferred Stock | 0.8% | Common Stock | 98.2% |
Value | Value |
|---|
Financials | 22.6% | Industrials | 14.2% | Health Care | 13.5% | Information Technology | 10.1% | Energy | 8.3% | Communication Services | 6.8% | Consumer Staples | 6.8% | Utilities | 6.1% | Consumer Discretionary | 4.2% | Real Estate | 3.5% | Materials | 2.9% | Short-Term Investments | 0.4% | Assets in Excess of Other Liabilities | 0.6% |
|
| Largest Holdings [Text Block] |
Qualcomm, Inc. | 2.0% |
|---|
Citigroup, Inc. | 2.0% |
|---|
MetLife, Inc. | 2.0% |
|---|
Alphabet, Inc. - Class A | 2.0% |
|---|
Southern Co. | 1.9% |
|---|
JPMorgan Chase & Co. | 1.9% |
|---|
Charles Schwab Corp. | 1.9% |
|---|
Bank of America Corp. | 1.7% |
|---|
TotalEnergies SE | 1.6% |
|---|
L3Harris Technologies, Inc. | 1.6% |
|---|
|
| Material Fund Change [Text Block] |
|
| C000015830 |
|
| Shareholder Report [Line Items] |
|
| Fund Name |
VY<sup style="inset: 1.5px 0px 4px; box-sizing: border-box; color: rgb(0, 0, 0); display: inline; flex-wrap: nowrap; font-size: 9px; font-weight: 400; grid-area: auto; line-height: 0px; margin: 0px; overflow: visible; position: relative; text-align: left; text-align-last: auto; white-space-collapse: preserve-breaks;">®</sup> T. Rowe Price Equity Income Portfolio
|
| Class Name |
Class S2
|
| Trading Symbol |
ITETX
|
| Annual or Semi-Annual Statement [Text Block] |
This annual shareholder report contains important information about VY® T. Rowe Price Equity Income Portfolio for the period of January 1, 2025 to December 31, 2025.
|
| Shareholder Report Annual or Semi-Annual |
Annual Shareholder Report
|
| Additional Information Phone Number |
1-800-992-0180
|
| Expenses [Text Block] |
What were the Fund’s costs for the last year? (based on a hypothetical $10,000 investment)Class Name | Costs of $10K investment | Costs paid as % of $10K investment |
|---|
Class S2 | $112 | 1.05% |
|---|
|
| Expenses Paid, Amount |
$ 112
|
| Expense Ratio, Percent |
1.05%
|
| Factors Affecting Performance [Text Block] |
How did the Fund perform in the past 12 months?For the year ended December 31, 2025, the Fund underperformed the Russell 1000® Value primarily due to unfavorable sector allocation and stock selection. ↑ Top contributors to performance: Stock selection in the industrials & business services sector contributed the most to relative performance. An underweight allocation & stock selection in the consumer discretionary sector also supported relative results. Individual holdings that contributed to relative performance included Samsung Electronics, GE Aerospace, Citigroup, & L3Harris Technologies. ↓ Top detractors from performance: Stock selection in the materials sector detracted the most from relative performance. Security choices in the consumer staples sector also hampered relative results. Individual holdings that detracted from relative performance included Fiserv, Johnson & Johnson, and JPMorgan Chase. A zero-weight allocation to Micron Technology was also a significant relative detractor. |
| Line Graph [Table Text Block] |
| Class S2 | Russell 3000® Index | S&P 500® Index | Russell 1000® Value Index |
|---|
2015 | $10,000 | $10,000 | $10,000 | $10,000 |
|---|
2016 | $11,859 | $11,274 | $11,196 | $11,734 |
|---|
2017 | $13,765 | $13,656 | $13,640 | $13,337 |
|---|
2018 | $12,465 | $12,941 | $13,043 | $12,234 |
|---|
2019 | $15,721 | $16,955 | $17,150 | $15,481 |
|---|
2020 | $15,854 | $20,497 | $20,305 | $15,914 |
|---|
2021 | $19,842 | $25,756 | $26,135 | $19,918 |
|---|
2022 | $19,134 | $20,808 | $21,402 | $18,416 |
|---|
2023 | $20,878 | $26,210 | $27,028 | $20,527 |
|---|
2024 | $23,246 | $32,449 | $33,790 | $23,477 |
|---|
2025 | $26,512 | $38,013 | $39,832 | $27,211 |
|---|
|
| Average Annual Return [Table Text Block] |
Fund | 1 Year
| 5 Years
| 10 Years
|
|---|
Class S2
| 14.05% | 10.83% | 10.24% |
|---|
Russell 3000® Index | 17.15% | 13.15% | 14.29% |
|---|
S&P 500® Index | 17.88% | 14.42% | 14.82% |
|---|
Russell 1000® Value Index | 15.91% | 11.33% | 10.53% |
|---|
|
| AssetsNet |
$ 288,365,638
|
| Holdings Count | Holding |
125
|
| Advisory Fees Paid, Amount |
$ 1,763,057
|
| InvestmentCompanyPortfolioTurnover |
24.00%
|
| Additional Fund Statistics [Text Block] |
- Total Net Assets$288,365,638
- # of Portfolio Holdings125
- Portfolio Turnover Rate24%
- Investment Advisory Fees Paid$1,763,057
|
| Holdings [Text Block] |
Value | Value |
|---|
Assets in Excess of Other Liabilities | 0.6% | Short-Term Investments | 0.4% | Preferred Stock | 0.8% | Common Stock | 98.2% |
Value | Value |
|---|
Financials | 22.6% | Industrials | 14.2% | Health Care | 13.5% | Information Technology | 10.1% | Energy | 8.3% | Communication Services | 6.8% | Consumer Staples | 6.8% | Utilities | 6.1% | Consumer Discretionary | 4.2% | Real Estate | 3.5% | Materials | 2.9% | Short-Term Investments | 0.4% | Assets in Excess of Other Liabilities | 0.6% |
|
| Largest Holdings [Text Block] |
Qualcomm, Inc. | 2.0% |
|---|
Citigroup, Inc. | 2.0% |
|---|
MetLife, Inc. | 2.0% |
|---|
Alphabet, Inc. - Class A | 2.0% |
|---|
Southern Co. | 1.9% |
|---|
JPMorgan Chase & Co. | 1.9% |
|---|
Charles Schwab Corp. | 1.9% |
|---|
Bank of America Corp. | 1.7% |
|---|
TotalEnergies SE | 1.6% |
|---|
L3Harris Technologies, Inc. | 1.6% |
|---|
|
| Material Fund Change [Text Block] |
|