Shareholder Report
Dec. 31, 2025
USD ($)
$ / shares
WHAT WERE THE FUND COSTS FOR THE PAST YEAR? (based on a hypothetical $10,000 investment)
|
Fund Name
|
Costs of a $10,000 investment
|
Costs paid as a percentage of a $10,000 investment
|
|
Wilshire Global Allocation Fund
|
$49
|
0.45%
|
HOW DID THE FUND PERFORM LAST YEAR AND WHAT AFFECTED ITS PERFORMANCE?
The Global Allocation Fund returned 17.41% in 2025, outperforming the Custom Benchmark return of 15.86%. The U.S. stock market, represented by the FT Wilshire 5000 IndexSM, was up 17.13% for the past year. Sector performance was positive across all sectors with information technology (+22.81%), industrials (+18.18%) and communication services (+31.77%) leading the market. From a size perspective, FT Wilshire Small Cap IndexSM underperformed FT Wilshire Large Cap IndexSM by 9.78% for the 1-year period. Growth stocks continued to outperform Value stocks during the year. Performance results within international equity markets were positive for the year. Both Non U.S. Developed and emerging market equities outperformed U.S. equities by a significant margin. Active management faced persistant headwind as mega capitalization stocks continued to perform well relative to the rest of the equities market. Credit oriented fixed income investments such as high yield, marginally outperformed the Bloomberg U.S. Aggregate Bond Index for the year.
|
Top Contributors
|
|
|
↑
|
Exposure to Wilshire Large Company Growth Portfolio was the top contributor from a manager selection stand point.
|
|
Top Detractors
|
|
|
↓
|
Overweight exposure to fixed income was a detractor of relative returns.
|
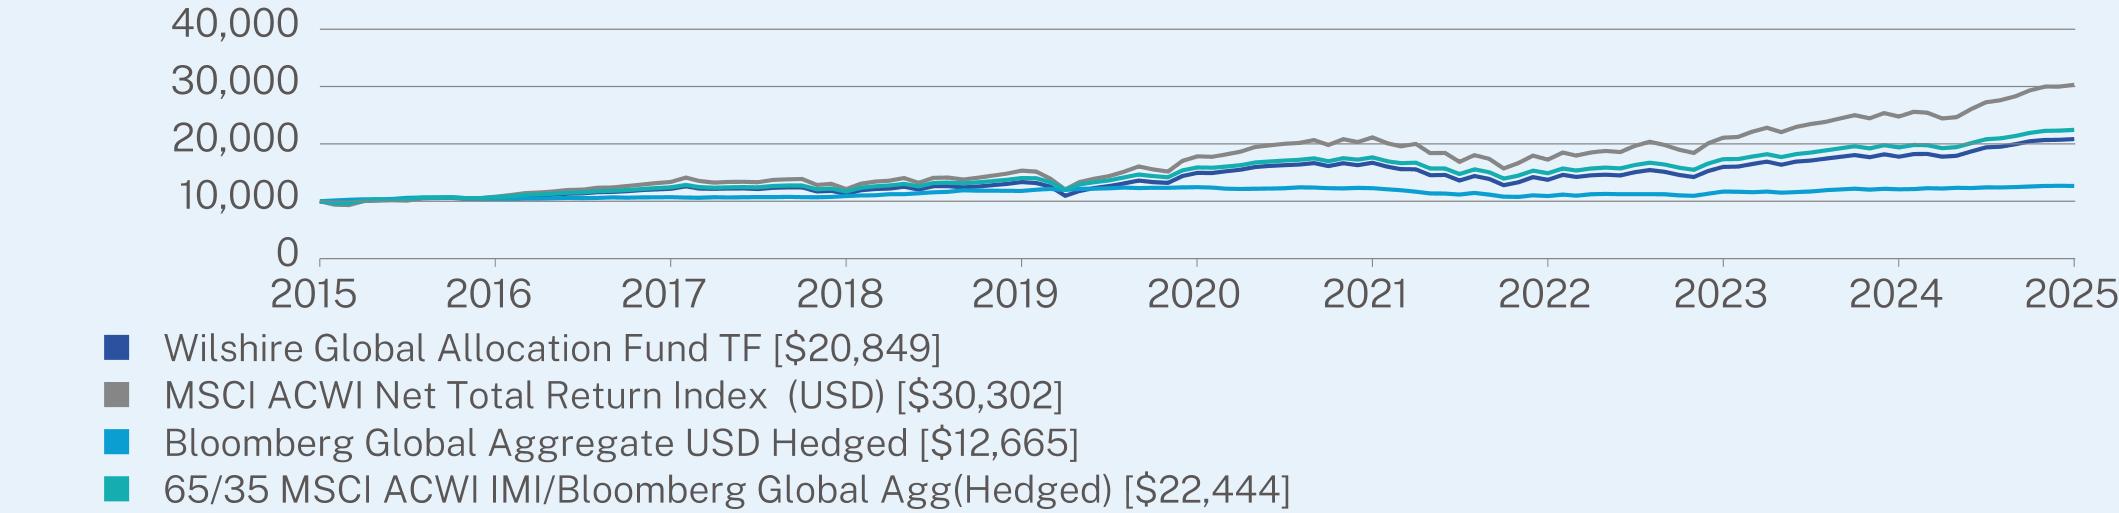
ANNUAL AVERAGE TOTAL RETURN (%)
|
|
1 Year
|
5 Year
|
10 Year
|
|
TF (without sales charge)
|
17.41
|
6.89
|
7.62
|
|
MSCI ACWI Net Total Return Index (USD)
|
22.34
|
11.19
|
11.72
|
|
Bloomberg Global Aggregate USD Hedged
|
4.86
|
0.34
|
2.39
|
|
65/35 MSCI ACWI IMI/Bloomberg Global Agg(Hedged)
|
15.86
|
7.14
|
8.42
|
Visit https://www.wilshire.com/research-insights/product-literature for more recent performance information.
KEY FUND STATISTICS (as of December 31, 2025)
|
Net Assets
|
$508,084,713
|
|
Number of Holdings
|
10
|
|
Net Advisory Fee
|
$565,158
|
|
Portfolio Turnover
|
22%
|
WHAT DID THE FUND INVEST IN? (as of December 31, 2025)
|
Top Sectors
|
(% of Net Assets)
|
|
Cash & Other
|
100.0%
|
|
Top 10 Issuers
|
(% of Net Assets)
|
|
Wilshire International Equity Fund
|
22.2%
|
|
Wilshire Income Opportunities Fund
|
18.9%
|
|
Wilshire Large Company Growth Portfolio
|
17.4%
|
|
Wilshire Large Company Value Portfolio
|
16.6%
|
|
Vanguard Total International Bond Index Fund
|
13.9%
|
|
Vanguard Mega Cap Index Fund
|
4.0%
|
|
Fidelity Emerging Markets Index Fund
|
2.0%
|
|
Vanguard Long-Term Bond Index Fund
|
2.0%
|
|
Wilshire Small Company Value Portfolio
|
1.5%
|
|
Wilshire Small Company Growth Portfolio
|
1.5%
|