Pay versus Performance Table
The required SEC tabular disclosure for the Company’s Principal Executive Officers (“PEOs”) and average NEOs (excluding the PEOs) is set forth below:
| Value of Initial Fixed $100 Investment Based on: | ||||||||||||||||||||
| Year(1) (a) | Summary Compensation Table Total for PEO (Calio) (b) | Compensation Actually Paid to PEO (Calio)(2)(4)(5) (c) | Summary Compensation Table Total for PEO (Hayes) (d) | Compensation Actually Paid to PEO (Hayes)(2)(4)(5) (e) | Average Summary Compensation Table Total for Non-PEO NEOs (f) | Average Compensation Actually Paid to Non-PEO NEOs(3)(4)(5) (g) | Total Shareowner Return(6) (h) | Peer Group Total Shareowner Return(6) (i) | Net Income (GAAP)(7) (j) | Adjusted Earnings Per Share(8) (k) | ||||||||||
| 2025 | $24,846,826 | $88,622,978 | – | – | $7,464,111 | $24,903,063 | $287.64 | $230.45 | $6,732 | $6.88 | ||||||||||
| 2024 | $18,004,831 | $43,160,374 | $14,598,458 | $48,639,528 | $6,119,056 | $14,115,544 | $178.17 | $162.31 | $4,774 | $6.26 | ||||||||||
| 2023 | – | – | $21,929,459 | -$3,811,432 | $8,225,337 | $267,298 | $126.58 | $141.88 | $3,195 | $5.06 | ||||||||||
| 2022 | – | – | $22,609,036 | $45,201,677 | $7,597,628 | $12,510,354 | $147.94 | $132.89 | $5,216 | $4.78 | ||||||||||
| 2021 | – | – | $23,316,063 | $39,680,968 | $9,666,013 | $11,257,846 | $123.27 | $113.22 | $3,897 | $4.27 | ||||||||||
| (1) | The PEO in the 2025 reporting year was Christopher T. Calio. The PEOs in the 2024 reporting year were Christopher T. Calio and Gregory J. Hayes. The PEO for the 2023-2021 reporting years was Gregory J. Hayes. The NEOs in the 2025 reporting year were Neil G. Mitchill, Jr., Philip J. Jasper, Shane G. Eddy and Troy D. Brunk. The NEOs in the 2024 reporting year were: Neil G. Mitchill, Jr., Philip J. Jasper, Shane G. Eddy, Troy D. Brunk and Stephen J. Timm. The NEOs in the 2023 and 2022 reporting years were: Neil G. Mitchill, Jr., Christopher T. Calio, Stephen J. Timm and Wesley D. Kremer. The NEOs in the 2021 reporting year were Neil G. Mitchill, Jr., Christopher T. Calio, Stephen J. Timm, Michael R. Dumais, Anthony F. O’Brien III and Thomas A. Kennedy. |
| (6) | Reflects TSR indexed to $100 per share for RTX and the S&P 500 Aerospace & Defense Industry Index, which is the industry line peer group reported in our 2025 Form 10-K. See page 84 for the TSR measurement periods used for each reporting year. |
| (2) | The following amounts were deducted from and added to the SCT to arrive at the CAP for each of the applicable years for the PEO, as shown in columns (c) and (e): |
| 2025 (Calio) | 2024 (Hayes) | 2024 (Calio) | 2023 | 2022 | 2021 | ||||||||
| Summary Compensation Table | $24,846,826 | $14,598,458 | $18,004,831 | $21,929,459 | $22,609,036 | $23,316,063 | |||||||
| Stock Awards | $10,875,391 | $6,159,916 | $8,315,559 | $9,772,488 | $9,352,104 | $11,740,098 | |||||||
| Option Awards | $6,753,909 | $3,984,256 | $5,379,072 | $6,586,686 | $6,425,871 | $2,815,812 | |||||||
| Change in Present Value of Pension Benefits | $48,257 | $0 | $0 | $0 | $0 | $1,513,140 | |||||||
| Total Deductions from SCT | $17,677,557 | $10,144,172 | $13,694,631 | $16,359,174 | $15,777,975 | $16,069,050 | |||||||
| Fair Value of Awards Granted During Year and Unvested as of Year-End | $36,841,486 | $18,658,660 | $25,189,252 | $9,249,682 | $18,142,022 | $23,685,247 | |||||||
| Fair Value of Awards Granted and Vested During the Year | $0 | $0 | $0 | $0 | $0 | $0 | |||||||
| Change in Fair Value of Prior Year Awards Unvested as of Year-End | $43,618,294 | $23,409,788 | $13,150,013 | -$17,590,182 | $15,968,806 | $8,869,318 | |||||||
| Change in Fair Value of Prior Year Awards that Vested During Year | $993,929 | $2,116,794 | $510,909 | -$1,041,217 | $4,259,788 | -$120,609 | |||||||
| Change in Fair Value of Prior Year Awards that Forfeited During Year | $0 | $0 | $0 | $0 | $0 | $0 | |||||||
| Dividends/Other Earnings Paid on Unvested Awards During Year | $0 | $0 | $0 | $0 | $0 | $0 | |||||||
| Service Cost of Pension Benefits | $0 | $0 | $0 | $0 | $0 | $0 | |||||||
| Prior Service Cost of Pension Benefits | $0 | $0 | $0 | $0 | $0 | $0 | |||||||
| Total Additions to CAP | $81,453,709 | $44,185,242 | $38,850,174 | -$9,381,717 | $38,370,616 | $32,433,955 | |||||||
| Compensation Actually Paid | $88,622,978 | $48,639,528 | $43,160,374 | -$3,811,432 | $45,201,677 | $39,680,968 |
| (3) | The following amounts were deducted from and added to the SCT to arrive at the CAP for each of the applicable years for the average non-PEO NEOs, as shown in column (g): |
| 2025 | 2024 | 2023 | 2022 | 2021 | |||||||
| Summary Compensation Table | $7,464,111 | $6,119,056 | $8,225,337 | $7,597,628 | $9,666,013 | ||||||
| Stock Awards | $2,853,753 | $2,790,237 | $3,294,564 | $3,219,892 | $4,389,543 | ||||||
| Option Awards | $1,772,128 | $1,414,835 | $2,221,250 | $2,212,775 | $1,093,639 | ||||||
| Change in Present Value of Pension Benefits | $17,128 | $850 | $462,721 | $0 | $1,461,448 | ||||||
| Total Deductions from SCT | $4,643,008 | $4,205,922 | $5,978,534 | $5,432,667 | $6,944,629 | ||||||
| Fair Value of Awards Granted During Year and Unvested as of Year-End | $9,667,096 | $7,271,020 | $3,118,865 | $6,246,737 | $6,453,006 | ||||||
| Fair Value of Awards Granted and Vested During the Year | $0 | $0 | $0 | $0 | $0 | ||||||
| Change in Fair Value of Prior Year Awards Unvested as of Year-End | $12,096,356 | $4,596,314 | -$5,105,124 | $3,459,419 | $1,880,243 | ||||||
| Change in Fair Value of Prior Year Awards that Vested During Year | $318,509 | $335,076 | -$150,609 | $440,110 | $104,110 | ||||||
| Change in Fair Value of Prior Year Awards that Forfeited During Year | $0 | $0 | $0 | $0 | -$326,443 | ||||||
| Dividends/Other Earnings Paid on Unvested Awards During Year | $0 | $0 | $26,113 | $30,377 | $99,047 | ||||||
| Service Cost of Pension Benefits | $0 | $0 | $131,250 | $168,750 | $326,500 | ||||||
| Prior Service Cost of Pension Benefits | $0 | $0 | $0 | $0 | $0 | ||||||
| Total Additions to CAP | $22,081,961 | $12,202,410 | -$1,979,504 | $10,345,393 | $8,536,463 | ||||||
| Compensation Actually Paid | $24,903,063 | $14,115,544 | $267,298 | $12,510,354 | $11,257,846 |
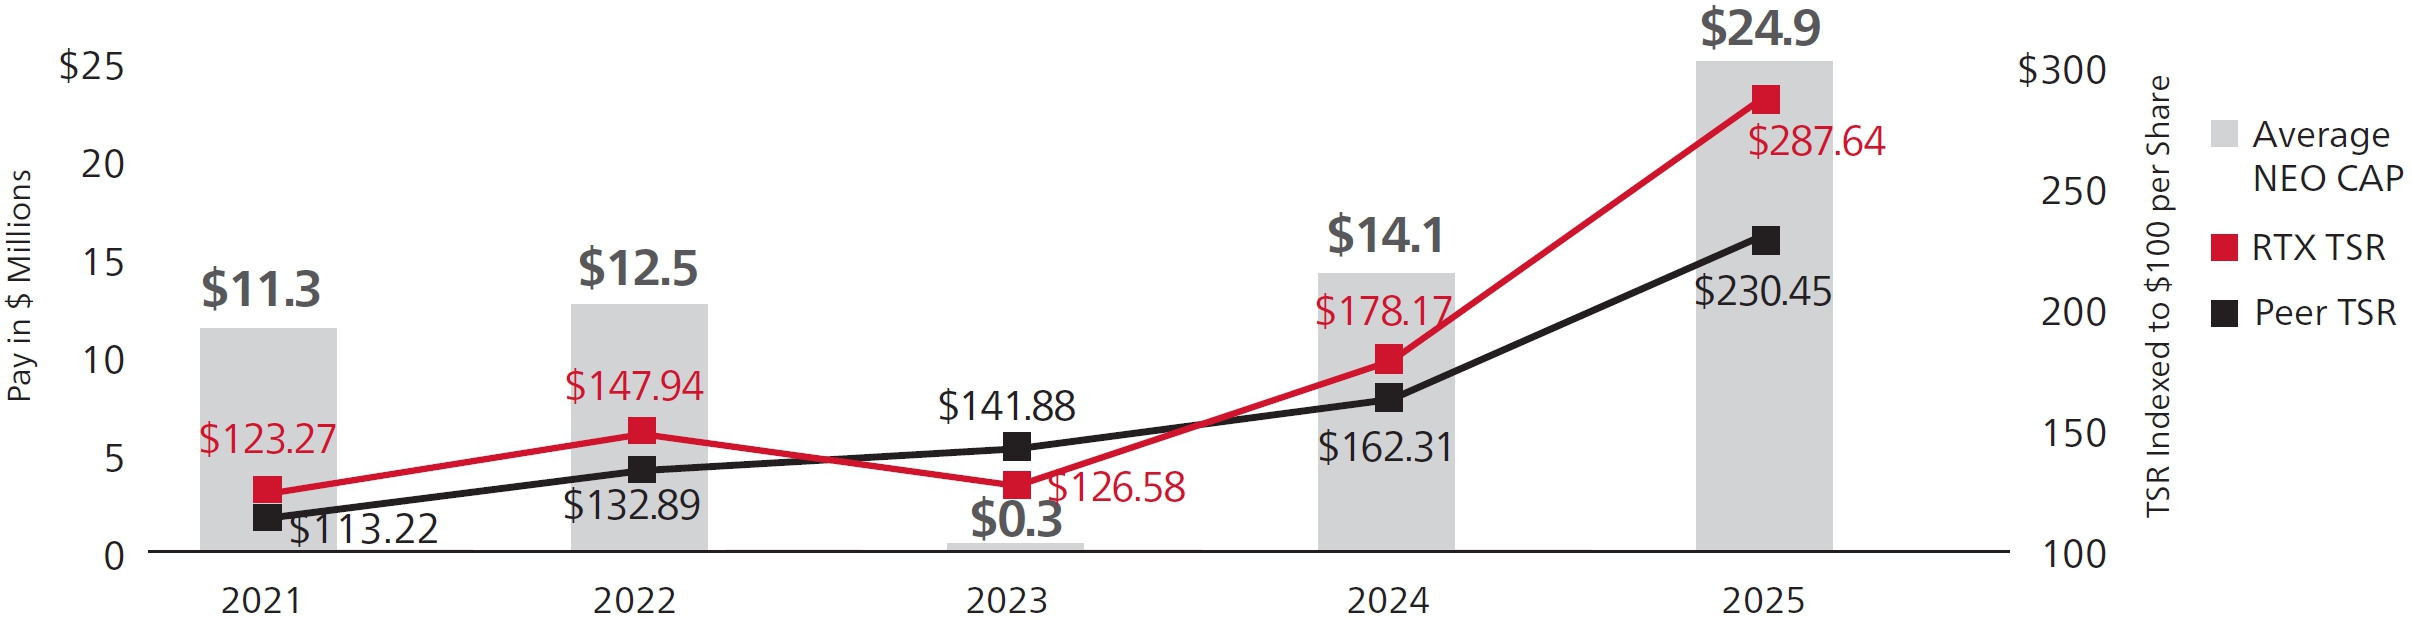
Relationship between CAP and TSR
The charts below reflect the relationship between the CEO and Average NEO CAP (per the SEC’s definition), RTX’s TSR and the SEC-mandated TSR Peer Group—the S&P 500 Aerospace & Defense Industry Index.
CEO CAP vs. TSR
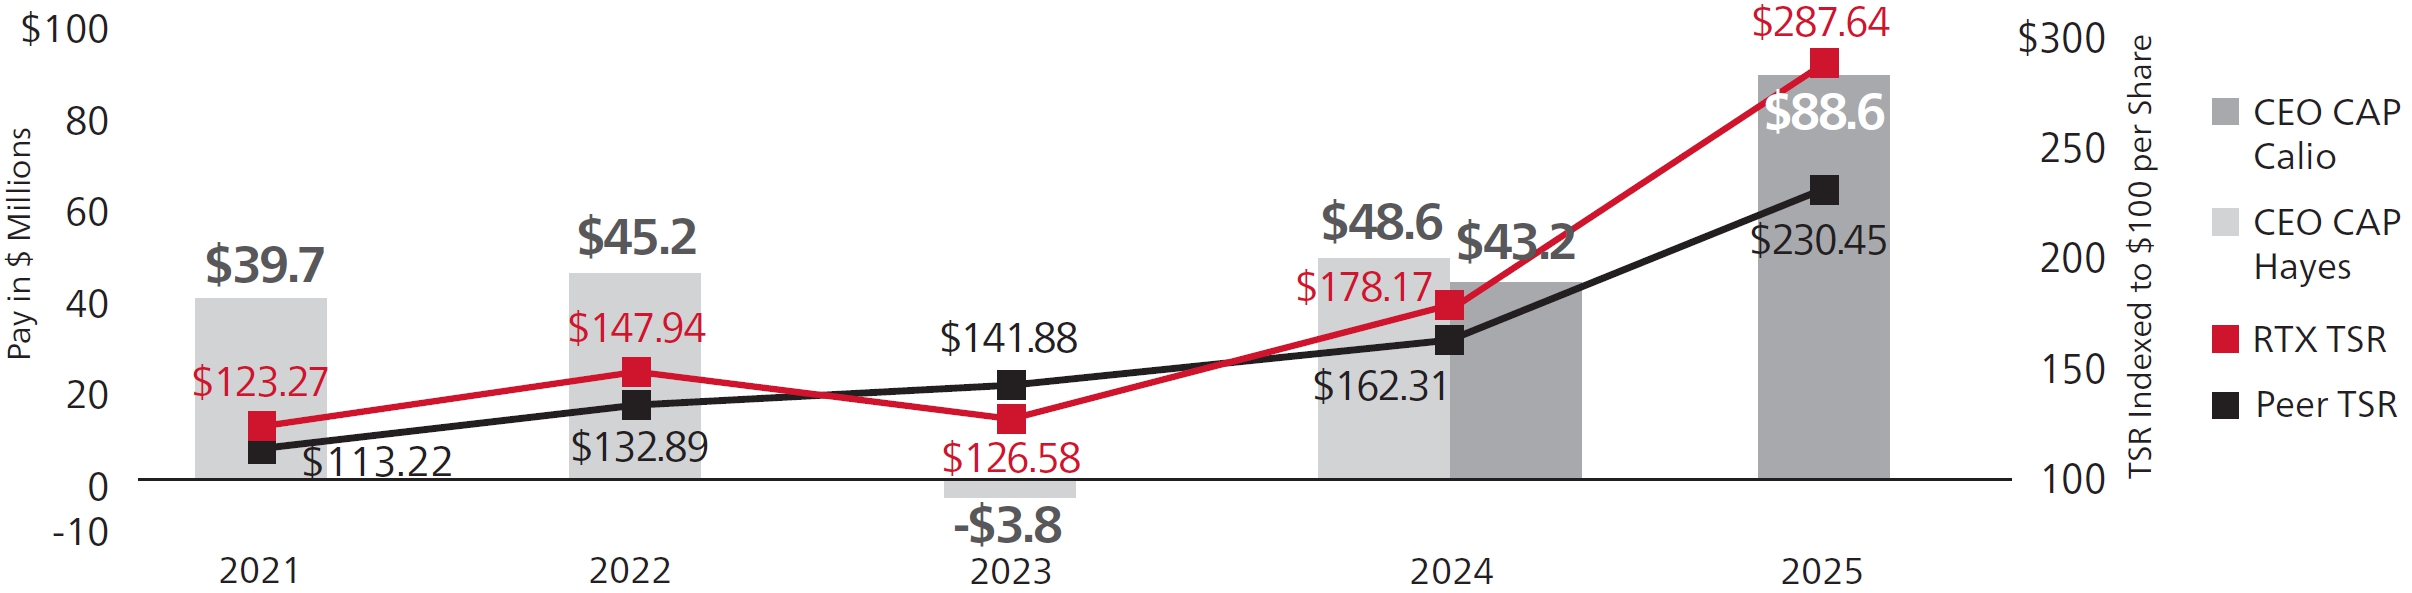
AVERAGE NEO CAP vs. TSR
HOW TSR USED FOR THE PVP TABLE DIFFERS FROM HOW WE USE TSR IN OUR PSUS
The SEC’s PvP disclosure rules require a comparison of CAP to RTX’s TSR and Peer Group TSR over differing time periods. This mandated comparison, and the performance measurement periods used, differ in the following ways from how our incentive plans are designed:
| ● | For our PSUs, we compare our TSR to both the companies within the S&P 500 Index and our Core A&D Peers (together “PSU Peer Groups”). For the SEC’s PvP disclosure, we compare our TSR only to the S&P 500 Aerospace & Defense Industry Index. |
| ● | For our PSUs, we calculate TSR for both RTX and the companies within our PSU Peer Groups using a November/ December trailing average adjusted closing stock price for both the beginning and ending of the performance period. However, the PvP disclosures require the use of a point-to-point calculation. |
| ● | For our PSUs, we measure performance using a three-year performance period, while the SEC rules require TSR to be calculated based on the following performance periods: |
| Reporting Year | Beginning | End | Number of Years | |||
| 2025 | 1/2/2021 | 12/31/2025 | 5 years | |||
| 2024 | 1/2/2021 | 12/31/2024 | 4 years | |||
| 2023 | 1/2/2021 | 12/31/2023 | 3 years | |||
| 2022 | 1/2/2021 | 12/31/2022 | 2 years | |||
| 2021 | 1/2/2021 | 12/31/2021 | 1 year |
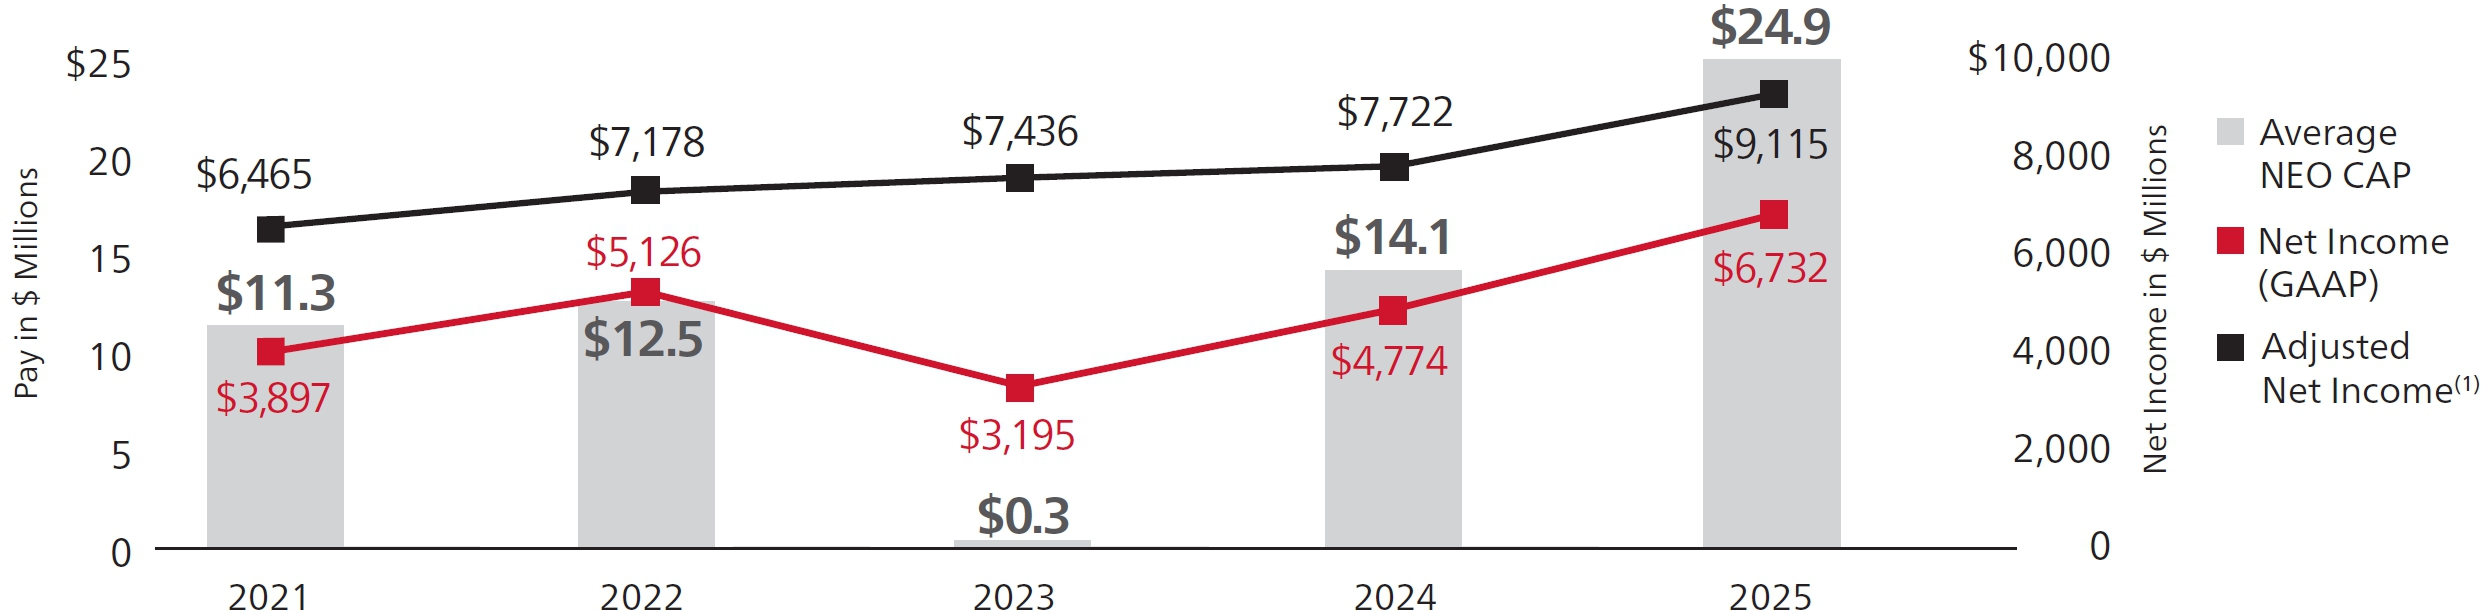
Relationship between CAP and Net Income (GAAP)
The charts below reflect the relationship between the CEO and Average NEO CAP, RTX’s GAAP net income (as required by the SEC), and a supplemental net income metric (adjusted net income) that we use for our annual incentive plan. Both GAAP and adjusted net income reflect a one-year performance measurement period.
We do not use net income as a metric in our long-term incentive plan. Since long-term incentives comprise the largest portion of our NEOs’ pay, and CAP values include four years of LTI awards and only one year of annual incentives in each reporting year, the relationship between CAP and net income is less evident.
CEO CAP vs. NET INCOME
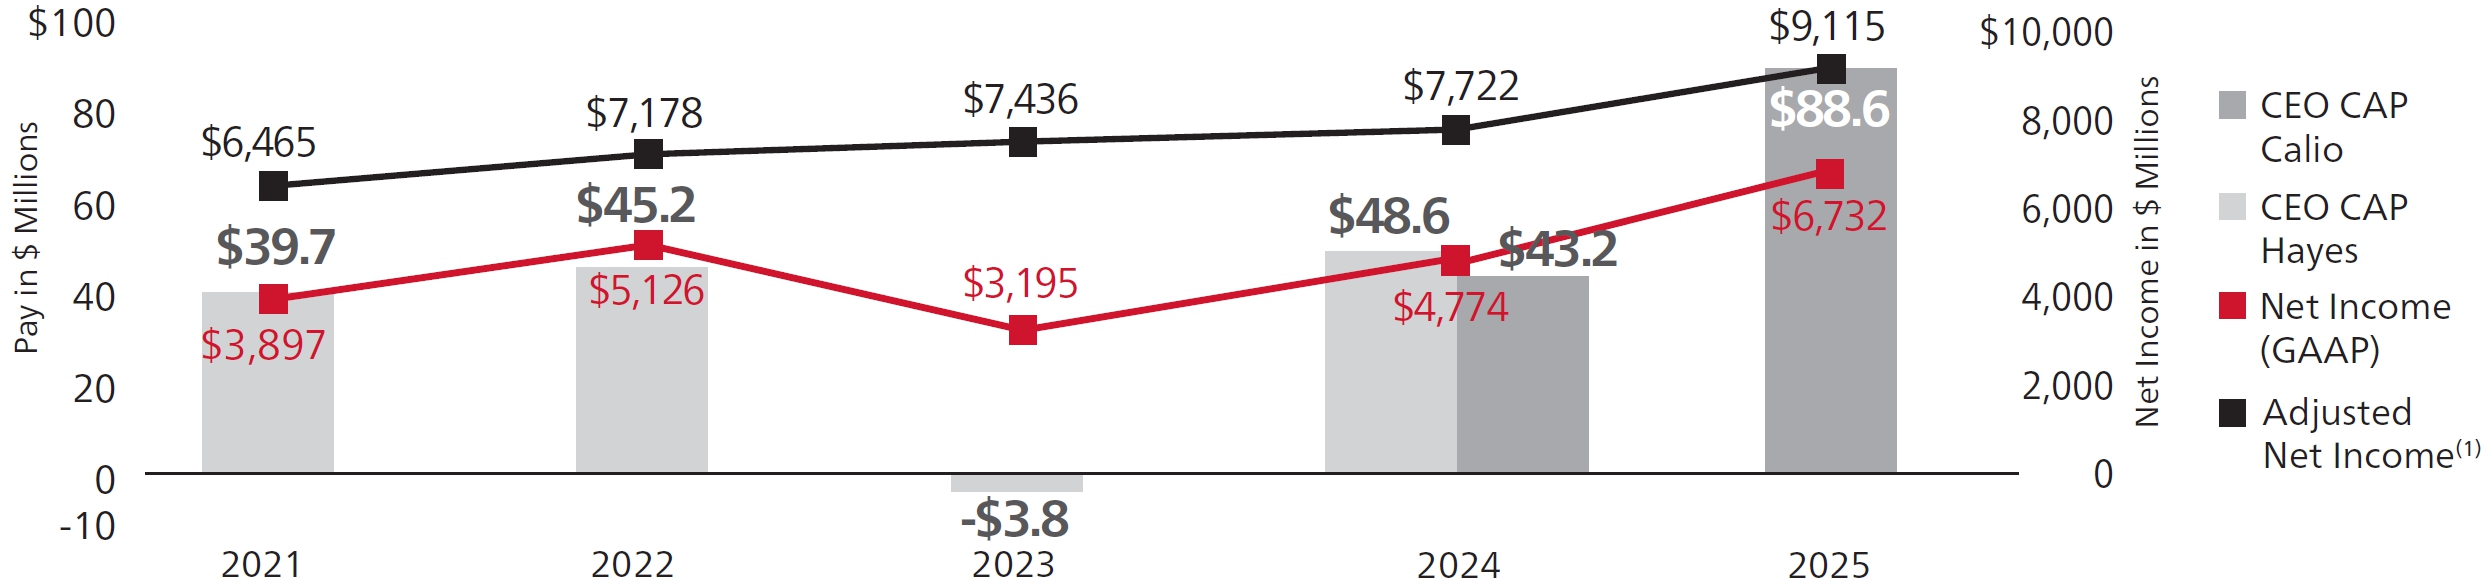
AVERAGE NEO CAP vs. NET INCOME
| (1) | Adjusted net income is a financial metric used solely for AIP purposes and is defined in Appendix B on page 102. This metric may differ from other non-GAAP metrics used and described in Appendix A. |
HOW NET INCOME USED FOR THE PVP TABLE DIFFERS FROM HOW WE USE NET INCOME IN OUR ANNUAL INCENTIVE PLAN
The SEC’s PvP disclosure rules require disclosure of the relationship between CAP and RTX’s net income (GAAP) for each reporting year. This use of GAAP net income differs from the adjusted net income measure we use for annual incentive purposes, which more closely aligns with the non-GAAP financial expectations and results we communicate to shareowners.
For our annual incentive plan, GAAP net income is adjusted for changes in tax laws, tariffs and accounting rules, restructuring, the impact of acquisitions and divestitures (including acquisition accounting adjustments), and significant and/or nonrecurring items, as shown in Appendix B on page 102. Our use of this adjusted net income definition aligns with the HCC Committee’s belief that annual incentives should not be positively or negatively impacted by short-term decisions made in the best interests of RTX’s long-term business strategies. Adjusted net income encourages decision-making that considers long-term value creation but does not conflict with our short-term incentive metrics.
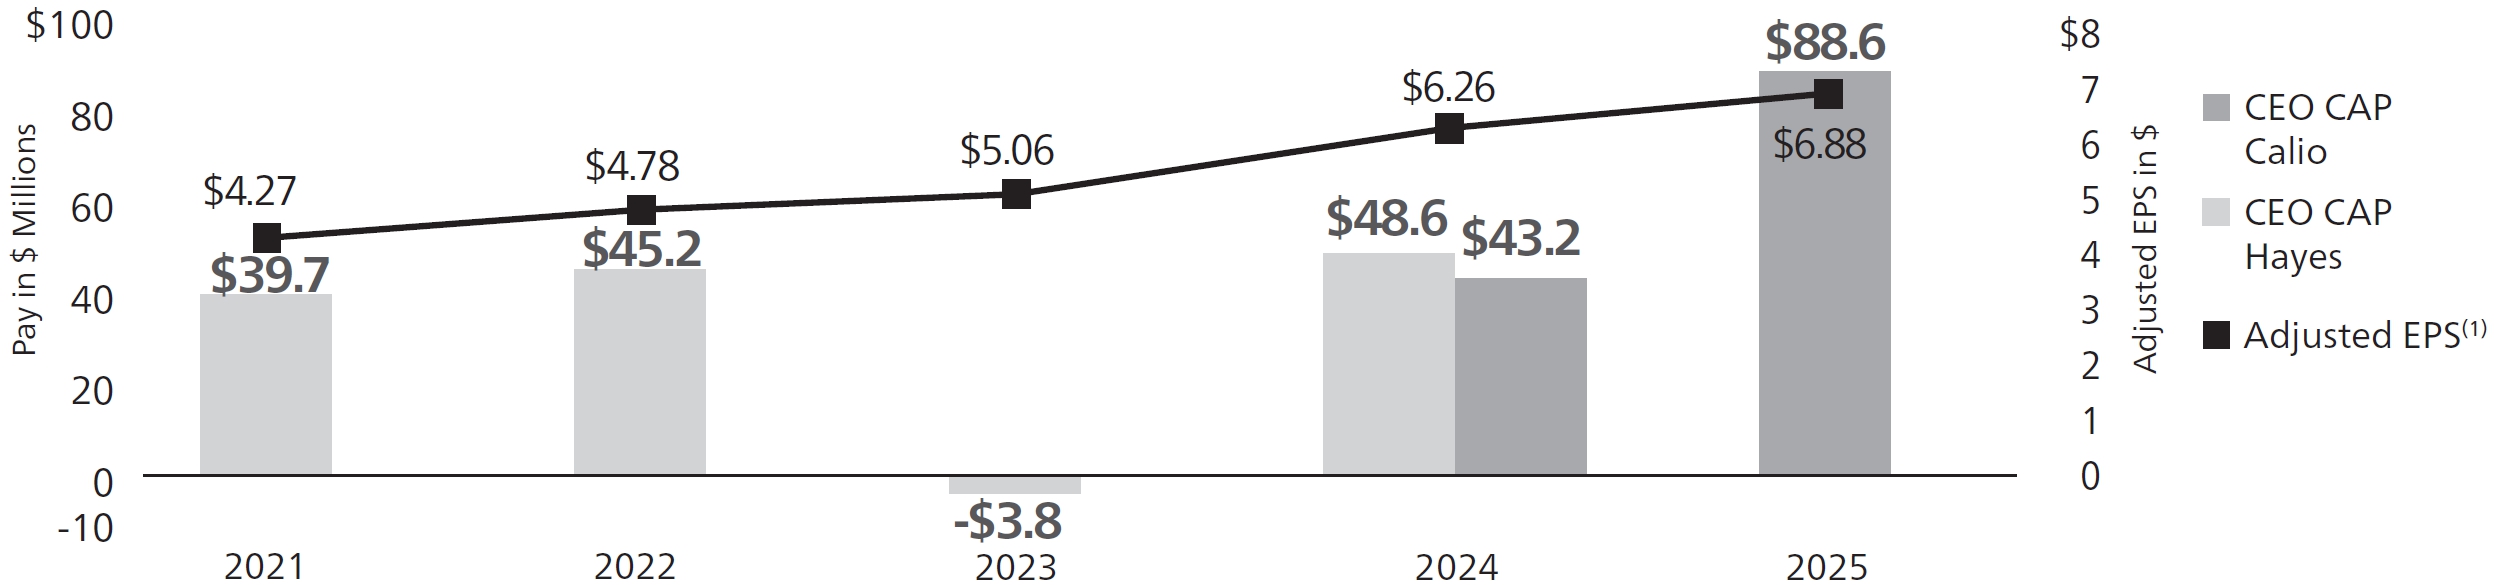
Relationship between CAP and the Company-Selected Measure (Adjusted EPS)
The charts below reflect the relationship between the CEO CAP and Average NEO CAP and RTX’s adjusted EPS for the applicable reporting year. This metric is used to determine vesting of our PSUs. We consider adjusted EPS to be the most important financial measure used to link pay to performance in 2024 because LTI is the largest component of NEO compensation, PSUs make up 60% of LTI and adjusted EPS performance determines 35% of total PSU vesting. Further, because we use adjusted EPS when we communicate our earnings expectations to our investors, we believe it is substantially correlated with our stock price performance, and thus to CAP.
CEO CAP vs. ADJUSTED EPS
AVERAGE NEO CAP vs. ADJUSTED EPS
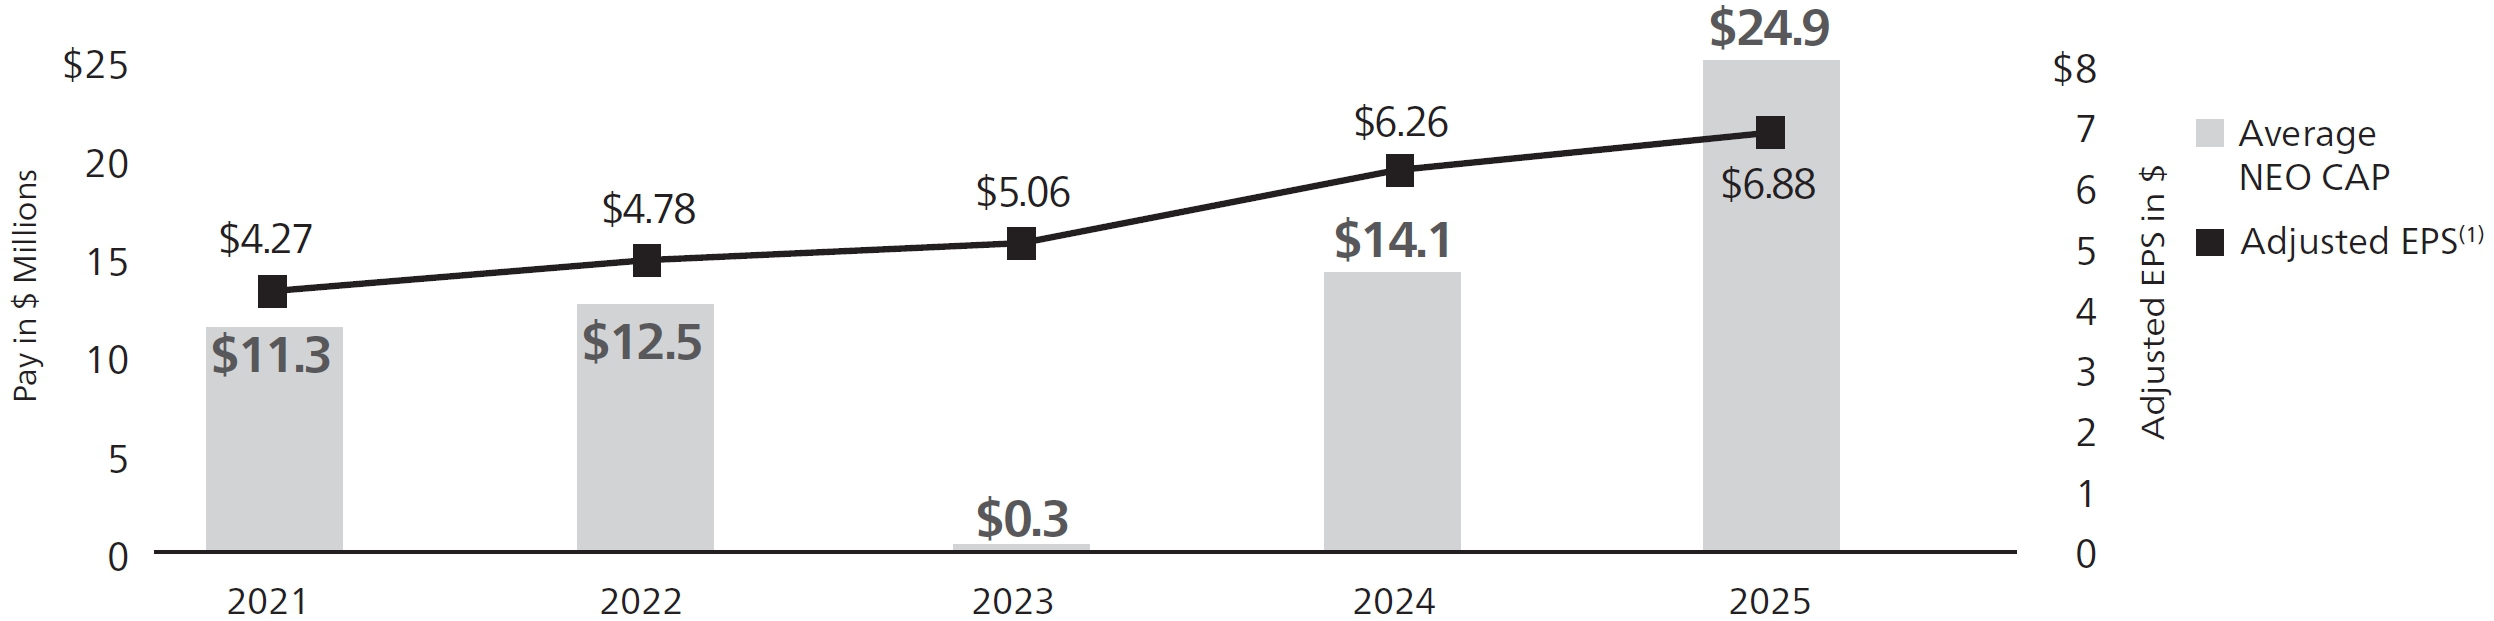
| (1) | The value shown for 2025 reflects the 2025 Adjusted EPS used to calculate performance for the 2023-2025 PSUs, as defined in Appendix B on page 102. The value shown for 2024 reflects the 2024 Adjusted EPS used to calculate performance for the 2022-2024 PSUs, as defined in Appendix B of our Proxy Statement filed on March 10, 2025. Adjusted EPS for 2023, 2022 and 2021 are detailed in Appendix A of our Proxy Statements filed on March 11, 2024, March 13, 2023, and March 14, 2022, respectively. |
| Annual Incentive Plan |
● Earnings measure the immediate impact of operating decisions on the Company’s annual performance. For our Corporate executives, we use adjusted net income as our RTX-wide earnings metric, and for our business units, we use adjusted segment operating income.
● Free Cash Flow measures our ability to generate cash to fund our operations and key business investments—whether that means funding critical research and development, strategic acquisitions, paying down debt or distributing earnings to our shareowners. | |
| Performance Share Units |
● Adjusted Earnings Per Share measures the Company’s ability to create long-term, sustainable earnings that will ultimately drive total shareowner return.
● Return on Invested Capital measures the efficiency with which we allocate capital resources, considering not just the quantity of earnings but also the quality of earnings and investments that drive sustainable growth.
● Total Shareowner Return vs. our Core A&D Peers and the companies in the S&P 500 Index measures our ability to return value to our shareowners compared to our Core A&D Peers and a broad index investment opportunity. |
| (8) | The value shown for 2025 reflects the 2025 Adjusted EPS used to calculate performance for the 2023-2025 PSUs, as defined in Appendix B on page 102. The value shown for 2024 reflects the 2024 Adjusted EPS used to calculate performance for the 2022-2024 PSUs, as defined in Appendix B of our Proxy Statement filed on March 10, 2025. Adjusted EPS for 2023, 2022 and 2021 are detailed in Appendix A of our Proxy Statements filed on March 11, 2024, March 13, 2023, and March 14, 2022, respectively. |