What were the Fund costs for the reporting period?
(based on a hypothetical $10,000 investment)
|
Fund
Name
|
Costs
of a $10,000 investment
|
Costs
paid as a percentage of a $10,000 investment
|
|---|---|---|
|
Applied
Finance Valuation
Large
Cap ETF
|
$54
|
0.49%
|
How did the Fund perform last year?
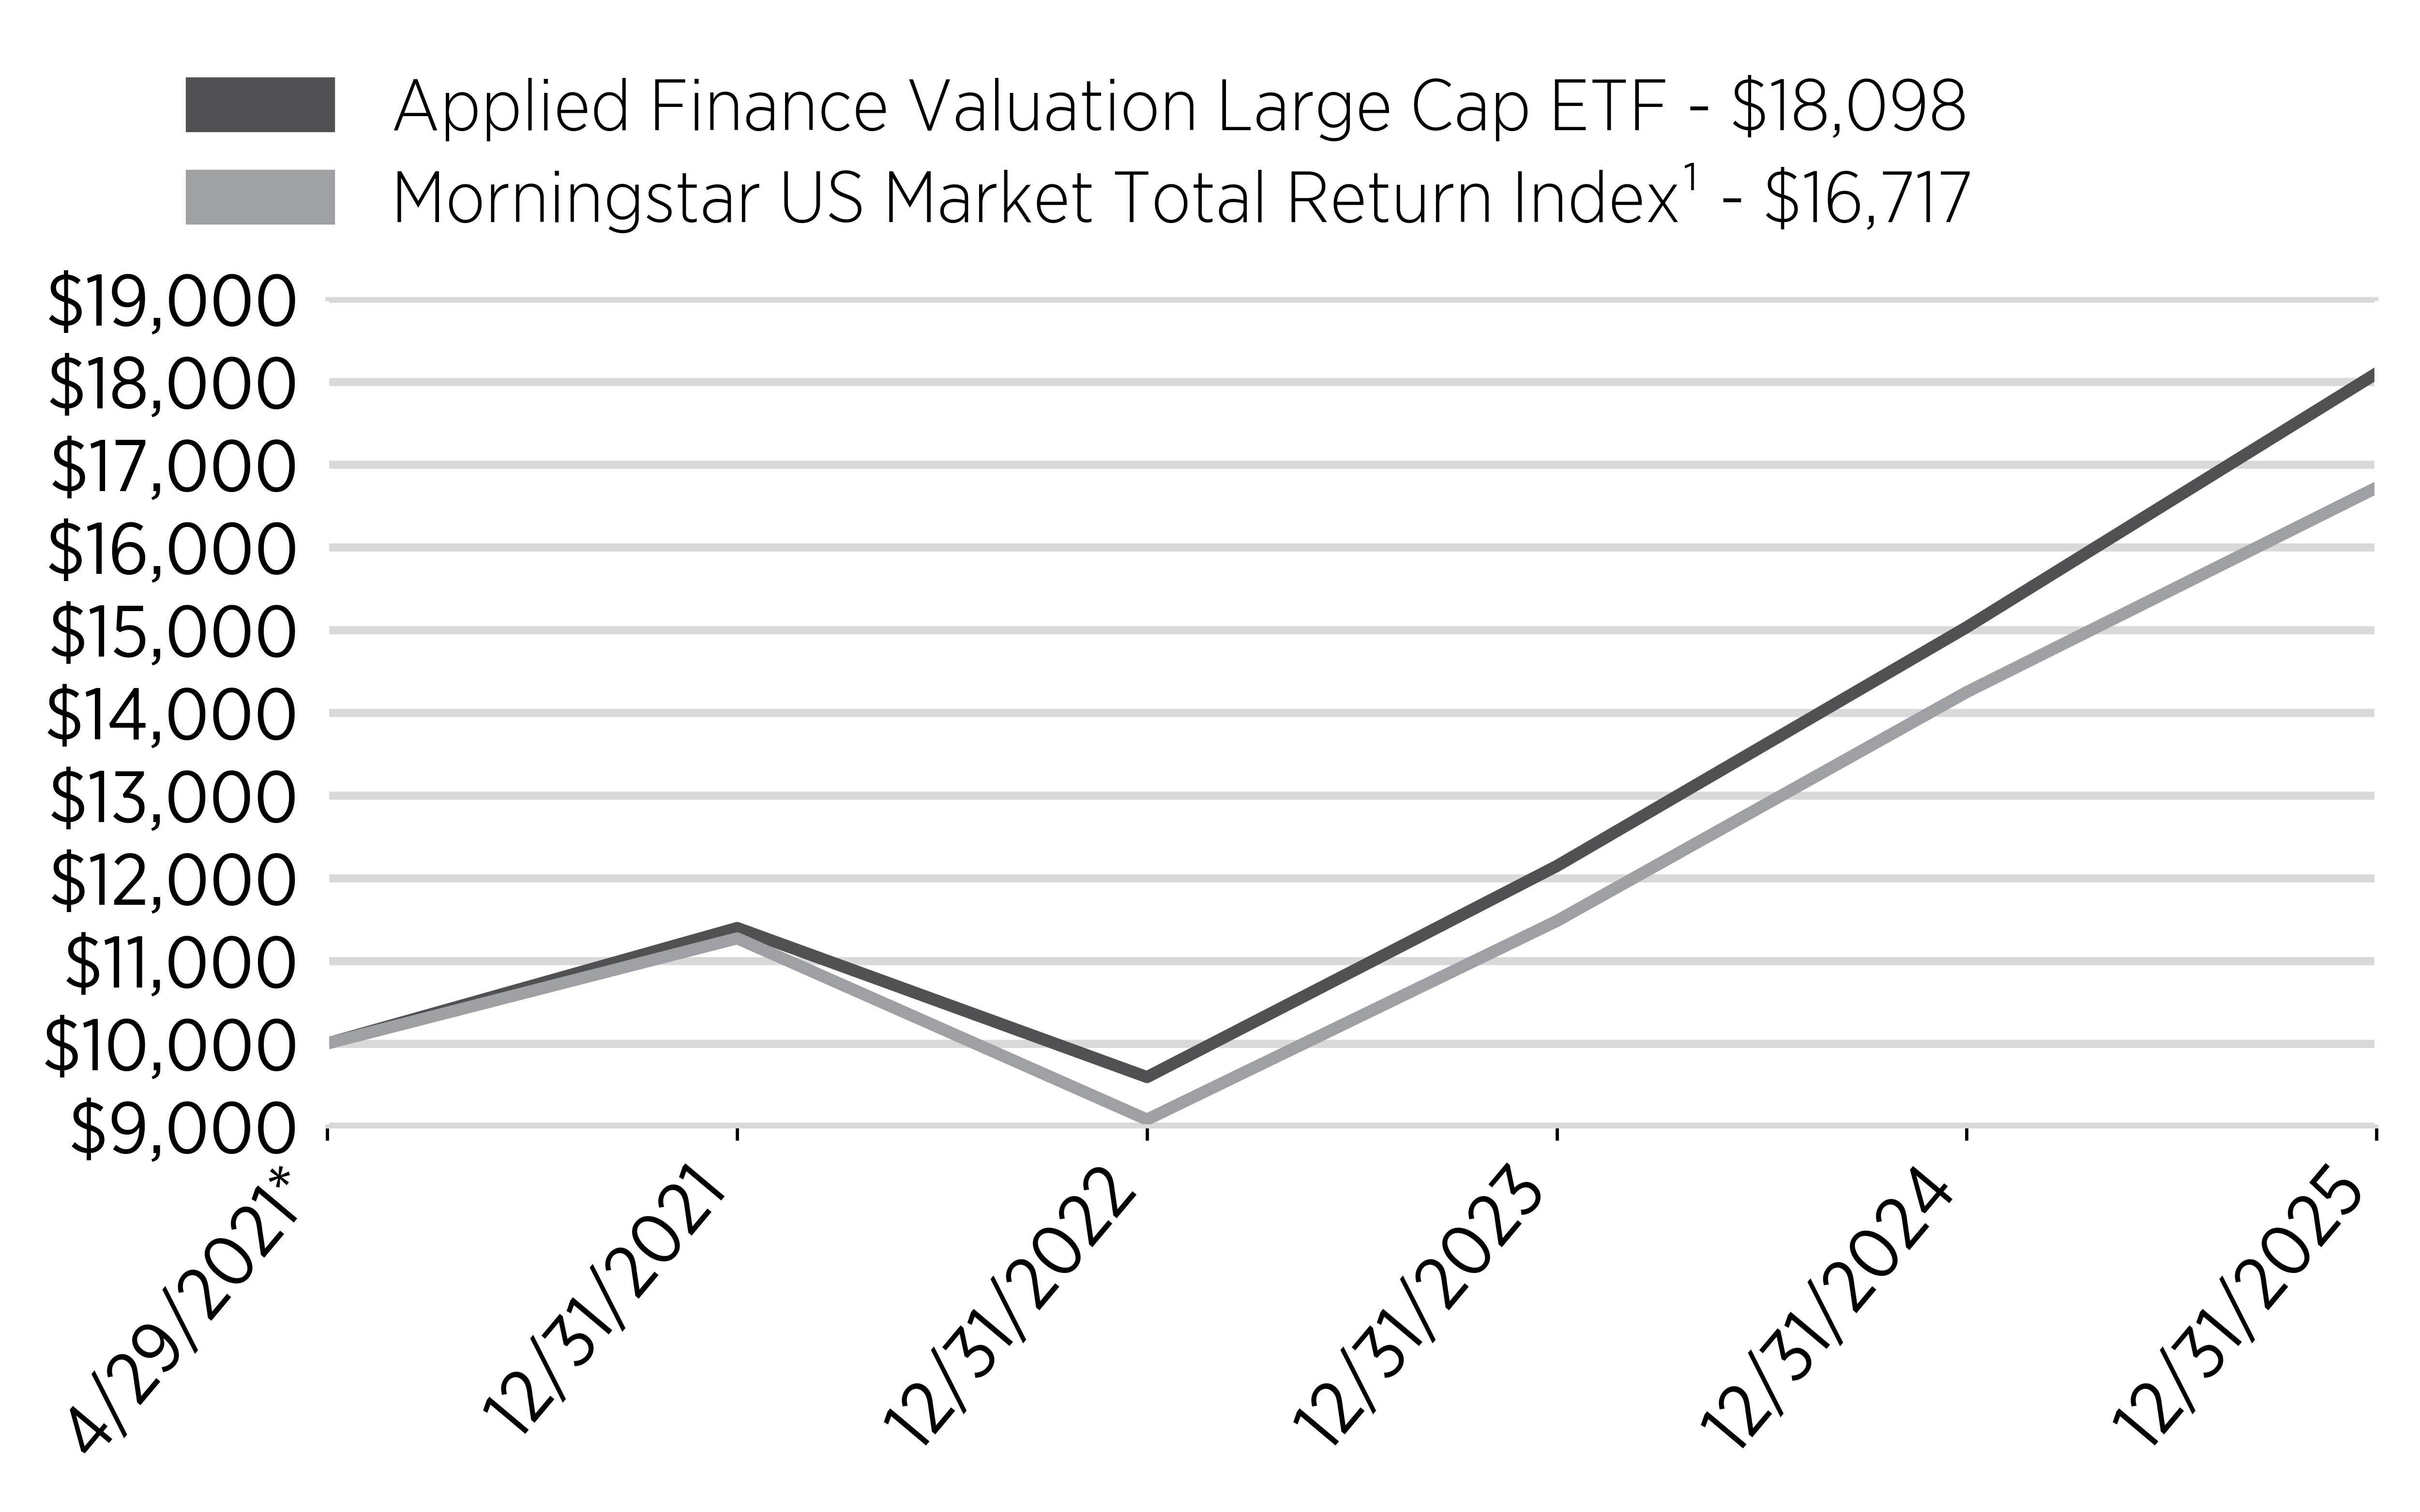
• For the period of January 1, 2025, to December 31, 2025, the Applied Finance Valuation Large Cap ETF (the “Fund”) returned 20.41%.
• In comparison, the Morningstar US Market Total Return Index returned 17.35% for the same period.
What key factors affected the Fund's performance?
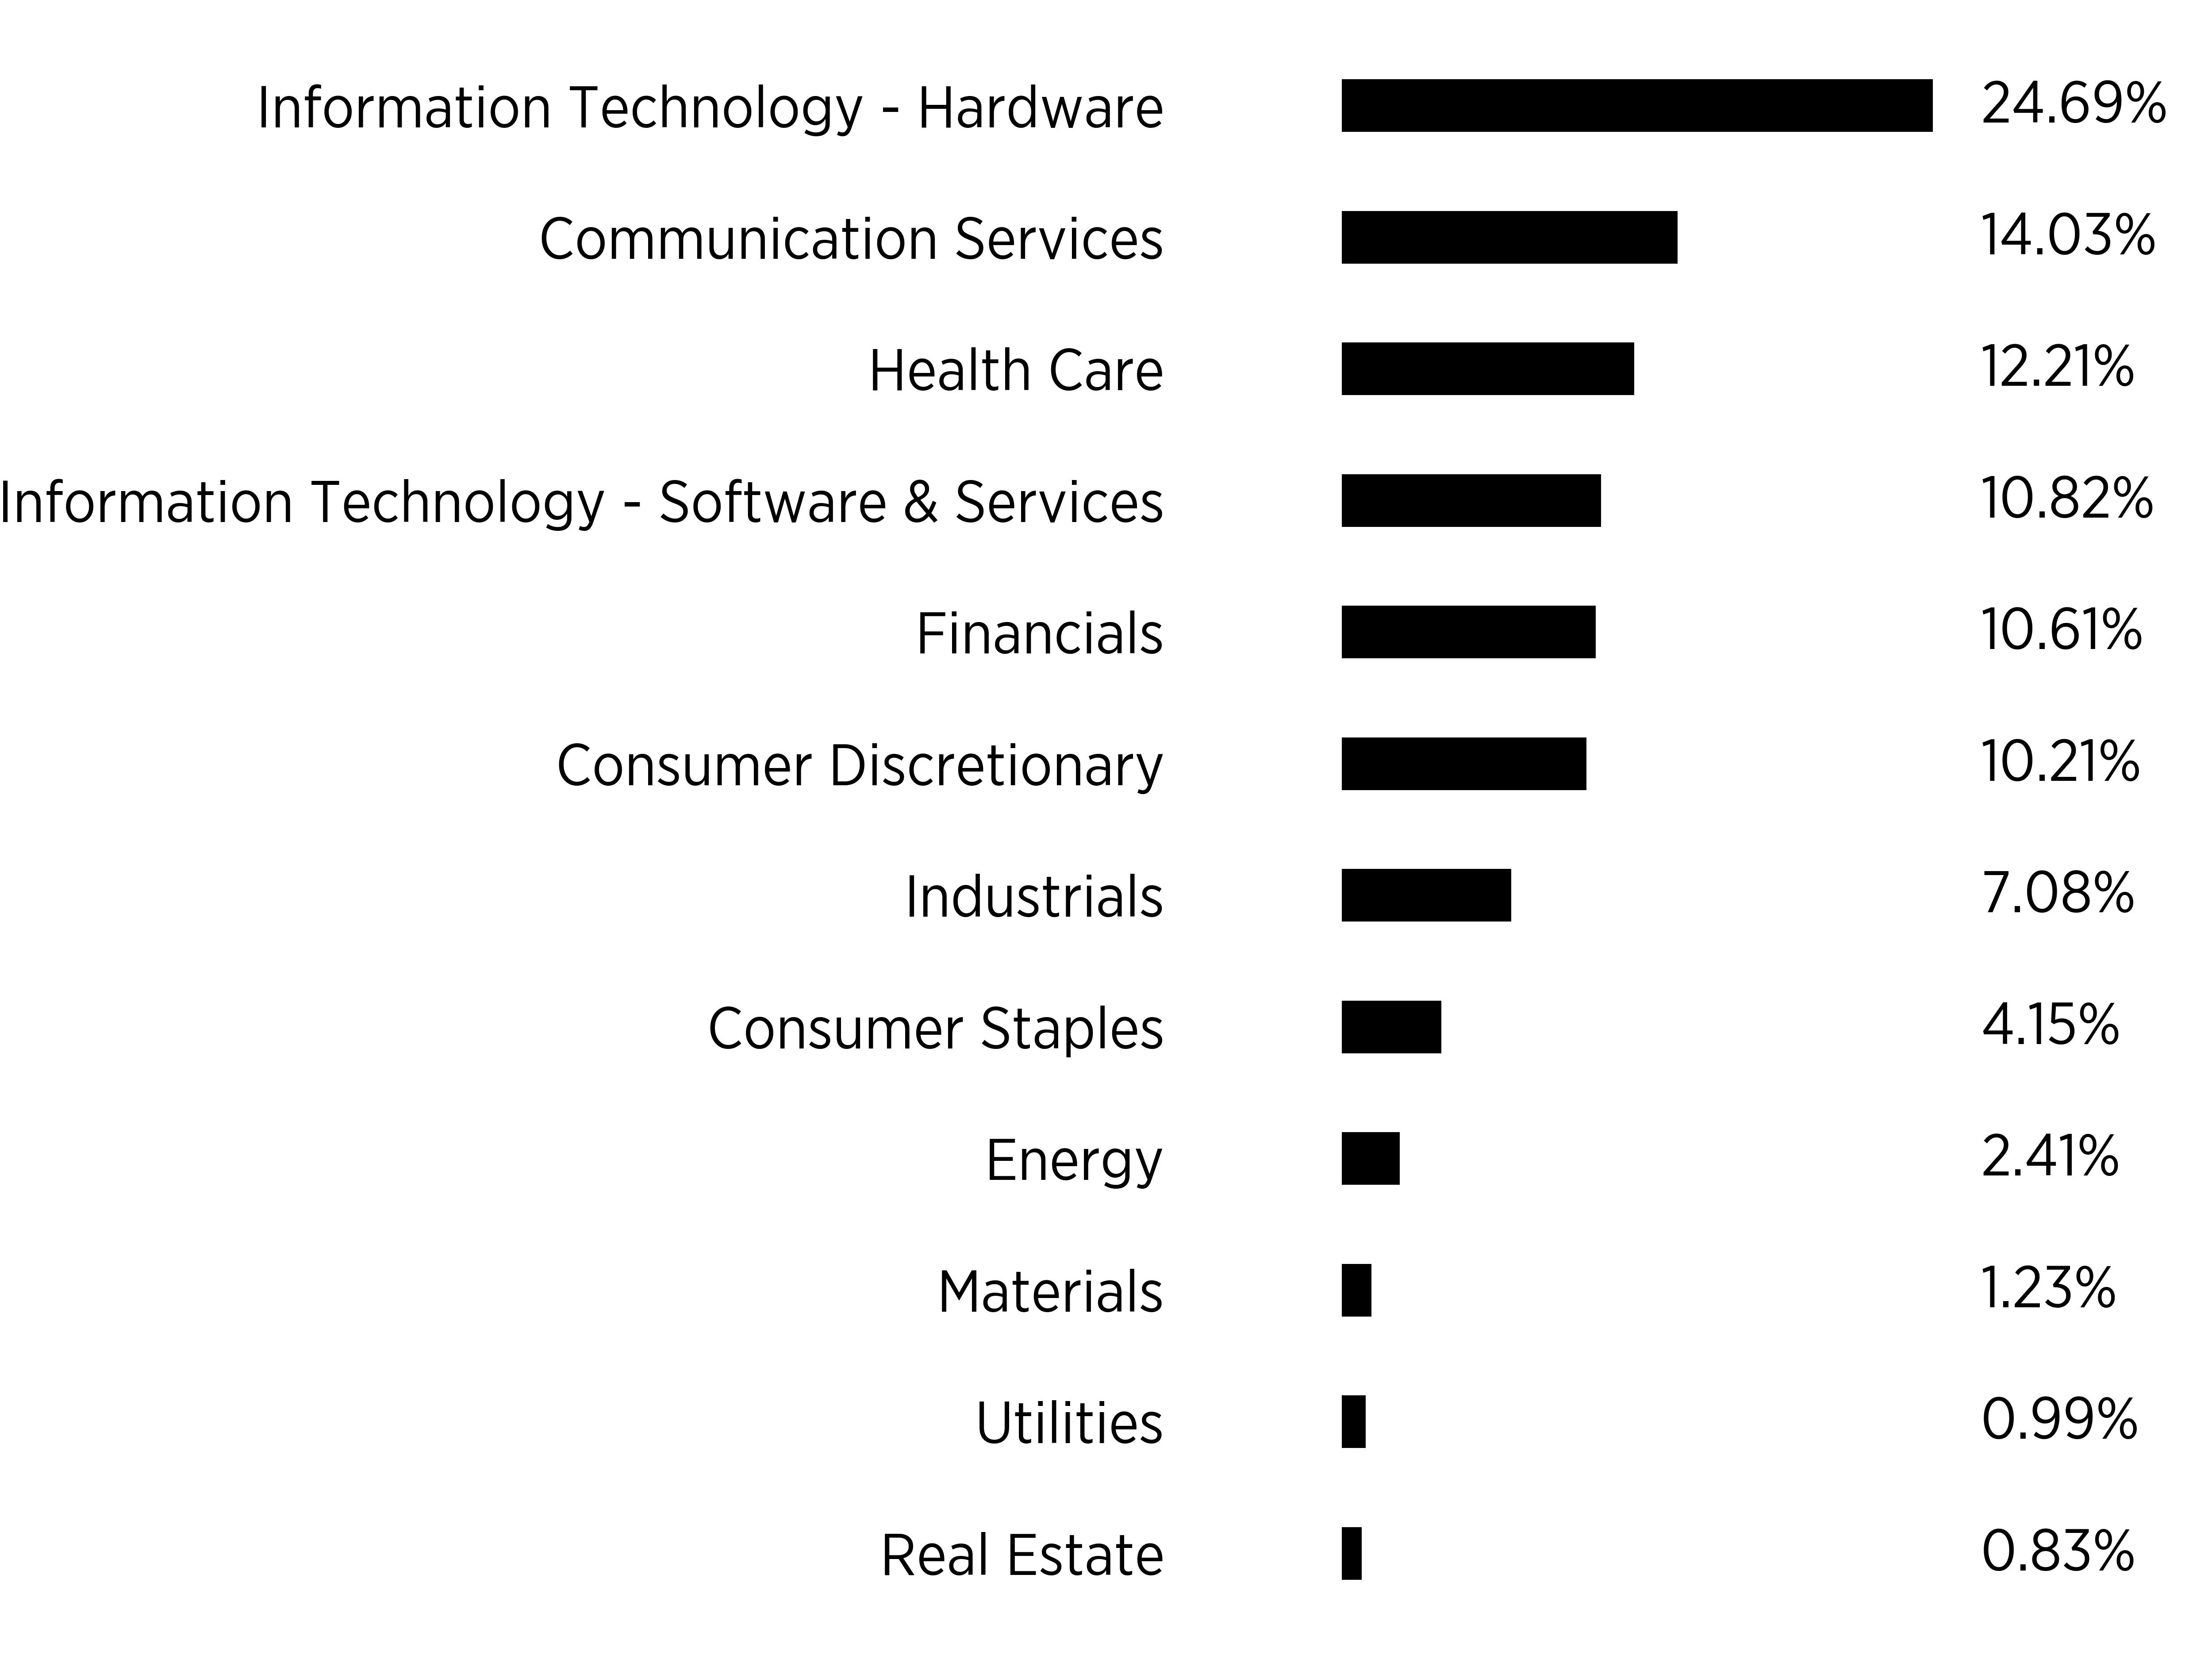
• US stocks rose in 2025, led by the continued appreciation of megacap technology stocks, especially those impacted by the rapid increase AI investment over the course of the year. The performance of the US benchmark was strongest in Communication Services, Information Technology and Industrial sectors.
• The Fund outpaced the benchmark’s gains in 2025. The Fund benefited from stock selection, primarily in Information Technology, Communication Services, and Health Care, and further benefited by sector allocation, aided by overweighting Communication Services and Information Technology while underweighting Real Estate and Consumer Staples.
• The Fund’s emphasis on avoiding overvalued stocks that are poor stewards of shareholder capital contributed to benchmark outperformance on the year. Overvalued stocks, low profit/high growth stocks and firms with intrinsic value less than book value lagged the overall market, while firms reliant on external financing outperformed.
Cumulative Performance
(based on a hypothetical $10,000 investment)
| * | Inception |
Annual Performance
|
|
1
year
|
Average
Annual
Total
Return
Since
Inception
|
|---|---|---|
|
Applied
Finance Valuation Large Cap ETF
|
20.41%
|
13.53%
|
|
Morningstar
US Market Total Return Index¹
|
17.35%
|
11.62%
|
¹ The Fund is not sponsored, endorsed, sold or promoted by Morningstar, Inc. or any of its affiliates (all such entities, collectively, “Morningstar Entities”). The Morningstar Entities make no representation or warranty, express or implied. to the owners of the Fund or any member of the public regarding the advisability of investing in equities generally or in the Fund in particular or the ability of the Morningstar Indexes to track general equity market performance.
Key Fund Statistics
(as of December 31, 2025)
|
Fund
Net Assets
|
$386,761,862
|
|
Number
of Holdings
|
592
|
|
Total
Net Advisory Fee
|
$1,342,781
|
|
Portfolio
Turnover Rate
|
23.56%
|
Sector Breakdown
|
Top
Ten Holdings
|
|
|---|---|
|
Apple,
Inc.
|
|
|
Nvidia
Corp.
|
|
|
Alphabet,
Inc. Class A
|
|
|
Microsoft
Corp.
|
|
|
Meta
Platforms, Inc.
|
|
|
Amazon.com,
Inc.
|
|
|
Visa,
Inc. Class A
|
|
|
Mastercard,
Inc. Class A
|
|
|
Broadcom,
Inc.
|
|
|
Johnson
& Johnson
|
What were the Fund costs for the period?
(based on a hypothetical $10,000 investment)
|
Fund
Name
|
Costs
of a $10,000 investment
|
Costs
paid as a percentage of a $10,000 investment
|
|---|---|---|
|
Applied
Finance IVS US SMID ETF
|
$5¹
|
0.59%²
|
| ¹ | Costs are for the period of December 4, 2025 to December 31, 2025. Costs for a full annual period would be higher. |
| ² | Annualized. |
Key Fund Statistics
(as of December 31, 2025)
|
Fund
Net Assets
|
$5,668,555
|
|
Number
of Holdings
|
358
|
|
Total
Net Advisory Fee
|
$2,274
|
|
Portfolio
Turnover Rate
|
0.25%
|
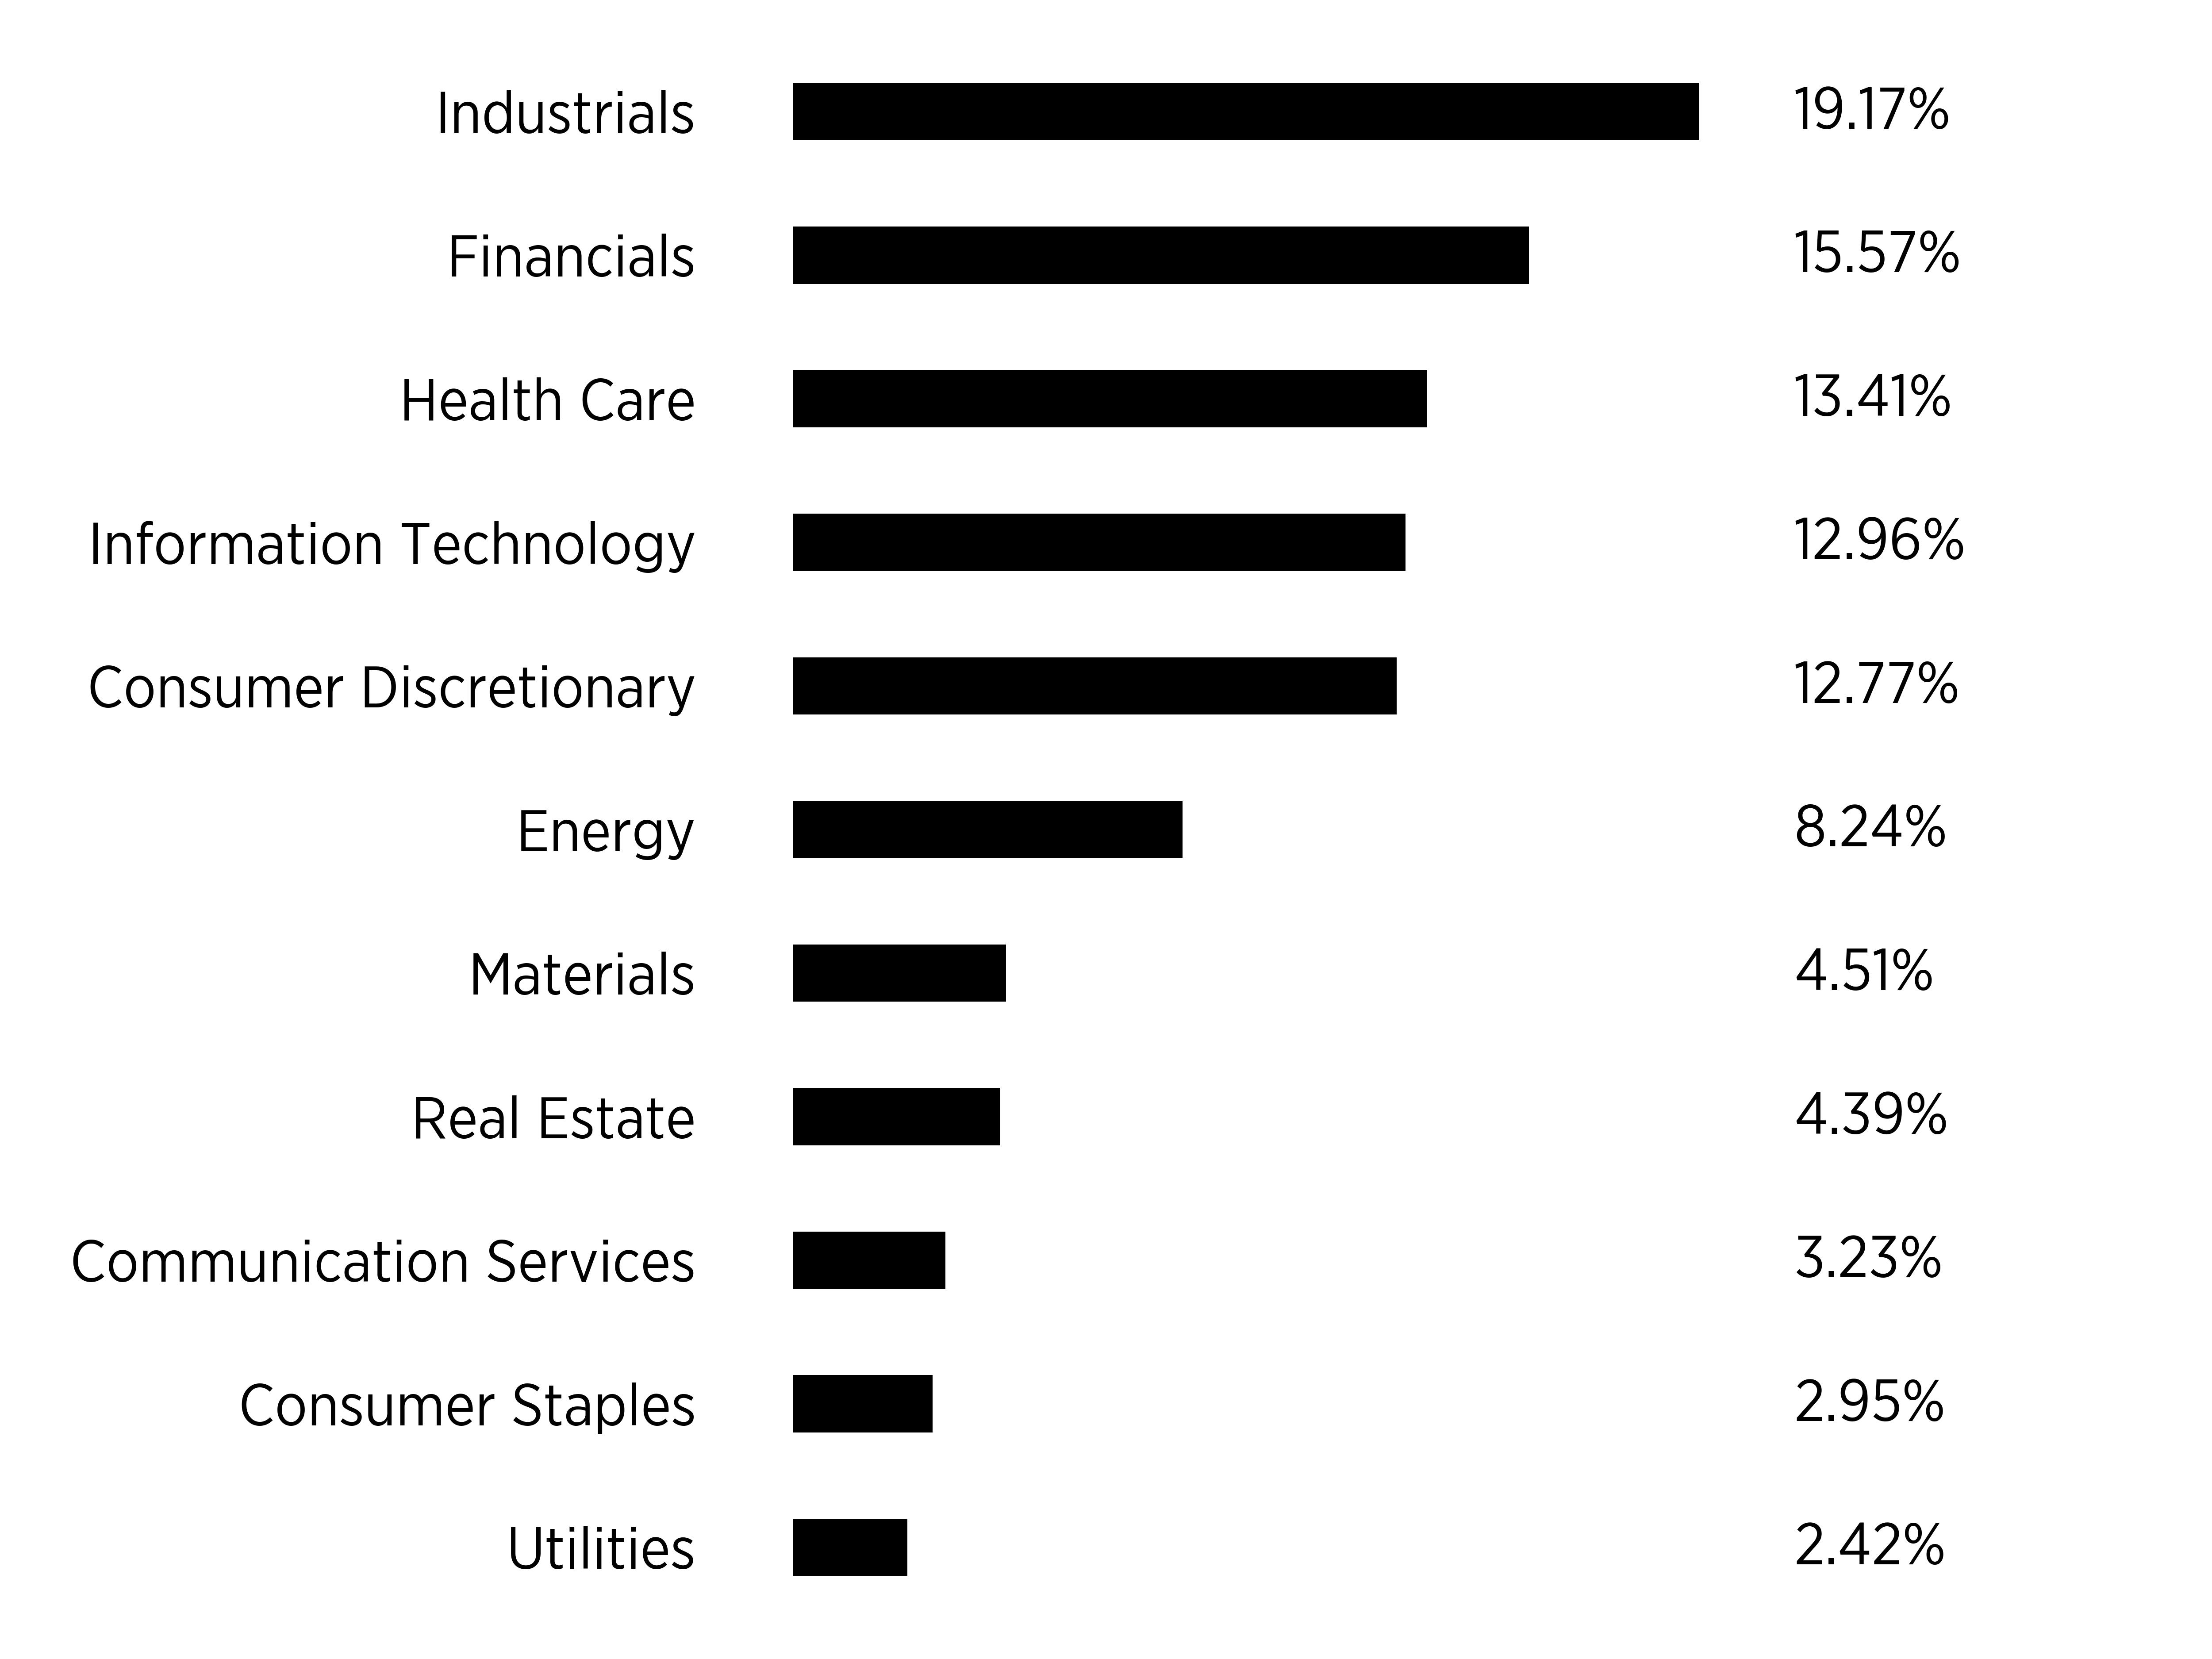
Sector Breakdown
|
Top
Ten Holdings
|
|
|---|---|
|
Ryman
Hospitality Properties, Inc.
|
|
|
Nextpower,
Inc.
|
|
|
The
Ensign Group, Inc
|
|
|
InterDigital,
Inc.
|
|
|
Maximus,
Inc.
|
|
|
Option
Care Health, Inc.
|
|
|
Southwest
Gas Corp.
|
|
|
PJT
Partners, Inc.
|
|
|
Fabrinet
|
|
|
Atmus
Filtration Technologies, Inc.
|
What were the Fund costs for the period?
(based on a hypothetical $10,000 investment)
|
Fund
Name
|
Costs
of a $10,000 investment
|
Costs
paid as a percentage of a $10,000 investment
|
|---|---|---|
|
Applied
Finance IVS International Large ETF
|
$4¹
|
0.65%²
|
| ¹ | Costs are for the period of December 11, 2025 to December 31, 2025. Costs for a full annual period would be higher. |
| ² | Annualized. |
Key Fund Statistics
(as of December 31, 2025)
|
Fund
Net Assets
|
$5,787,524
|
|
Number
of Holdings
|
188
|
|
Total
Net Advisory Fee
|
$1,592
|
|
Portfolio
Turnover Rate
|
0.00%
|
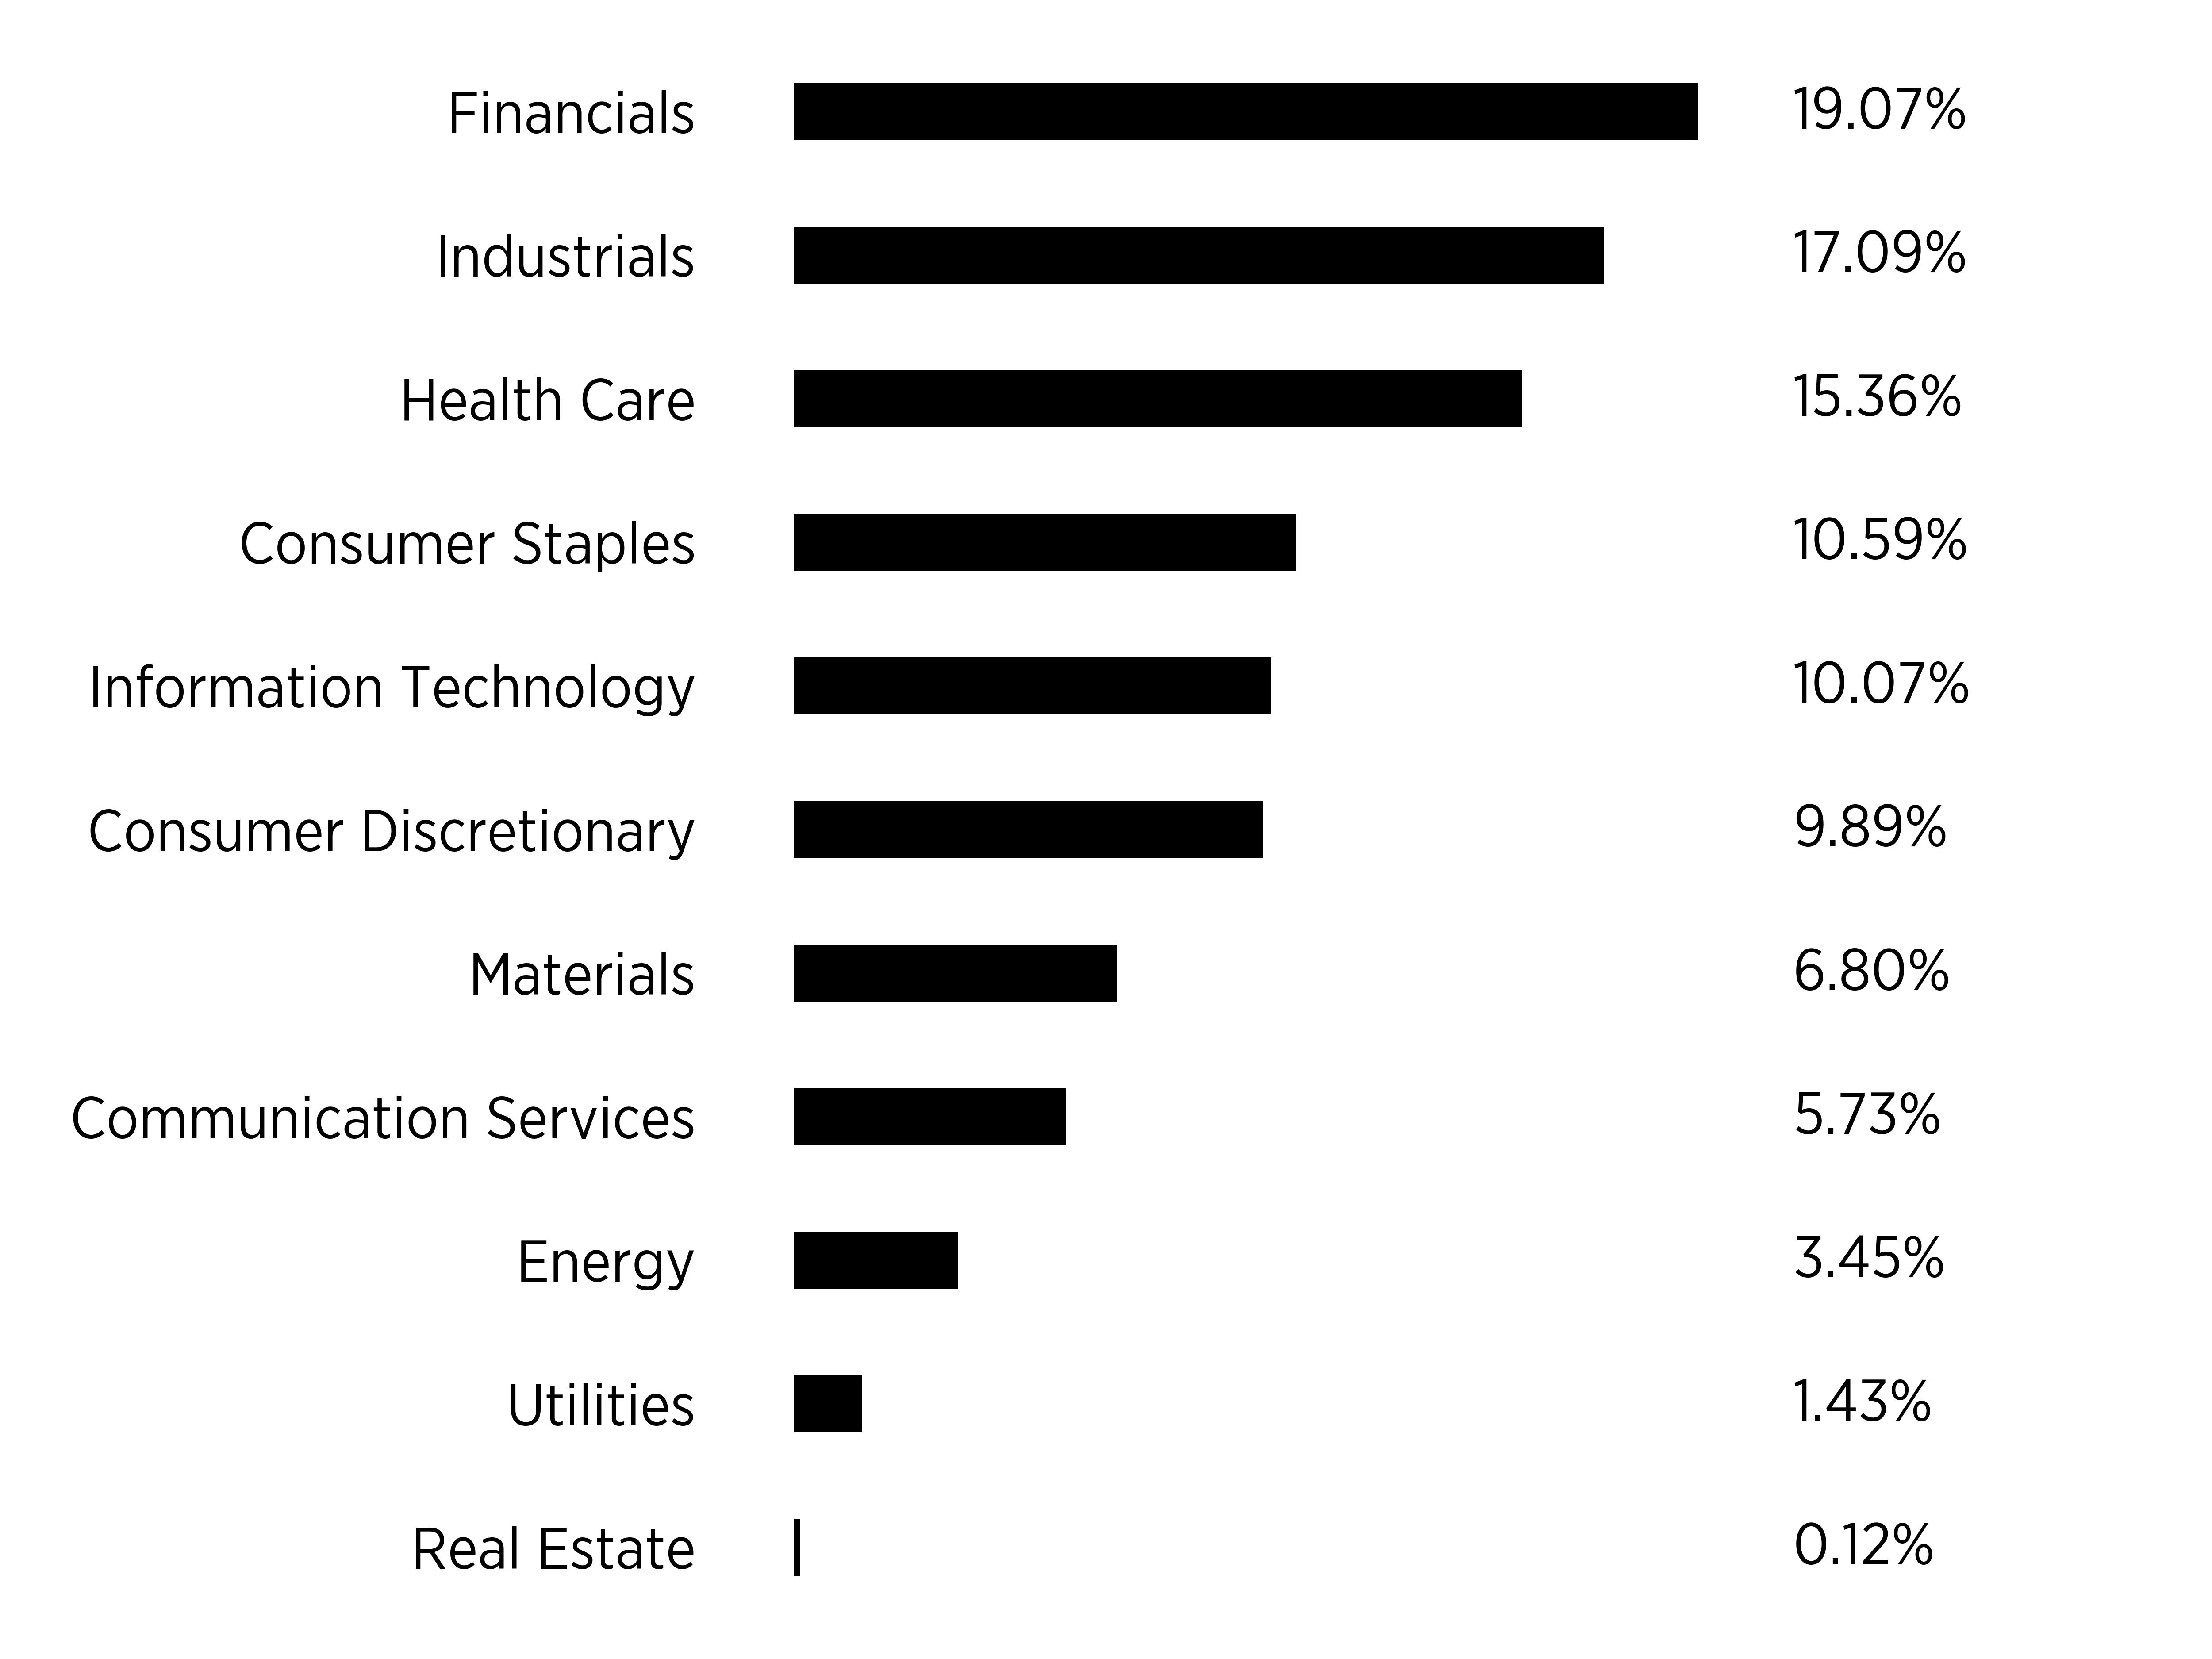
Sector Breakdown
|
Top
Ten Holdings
|
|
|---|---|
|
ASML
Holding NV
|
|
|
Roche
Holding AG
|
|
|
AstraZeneca
plc
|
|
|
Novartis
AG
|
|
|
Deutsche
Telekom AG
|
|
|
LVMH
Moet Hennessy Louis Vuitton
|
|
|
L'Oreal
SA
|
|
|
Mitsubishi
UFJ Financial Group
|
|
|
Unilever
plc
|
|
|
Rio
Tinto Ltd.
|
| [1] | Costs are for the period of December 4, 2025 to December 31, 2025. Costs for a full annual period would be higher. |
| [2] | Annualized. |
| [3] | Costs are for the period of December 11, 2025 to December 31, 2025. Costs for a full annual period would be higher. |
| [4] | Annualized. |