Value of Initial Fixed $100 | ||||||||||||||||||||||||||||||
Investment Based on |
|
| ||||||||||||||||||||||||||||
Summary | Summary | Average Summary | Average | Peer Group |
|
| ||||||||||||||||||||||||
Compensation | Compensation | Compensation | Compensation | Compensation | Compensation | Total | Total | Net | Adjusted | |||||||||||||||||||||
Table Total | Actually Paid | Table Total | Actually Paid | Table Total for | Actually Paid to | Shareholder | Shareholder | Income | Diluted | |||||||||||||||||||||
Year | for PEO | to PEO | for Former PEO | to Former PEO | Non-PEO NEOs | Non-PEO NEOs | Return | Return | $MM | EPS | ||||||||||||||||||||
($)(a) | ($)(b) | ($)(a) | ($)(b) | ($)(c) | ($)(d) | ($)(e) | ($)(f) | ($) | ($)(g) | |||||||||||||||||||||
2025 | $ | 32,530,984 | $ | 57,365,441 | $ | — | $ | — | $ | 12,123,281 | $ | 24,187,185 | $ | 259.36 | $ | 186.74 | $ | 4,226 | $ | 10.00 | ||||||||||
2024 | 18,492,517 | 33,323,947 | 28,502,888 | 67,567,568 | 11,314,957 | 20,324,464 | 194.82 | 150.75 | 4,278 | 10.12 | ||||||||||||||||||||
2023 | 25,661,972 | 34,672,518 | 12,319,311 | 12,199,327 | 163.86 | 143.33 | 4,863 | 11.11 | ||||||||||||||||||||||
2022 | 26,287,185 | 67,395,343 | 9,125,252 | 20,275,581 | 164.23 | 133.03 | 11,836 | 13.77 | ||||||||||||||||||||||
2021 | 23,912,154 | 66,387,875 | 11,035,630 | 24,203,425 | 132.40 | 123.44 | 11,542 | 11.83 | ||||||||||||||||||||||
(a) | The dollar amounts reported are the total compensation reported for Mr. Michael (PEO) for fiscal years 2024 and 2025, and Mr. Gonzalez (former PEO, who served as PEO until July 1, 2024) for fiscal years 2021, 2022, 2023 and 2024 in the “Total” column of the Summary Compensation Table. |
(b) | The dollar amounts reported represent the “compensation actually paid” to Mr. Michael for fiscal years 2024 and 2025, and to Mr. Gonzalez (former PEO) for fiscal years 2021, 2022 and 2023, and 2024, as computed in accordance with Item 402(v) of Regulation S-K. The dollar amounts do not reflect the actual amount of compensation earned by or paid to Mr. Michael or Mr. Gonzalez during such fiscal years and are based on valuation assumptions required by the SEC, which are unlikely to reflect actual amounts realized at vesting or exercise (as applicable). In accordance with the requirements of Item 402(v) of Regulation S-K, the reported “Total” in the Summary Compensation Table for the applicable year is adjusted to determine the “compensation actually paid” amount as follows: |
| (1) | The amount reflected in the “Stock Award” and “Option Award” columns of the Summary Compensation Table with respect to Mr. Michael and Mr. Gonzalez has been deducted from the Summary Compensation Table Total and substituted with an equity award value for each year calculated by adding or subtracting, as applicable, the following: (i) the year-end fair value of any equity awards granted in the applicable fiscal year that are outstanding and unvested as of the end of such year, accounting for any banking of the award resulting from adjusted diluted EPS |
| performance (as reflected in footnote (2) to the Outstanding Equity Awards at Fiscal Year End Table); (ii) the change in fair value from the end of the prior fiscal year of any awards granted in prior fiscal years that are outstanding and unvested as of the end of the applicable fiscal year, accounting for any adjustment based on relative TSR performance on awards for which the performance period ends as of this date (as reflected in footnote (2) to the Outstanding Equity Awards at Fiscal Year End Table); (iii) for awards granted in prior fiscal years that vested in the applicable fiscal year, the amount equal to the change in value as of the vesting date (from the end of the prior fiscal year); and (iv) the dollar value of dividends accrued on equity awards in the applicable year prior to the vesting date (excluding option awards, which do not carry dividend equivalent rights) that are not otherwise reflected in the fair value of such award or included in any other component of total compensation for the applicable fiscal year. The valuation assumptions used to calculate fair values on equity awards other than options are the same as those disclosed at the time of grant. Stock option awards are valued using a Black-Scholes model at the time of grant (as disclosed in footnote (2) to the Summary Compensation Table) with subsequent fair value calculations performed using a Lattice model. |
The amounts in the following table represent each of the amounts deducted and added to the equity award values for Mr. Michael for the 2025 fiscal year for purposes of computing the “compensation actually paid” amount appearing in column (b) of the pay versus performance table:
Grant Date | Year-end | Change in | Change in | ||||||||||||||||||
Total Equity | Fair Value of | Fair Value of | Fair Value as of | Fair Value as of | |||||||||||||||||
Value | Equity Awards | Equity Awards | Year-End of Any | the Vesting Date | Total | ||||||||||||||||
Reflected in | Granted | Granted | Prior Year | of Any Prior Year | Equity Value | ||||||||||||||||
Summary | During | During | Awards that | Awards that | Reflected in | ||||||||||||||||
Compensation | Applicable | Applicable | Remain Unvested | Vested During | Compensation | ||||||||||||||||
Year | PEO Name | Table | Year | Year | as of Year-End | Applicable Year | Actually Paid | ||||||||||||||
2025 | Robert A. Michael | $ | 16,467,610 | $ | (16,467,610) | $ | 33,774,613 | $ | 12,801,133 | $ | 2,315,453 | $ | 48,891,199 | ||||||||
| (2) | The pension benefit value reported in the “Change in Pension Value and Non-qualified Deferred Compensation Earnings” column of the Summary Compensation Table for the 2025 fiscal year is adjusted to account for the aggregate of two components: (i) the actuarially determined service cost for services rendered by Mr. Michael during 2025 (the “service cost”); and (ii) the entire cost of benefits granted in a plan amendment during 2025 that are attributed by the benefit formula to services rendered in periods prior to the plan amendment (the “prior service cost”), in each case, calculated in accordance with U.S. GAAP. |
The amounts in the following table represent each of the amounts deducted and added to the change in pension value for Mr. Michael for the 2025 fiscal year for purposes of computing the “compensation actually paid” amount appearing in column (b) of the pay versus performance table:
Total Change | ||||||||||||||||||
in Pension | Prior | Total Change in | ||||||||||||||||
Value Reflected | Change in | Service Costs | Service Costs | Pension Value | ||||||||||||||
in the Summary | Pension Value | Attributable | Introduced | Reflected in | ||||||||||||||
Compensation | for the | to the | During the | Compensation | ||||||||||||||
Year | PEO Name | Table | Applicable Year | Applicable Year | Applicable Year | Actually Paid | ||||||||||||
2025 | Robert A. Michael | $ | 8,147,000 | $ | (8,147,000) | $ | 557,868 | $ | N/A | $ | 557,868 | |||||||
(c) | The dollar amounts reported represent the average of the amounts reported for AbbVie’s named executive officers (NEOs) as a group (excluding the PEO) in the “Total” column of the Summary Compensation Table in each applicable fiscal year. The names of each of the NEOs included for purposes of calculating the average amounts in each applicable year are as follows: (i) for 2025, S. Reents, J. Stewart, A. Saleki-Gerhardt and R. Thakkar; (ii) for 2024, S. Reents, J. Stewart, A. Saleki-Gerhardt and T. Richmond; (iii) for 2023, R. Michael, S. Reents, J. Stewart and A. Saleki-Gerhardt; (iv) for 2022, R. Michael, S. Reents, L. Schumacher, J. Stewart and A. Saleki-Gerhardt; and (v) for 2021, R. Michael, L. Schumacher, M. Severino and J. Stewart. |
(d) | The dollar amounts reported represent the average amount of “compensation actually paid” to the NEOs as a group (excluding the PEO), as computed in accordance with Item 402(v) of Regulation S-K. The dollar amounts do not reflect the actual amount of compensation earned by or paid to the NEOs as a group (excluding the PEO) during such fiscal years and are based on valuation assumptions required by the SEC, which are unlikely to reflect actual amounts realized at vesting or exercise (as applicable). The average total compensation for the NEOs as a group (excluding the PEO) for each year was adjusted using the same methodology described above in footnote (b) to determine the compensation actually paid. |
The amounts in the following table represent the average of the amounts deducted and added to the equity award values for AbbVie’s named executive officers (NEOs) as a group (excluding the PEO) for the 2025 fiscal year for purposes of computing the “compensation actually paid” amount appearing in column (d) of the pay versus performance table:
Grant Date | Year-end | Change in | Change in | |||||||||||||||||||
Total Equity | Fair Value of | Fair Value of | Fair Value as of | Fair Value as of | ||||||||||||||||||
Value | Equity Awards | Equity Awards | Year-End of Any | the Vesting Date | Total | |||||||||||||||||
Reflected in | Granted | Granted | Prior Year | of Any Prior Year | Equity Value | |||||||||||||||||
Summary | During | During | Awards that | Awards that | Reflected in | |||||||||||||||||
Compensation | Applicable | Applicable | Remain Unvested | Vested During | Compensation | |||||||||||||||||
Year | NEO Names | Table | Year | Year | as of Year-End | Applicable Year | Actually Paid | |||||||||||||||
2025 | See footnote (c) | $ | 5,493,397 | $ | (5,493,397) | $ | 11,266,889 | $ | 6,458,837 | $ | 1,325,284 | $ | 19,051,010 | |||||||||
The amounts in the following table represent each of the amounts deducted and added to the change in pension value for AbbVie’s named executive officers (NEOs) as a group (excluding the PEO) for the 2025 fiscal year for purposes of computing the “compensation actually paid” amount appearing in column (d) of the pay versus performance table:
Total Change | ||||||||||||||||||
in Pension | Prior | Total Change in | ||||||||||||||||
Value Reflected | Change in | Service Costs | Service Costs | Pension Value | ||||||||||||||
in the Summary | Pension Value | Attributable | Introduced | Reflected in | ||||||||||||||
Compensation | for the | to the | During the | Compensation | ||||||||||||||
Year | NEO Names | Table | Applicable Year | Applicable Year | Applicable Year | Actually Paid | ||||||||||||
2025 | See footnote (c) | $ | 1,853,071 | $ | (1,853,071) | $ | 359,361 | $ | N/A | $ | 359,361 |
(e) | Cumulative TSR is calculated by dividing the sum of the cumulative amount of dividends for the measurement period, assuming dividend reinvestment, and the difference between AbbVie’s share price at the end and the beginning of the measurement period by AbbVie's share price at the beginning of the measurement period. |
(f) | Represents the weighted peer group TSR, weighted according to the respective companies’ stock market capitalization at the beginning of each period for which a return is indicated. The peer group used for this purpose is the NYSE Arca Pharmaceutical Index, our peer group used for purposes of Item 201(e) of Regulation S-K. |
(g) | As required by Item 402(v) of Regulation S-K, AbbVie has determined that adjusted diluted EPS is the Company Selected Measure, as it is the most important financial performance measure (that is not otherwise required to be disclosed in the table) used to link compensation actually paid to AbbVie’s NEOs to company performance for the most recently completed fiscal year. Adjusted diluted EPS is a non-GAAP measure that represents diluted earnings per share adjusted to exclude certain specified items, as described in Appendix B. Adjusted diluted EPS includes an unfavorable impact related to acquired IPR&D and milestone expenses of $2.76 in 2025, $1.52 in 2024, $0.42 in 2023, $0.39 in 2022, and $0.90 in 2021. |
(f) | Represents the weighted peer group TSR, weighted according to the respective companies’ stock market capitalization at the beginning of each period for which a return is indicated. The peer group used for this purpose is the NYSE Arca Pharmaceutical Index, our peer group used for purposes of Item 201(e) of Regulation S-K. |
(b) | The dollar amounts reported represent the “compensation actually paid” to Mr. Michael for fiscal years 2024 and 2025, and to Mr. Gonzalez (former PEO) for fiscal years 2021, 2022 and 2023, and 2024, as computed in accordance with Item 402(v) of Regulation S-K. The dollar amounts do not reflect the actual amount of compensation earned by or paid to Mr. Michael or Mr. Gonzalez during such fiscal years and are based on valuation assumptions required by the SEC, which are unlikely to reflect actual amounts realized at vesting or exercise (as applicable). In accordance with the requirements of Item 402(v) of Regulation S-K, the reported “Total” in the Summary Compensation Table for the applicable year is adjusted to determine the “compensation actually paid” amount as follows: |
| (1) | The amount reflected in the “Stock Award” and “Option Award” columns of the Summary Compensation Table with respect to Mr. Michael and Mr. Gonzalez has been deducted from the Summary Compensation Table Total and substituted with an equity award value for each year calculated by adding or subtracting, as applicable, the following: (i) the year-end fair value of any equity awards granted in the applicable fiscal year that are outstanding and unvested as of the end of such year, accounting for any banking of the award resulting from adjusted diluted EPS |
| performance (as reflected in footnote (2) to the Outstanding Equity Awards at Fiscal Year End Table); (ii) the change in fair value from the end of the prior fiscal year of any awards granted in prior fiscal years that are outstanding and unvested as of the end of the applicable fiscal year, accounting for any adjustment based on relative TSR performance on awards for which the performance period ends as of this date (as reflected in footnote (2) to the Outstanding Equity Awards at Fiscal Year End Table); (iii) for awards granted in prior fiscal years that vested in the applicable fiscal year, the amount equal to the change in value as of the vesting date (from the end of the prior fiscal year); and (iv) the dollar value of dividends accrued on equity awards in the applicable year prior to the vesting date (excluding option awards, which do not carry dividend equivalent rights) that are not otherwise reflected in the fair value of such award or included in any other component of total compensation for the applicable fiscal year. The valuation assumptions used to calculate fair values on equity awards other than options are the same as those disclosed at the time of grant. Stock option awards are valued using a Black-Scholes model at the time of grant (as disclosed in footnote (2) to the Summary Compensation Table) with subsequent fair value calculations performed using a Lattice model. |
The amounts in the following table represent each of the amounts deducted and added to the equity award values for Mr. Michael for the 2025 fiscal year for purposes of computing the “compensation actually paid” amount appearing in column (b) of the pay versus performance table:
Grant Date | Year-end | Change in | Change in | ||||||||||||||||||
Total Equity | Fair Value of | Fair Value of | Fair Value as of | Fair Value as of | |||||||||||||||||
Value | Equity Awards | Equity Awards | Year-End of Any | the Vesting Date | Total | ||||||||||||||||
Reflected in | Granted | Granted | Prior Year | of Any Prior Year | Equity Value | ||||||||||||||||
Summary | During | During | Awards that | Awards that | Reflected in | ||||||||||||||||
Compensation | Applicable | Applicable | Remain Unvested | Vested During | Compensation | ||||||||||||||||
Year | PEO Name | Table | Year | Year | as of Year-End | Applicable Year | Actually Paid | ||||||||||||||
2025 | Robert A. Michael | $ | 16,467,610 | $ | (16,467,610) | $ | 33,774,613 | $ | 12,801,133 | $ | 2,315,453 | $ | 48,891,199 | ||||||||
| (2) | The pension benefit value reported in the “Change in Pension Value and Non-qualified Deferred Compensation Earnings” column of the Summary Compensation Table for the 2025 fiscal year is adjusted to account for the aggregate of two components: (i) the actuarially determined service cost for services rendered by Mr. Michael during 2025 (the “service cost”); and (ii) the entire cost of benefits granted in a plan amendment during 2025 that are attributed by the benefit formula to services rendered in periods prior to the plan amendment (the “prior service cost”), in each case, calculated in accordance with U.S. GAAP. |
The amounts in the following table represent each of the amounts deducted and added to the change in pension value for Mr. Michael for the 2025 fiscal year for purposes of computing the “compensation actually paid” amount appearing in column (b) of the pay versus performance table:
Total Change | ||||||||||||||||||
in Pension | Prior | Total Change in | ||||||||||||||||
Value Reflected | Change in | Service Costs | Service Costs | Pension Value | ||||||||||||||
in the Summary | Pension Value | Attributable | Introduced | Reflected in | ||||||||||||||
Compensation | for the | to the | During the | Compensation | ||||||||||||||
Year | PEO Name | Table | Applicable Year | Applicable Year | Applicable Year | Actually Paid | ||||||||||||
2025 | Robert A. Michael | $ | 8,147,000 | $ | (8,147,000) | $ | 557,868 | $ | N/A | $ | 557,868 | |||||||
(d) | The dollar amounts reported represent the average amount of “compensation actually paid” to the NEOs as a group (excluding the PEO), as computed in accordance with Item 402(v) of Regulation S-K. The dollar amounts do not reflect the actual amount of compensation earned by or paid to the NEOs as a group (excluding the PEO) during such fiscal years and are based on valuation assumptions required by the SEC, which are unlikely to reflect actual amounts realized at vesting or exercise (as applicable). The average total compensation for the NEOs as a group (excluding the PEO) for each year was adjusted using the same methodology described above in footnote (b) to determine the compensation actually paid. |
The amounts in the following table represent the average of the amounts deducted and added to the equity award values for AbbVie’s named executive officers (NEOs) as a group (excluding the PEO) for the 2025 fiscal year for purposes of computing the “compensation actually paid” amount appearing in column (d) of the pay versus performance table:
Grant Date | Year-end | Change in | Change in | |||||||||||||||||||
Total Equity | Fair Value of | Fair Value of | Fair Value as of | Fair Value as of | ||||||||||||||||||
Value | Equity Awards | Equity Awards | Year-End of Any | the Vesting Date | Total | |||||||||||||||||
Reflected in | Granted | Granted | Prior Year | of Any Prior Year | Equity Value | |||||||||||||||||
Summary | During | During | Awards that | Awards that | Reflected in | |||||||||||||||||
Compensation | Applicable | Applicable | Remain Unvested | Vested During | Compensation | |||||||||||||||||
Year | NEO Names | Table | Year | Year | as of Year-End | Applicable Year | Actually Paid | |||||||||||||||
2025 | See footnote (c) | $ | 5,493,397 | $ | (5,493,397) | $ | 11,266,889 | $ | 6,458,837 | $ | 1,325,284 | $ | 19,051,010 | |||||||||
The amounts in the following table represent each of the amounts deducted and added to the change in pension value for AbbVie’s named executive officers (NEOs) as a group (excluding the PEO) for the 2025 fiscal year for purposes of computing the “compensation actually paid” amount appearing in column (d) of the pay versus performance table:
Total Change | ||||||||||||||||||
in Pension | Prior | Total Change in | ||||||||||||||||
Value Reflected | Change in | Service Costs | Service Costs | Pension Value | ||||||||||||||
in the Summary | Pension Value | Attributable | Introduced | Reflected in | ||||||||||||||
Compensation | for the | to the | During the | Compensation | ||||||||||||||
Year | NEO Names | Table | Applicable Year | Applicable Year | Applicable Year | Actually Paid | ||||||||||||
2025 | See footnote (c) | $ | 1,853,071 | $ | (1,853,071) | $ | 359,361 | $ | N/A | $ | 359,361 |
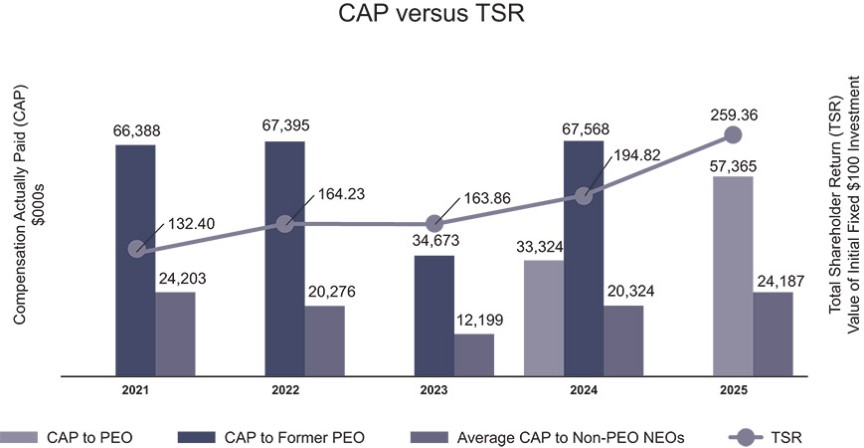
Comparison of “Compensation Actually Paid” to TSR
The chart below demonstrates that the “compensation actually paid” amounts shown for Mr. Michael (for 2024-2025) and Mr. Gonzalez (for 2021-2024) and average “compensation actually paid” to the other NEOs (see footnote (c) to the pay versus performance table) is aligned with AbbVie’s cumulative TSR over the five years presented in the table. The alignment of compensation actually paid with AbbVie’s cumulative TSR over the period presented reflects that a significant portion of the compensation actually paid to Mr. Michael and Mr. Gonzalez, as applicable, and to the other NEOs is comprised of equity awards. Moreover, AbbVie’s executive compensation philosophy and design is fundamentally based on a commitment to align pay and performance.
Comparison of “Compensation Actually Paid” to Net Income
AbbVie’s net income was approximately $11.5 billion in 2021, $11.8 billion in 2022, $4.9 billion in 2023, $4.3 billion in 2024, and $4.2 billion in 2025. Mr. Michael’s “compensation actually paid” was approximately $33 million in 2024 and $57 million in 2025. Mr. Gonzalez’s “compensation actually paid” was approximately $66 million in 2021, $67 million in 2022, $35 million in 2023 and $68 million in 2024. The average “compensation actually paid” to AbbVie’s other NEOs (see footnote (c) to the pay versus performance table) was approximately $24 million in 2021, $20 million in 2022, $12 million in 2023, $20 million in 2024, and $24 million in 2025.
Comparison of “Compensation Actually Paid” to Company-Selected Measure (Adjusted Diluted EPS)
AbbVie’s annualized adjusted diluted EPS was $11.83 in 2021, $13.77 in 2022, $11.11 in 2023, $10.12 in 2024, and $10.00 in 2025. Mr. Michael’s “compensation actually paid” was approximately $33 million in 2024 and $57 million in 2025. Mr. Gonzalez’s “compensation actually paid” was approximately $66 million in 2021, $67 million in 2022, $35 million in 2023, and $68 million in 2024, and the average “compensation actually paid” to AbbVie’s other NEOs (see footnote (c) to pay versus performance table) was approximately $24 million in 2021, $20 million in 2022, $12 million in 2023, $20 million in 2024, and $24 million in 2025. While AbbVie uses numerous financial and non-financial performance measures for the purpose of evaluating performance for our compensation programs, we have determined that adjusted diluted EPS is the financial performance measure that, in AbbVie’s assessment, represents the most important performance measure (that is not otherwise required to be disclosed in the table) used to link compensation actually paid to NEOs, for the most recently completed fiscal year, to AbbVie’s performance. AbbVie places significant emphasis on achieving positive EPS outcomes because it reflects strong operating dynamics in the underlying business, which is imperative for sustained long-term growth.
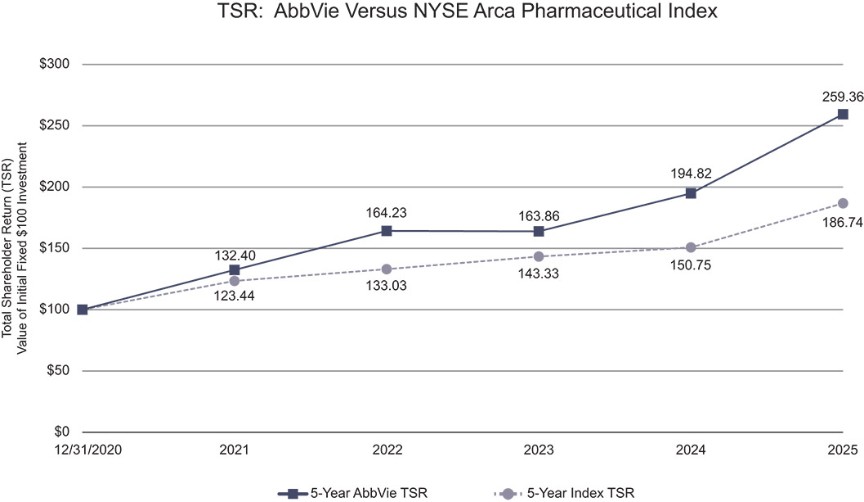
AbbVie TSR versus Peer Group TSR
The graph below shows AbbVie’s cumulative TSR over the five-year period ending with December 31, 2025 as compared to the NYSE Arca Pharmaceutical Index. AbbVie’s cumulative TSR outperformed our peer group during the five years presented in the table. Additionally, AbbVie is committed to a robust return of capital to stockholders with an increase of 204% in its quarterly dividend since 2015 as part of a balanced and disciplined capital allocation program, contributing to our strong cumulative TSR.
Most Important Performance Measures
The performance measures that AbbVie uses in our executive compensation program are selected based on the objective of incentivizing NEOs to achieve long-term, sustainable growth in stockholder value. As required by Item 402(v) of Regulation S-K, we have identified the following financial performance measures as being the most important in linking compensation actually paid to executives to AbbVie’s performance.
Adjusted Diluted Earnings Per Share |
Relative Return on Invested Capital |
Adjusted Return on Assets |
Non-GAAP Income Before Taxes |
Non-GAAP Operating Margin |
Platform Revenue |
Total Shareholder Return |
(g) | As required by Item 402(v) of Regulation S-K, AbbVie has determined that adjusted diluted EPS is the Company Selected Measure, as it is the most important financial performance measure (that is not otherwise required to be disclosed in the table) used to link compensation actually paid to AbbVie’s NEOs to company performance for the most recently completed fiscal year. Adjusted diluted EPS is a non-GAAP measure that represents diluted earnings per share adjusted to exclude certain specified items, as described in Appendix B. Adjusted diluted EPS includes an unfavorable impact related to acquired IPR&D and milestone expenses of $2.76 in 2025, $1.52 in 2024, $0.42 in 2023, $0.39 in 2022, and $0.90 in 2021. |