PAY VERSUS PERFORMANCE
Pay Versus Performance Table
| Year | Summary | Compensation | Average | Average | Total | Net Loss | |||||||
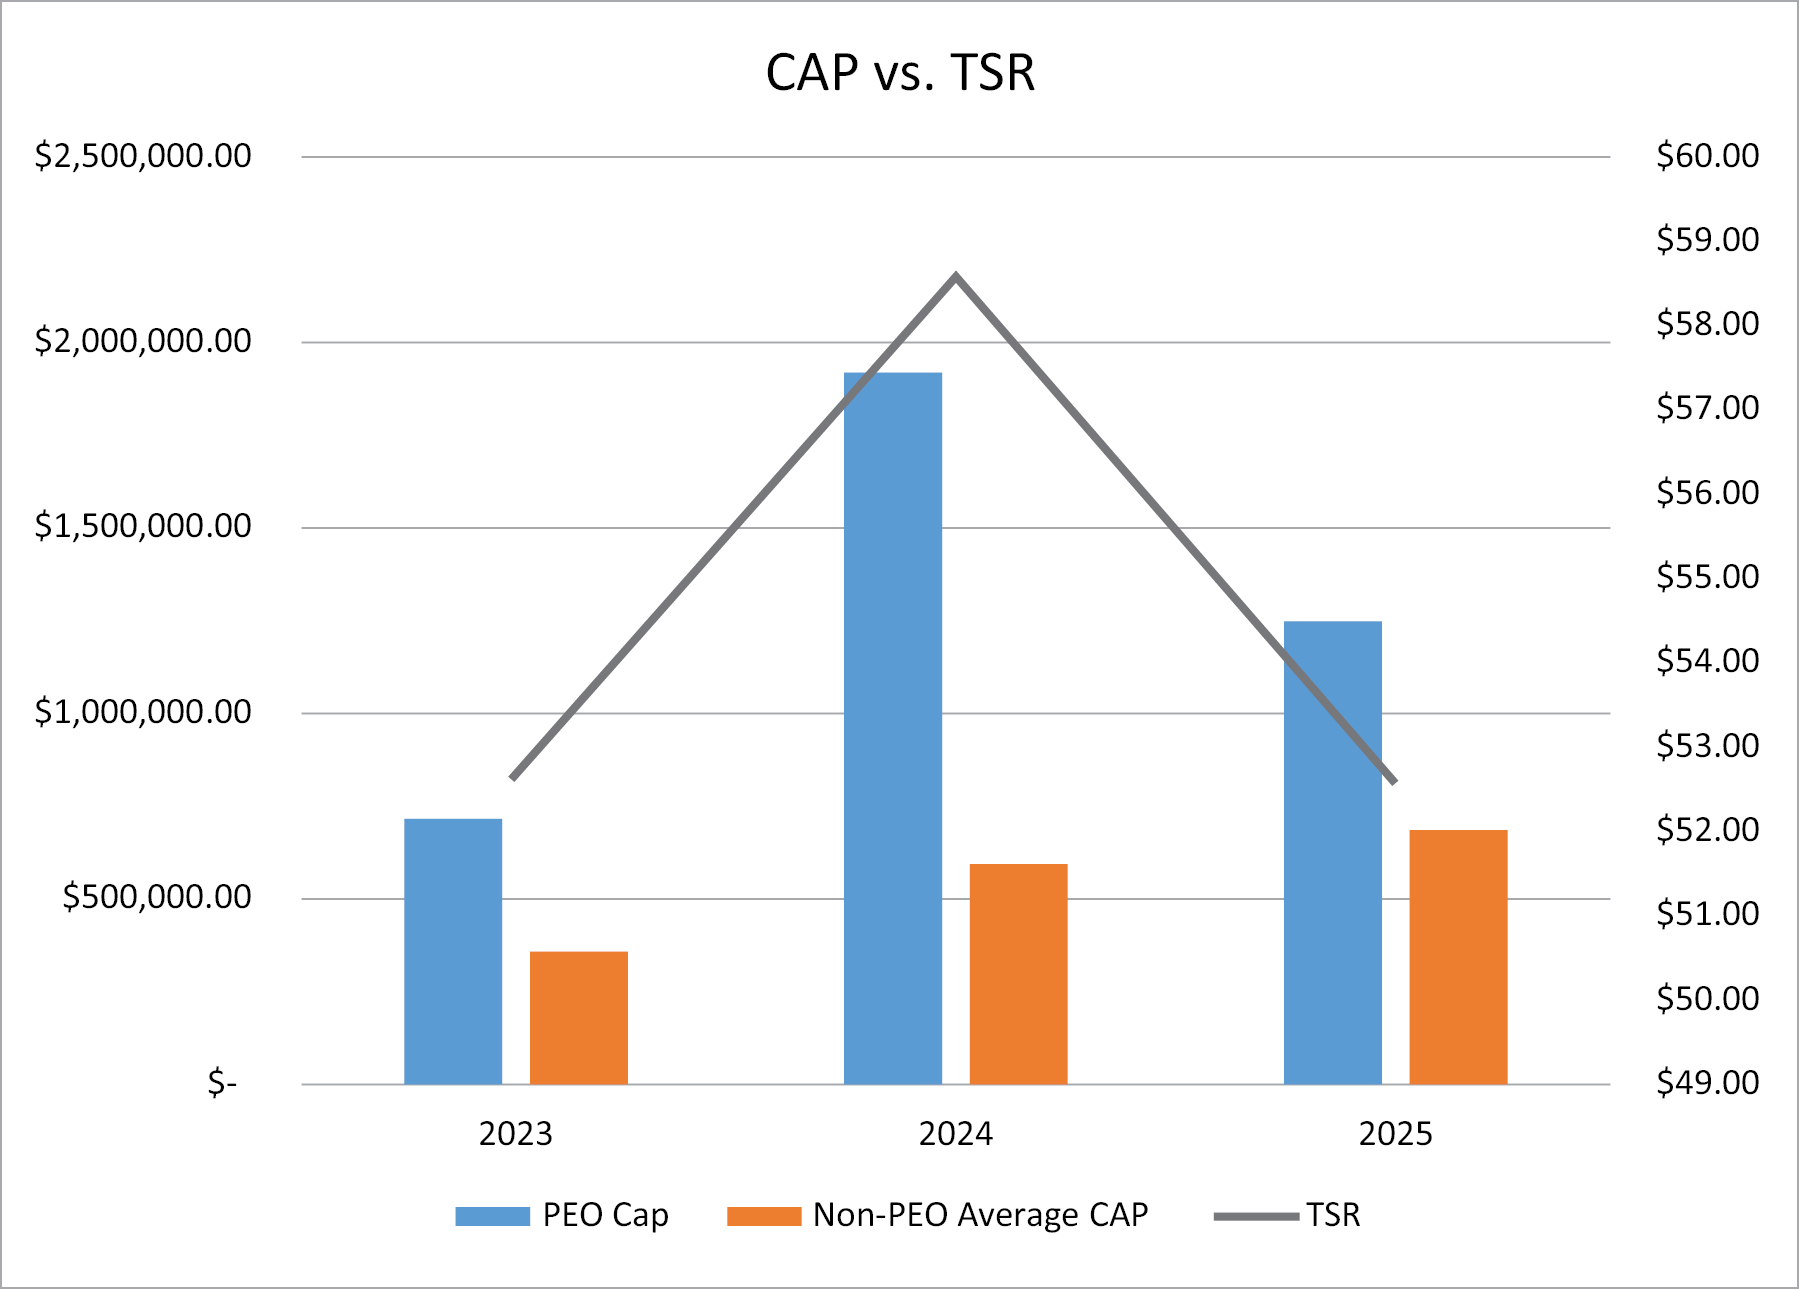
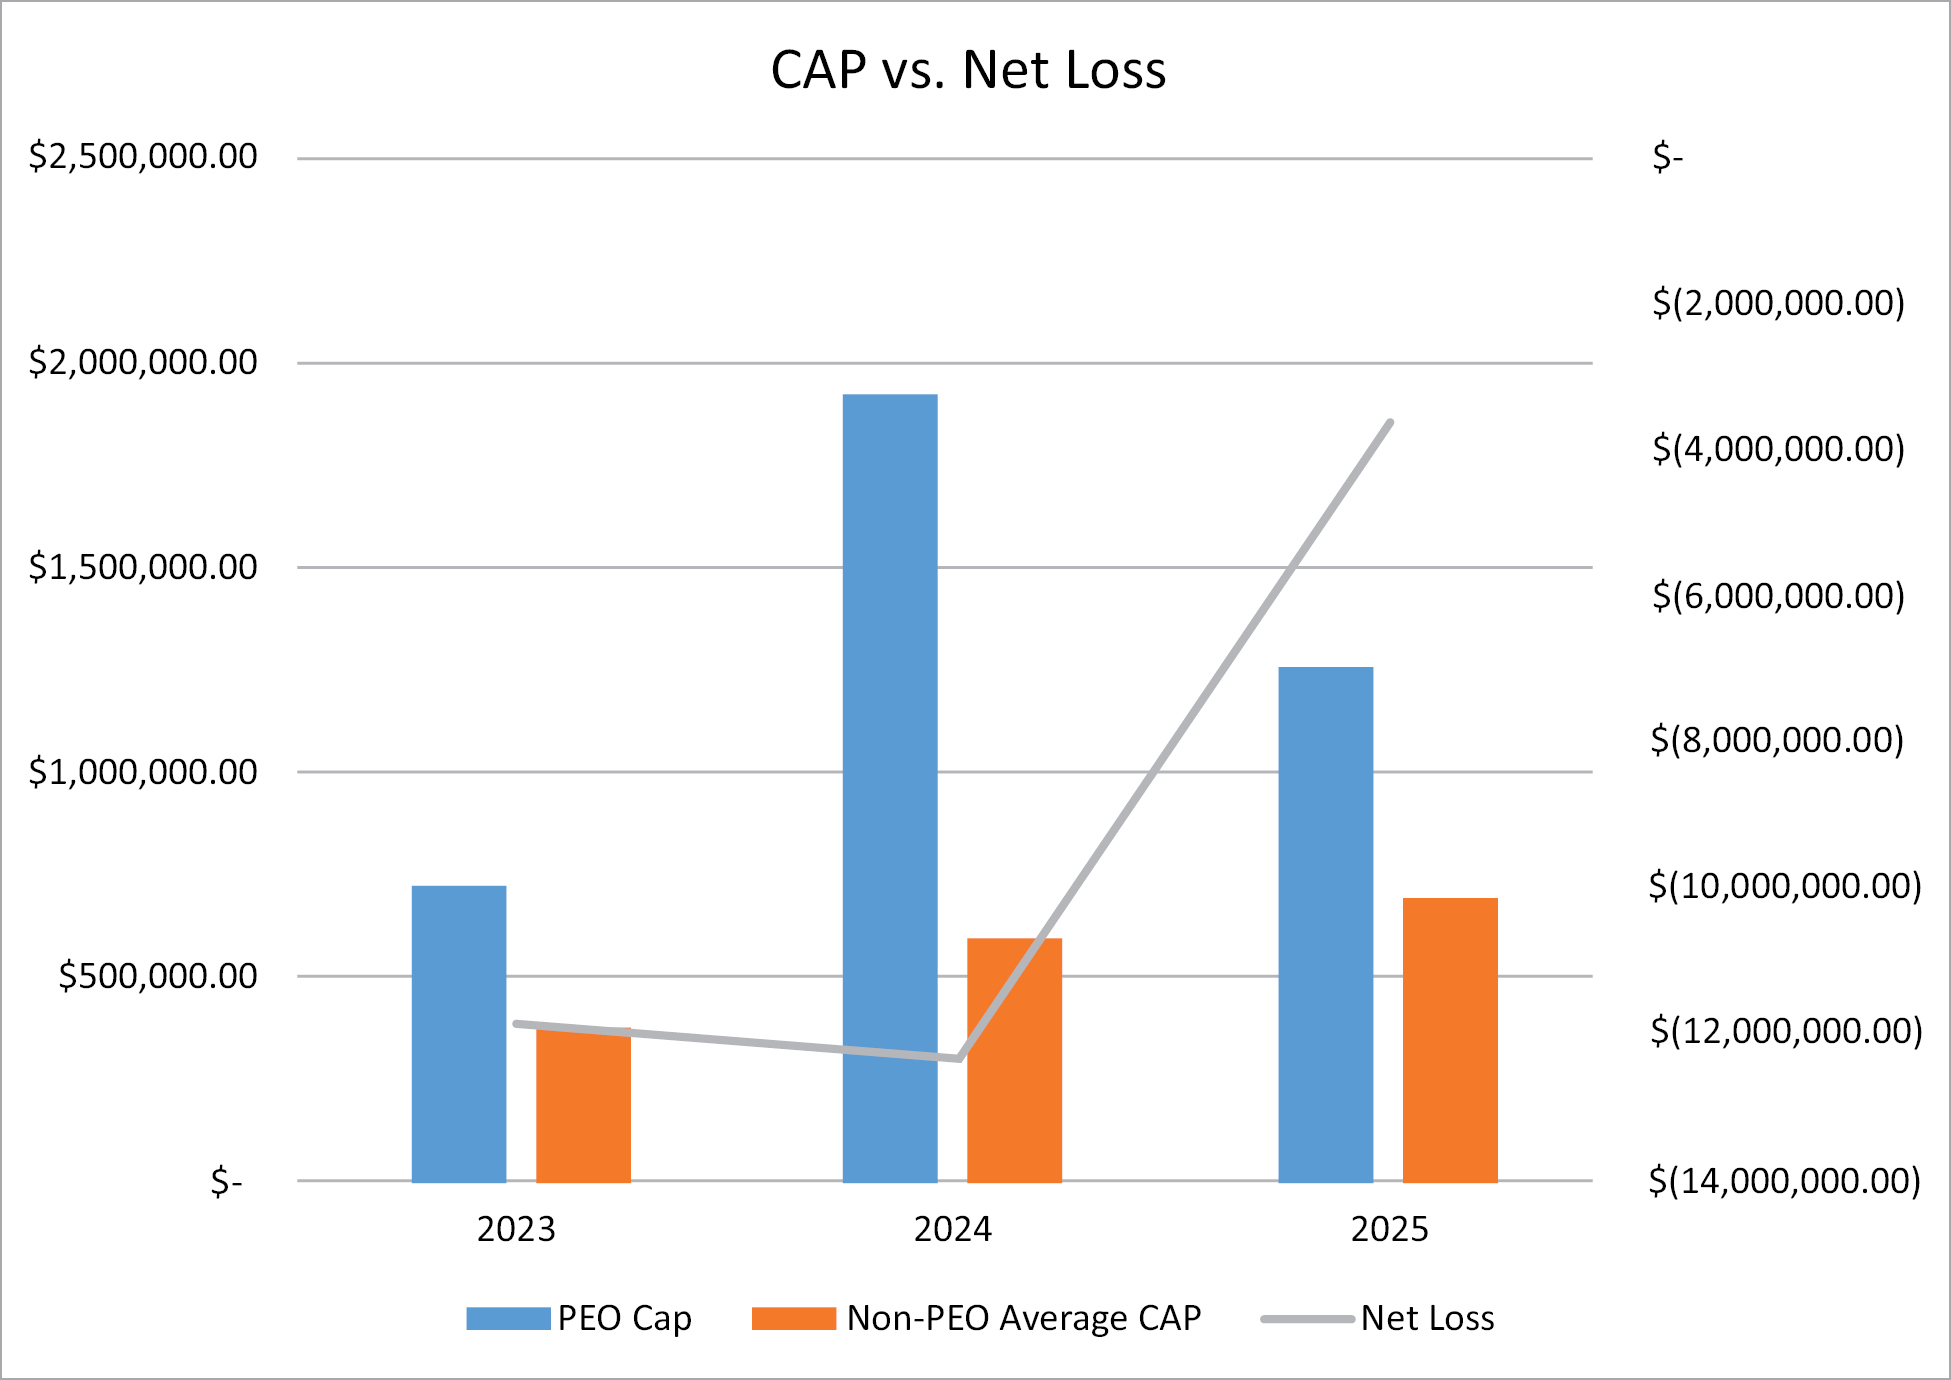
| 2025 | 1,154,436 | 1,254,676 | 605,598 | 689,726 | $ | 52.60 | 3,605,374 | ||||||
| 2024 | 1,995,745 | 1,923,606 | 655,350 | 593,882 | $ | 58.58 | 12,318,110 | ||||||
| 2023 | 989,558 | 716,284 | 423,936 | 362,534 | $ | 52.66 | 11,859,491 | ||||||
(1) Reflects the amount reported in the “Total” column of the Summary Compensation Table for Mr. Rosa for each corresponding year.
(2) Amounts reported reflect CAP for Mr. Rosa, as computed in accordance with Item 402(v) of Regulation S-K, for each corresponding year, which amounts do not reflect the actual amount of compensation earned by or paid to Mr. Rosa during the applicable year. The adjustments below were made to Mr. Rosa’s total compensation for each year to determine the CAP for such fiscal year in accordance with the requirements of Item 402(v) of Regulation S-K.
| Year | Reported | Less | Reported | Plus | Equity | Equals | CAP for | ||||||||
| 2025 | 1,154,436 | 367,357 | 467,597 |
| 1,254,676 | ||||||||||
| 2024 | 1,995,745 | 1,245,577 | 1,173,438 |
| 1,923,606 | ||||||||||
| 2023 | 989,558 | 229,575 | (43,699 | ) | 716,284 | ||||||||||
(a) Amounts reflect the grant date fair value of equity awards as reported in the “Option Awards” and “Stock Awards” columns in the Summary Compensation Table for the applicable year.
(b) The equity award adjustments were calculated in accordance with Item 402(v) of Regulation S-K and include: (i) the year-end fair value of any equity awards granted in the applicable year that are outstanding and unvested as of the end of the year; (ii) the amount of change as of the end of the applicable year (from the end of the prior fiscal year) in fair value of any awards granted in prior years that are outstanding and unvested as of the end of the applicable year; and (iii) for awards granted in prior years that vest in the applicable year, the amount equal to the change as of the vesting date (from the end of the prior fiscal year) in fair value. The amounts deducted or added in calculating the equity award adjustments for Mr. Rosa are as follows:
| Year | Year End Fair | Year over Year | Change in Fair | Total | |||||||
| 2025 | 573,809 | (84,384 | ) | (21,828 | ) | 467,597 |
| ||||
| 2024 | 1,067,786 | 33,277 |
| 72,375 |
| 1,173,438 |
| ||||
| 2023 | 116,489 | (94,850 | ) | (65,337 | ) | (43,699 | ) | ||||
(3) Reflects the average amount reported in the “Total” column of the Summary Compensation Table for our other NEOs as a group (excluding Mr. Rosa) for each corresponding year. For the Fiscal Year 2024, the names of each of the other NEOs (excluding Mr. Rosa) included for purposes of calculating the average amounts are Mr. McClurg and Mr. Volker. For the Fiscal Years 2023 and 2022, the names of each of the other NEOs (excluding Mr. Rosa) included for purposes of calculating the average amounts are Mr. McClurg and Mr. Steve Mertens, our Chief Technology Officer.
(4) Amounts reported reflect CAP for the other NEOs as a group (excluding Mr. Rosa), as computed in accordance with Item 402(v) of Regulation S-K, for each corresponding year, which amounts do not reflect an average of the actual amount of compensation earned by or paid to the other NEOs as a group (excluding Mr. Rosa) during the applicable year. The adjustments below were made to the average total compensation for the NEOs as a group (excluding Mr. Rosa) for each year to determine the CAP for such year in accordance with the requirements of Item 402(v) of Regulation S-K.
| Year | Average | Less | Average | Plus | Average | Equals | Average | |||||||
| 2025 | 605,598 | 202,046 | 286,174 | 689,726 | ||||||||||
| 2024 | 655,350 | 289,277 | 227,808 | 593,882 | ||||||||||
| 2023 | 423,936 | 78,407 | 17,006 | 362,534 |
(a) See note (b) to footnote (2) above for an explanation of the equity award adjustments made in accordance with Item 402(v) of Regulation S-K. The amounts deducted or added in calculating the total average equity award adjustments for the other NEOs as a group (excluding Mr. Rosa) are as follows:
| Year | Average | Year over Year | Average | Total | ||||||
| 2025 | 315,595 | (15,881 | ) | (13,540 | ) | 286,174 | ||||
| 2024 | 216,947 | 2,907 |
| 7,954 |
| 227,808 | ||||
| 2023 | 39,784 | (13,742 | ) | (9,037 | ) | 17,006 | ||||
| Year | Reported | Less | Reported | Plus | Equity | Equals | CAP for | ||||||||
| 2025 | 1,154,436 | 367,357 | 467,597 |
| 1,254,676 | ||||||||||
| 2024 | 1,995,745 | 1,245,577 | 1,173,438 |
| 1,923,606 | ||||||||||
| 2023 | 989,558 | 229,575 | (43,699 | ) | 716,284 | ||||||||||
(a) Amounts reflect the grant date fair value of equity awards as reported in the “Option Awards” and “Stock Awards” columns in the Summary Compensation Table for the applicable year.
(b) The equity award adjustments were calculated in accordance with Item 402(v) of Regulation S-K and include: (i) the year-end fair value of any equity awards granted in the applicable year that are outstanding and unvested as of the end of the year; (ii) the amount of change as of the end of the applicable year (from the end of the prior fiscal year) in fair value of any awards granted in prior years that are outstanding and unvested as of the end of the applicable year; and (iii) for awards granted in prior years that vest in the applicable year, the amount equal to the change as of the vesting date (from the end of the prior fiscal year) in fair value. The amounts deducted or added in calculating the equity award adjustments for Mr. Rosa are as follows:
| Year | Year End Fair | Year over Year | Change in Fair | Total | |||||||
| 2025 | 573,809 | (84,384 | ) | (21,828 | ) | 467,597 |
| ||||
| 2024 | 1,067,786 | 33,277 |
| 72,375 |
| 1,173,438 |
| ||||
| 2023 | 116,489 | (94,850 | ) | (65,337 | ) | (43,699 | ) | ||||
| Year | Average | Less | Average | Plus | Average | Equals | Average | |||||||
| 2025 | 605,598 | 202,046 | 286,174 | 689,726 | ||||||||||
| 2024 | 655,350 | 289,277 | 227,808 | 593,882 | ||||||||||
| 2023 | 423,936 | 78,407 | 17,006 | 362,534 |
(a) See note (b) to footnote (2) above for an explanation of the equity award adjustments made in accordance with Item 402(v) of Regulation S-K. The amounts deducted or added in calculating the total average equity award adjustments for the other NEOs as a group (excluding Mr. Rosa) are as follows:
| Year | Average | Year over Year | Average | Total | ||||||
| 2025 | 315,595 | (15,881 | ) | (13,540 | ) | 286,174 | ||||
| 2024 | 216,947 | 2,907 |
| 7,954 |
| 227,808 | ||||
| 2023 | 39,784 | (13,742 | ) | (9,037 | ) | 17,006 | ||||
| [1] | Reflects the amount reported in the “Total” column of the Summary Compensation Table for Mr. Rosa for each corresponding year. | ||||||||||||||||||||||||||||||||||||||||||||||||||||||||||||||||||||||||||||||||||||||||||||||||||||||||||||||||
| [2] | Amounts reported reflect CAP for Mr. Rosa, as computed in accordance with Item 402(v) of Regulation S-K, for each corresponding year, which amounts do not reflect the actual amount of compensation earned by or paid to Mr. Rosa during the applicable year. The adjustments below were made to Mr. Rosa’s total compensation for each year to determine the CAP for such fiscal year in accordance with the requirements of Item 402(v) of Regulation S-K.
(a) Amounts reflect the grant date fair value of equity awards as reported in the “Option Awards” and “Stock Awards” columns in the Summary Compensation Table for the applicable year. (b) The equity award adjustments were calculated in accordance with Item 402(v) of Regulation S-K and include: (i) the year-end fair value of any equity awards granted in the applicable year that are outstanding and unvested as of the end of the year; (ii) the amount of change as of the end of the applicable year (from the end of the prior fiscal year) in fair value of any awards granted in prior years that are outstanding and unvested as of the end of the applicable year; and (iii) for awards granted in prior years that vest in the applicable year, the amount equal to the change as of the vesting date (from the end of the prior fiscal year) in fair value. The amounts deducted or added in calculating the equity award adjustments for Mr. Rosa are as follows:
|
||||||||||||||||||||||||||||||||||||||||||||||||||||||||||||||||||||||||||||||||||||||||||||||||||||||||||||||||
| [3] | Reflects the average amount reported in the “Total” column of the Summary Compensation Table for our other NEOs as a group (excluding Mr. Rosa) for each corresponding year. For the Fiscal Year 2024, the names of each of the other NEOs (excluding Mr. Rosa) included for purposes of calculating the average amounts are Mr. McClurg and Mr. Volker. For the Fiscal Years 2023 and 2022, the names of each of the other NEOs (excluding Mr. Rosa) included for purposes of calculating the average amounts are Mr. McClurg and Mr. Steve Mertens, our Chief Technology Officer. | ||||||||||||||||||||||||||||||||||||||||||||||||||||||||||||||||||||||||||||||||||||||||||||||||||||||||||||||||
| [4] | Amounts reported reflect CAP for the other NEOs as a group (excluding Mr. Rosa), as computed in accordance with Item 402(v) of Regulation S-K, for each corresponding year, which amounts do not reflect an average of the actual amount of compensation earned by or paid to the other NEOs as a group (excluding Mr. Rosa) during the applicable year. The adjustments below were made to the average total compensation for the NEOs as a group (excluding Mr. Rosa) for each year to determine the CAP for such year in accordance with the requirements of Item 402(v) of Regulation S-K.
(a) See note (b) to footnote (2) above for an explanation of the equity award adjustments made in accordance with Item 402(v) of Regulation S-K. The amounts deducted or added in calculating the total average equity award adjustments for the other NEOs as a group (excluding Mr. Rosa) are as follows:
|
||||||||||||||||||||||||||||||||||||||||||||||||||||||||||||||||||||||||||||||||||||||||||||||||||||||||||||||||
| [5] | Amounts reflect the grant date fair value of equity awards as reported in the “Option Awards” and “Stock Awards” columns in the Summary Compensation Table for the applicable year. | ||||||||||||||||||||||||||||||||||||||||||||||||||||||||||||||||||||||||||||||||||||||||||||||||||||||||||||||||
| [6] | The equity award adjustments were calculated in accordance with Item 402(v) of Regulation S-K and include: (i) the year-end fair value of any equity awards granted in the applicable year that are outstanding and unvested as of the end of the year; (ii) the amount of change as of the end of the applicable year (from the end of the prior fiscal year) in fair value of any awards granted in prior years that are outstanding and unvested as of the end of the applicable year; and (iii) for awards granted in prior years that vest in the applicable year, the amount equal to the change as of the vesting date (from the end of the prior fiscal year) in fair value. The amounts deducted or added in calculating the equity award adjustments for Mr. Rosa are as follows:
|
||||||||||||||||||||||||||||||||||||||||||||||||||||||||||||||||||||||||||||||||||||||||||||||||||||||||||||||||
| [7] | See note (b) to footnote (2) above for an explanation of the equity award adjustments made in accordance with Item 402(v) of Regulation S-K. The amounts deducted or added in calculating the total average equity award adjustments for the other NEOs as a group (excluding Mr. Rosa) are as follows:
|
||||||||||||||||||||||||||||||||||||||||||||||||||||||||||||||||||||||||||||||||||||||||||||||||||||||||||||||||