Shareholder Report
Dec. 31, 2025
USD ($)
Holding
capitalgroup.com/ETF-literature
(800) 421-4225
.
What were the fund costs for the last year?
(based on a hypothetical $10,000 investment)Fund | Cost of $10,000 Investment | Costs paid as a percentage of a $10,000 investment |
| CGCB | $ 28 | 0.27 % |
Management's discussion of fund performance
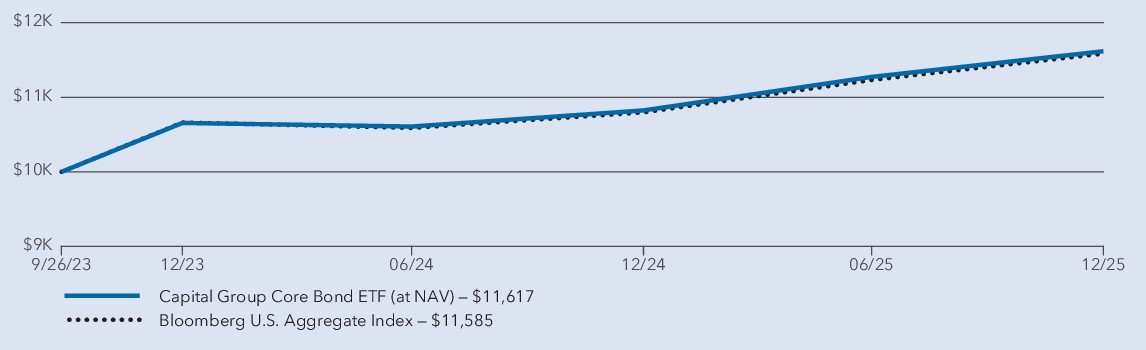
The fund's shares gained 7.33% on a net asset value (NAV) basis and 7.28% on a market price basis for the year ended December 31, 2025. These results compare with a 7.30% gain for the Bloomberg U.S. Aggregate Index. For information on returns for additional periods, including the fund lifetime, please refer to .
capitalgroup.com/ETF-returns
What factors influenced results
During the fund’s fiscal year, the U.S. bond market posted strong returns. The U.S. Federal Reserve cut its policy rate three times in response to labor market weakness and broader economic uncertainty, helping to push short term yields lower. Meanwhile, long-term yields remained relatively high and supported a steepening of the yield curve. Yields on corporate bonds declined but remained elevated relative to their levels over the past 15 years.
Within the fund, an underweight to Treasuries in favor of other sectors including investment grade corporate credit and agency mortgage-backed securities contributed positively to relative results. The fund’s overweight to duration for much of the year was also additive.
In terms of detractors, the fund was positioned for a steepening of the yield curve by having an overweight position to the front end of the curve and an underweight to the long end. The steepening of the yield curve added to results; however, this was more than offset by the cost of maintaining the position. Security selection within emerging markets also detracted from returns.
Average annual total
returns
1 year | Since inception 1 | |
| Capital Group Core Bond ETF (at NAV) 2 | 7.33 % | 6.85 % |
| Bloomberg U.S. Aggregate Index 3 | 7.30 % | 6.72 % |
1
The fund began investment operations on September 26, 2023.2
Investment results assume all distributions are reinvested and reflect applicable fees and expenses. When applicable, results reflect fee waivers and/or expense reimbursements, without which they would have been lower.3
Results assume all distributions are reinvested. Any market index shown is unmanaged, and therefore, has no expenses. Investors cannot invest directly in an index. Source(s): Bloomberg Index Services Ltd.Key fund statistics
| Fund net assets (in millions ) | $ 3,654 |
| Total number of portfolio holdings | 681 |
| Total advisory fees paid (in millions) | $ 7 |
| Portfolio turnover rate including mortgage dollar roll transactions | 87 % |
| Portfolio turnover rate excluding mortgage dollar roll transactions | 57 % |
Portfolio holdings by asset type
(percent of net assets)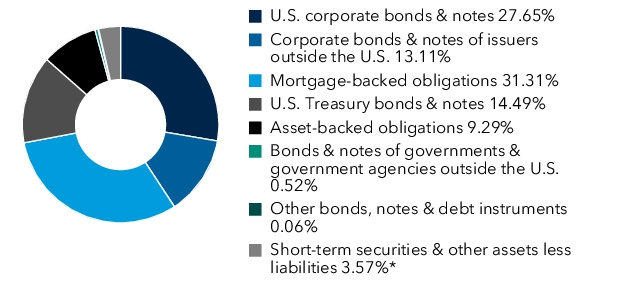
*Includes derivatives.
capitalgroup.com/ETF-literature
(800) 421-4225
.
What were the fund costs for the last year?
(based on a hypothetical $10,000 investment)Fund | Cost of $10,000 Investment | Costs paid as a percentage of a $10,000 investment |
| CGCP | $ 35 | 0.34 % |
Management's discussion of fund performance
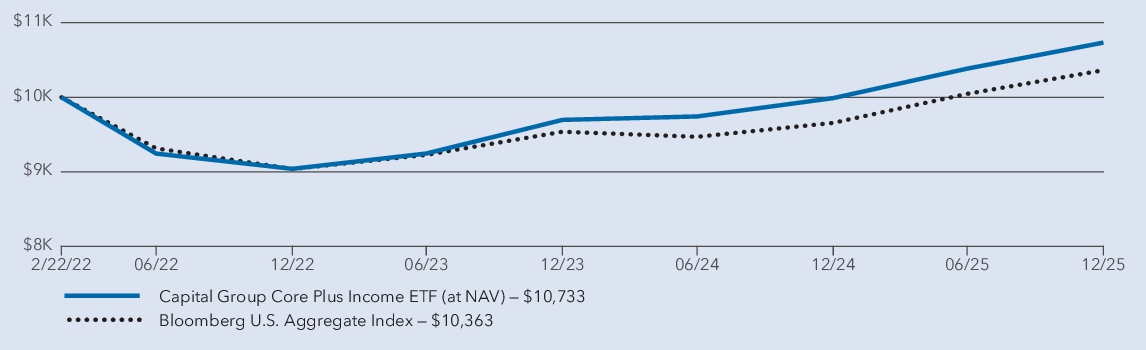
The fund's shares gained 7.44% on a net asset value (NAV) basis and 7.34% on a market price basis for the year ended December 31, 2025. These results compare with a 7.30% gain for the Bloomberg U.S. Aggregate Index. For information on returns for additional periods, including the fund lifetime, please refer to .
capitalgroup.com/ETF-returns
What factors influenced results
During the fund’s fiscal year, the U.S. bond market posted strong returns. Corporate bond yields declined during the period but remained near their highest level in more than 15 years. The U.S. Federal Reserve cut its policy rate three times in response to labor market weakness and economic uncertainty, pushing short-term yields lower. Meanwhile, long-term yields remained elevated amid heavy issuance and a steepening yield curve.
Within the fund, higher allocations to agency mortgage-backed securities, commercial mortgage-back securities, and high-yield bonds were key contributors to returns for the year. Holdings in emerging markets bonds were additive, though the impact was lessened by the specific issues held. Duration positioning further supported the fund’s results through having more duration exposure in a period where interest rates declined.
Conversely, holding a lesser allocation to investment-grade corporate bonds weighed on relative results. A higher allocation to asset-backed securities also detracted. Curve positioning also detracted. While the steepener positioning benefited from short-term rates declining faster than long-term rates, that benefit was outweighed by the cost of maintaining the positioning.
Average annual total
returns
1 year | Since inception 1 | |
| Capital Group Core Plus Income ETF (at NAV) 2 | 7.44 % | 1.85 % |
| Bloomberg U.S. Aggregate Index 3 | 7.30 % | 0.93 % |
1
The fund began investment operations on February 22, 2022.2
Investment results assume all distributions are reinvested and reflect applicable fees and expenses. When applicable, results reflect fee waivers and/or expense reimbursements, without which they would have been lower.3
Results assume all distributions are reinvested. Any market index shown is unmanaged, and therefore, has no expenses. Investors cannot invest directly in an index. Source(s): Bloomberg Index Services Ltd.Key fund
statistics
| Fund net assets (in millions) | $ 6,501 |
| Total number of portfolio holdings | 1,471 |
| Total advisory fees paid (in millions) | $ 18 |
| Portfolio turnover rate including mortgage dollar roll transactions | 299 % |
| Portfolio turnover rate excluding mortgage dollar roll transactions | 104 % |
Portfolio holdings by asset type
(percent of net assets)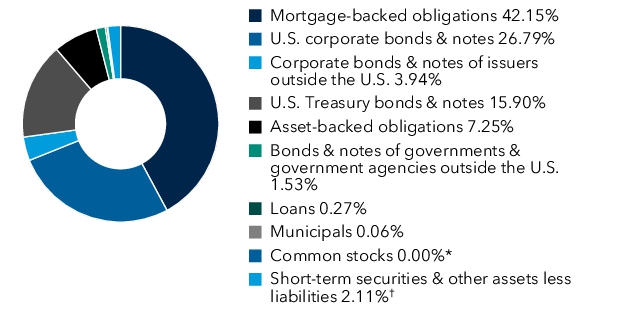
*
Less than 0.01%.†
Includes derivatives.capitalgroup.com/ETF-literature
(800) 421-4225
.
What were the fund costs for the period?
(based on a hypothetical $10,000 investment
)Fund | Cost of $10,000 Investment | Costs paid as a percentage of a $10,000 investment |
| CGHY | $ 21* | 0.39 % † |
*
Based on operations for the period from June 24, 2025 to December 31, 2025. Expenses for the full year would be higher.†
Annualized.Management's discussion of fund performance
The fund's shares gained 4.46% on a net asset value (NAV) basis and 4.62% on a market price basis for the period from June 24, 2025 to December 31, 2025. These results compare with a 3.63% gain for the Bloomberg U.S. Aggregate Index. For information on returns for additional periods, including the fund lifetime, please refer to .
capitalgroup.com/ETF-returns
What factors influenced results
The fund’s holdings in the basic industry and capital goods sectors were key contributors to results. Likewise, communications and technology holdings helped returns relative to the index. From a rating perspective, high-yield bonds contributed positively to the portfolio, particularly in terms of bonds rated CCC and below.
Conversely, investments in the consumer noncyclical sector and in cash and money market
instruments
weighed on returns relative to the index. Likewise, exposure to derivatives generated modestly negative returns during the period.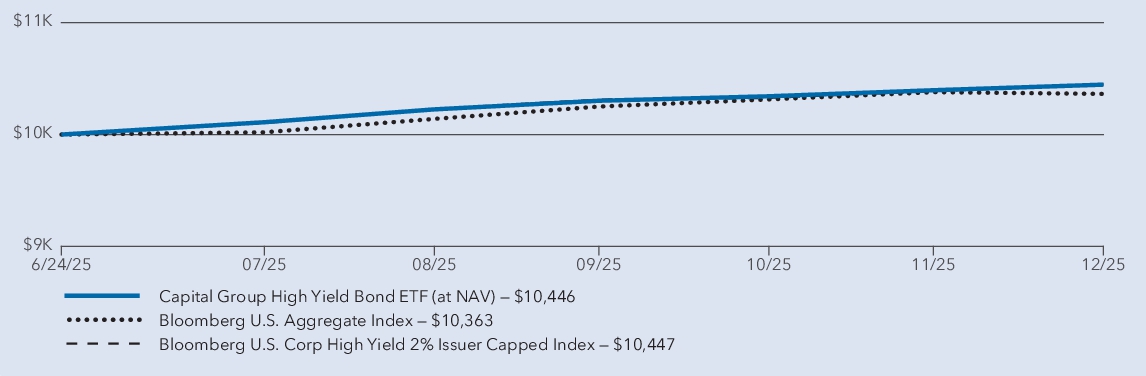
Average annual total returns
Since inception 1 | |
| Capital Group High Yield Bond ETF (at NAV) 2 | 4.46 % |
| Bloomberg U.S. Aggregate Index 3 | 3.63 % |
| Bloomberg U.S. Corp High Yield 2% Issuer Capped Index 3 | 4.47 % |
1
The fund began investment operations on June 24, 2025.2
Investment results assume all distributions are reinvested and reflect applicable fees and expenses. When applicable, results reflect fee waivers and/or expense reimbursements, without which they would have been lower.3
Results assume all distributions are reinvested. Any market index shown is unmanaged, and therefore, has no expenses. Investors cannot invest directly in an index. Source(s): Bloomberg Index Services Ltd.Key fund
statistics
| Fund net assets (in thousands) | $ 53,180 |
| Total number of portfolio holdings | 180 |
| Total advisory fees paid (in thousands) | $ 105 |
| Portfolio turnover rate | 36 % |
Portfolio holdings by asset type
(percent of net assets)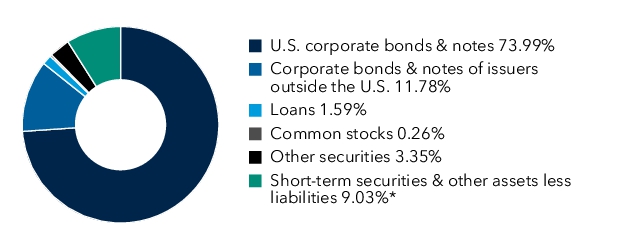
*Includes derivatives.
capitalgroup.com/ETF-literature
(800) 421-4225
.
What were the fund costs for the last year?
(based on a hypothetical $10,000 investment)Fund | Cost of $10,000 Investment | Costs paid as a percentage of a $10,000 investment |
| CGIB | $ 46 | 0.45 % |
Management's discussion of fund performance
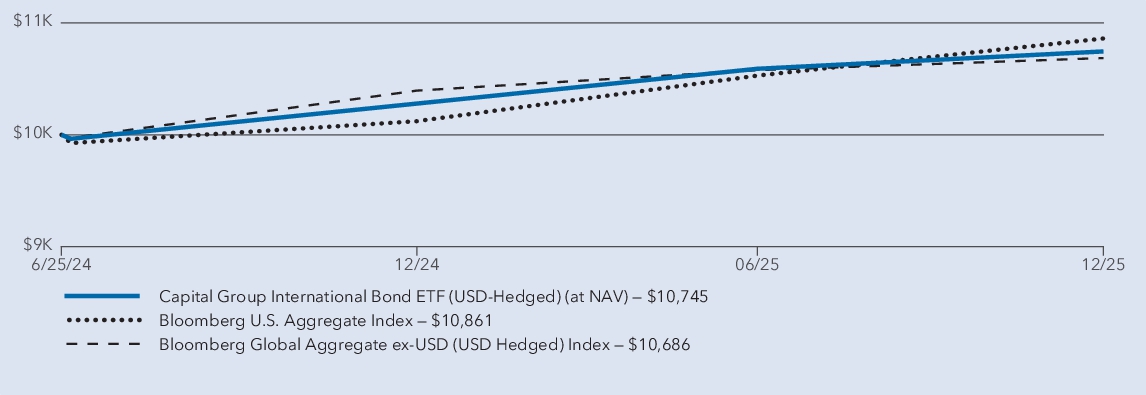
The fund's shares gained 4.53% on a net asset value (NAV) basis and 4.69% on a market price basis for the year ended December 31, 2025. These results compare with a 2.80% gain for the Bloomberg Global Aggregate ex-USD (USD Hedged) Index. For information on returns for additional periods, including the fund lifetime, please refer to .
capitalgroup.com/ETF-returns
What factors influenced results
During the fund’s fiscal year, ending December 31, 2025, overseas bonds delivered strong returns, supported by a weaker U.S. dollar. Stable inflation in the eurozone prompted the European Central Bank to hold key benchmark rates steady during the second half of the year, whereas central banks in many emerging markets continued to ease rates. Meanwhile, Japanese government bonds delivered muted returns amid rising domestic yields. Overall, bond yields in overseas markets remained broadly steady.
Within the fund, most broad sectors contributed positively to overall returns, with interest rate views expressed through forwards and derivative contracts being additive relative to the benchmark. Exposure to U.S. agency mortgages and securitized credit also had a meaningfully positive impact on results. Bonds domiciled in Brazil and Malaysia were key contributors, while investments in Mexican, South Korean and Colombian bonds further supported relative returns. Furthermore, duration positioning benefited the fund’s relative results.
Conversely, an underweight to select eurozone issuers, where underlying results were strong, was the largest negative currency impact over the prior 12 months. To a lesser degree, a less-than-benchmark allocation to Canadian bonds also weighed on relative results. Finally, select bond holdings in China, Israel and Indonesia, all of which were underweights relative to the index, came at the detriment to relative results as these pockets of the global market outperformed.
Average annual total
returns
1 year | Since inception 1 | |
| Capital Group International Bond ETF (USD-Hedged) (at NAV) 2 | 4.53 % | 4.85 % |
| Bloomberg U.S. Aggregate Index 3 | 7.30 % | 5.59 % |
| Bloomberg Global Aggregate ex-USD (USD Hedged) Index 3 | 2.80 % | 4.47 % |
1
The fund began investment operations on June 25, 2024.2
Investment results assume all distributions are reinvested and reflect applicable fees and expenses. When applicable, results reflect fee waivers and/or expense reimbursements, without which they would have been lower.3
Results assume all distributions are reinvested. Any market index shown is unmanaged, and therefore, has no expenses. Investors cannot invest directly in an index. Source(s): Bloomberg Index Services Ltd.Key fund
statistics
| Fund net assets (in thousands) | $ 150,463 |
| Total number of portfolio holdings | 304 |
| Total advisory fees paid (in thousands) | $ 297 |
| Portfolio turnover rate including mortgage dollar roll transactions | 188 % |
| Portfolio turnover rate excluding mortgage dollar roll transactions | 154 % |
Portfolio holdings by asset type
(percent of net assets)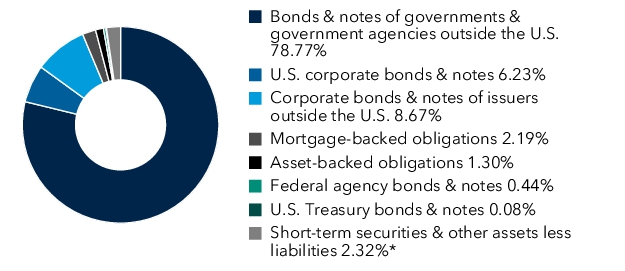
*Includes derivatives.
capitalgroup.com/ETF-literature
(800) 421-4225
.
What were the fund costs for the last year?
(based on a hypothetical $10,000 investment)Fund | Cost of $10,000 Investment | Costs paid as a percentage of a $10,000 investment |
| CGMU | $ 28 | 0.27 % |
Management's discussion of fund performance
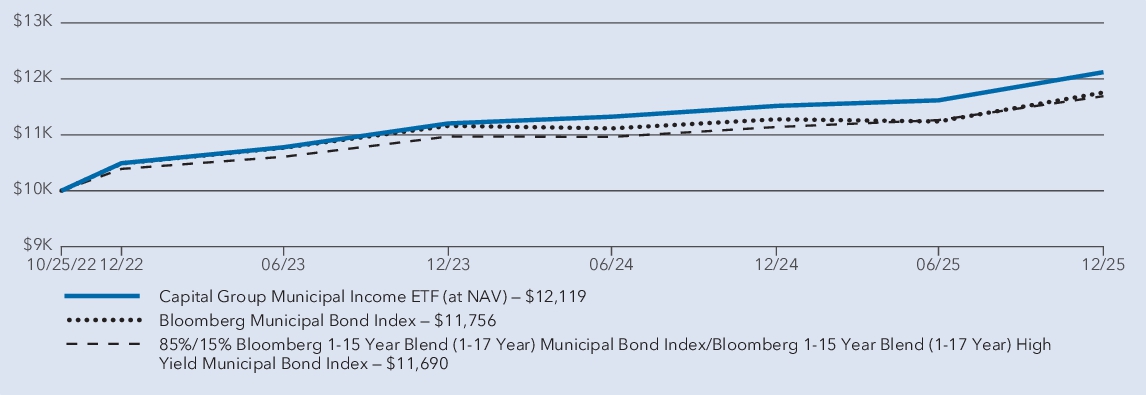
The fund's shares gained 5.23% on a net asset value (NAV) basis and 5.19% on a market price basis for the year ended December 31, 2025. These results compare with a 4.95% gain for the 85%/15% Bloomberg 1-15 Year Blend (1-17 Year) Municipal Bond Index/Bloomberg 1-15 Year Blend (1-17 Year) High Yield Municipal Bond Index. For information on returns for additional periods, including the fund lifetime, please refer to .
capitalgroup.com/ETF-returns
What factors influenced results
U.S. municipal bonds posted strong returns during the fund’s fiscal year. At the same time, the U.S. Federal Reserve cut rates three times in response to growing labor market weakness. Long-term municipal yields initially rose to a multi-year high before gradually declining amid heightened market volatility and strong investor demand. The municipal yield curve remains steep relative to the last five years, continuing the appeal of longer dated maturities.
Within the fund, investments in housing bonds were particularly additive. Holdings in the corporate, transportation and health care sectors also added value. Additionally, duration and curve positioning helped the fund’s relative returns.
Conversely, the fund’s holdings in general obligation and non-general obligation government bonds weighed on returns relative to the benchmark. Likewise, investments in utility and escrowed bonds negatively impacted relative results.
Average annual total
returns
1 year | Since inception 1 | |
| Capital Group Municipal Income ETF (at NAV) 2 | 5.23 % | 6.22 % |
| Bloomberg Municipal Bond Index 3 | 4.25 % | 5.21 % |
| Blend (1-17 Year) High Yield Municipal Bond Index 3 | 4.95 % | 5.03 % |
1
The fund began investment operations on October 25, 2022.2
Investment results assume all distributions are reinvested and reflect applicable fees and expenses. When applicable, results reflect fee waivers and/or expense reimbursements, without which they would have been lower.3
Results assume all distributions are reinvested. Any market index shown is unmanaged, and therefore, has no expenses. Investors cannot invest directly in an index. Source(s): Bloomberg Index Services Ltd.Key fund statistics
| Fund net assets (in millions) | $ 4,803 |
| Total number of portfolio holdings | 1,938 |
| Total advisory fees paid (in millions) | $ 10 |
| Portfolio turnover rate | 26 % |
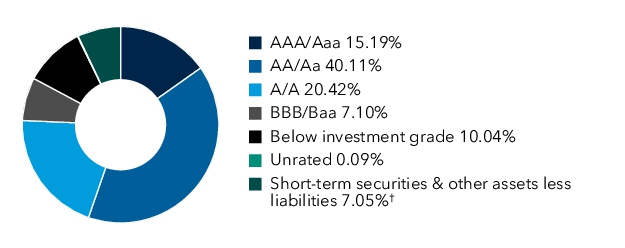
Portfolio quality summary
*
*
Bond ratings, which typically range from AAA/Aaa (highest) to D (lowest), are assigned by credit rating agencies such as Standard & Poor’s, Moody’s and/or Fitch as an indication of an issuer’s creditworthiness. In assigning a credit rating to a security, the fund looks specifically to the ratings assigned to the issuer of the security by Standard & Poor’s, Moody’s and/or Fitch. If agency ratings differ, the security will be considered to have received the highest of those ratings, consistent with the fund’s investment policies. Securities in the “unrated“ category (above) have not been rated by a rating agency; however, the investment adviser performs its own credit analysis and assigns comparable ratings that are used for compliance with the fund’s investment policies.†
Includes derivatives.capitalgroup.com/ETF-literature
(800) 421-4225
.
What were the fund costs for the last year?
(based on a hypothetical $10,000 investment)Fund | Cost of $10,000 Investment | Costs paid as a percentage of a $10,000 investment |
| CGHM | $ 35 | 0.34 % |
Management's discussion of fund performance
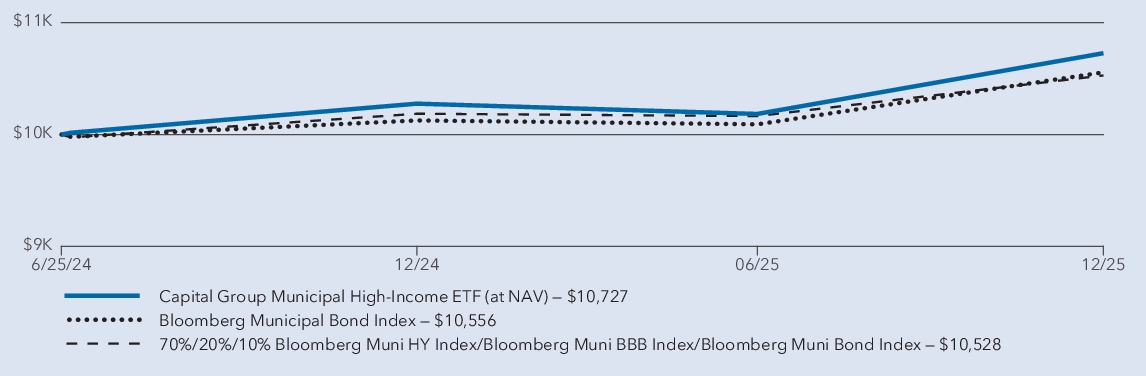
The fund's shares gained 4.40% on a net asset value (NAV) basis and 4.55% on a market price basis for the year ended December 31, 2025. These results compare with a 3.36% gain for the 70%/20%/10% Bloomberg Muni HY Index/Bloomberg Muni BBB Index/Bloomberg Muni Bond Index. For information on returns for additional periods, including the fund lifetime, please refer to .
capitalgroup.com/ETF-returns
What factors influenced results
Over the past year, the municipal bond market delivered solid results as investors responded to shifting monetary policy and improving sentiment. The Federal Reserve lowered interest rates several times, which supported demand for tax exempt securities. Short maturity yields generally moved lower, while longer maturities experienced periods of volatility before easing toward year end. Overall conditions remained supportive for income oriented strategies within the municipal market.
Most sectors within the fund contributed positively to results. Housing-related holdings were especially additive, while corporate and transportation exposures also enhanced returns. Utilities contributed gains as well, though to a lesser extent. Curve positioning provided additional support during the period, while duration positioning remained broadly neutral. High-yield municipal bonds further benefited the portfolio as tax equivalent yields remained attractive relative to other risk assets.
Most sectors within the fund contributed positively to results. Housing-related holdings were especially additive, while corporate and transportation exposures also enhanced returns. Utilities contributed gains as well, though to a lesser extent. Curve positioning provided additional support during the period, while duration positioning remained broadly neutral. High-yield municipal bonds further benefited the portfolio as tax equivalent yields remained attractive relative to other risk assets.
Average annual total returns
1 year | Since inception 1 | |
| Capital Group Municipal High-Income ETF (at NAV) 2 | 4.40 % | 4.74 % |
| Bloomberg Municipal Bond Index 3 | 4.25 % | 3.63 % |
| 70%/20%/10% Bloomberg Muni HY Index/Bloomberg Muni BBB Index/Bloomberg Muni Bond Index 3 | 3.36 % | 3.45 % |
1
The fund began investment operations on June 25, 2024.2
Investment results assume all distributions are reinvested and reflect applicable fees and expenses. When applicable
, results reflect fee waivers and/or expense reimbursements, without which they would have been lower.3
Results assume all distributions are reinvested. Any market index shown is unmanaged, and therefore, has no expenses. Investors cannot invest directly in an index. Source(s): Bloomberg Index Services Ltd.Key fund statistics
| Fund net assets (in millions ) | $ 2,483 |
| Total number of portfolio holdings | 3,283 |
| Total advisory fees paid (in millions) | $ 3 |
| Portfolio turnover rate | 15 % |
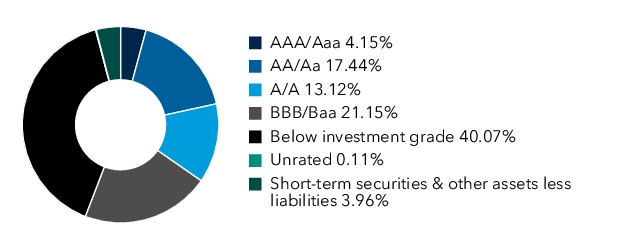
Portfolio quality summary
*
*
Bond ratings, which typically range from AAA/Aaa (highest) to D (lowest), are assigned by credit rating agencies such as Standard & Poor’s, Moody’s and/or Fitch as an indication of an issuer’s creditworthiness. In assigning a credit rating to a security, the fund looks specifically to the ratings assigned to the issuer of the security by Standard & Poor’s, Moody’s and/or Fitch. If agency ratings differ, the security will be considered to have received the highest of those ratings, consistent with the fund’s investment policies. Securities in the “unrated“ category (above) have not been rated by a rating agency; however, the investment adviser performs its own credit analysis and assigns comparable ratings that are used for compliance with the fund’s investment policies.capitalgroup.com/ETF-literature
(800) 421-4225
.
What were the fund costs for the last year?
(based on a hypothetical $10,000 investment)Fund | Cost of $10,000 Investment | Costs paid as a percentage of a $10,000 investment |
| CGSD | $ 26 | 0.25 % |
Management's discussion of fund performance
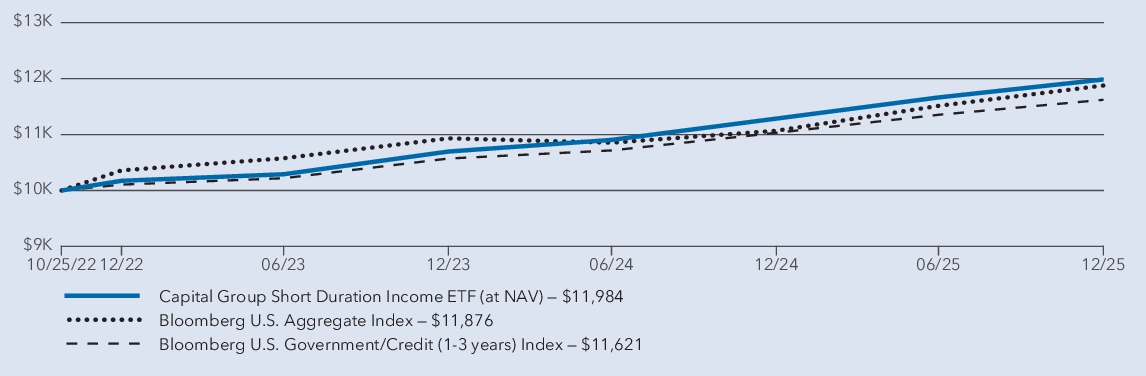
The fund's shares gained 6.20% on a net asset value (NAV) basis and 6.11% on a market price basis for the year ended December 31, 2025. These results compare with a 5.35% gain for the Bloomberg U.S. Government/Credit (1-3 years) Index. For information on returns for additional periods, including the fund lifetime, please refer to .
capitalgroup.com/ETF-returns
What factors influenced results
During the fund’s fiscal year, the U.S. bond market posted strong returns. Corporate bond yields declined during the period, resulting in positive excess returns. Securitized bonds also had strong returns. The U.S. Federal Reserve cut its policy rate three times in response to labor market weakness and economic uncertainty. This pushed U.S. short-term yields lower, and the yield curve steepened.
Within the fund, holdings in securitized debt and investment-grade corporate bonds were significant contributors relative to the benchmark. Duration positioning also added to relative returns.
The fund was positioned for a steepening of the yield curve and was modestly overweight to the front end of the curve and underweight to the 10-year section of the curve. The steepening of the yield curve added to results. However, this was more than offset by negative convexity from mortgage positions, negative roll-down effects and negative government carry from derivative positions, which all detracted. Certain asset-backed securities were among the top detractors by issuer.
Average annual total returns
1 year | Since inception 1 | |
| Capital Group Short Duration Income ETF (at NAV) 2 | 6.20 % | 5.85 % |
| Bloomberg U.S. Aggregate Index 3 | 7.30 % | 5.55 % |
| Bloomberg U.S. Government/Credit (1-3 years) Index 3 | 5.35 % | 4.83 % |
1
The fund began investment operations on October 25, 2022.2
Investment results assume all distributions are reinvested and reflect applicable fees and expenses. When applicable, results reflect fee waivers and/or expense reimbursements, without which
they would have been lower.3
Results assume all distributions are reinvested. Any market index shown is unmanaged, and therefore, has no expenses. Investors cannot invest directly in an index. Source(s): Bloomberg Index Services Ltd.Key fund
statistics
| Fund net assets (in millions) | $ 1,872 |
| Total number of portfolio holdings | 965 |
| Total advisory fees paid (in millions) | $ 3 |
| Portfolio turnover rate including mortgage dollar roll transactions | 128 % |
| Portfolio turnover rate excluding mortgage dollar roll transactions | 32 % |
Portfolio holdings by asset type
(percent of net assets)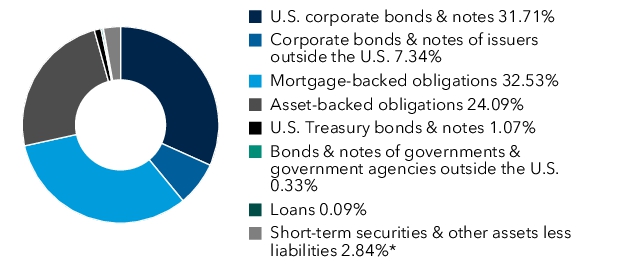
*Includes derivatives.
capitalgroup.com/ETF-literature
(800) 421-4225
.
What were the fund costs for the last year?
(based on a hypothetical $10,000 investment)Fund | Cost of $10,000 Investment | Costs paid as a percentage of a $10,000 investment |
| CGSM | $ 26 | 0.25 % |
Management's discussion of fund performance
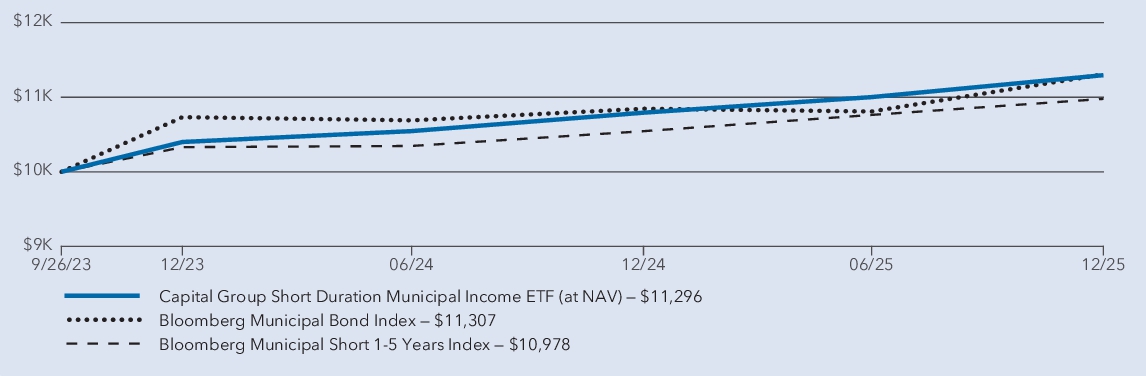
The fund's shares gained 4.67% on a net asset value (NAV) basis and 4.58% on a market price basis for the year ended December 31, 2025. These results compare with a 4.11% gain for the Bloomberg Municipal Short 1-5 Years Index. For information on returns for additional periods, including the fund lifetime, please refer to .
capitalgroup.com/ETF-returns
What factors influenced results
During the fund’s fiscal year, U.S. municipal bonds posted strong returns. The U.S. Federal Reserve cut rates three times in response to ongoing labor market weakness. Long-term municipal yields initially rose to a multi-year high amid heightened market volatility and strong investor demand. The municipal yield curve remains steep relative to the last five years, continuing the appeal of longer dated maturities.
During the fund period, sector allocation contributed to relative returns, mainly due to significant overweights in housing and corporate bonds along with a sizable underweight to general obligation debt. Security selection in special tax bonds, as well as utilities, health care and education were also positive.
Security selection in corporates and governmental (non-general obligation) bonds slightly detracted from relative returns.
Average annual total
returns
1 year | Since inception 1 | |
| Capital Group Short Duration Municipal Income ETF (at NAV) 2 | 4.67 % | 5.53 % |
| Bloomberg Municipal Bond Index 3 | 4.25 % | 5.58 % |
| Bloomberg Municipal Short 1-5 Years Index 3 | 4.11 % | 4.21 % |
1
The fund began investment operations on September 26, 2023.2
Investment results assume all distributions are reinvested and reflect applicable fees and expenses. When applicable, results reflect fee waivers and/or expense reimbursements, without which they would have been lower.3
Results assume all distributions are reinvested. Any market index shown is unmanaged, and therefore, has no expenses. Investors cannot invest directly in an index. Source(s): Bloomberg Index Services Ltd.Key fund
statistics
| Fund net assets (in millions) | $ 954 |
| Total number of portfolio holdings | 797 |
| Total advisory fees paid (in millions) | $ 2 |
| Portfolio turnover rate | 55 % |
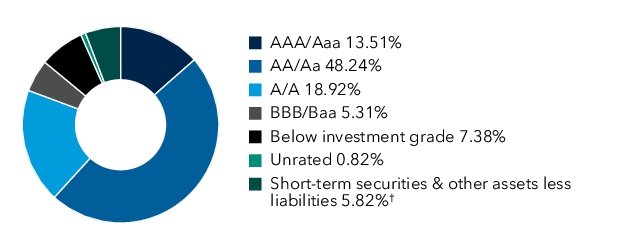
Portfolio quality summary
*
*
Bond ratings, which typically range from AAA/Aaa (highest) to D (lowest), are assigned by credit rating agencies such as Standard & Poor’s, Moody’s and/or Fitch as an indication of an issuer’s creditworthiness. In assigning a credit rating to a security, the fund looks specifically to the ratings assigned to the issuer of the security by Standard & Poor’s, Moody’s and/or Fitch. If agency ratings differ, the security will be considered to have received the highest of those ratings, consistent with the fund’s investment policies. Securities in the “unrated“ category (above) have not been rated by a rating agency; however, the investment adviser performs its own credit analysis and assigns comparable ratings that are used for compliance with the fund’s investment policies.†
Includes derivatives.capitalgroup.com/ETF-literature
(800) 421-4225
.
What were the fund costs for the last year?
(based on a hypothetical $10,000 investment)Fund | Cost of $10,000 Investment | Costs paid as a percentage of a $10,000 investment |
| CGUI | $ 18 | 0.18 % |
Management's discussion of fund performance
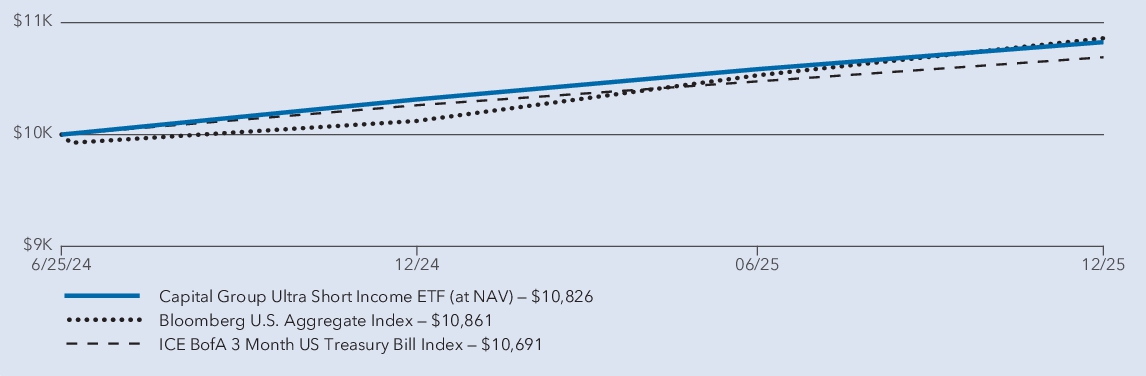
The fund's shares gained 4.97% on a net asset value (NAV) basis and 5.01% on a market price basis for the year ended December 31, 2025. These results compare with a 4.18% gain for the ICE BofA 3 Month US Treasury Bill Index. For information on returns for additional periods, including the fund lifetime, please refer to .
capitalgroup.com/ETF-returns
What factors influenced results
During the fund’s fiscal year, U.S. short-term bonds delivered positive returns. In 2025, the U.S. Federal Reserve (Fed) implemented three rate cuts to support growth amid weakening labor market conditions. Short-term yields continued to decline, reflecting shifting expectations around the Fed’s rate cut trajectory. Notably, the yield on the U.S. three-month Treasury bill dropped to its lowest point in nearly three years.
Most sectors posted gains. Short-maturity investment-grade corporate bonds were the largest contributor to relative results as they represent roughly 50% of the fund. The allocation to financials added the most, followed by industrials. Commercial paper and government-related also added value, though to a lesser extent. Duration and curve positioning further contributed to the fund’s relative returns.
The sector allocation to asset-backed securities (ABS), which represent the largest securitized holdings, detracted slightly due to issuer-specific challenges.
Average annual total returns
1 year | Since inception 1 | |
| Capital Group Ultra Short Income ETF (at NAV) 2 | 4.97 % | 5.37 % |
| Bloomberg U.S. Aggregate Index 3 | 7.30 % | 5.59 % |
| ICE BofA 3 Month US Treasury Bill Index 3 | 4.18 % | 4.50 % |
1
The fund began investment operations on June 25, 2024.2
Investment results assume all distributions are reinvested and reflect applicable fees and expenses. When applicable
, results reflect fee waivers and/or expense reimbursements, without which they would have been lower.3
Results assume all distributions are reinvested. Any market index shown is unmanaged, and therefore, has no expenses. Investors cannot invest directly in an index. Source(s): Bloomberg Index Services Ltd. and ICE Data Indices, LLC.Key fund
statistics
| Fund net assets (in thousands) | $ 186,620 |
| Total number of portfolio holdings | 335 |
| Total advisory fees paid (in thousands) | $ 141 |
| Portfolio turnover rate | 90 % |
Portfolio holdings by asset type
(percent of net assets)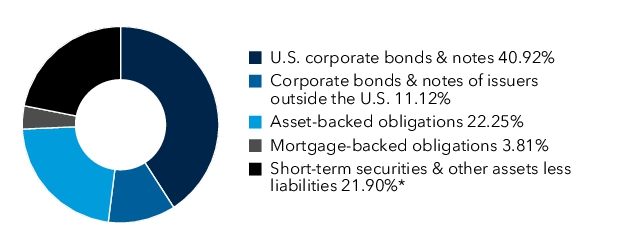
*Includes derivatives.
capitalgroup.com/ETF-literature
(800) 421-4225
.
What were the fund costs for the last year?
(based on a hypothetical $10,000 investment)Fund | Cost of $10,000 Investment | Costs paid as a percentage of a $10,000 investment |
| CGMS | $ 41 | 0.39 % |
Management's discussion of fund performance
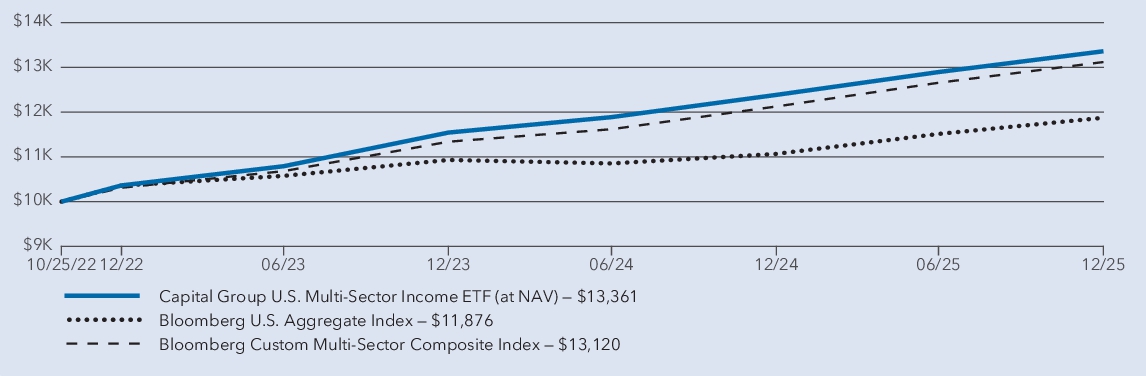
The fund's shares gained 7.88% on a net asset value (NAV) basis and 7.52% on a market price basis for the year ended December 31, 2025. These results compare with a 7.30% gain for the Bloomberg U.S. Aggregate Index. For information on returns for additional periods, including the fund lifetime, please refer to .
capitalgroup.com/ETF-returns
What factors influenced results
During the fund’s fiscal year, the U.S. bond market posted strong returns. Corporate bond yields declined during the period but remained near their highest level in more than 15 years. The U.S. Federal Reserve cut its policy rate three times in response to labor market weakness and economic uncertainty, pushing short-term yields lower. Meanwhile, long-term yields remained elevated amid heavy issuance and a steepening yield curve.
The fund’s holdings in investment-grade corporate bonds, high-yield derivatives and opportunistic bonds were particularly additive to results relative to the benchmark. Investment-grade derivatives and securitized debt also produced modest positive returns.
Conversely, investments in high-yield corporate bonds and cash & money market instruments weighed on returns relative to the benchmark. Additionally, exposure to forward contracts negatively impacted relative results.
Average annual total returns
1 year | Since inception 1 | |
| Capital Group U.S. Multi-Sector Income ETF (at NAV) 2 | 7.88 % | 9.53 % |
| Bloomberg U.S. Aggregate Index 3 | 7.30 % | 5.55 % |
| Bloomberg Custom Multi-Sector Composite Index 3 | 8.19 % | 8.91 % |
1
The fund began investment operations on October 25, 2022.2
Investment results assume
all distributions are reinvested and reflect applicable fees and expenses. When applicable, results reflect fee waivers and/or expense reimbursements, without which they would have been lower.3
Results assume all distributions are reinvested. Any market index shown is unmanaged, and therefore, has no expenses. Investors cannot invest directly in an index. Source(s): Bloomberg Index Services Ltd.Key fund statistics
| Fund net assets (in millions) | $ 3,930 |
| Total number of portfolio holdings | 1,407 |
| Total advisory fees paid (in millions) | $ 11 |
| Portfolio turnover rate including mortgage dollar roll transactions | 52 % |
| Portfolio turnover rate excluding mortgage dollar roll transactions | 40 % |
Portfolio holdings by asset type
(percent of net assets)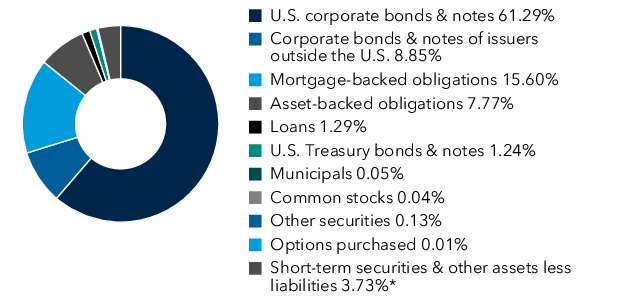
*Includes derivatives.
| [1] | Based on operations for the period from June 24, 2025 to December 31, 2025. Expenses for the full year would be higher. |
| [2] | Annualized. |