What were the Fund costs for the past year?
(based on a hypothetical $10,000 investment)
| Fund Name | Costs of a $10,000 | Costs paid as a |
| T-REX 2X Long Bitcoin Daily Target ETF | $106 | 0.95% |
How did the Fund perform last year?
• For the period of January 1, 2025 to December 31, 2025, the T-REX 2X Long Bitcoin Daily Target ETF (the “Fund”) returned -39.37%.
• In comparison, the S&P 500® ETF returned 17.88% for the same period.
What key factors affected the Fund’s performance?
• Cryptocurrency markets experienced heightened volatility and declines during 2025 amid shifting monetary policy expectations and regulatory uncertainty.
• The Fund generally aimed to provide 2x daily exposure to the price of Bitcoin.
• Declines in Bitcoin prices, combined with the leveraged structure, amplified losses during market drawdowns.
• Compounding effects from daily rebalancing, volatility in Bitcoin price movements, and management fees negatively impacted results.
Understanding Leveraged ETFs
The Fund seeks daily investment results that correspond to 200% of the daily performance of Bitcoin. Due to the effects of compounding, holding periods longer than one day may result in returns that significantly differ from 200% of Bitcoin’s cumulative performance over the same period.
Principal Risks
• Leverage Risk — The use of leverage magnifies both gains and losses.
• Compounding Risk — Daily rebalancing can cause performance drift in volatile markets.
• Digital Asset Risk — Bitcoin is subject to extreme price volatility and regulatory uncertainty.
• Market Risk — Financial markets may decline due to economic or geopolitical events.
• Derivatives Risk — The Fund uses swaps and other derivatives that may increase volatility.
Cumulative Performance
(based on a hypothetical $10,000 investment)
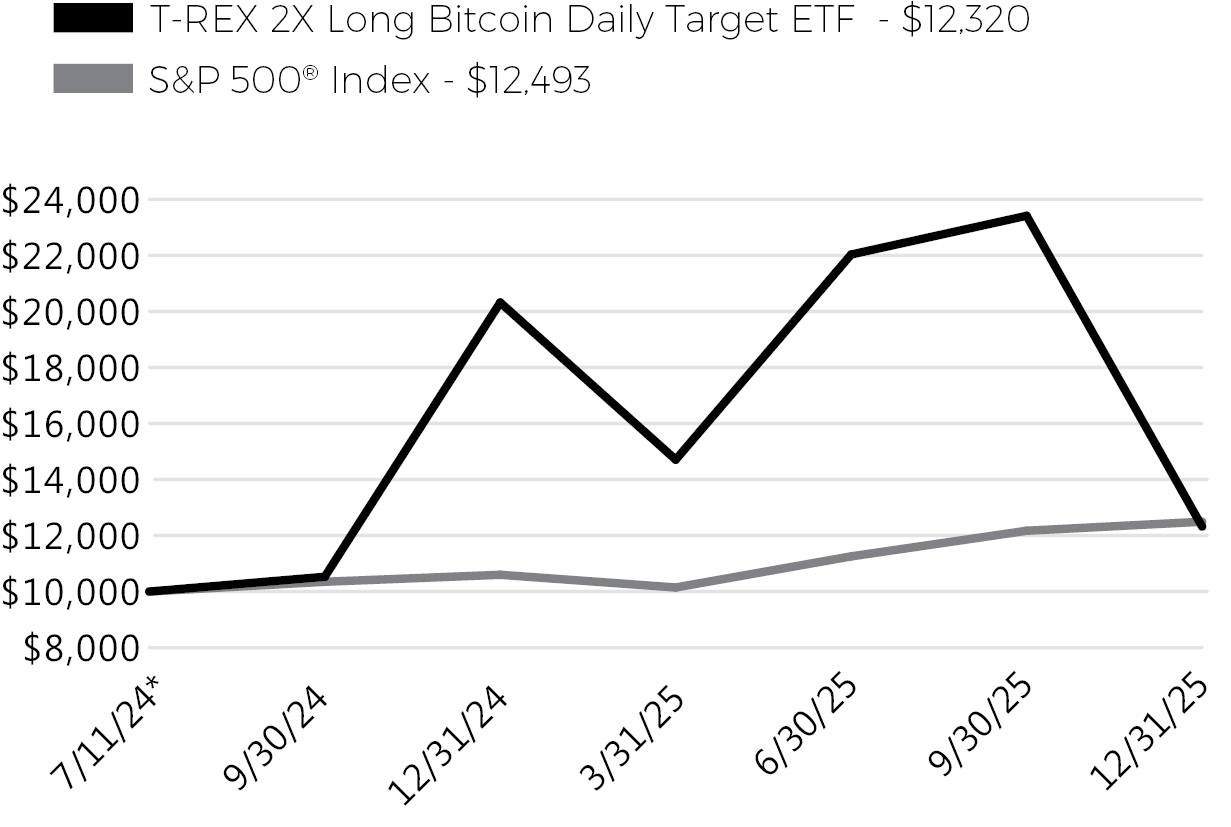
* Inception
Annual Performance
| 1 year | Average Annual | |
| T-REX 2X Long Bitcoin Daily Target ETF | -39.37% | 15.23% |
| S&P 500® Index | 17.88% | 16.30% |
The S&P 500® Index is a broad-based unmanaged index of 500 stocks, which is widely recognized as representative of the equity market in general.
For more recent performance information visit www.rexshares.com/btcl/.
The Fund’s past performance is not a good predictor of how the Fund will perform in the future. The graph and table do not reflect the deduction of taxes that a shareholder would pay on Fund distributions or redemption of Fund shares.
For more recent performance information visit www.rexshares.com/btcl/.
Key Fund Statistics
(as of December 31, 2025)
| Fund Net Assets | $37,213,821 |
| Number of Holdings | 2 |
| Total Net Advisory Fee | $491,152 |
| Portfolio Turnover Rate | 0.00% |
What did the Fund invest in?
(% of Net Assets as of December 31, 2025)
Market Exposure
Total Return Swap Contracts: 200.00%
“Market Exposure” includes the values of total investments (including the contract value of any derivatives) and excludes any short-term investments.
Portfolio Composition
| Cash | 100.41% |
| Liabilities in Excess of Other Assets | -0.12% |
| Derivatives | -0.29% |
Market Exposure
Total Return Swap Contracts: 200.00%
“Market Exposure” includes the values of total investments (including the contract value of any derivatives) and excludes any short-term investments.
What were the Fund costs for the past year?
(based on a hypothetical $10,000 investment)
| Fund Name | Costs of a $10,000 | Costs paid as a |
| T-REX 2X Inverse Bitcoin Daily Target ETF | $56 | 0.95% |
How did the Fund perform last year?
• For the period of January 1, 2025 to December 31, 2025, the T-REX 2X Inverse Bitcoin Daily Target ETF (the “Fund”) returned -29.04%.
• In comparison, the S&P 500® ETF returned 17.88% for the same period.
What key factors affected the Fund’s performance?
• Bitcoin prices experienced significant volatility during 2025, with sharp rallies during portions of the year.
• The Fund generally aimed to provide 2x inverse daily exposure to the price of Bitcoin.
• Periods of rising Bitcoin prices negatively impacted performance due to the Fund’s short exposure.
• Compounding effects from daily rebalancing, volatility in Bitcoin price movements, and management fees affected results.
Understanding Leveraged ETFs
The Fund seeks daily investment results that correspond to -200% of the daily performance of Bitcoin. Due to the effects of compounding, holding periods longer than one day may result in returns that significantly differ from -200% of Bitcoin’s cumulative performance over the same period.
Principal Risks
• Leverage Risk — The use of leverage magnifies both gains and losses.
• Compounding Risk — Daily rebalancing can cause performance drift in volatile markets.
• Digital Asset Risk — Bitcoin is subject to extreme price volatility and regulatory uncertainty.
• Inverse Exposure Risk — Losses may occur when Bitcoin prices rise.
• Derivatives Risk — The Fund uses swaps and other derivatives that may increase volatility.
Cumulative Performance
(based on a hypothetical $10,000 investment)
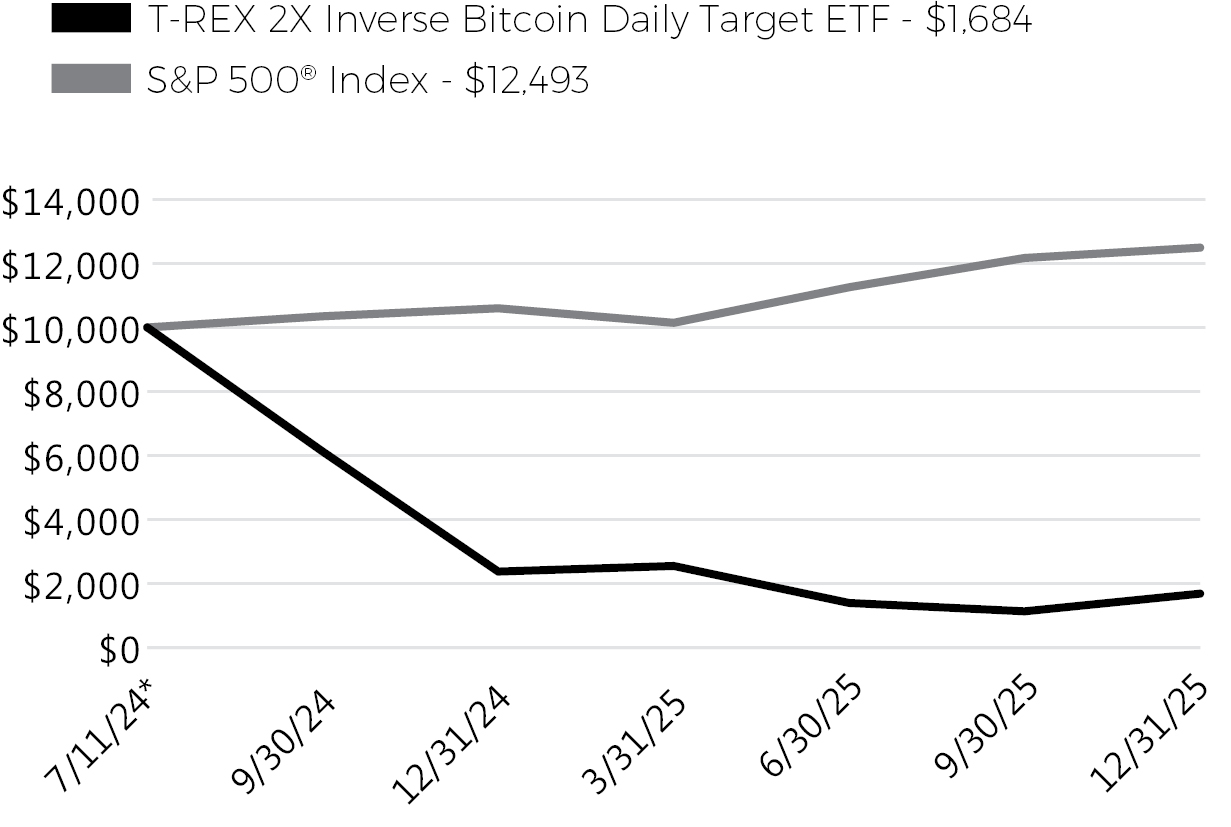
* Inception
Annual Performance
| 1 Year | Average Annual | |
| T-REX 2X Inverse Bitcoin Daily Target ETF | -29.04% | -70.11% |
| S&P 500® Index | 17.88% | 16.30% |
The S&P 500® Index is a broad-based unmanaged index of 500 stocks, which is widely recognized as representative of the equity market in general.
For more recent performance information visit www.rexshares.com/btcz/.
The Fund’s past performance is not a good predictor of how the Fund will perform in the future. The graph and table do not reflect the deduction of taxes that a shareholder would pay on Fund distributions or redemption of Fund shares.
For more recent performance information visit www.rexshares.com/btcz/.
Key Fund Statistics
(as of December 31, 2025)
| Fund Net Assets | $12,832,270 |
| Number of Holdings | 1 |
| Total Net Advisory Fee | $51,738 |
| Portfolio Turnover Rate | 0.00% |
What did the Fund invest in?
(% of Net Assets as of December 31, 2025)
Market Exposure
Total Return Swap Contracts: 200.00%
“Market Exposure” includes the values of total investments (including the contract value of any derivatives) and excludes any short-term investments.
Portfolio Composition
| Cash | 107.64% |
| Derivatives | -0.06% |
| Liabilities in Excess of Other Assets | -7.58% |
Market Exposure
Total Return Swap Contracts: 200.00%
“Market Exposure” includes the values of total investments (including the contract value of any derivatives) and excludes any short-term investments.
What were the Fund costs for the past year?
(based on a hypothetical $10,000 investment)
| Fund Name | Costs of a $10,000 | Costs paid as a |
| T-REX 2X Long | $75 | 0.95% |
How did the Fund perform last year?
• For the period of January 1, 2025 to December 31, 2025, the T-REX 2X Long Ether Daily Target ETF (the “Fund”) returned -62.39%.
• In comparison, the S&P 500® ETF returned 17.88% for the same period.
What key factors affected the Fund’s performance?
• Cryptocurrency markets experienced significant declines and elevated volatility during 2025.
• The Fund generally aimed to provide 2x daily exposure to the price of Ethereum.
• Sharp declines in Ethereum prices, combined with the leveraged structure, amplified losses during market drawdowns.
• Compounding effects from daily rebalancing, volatility in Ethereum price movements, and management fees negatively impacted results.
Understanding Leveraged ETFs
The Fund seeks daily investment results that correspond to 200% of the daily performance of Ethereum. Due to the effects of compounding, holding periods longer than one day may result in returns that significantly differ from 200% of Ethereum’s cumulative performance over the same period.
Principal Risks
• Leverage Risk — The use of leverage magnifies both gains and losses.
• Compounding Risk — Daily rebalancing can cause performance drift in volatile markets.
• Digital Asset Risk — Ethereum is subject to significant price volatility and technological risks.
• Market Risk — Financial markets may decline due to economic or geopolitical events.
• Derivatives Risk — The Fund uses swaps and other derivatives that may increase volatility.
Cumulative Performance
(based on a hypothetical $10,000 investment)
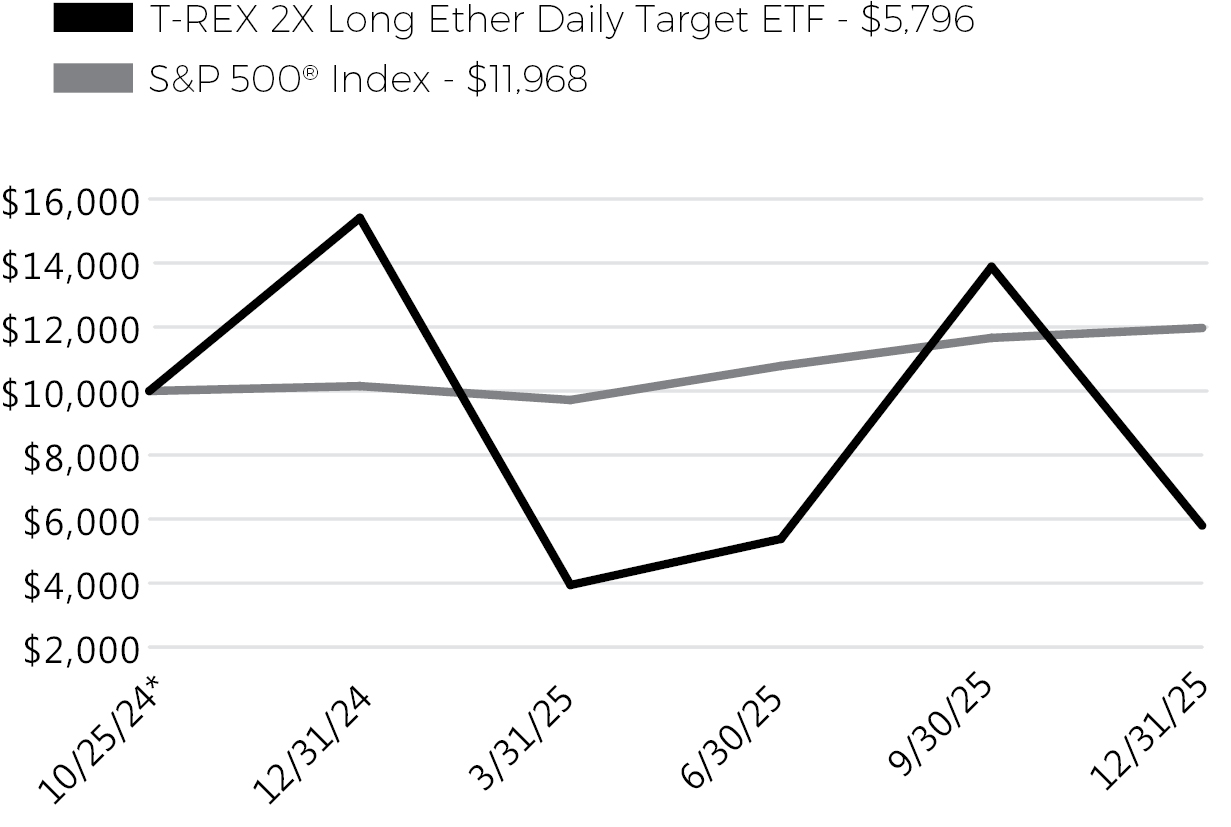
* Inception
Annual Performance
| 1 year | Average Annual | |
| T-REX 2X Long Ether Daily Target ETF | -62.39% | -36.97% |
| S&P 500® Index | 17.88% | 16.39% |
The S&P 500® Index is a broad-based unmanaged index of 500 stocks, which is widely recognized as representative of the equity market in general.
For more recent performance information visit www.rexshares.com/etu/.
The Fund’s past performance is not a good predictor of how the Fund will perform in the future. The graph and table do not reflect the deduction of taxes that a shareholder would pay on Fund distributions or redemption of Fund shares.
For more recent performance information visit www.rexshares.com/etu/.
Key Fund Statistics
(as of December 31, 2025)
| Fund Net Assets | $20,998,908 |
| Number of Holdings | 1 |
| Total Net Advisory Fee | $169,771 |
| Portfolio Turnover Rate | 0.00% |
What did the Fund invest in?
(% of Net Assets as of December 31, 2025)
Market Exposure
Total Return Swap Contracts: 200.00%
“Market Exposure” includes the values of total investments (including the contract value of any derivatives) and excludes any short-term investments.
Portfolio Composition
| Cash | 99.58% |
| Derivatives | 2.50% |
| Liabilities in Excess of Other Assets | -2.08% |
Market Exposure
Total Return Swap Contracts: 200.00%
“Market Exposure” includes the values of total investments (including the contract value of any derivatives) and excludes any short-term investments.
What were the Fund costs for the past year?
(based on a hypothetical $10,000 investment)
| Fund Name | Costs of a $10,000 | Costs paid as a |
| T-REX 2X Inverse Ether Daily Target ETF | $52 | 0.95% |
How did the Fund perform last year?
• For the period of January 1, 2025 to December 31, 2025, the T-REX 2X Inverse Ether Daily Target ETF (the “Fund”) returned -77.80%.
• In comparison, the S&P 500® ETF returned 17.88% for the same period.
What key factors affected the Fund’s performance?
• Ethereum prices experienced periods of sharp appreciation during 2025, contributing to losses for inverse exposure strategies.
• The Fund generally aimed to provide 2x inverse daily exposure to the price of Ethereum.
• Sustained rallies in Ethereum prices negatively impacted performance due to the Fund’s short exposure.
• Compounding effects from daily rebalancing, volatility in Ethereum price movements, and management fees affected results.
Understanding Leveraged ETFs
The Fund seeks daily investment results that correspond to -200% of the daily performance of Ethereum. Due to the effects of compounding, holding periods longer than one day may result in returns that significantly differ from -200% of Ethereum’s cumulative performance over the same period.
Principal Risks
• Leverage Risk — The use of leverage magnifies both gains and losses.
• Compounding Risk — Daily rebalancing can cause performance drift in volatile markets.
• Digital Asset Risk – Ethereum is subject to significant price volatility and technological risks.
• Inverse Exposure Risk — Losses may occur when Ethereum prices rise.
• Derivatives Risk — The Fund uses swaps and other derivatives that may increase volatility.
Cumulative Performance
(based on a hypothetical $10,000 investment)
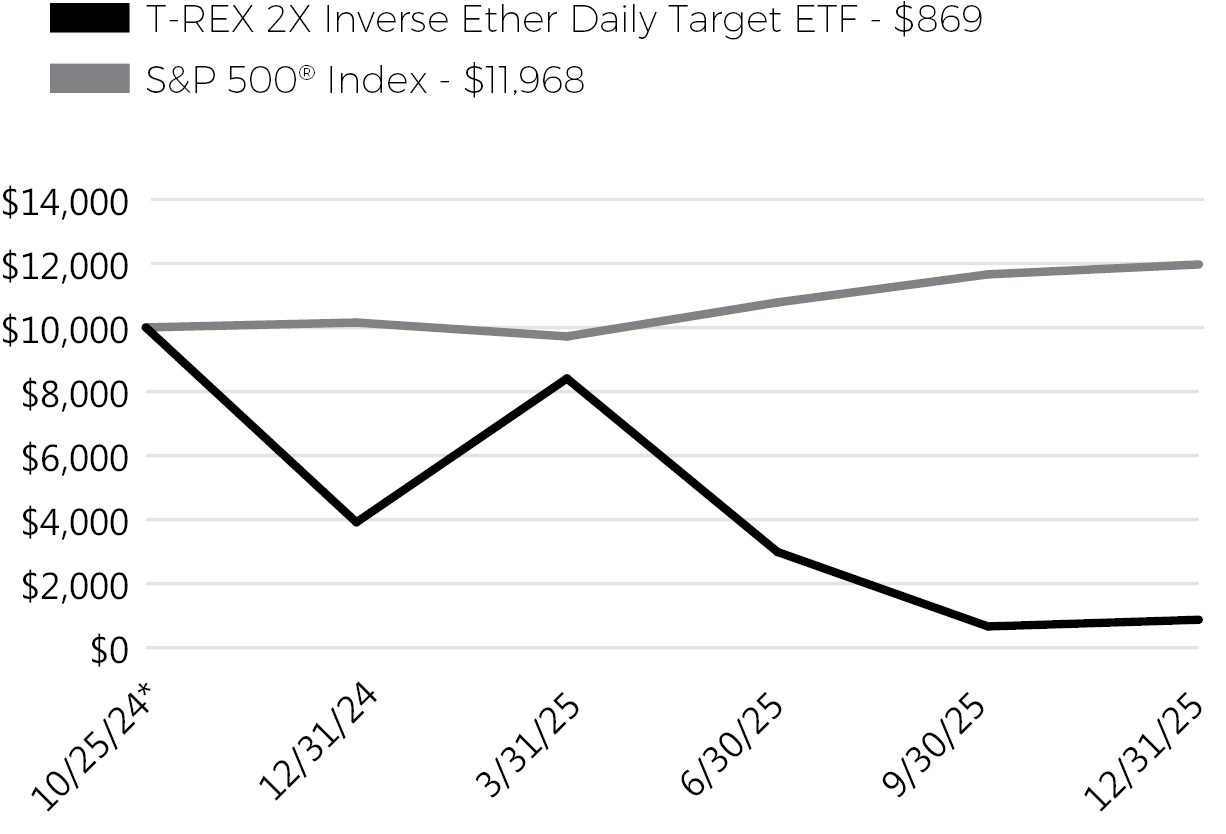
* Inception
Annual Performance
| 1 year | Average Annual | |
| T-REX 2X Inverse Ether Daily Target ETF | -77.80% | -87.34% |
| S&P 500® Index | 17.88% | 16.39% |
The S&P 500® Index is a broad-based unmanaged index of 500 stocks, which is widely recognized as representative of the equity market in general.
For more recent performance information visit www.rexshares.com/etq/.
The Fund’s past performance is not a good predictor of how the Fund will perform in the future. The graph and table do not reflect the deduction of taxes that a shareholder would pay on Fund distributions or redemption of Fund shares.
For more recent performance information visit www.rexshares.com/etq/.
Key Fund Statistics
(as of December 31, 2025)
| Fund Net Assets | $1,926,383 |
| Number of Holdings | 1 |
| Total Net Advisory Fee | $14,613 |
| Portfolio Turnover Rate | 0.00% |
What did the Fund invest in?
(% of Net Assets as of December 31, 2025)
Market Exposure
Total Return Swap Contracts: 200.00%
“Market Exposure” includes the values of total investments (including the contract value of any derivatives) and excludes any short-term investments.
Portfolio Composition
| Cash | 102.71% |
| Liabilities in Excess of Other Assets | -0.01% |
| Derivatives | -2.70% |
Market Exposure
Total Return Swap Contracts: 200.00%
“Market Exposure” includes the values of total investments (including the contract value of any derivatives) and excludes any short-term investments.
| Material Changes Reverse Stock Split On October 14, 2025, the Board of Trustees of the Trust approved a 1-for-20 reverse stock split for Inverse Ether. The record date for the reverse stock split was October 27, 2025, and the split was effected after the close of trading on October 28, 2025, with shares beginning to trade on a split-adjusted basis on October 29, 2025. The Fund’s Creation Unit size remained unchanged at 10,000 shares. All historical per share data has been retroactively adjusted to reflect the reverse stock split. Fund Liquidation On February 19, 2026, the Board of Trustees of World Funds Trust approved a Plan of Liquidation for the T-REX 2X Inverse Ether Daily Target ETF (ETQ) (the “Fund”), based on the recommendation of Tuttle Capital Management, LLC. The Fund will cease trading on Cboe BZX Exchange, Inc. and close to purchases on March 16, 2026, and is expected to liquidate on March 23, 2026. Shareholders may sell shares through the closing date. On or about the liquidation date, remaining shareholders will receive a cash distribution equal to their proportionate interest in the Fund’s net assets, after payment of liabilities and liquidation expenses. As the portfolio is liquidated, the Fund may hold increased cash and deviate from its investment objective, and it will terminate following completion of distributions. |