Exhibit 99.2 BCP Investment Corporation Q4 2025 Earnings Presentation March 6, 2026
Important Information Cautionary Statement Regarding Forward-Looking Statements This presentation contains forward-looking statements. The matters discussed in this presentation, as well as in future oral and written statements by management of BCP Investment Corporation (“BCIC” or the “Company”), that are forward-looking statements are based on current management expectations that involve substantial risks and uncertainties which could cause actual results to differ materially from the results expressed in, or implied by, these forward-looking statements. Forward-looking statements relate to future events or our future financial performance and include, but are not limited to, projected financial performance, expected development of the business, plans and expectations about future investments, our contractual arrangements and relationships with third parties, the ability of our portfolio companies to achieve their objectives, the ability of the Company’s investment adviser to attract and retain highly talented professionals, our ability to maintain our qualification as a regulated investment company and as a business development company, our compliance with covenants under our borrowing arrangements, and the future liquidity of the Company. We generally identify forward- looking statements by terminology such as may, will, should, expects, plans, anticipates, could, intends, target, projects, “outlook”, contemplates, believes, estimates, predicts, potential or continue or the negative of these terms or other similar words. Forward-looking statements are based upon current plans, estimates and expectations that are subject to risks, uncertainties and assumptions. Should one or more of these risks or uncertainties materialize, or should underlying assumptions prove to be incorrect, actual results may vary materially from those indicated or anticipated by such forward-looking statements. Forward-looking statements are subject to change at any time based upon economic, market or other conditions. More information on these risks and other potential factors that could affect the Company’s financial results, including important factors that could cause actual results to differ materially from plans, estimates or expectations included herein, is included in the Company’s filings with the Securities and Exchange Commission (the “SEC”), including in the “Risk Factors” and “Management's Discussion and Analysis of Financial Condition and Results of Operations” sections of the Company’s most recently filed quarterly report on Form 10-Q and annual report on Form 10-K, as well as in subsequent filings. In light of these and other uncertainties, the inclusion of a projection or forward-looking statement in this presentation should not be regarded as a representation by us that our plans and objectives will be achieved. We do not undertake to publicly update or revise any forward-looking statements, whether as a result of new information, future events or otherwise, except as required to be reported under the rules and regulations of the SEC. 2
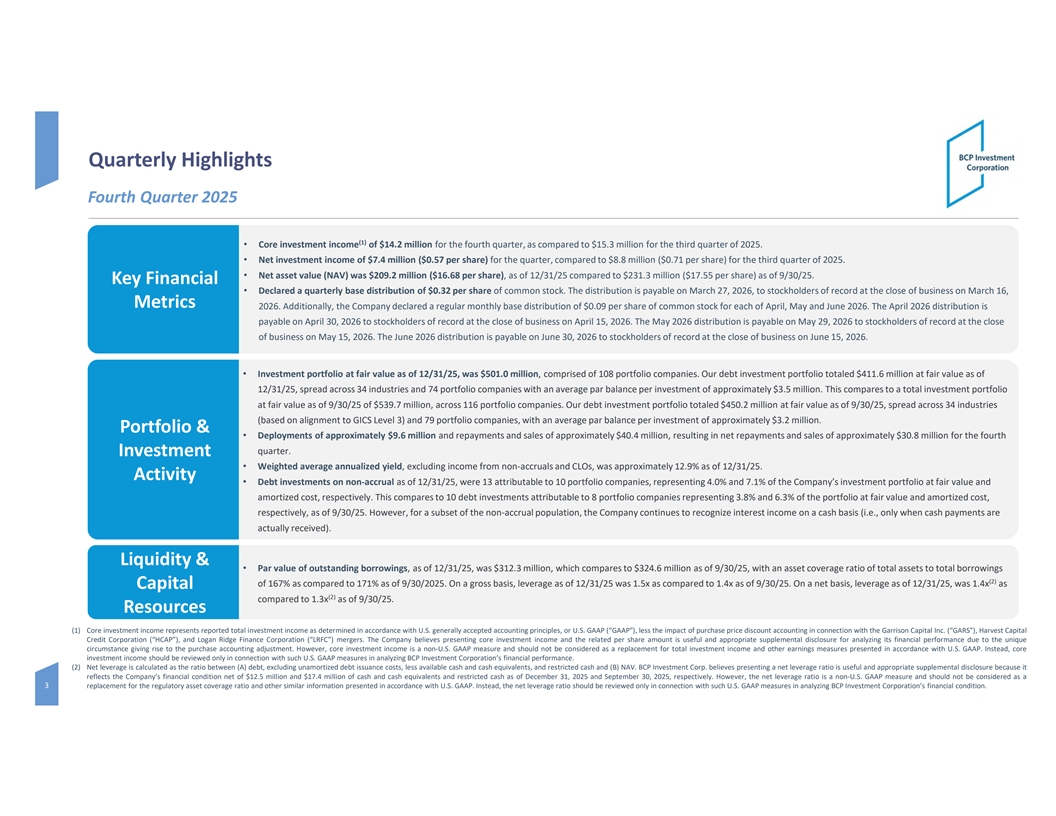
Quarterly Highlights Fourth Quarter 2025 ( (1 1) ) • • C Co or re e i in nv ve es st tm me en nt t i in nco com me e o of f $ $1 14 4. .2 2 m mi il ll li io on n f fo or r t th he e f fo ou ur rt th h q qu ua ar rt te er r, , a as s c co om mp pa ar red ed t to o $ $1 15 5. .3 3 m mi il ll li io on n fo for r t th he e t th hi ir rd d q qu ua ar rt te er r o of f 2 20 02 25 5. . • • N Ne et t i in nv ve es st tm me en nt t i in nc co om me e o of f $ $7 7. .4 4 m mi il ll li io on n ( ($ $0 0. .5 57 7 p pe er r s sh ha are re) ) fo for r t th he e q qu ua ar rt ter er, , c co om mp pa ar re ed d t to o $ $8 8. .8 8 m mi il ll li io on n ( ($ $0 0. .7 71 1 p per er s sh ha ar re) e) f fo or r t th he e t th hi ir rd d q qu ua ar rt te er r o of f 2 20 02 25 5. . • • N Ne et t a as ss se et t v va al lu ue e ( (NA NAV V) ) w wa as s $ $2 20 09 9. .2 2 m mi il ll li io on n ( ($ $1 16 6. .6 68 8 p pe er s r sh ha are re) ), , a as s o of f 1 12 2/3 /31 1/2 /25 5 c co om mp pa ar red ed t to o $ $2 23 31 1. .3 3 m mi il ll li io on n ( ($ $1 17 7. .5 55 5 p per er s sh ha ar re) e) a as s o of f 9 9/3 /30 0/2 /25 5. . K Ke ey y Fi Fin na an nc ci ia al l • • De Dec cl la are red d a a q qu ua ar rt te er rl ly y b ba as se e d di is st tri rib bu ut ti io on n o of f $ $0 0. .3 32 2 p pe er r s sh ha are re o of f c co om mm mo on n s st to oc ck k. . T Th he e d di is st tr ri ib bu ut ti io on n i is s p pa ay ya ab bl le e o on n Ma Mar rc ch h 2 27 7, , 2 20 02 26 6, , t to o s st to oc ck kh ho ol ld de er rs s o of f r re ec co or rd d a at t t th he e c cl lo os se e o of f b bu us si in ne es ss s o on n Ma Mar rc ch h 1 16 6, , M Me etri tric cs s 2 20 02 26 6. . A Ad dd di it ti io on na al ll ly y, , t th he e C Co om mp pa an ny y d de ec cl la ar re ed d a a r re eg gu ul la ar r m mo on nt th hl ly y b ba as se e d di is st tr ri ib bu ut ti io on n o of f $ $0 0. .0 09 9 p pe er r s sh ha ar re e o of f c co om mm mo on n s st to oc ck k fo for r e ea ac ch h o of f A Ap pr ri il l, , Ma May y a an nd d J Ju un ne e 2 20 02 26 6. . T Th he e A Ap pr ri il l 2 20 02 26 6 d di is st tr ri ib bu ut ti io on n i is s p pa aya yab bl le e o on n A Ap pr ri il l 3 30 0, , 2 20 02 26 6 t to o s st to oc ck kh ho ol ld de er rs s o of f r re ec co or rd d a at t t th he e c cl lo os se e o of f b bu us si in ne es ss s o on n A Ap pr ri il l 1 15 5, , 2 20 02 26 6. . T Th he M e Ma ay y 2 20 02 26 6 d di is st tr ri ib bu ut ti io on n i is s p pa aya yab bl le e o on n M Ma ay y 2 29 9, , 2 20 02 26 6 t to o s st to oc ck kh ho ol ld der ers s o of f r re ec co or rd d a at t t th he e c cl lo os se e o of f b bu us si in ne es ss s o on n M Ma ay y 1 15 5, , 2 20 02 26 6. . T Th he e J Ju un ne e 2 20 02 26 6 d di is st tr ri ib bu ut ti io on n i is s p pa ay ya ab bl le e o on n J Ju un ne e 3 30 0, , 2 20 02 26 6 t to o s st to oc ck kh ho ol ld de er rs s o of f r reco ecor rd d a at t t th he e c cl lo os se e o of f b bu us si in ne es ss s o on n J Ju un ne e 1 15 5, , 2 20 02 26 6. . • • I In nv ve es st tm me en nt t p po or rt tf fo ol li io o a at t f fa ai ir r v va al lu ue e a as s o of f 1 12 2/ /3 31 1/ /2 25 5, , w wa as s $ $5 50 01 1. .0 0 m mi il ll li io on n, , c co om mp pr ri is se ed d o of f 1 10 08 8 p po or rt tfo fol li io o c co om mp pa an ni ies es. . Ou Our r d de eb bt t i in nves vest tm me en nt t p po or rt tfo fol li io o t to ot ta al led ed $ $4 41 11 1. .6 6 m mi il ll li io on n a at t f fa ai ir r va val lu ue e a as s o of f 1 12 2/3 /31 1/2 /25 5, , s sp pr rea ead d a ac cr ro os ss s 3 34 4 i in nd du us st tr ri ies es a an nd d 7 74 4 p po or rt tfo fol li io o c co om mp pa an ni ie es s w wi it th h a an n a aver vera ag ge e p pa ar r b ba al la an nc ce e p pe er r i in nv ve es st tm men ent t o of f a ap pp pr ro ox xi im ma at te el ly y $ $3 3. .5 5 m mi il ll li io on n. . T Th hi is s c co om mp pa ar res es t to o a a t to ot ta al l i in nve ves st tm me en nt t p po or rt tf fo ol li io o a at t fa fai ir r va val lu ue e a as s o of f 9 9/3 /30 0/2 /25 5 o of f $ $5 53 39 9. .7 7 m mi il ll li io on n, , a ac cr ro os ss s 1 11 16 6 p po or rt tfo fol li io o c co om mp pa an ni ie es s. . Ou Our r d de eb bt t i in nves vest tm men ent t p po or rt tfo fol li io o t to ot ta al le ed d $ $4 45 50 0. .2 2 m mi il ll li io on n a at t f fa ai ir r v va al lu ue e a as s o of f 9 9/ /3 30 0/2 /25 5, , s sp pr rea ead d a ac cr ro os ss s 3 34 4 i in nd du us st tr ri ies es ( (b ba as sed ed o on n a al li ig gn nm men ent t t to o G GI ICS CS Le Leve vel l 3 3) ) a an nd d 7 79 9 p po or rt tf fo ol li io o c co om mp pa an ni ie es s, , w wi it th h a an n a aver vera ag ge e p pa ar r b ba al la an nc ce e p pe er r i in nve ves st tm me en nt t o of f a ap pp pr ro ox xi im ma at te el ly y $ $3 3. .2 2 m mi il ll li io on n. . P Po ort rtf fo ol li io o & & • • De Dep pl lo oy ym me en nt ts s o of f a ap pp pr ro ox xi im ma at te el ly y $ $9 9. .6 6 m mi il ll li io on n a an nd d r re ep pa aym yme en nt ts s a an nd d s sa al le es s o of f a ap pp pr ro ox xi im ma at tel ely y $ $4 40 0. .4 4 m mi il ll li io on n, , r re es su ul lt ti in ng g i in n n ne et t r re ep pa ay ym men ent ts s a an nd d s sa al les es o of a f ap pp pr ro ox xi im ma at te el ly y $ $3 30 0. .8 8 m mi il ll li io on n fo for r t th he e fo fou ur rt th h q qu ua ar rt te er r. . In Inv ve es stm tme en nt t • • W We ei ig gh ht te ed d a av ve era rag ge e a an nn nu ua al li iz ze ed d y yi ie el ld d, , e ex xc cl lu ud di in ng g i in nc co om me e f fr ro om m n no on n- -a ac cc cr ru ua al ls s a an nd d CLO CLOs s, , w wa as s a ap pp pr ro ox xi im ma at te el ly y 1 12 2. .9 9% % a as s o of f 1 12 2/3 /31 1/2 /25 5. . Acti Activ vi ity ty • • De Deb bt t i in nv ve es st tm me en nt ts s o on n n no on n-a -acc ccru rua al l a as s o of f 1 12 2/3 /31 1/2 /25 5, , w we er re e 1 13 3 a at tt tr ri ib bu ut ta ab bl le e t to o 1 10 0 p po or rt tf fo ol li io o c co om mp pa an ni ie es s, , r re ep pr re es se en nt ti in ng g 4 4. .0 0% % a an nd d 7 7. .1 1% % o of f t th he e Co Com mp pa an ny y’ ’s s i in nves vest tm men ent t p po or rt tfo fol li io o a at t f fa ai ir r va val lu ue a e an nd d a am mo or rt ti iz ze ed d c co os st t, , r res esp pe ec ct ti ive vel ly y. . T Th hi is s c co om mp pa ar re es s t to o 1 10 0 d de eb bt t i in nves vest tm me en nt ts s a at tt tr ri ib bu ut ta ab bl le e t to o 8 8 p po or rt tf fo ol li io o c co om mp pa an ni ie es s r re ep pr re es sen ent ti in ng g 3 3. .8 8% % a an nd d 6 6. .3 3% % o of f t th he e p po or rt tfo fol li io o a at t f fa ai ir r va val lu ue a e an nd d a am mo or rt ti iz ze ed d c co os st t, , r re es sp pe ec ct ti iv ve el ly, y, a as s o of f 9 9/3 /30 0/2 /25 5. . H Ho ow weve ever r, , fo for r a a s su ub bs se et t o of f t th he e n no on n-a -ac cc cr ru ua al l p po op pu ul la at ti io on n, , t th he e Co Com mp pa an ny y c co on nt ti in nu ues es t to o r reco ecog gn ni iz ze e i in nt te er re es st t i in nc co om me e o on n a a c ca as sh h b ba as si is s ( (i i. .e. e., , o on nl ly y w wh hen en c ca as sh h p pa ay ym men ent ts s a ar re e a ac ct tu ua al ll ly y r recei eceive ved d) ). . L Li iq qu ui id di ity ty & & • • Pa Par r v va al lu ue e o of f o ou ut ts st ta an nd di in ng g b bo orro rrow wi in ng gs s, , a as s o of f 1 12 2/3 /31 1/ /2 25 5, , w wa as s $ $3 31 12 2. .3 3 m mi il ll li io on n, , w wh hi ic ch h c co om mp pa ar res es t to o $ $3 32 24 4. .6 6 m mi il ll li io on n a as s o of f 9 9/3 /30 0/2 /25 5, , w wi it th h a an n a as ss se et t c co ov ve er ra ag ge e r ra at ti io o o of f t to ot ta al l a as ss se et ts s t to o t to ot ta al l b bo or rr ro ow wi in ng gs s ( (2 2) ) o of f 1 16 67 7% % a as s c co om mp pa ar red ed t to o 1 17 71 1% % a as s o of f 9 9/3 /30 0/ /2 20 02 25 5. . O On n a a g gr ro os ss s b ba as si is s, , l le ev ve er ra ag ge e a as s o of f 1 12 2/3 /31 1/2 /25 5 w wa as s 1 1. .5 5x x a as s c co om mp pa ar red ed t to o 1 1. .4 4x x a as s o of f 9 9/ /3 30 0/ /2 25 5. . On On a a n ne et t b ba as si is s, , l leve ever ra ag ge e a as s o of f 1 12 2/ /3 31 1/ /2 25 5, , w wa as s 1 1. .4 4x x a as s C Ca ap pi it ta al l ( (2 2) ) c co om mp pa ar re ed d t to o 1 1. .3 3x x a as s o of f 9 9/3 /30 0/ /2 25 5. . R Re es so ou ur rc ce es s (1) Core investment income represents reported total investment income as determined in accordance with U.S. generally accepted accounting principles, or U.S. GAAP (“GAAP”), less the impact of purchase price discount accounting in connection with the Garrison Capital Inc. (“GARS”), Harvest Capital Credit Corporation (“HCAP”), and Logan Ridge Finance Corporation (“LRFC”) mergers. The Company believes presenting core investment income and the related per share amount is useful and appropriate supplemental disclosure for analyzing its financial performance due to the unique circumstance giving rise to the purchase accounting adjustment. However, core investment income is a non-U.S. GAAP measure and should not be considered as a replacement for total investment income and other earnings measures presented in accordance with U.S. GAAP. Instead, core investment income should be reviewed only in connection with such U.S. GAAP measures in analyzing BCP Investment Corporation’s financial performance. (2) Net leverage is calculated as the ratio between (A) debt, excluding unamortized debt issuance costs, less available cash and cash equivalents, and restricted cash and (B) NAV. BCP Investment Corp. believes presenting a net leverage ratio is useful and appropriate supplemental disclosure because it reflects the Company’s financial condition net of $12.5 million and $17.4 million of cash and cash equivalents and restricted cash as of December 31, 2025 and September 30, 2025, respectively. However, the net leverage ratio is a non-U.S. GAAP measure and should not be considered as a 3 replacement for the regulatory asset coverage ratio and other similar information presented in accordance with U.S. GAAP. Instead, the net leverage ratio should be reviewed only in connection with such U.S. GAAP measures in analyzing BCP Investment Corporation’s financial condition.
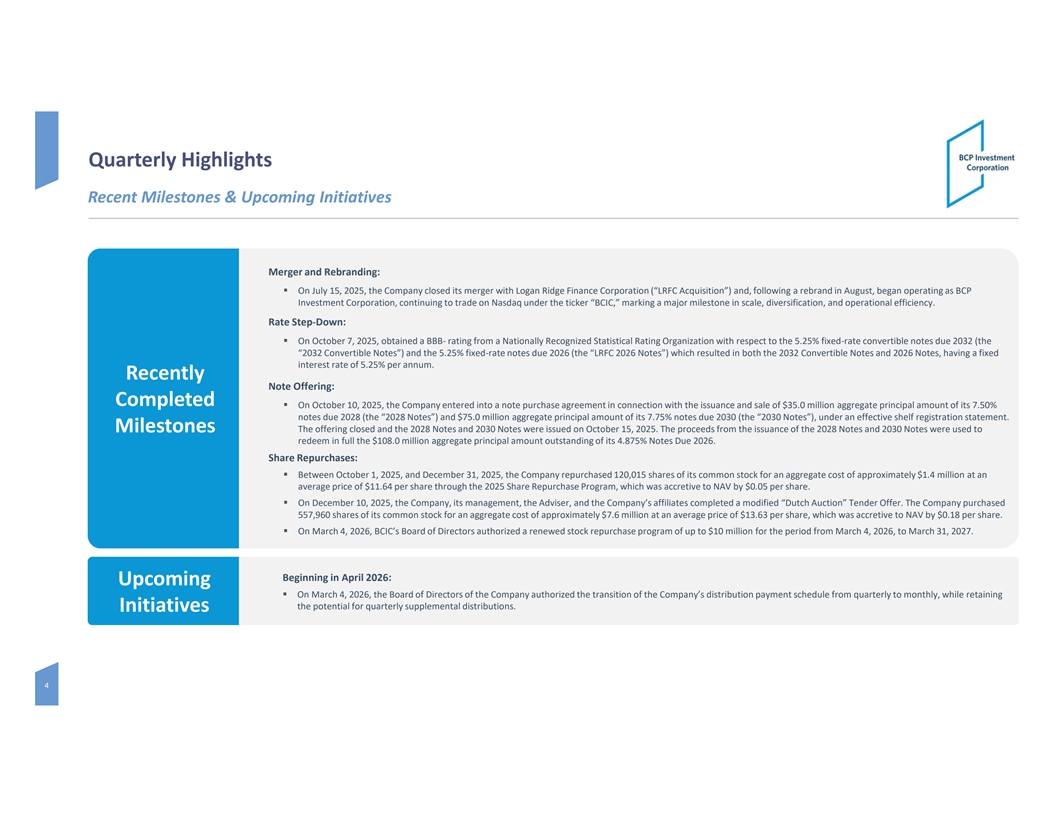
Quarterly Highlights Recent Milestones & Upcoming Initiatives M Me er rg ge er r a and nd R Re eb br ran anding ding: : §§ O On n J Ju ul ly y 1 15 5, , 2 20 02 25 5, , t th he e Co Com mp pa an ny y c cl lo os se ed d i it ts s m me er rg ge er r w wi it th h Lo Log ga an n R Ri id dg ge e F Fi in na an nc ce e C Co or rp po or ra at ti io on n ( (“ “LR LRF FC C A Ac cq qu ui is si it ti io on n” ”) ) a an nd d, , f fo ol ll lo ow wi in ng g a a r re eb br ra an nd d i in n A Au ug gu us st t, , b beg ega an n o op pe er ra at ti in ng g a as s B BC CP P I In nve ves st tm me en nt t Co Cor rp po or ra at ti io on n, , c co on nt ti in nu ui in ng g t to o t tr ra ad de e o on n Na Nas sd da aq q u un nd de er r t th he e t ti ic ck ker er “ “B BCI CIC C, ,” ” m ma ar rk ki in ng g a a m ma aj jo or r m mi il les est to on ne e i in n s sc ca al le e, , d di ive ver rs si if fi ic ca at ti io on n, , a an nd d o op pe er ra at ti io on na al l ef eff fi ic ci ie en nc cy y. . R Ra at te e S Ste tep-D p-Do ow wn: n: §§ O On n Oc Oct to ob be er r 7 7, , 2 20 02 25 5, , o ob bt ta ai in ne ed d a a B BB BB B- - r ra at ti in ng g fr fro om m a a Na Nat ti io on na al ll ly y R Re ec co og gn ni iz ze ed d S St ta at ti is st ti ic ca al l R Ra at ti in ng g Or Org ga an ni iz za at ti io on n w wi it th h r res esp pe ec ct t t to o t th he e 5 5. .2 25 5% % f fi ix xe ed d-r -ra at te e c co on nve ver rt ti ib bl le e n no ot tes es d du ue e 2 20 03 32 2 ( (t th he e “ “2 20 03 32 2 Co Con nver vert ti ib bl le e N No ot te es s” ”) ) a an nd d t th he e 5 5. .2 25 5% % f fi ix xe ed d-r -ra at te e n no ot tes es d du ue e 2 20 02 26 6 ( (t th he e “ “L LR RF FC C 2 20 02 26 6 N No ot te es s”) ”) w wh hi ic ch h r res esu ul lt te ed d i in n b bo ot th h t th he e 2 20 03 32 2 C Co on nve ver rt ti ib bl le e No Not tes es a an nd d 2 20 02 26 6 No Not tes es, , h ha avi vin ng g a a f fi ix xe ed d i in nt ter ere es st t r ra at te e o of f 5 5. .2 25 5% % p per er a an nn nu um m. . R Re ec ce en ntl tly y N Not ote e O Of ff fe er ring ing: : Com Comple plet te ed d §§ O On n Oc Oct to ob be er r 1 10 0, , 2 20 02 25 5, , t th he e Co Com mp pa an ny y e en nt ter ered ed i in nt to o a a n no ot te e p pu ur rc ch ha as se e a ag gr re ee em men ent t i in n c co on nn ne ec ct ti io on n w wi it th h t th he e i is ss su ua an nc ce e a an nd d s sa al le e o of f $ $3 35 5. .0 0 m mi il ll li io on n a ag gg gr rega egat te e p pr ri in nc ci ip pa al l a am mo ou un nt t o of f i it ts s 7 7. .5 50 0% % n no ot te es s d du ue e 2 20 02 28 8 ( (t th he e “2 “20 02 28 8 No Not te es s” ”) ) a an nd d $ $7 75 5. .0 0 m mi il ll li io on n a ag gg gr rega egat te e p pr ri in nc ci ip pa al l a am mo ou un nt t o of f i it ts s 7 7. .7 75 5% % n no ot tes es d du ue e 2 20 03 30 0 ( (t th he e “ “2 20 03 30 0 No Not tes es”) ”), , u un nd de er r a an n ef eff fe ec ct ti ive ve s sh he el lf f r re eg gi is st tr ra at ti io on n s st ta at te em me en nt t. . M Miles ilest to on ne es s T Th he e o off ffe er ri in ng g c cl lo os sed ed a an nd d t th he e 2 20 02 28 8 N No ot te es s a an nd d 2 20 03 30 0 No Not tes es w we er re e i is ss su ue ed d o on n O Oc ct to ob ber er 1 15 5, , 2 20 02 25 5. . T Th he e p pr ro oc ce ee ed ds s f fr ro om m t th he e i is ss su ua an nc ce e o of f t th he e 2 20 02 28 8 No Not te es s a an nd d 2 20 03 30 0 No Not te es s w we er re e u us se ed d t to o r red edee eem m i in n fu ful ll l t th he e $ $1 10 08 8. .0 0 m mi il ll li io on n a ag gg gr re eg ga at te e p pr ri in nc ci ip pa al l a am mo ou un nt t o ou ut ts st ta an nd di in ng g o of f i it ts s 4 4. .8 87 75 5% % No Not te es s D Du ue e 2 20 02 26 6. . S Sha har re e R Re epur purc ch has ase es s: : §§ B Be et tw we een en O Oc ct to ob be er r 1 1, , 2 20 02 25 5, , a an nd d D De ec ce em mb be er r 3 31 1, , 2 20 02 25 5, , t th he e C Co om mp pa an ny y r rep epu ur rc ch ha as sed ed 1 12 20 0, ,0 01 15 5 s sh ha ar re es s o of f i it ts s c co om mm mo on n s st to oc ck k f fo or r a an n a ag gg gr re eg ga at te e c co os st t o of f a ap pp pr ro ox xi im ma at te el ly y $ $1 1. .4 4 m mi il ll li io on n a at t a an n a ave ver ra ag ge e p pr ri ic ce e o of f $ $1 11 1. .6 64 4 p pe er r s sh ha ar re e t th hr ro ou ug gh h t th he e 2 20 02 25 5 S Sh ha ar re e R Re ep pu ur rc ch ha as se e Pr Pro og gr ra am m, , w wh hi ic ch h w wa as s a ac cc cr re et ti iv ve e t to o NAV NAV b by y $ $0 0. .0 05 5 p pe er r s sh ha ar re e. . §§ O On n Dec Dece em mb ber er 1 10 0, , 2 20 02 25 5, , t th he e Co Com mp pa an ny, y, i it ts s m ma an na ag ge em men ent t, , t th he e A Ad dv vi is se er r, , a an nd d t th he e C Co om mp pa an ny y’ ’s s a aff ffi il li ia at tes es c co om mp pl let ete ed d a a m mo od di ifi fie ed d “Du “Dut tc ch h A Au uc ct ti io on n” ” T Te en nd de er r Of Off fer er. . T Th he e Co Com mp pa an ny y p pu ur rc ch ha as se ed d 5 55 57 7, ,9 96 60 0 s sh ha ar re es s o of f i it ts s c co om mm mo on n s st to oc ck k fo for r a an n a ag gg gr re eg ga at te e c co os st t o of f a ap pp pr ro ox xi im ma at te el ly y $ $7 7. .6 6 m mi il ll li io on n a at t a an n a aver vera ag ge e p pr ri ic ce e o of f $ $1 13 3. .6 63 3 p pe er r s sh ha ar re e, , w wh hi ic ch h w wa as s a ac cc cr re et ti ive ve t to o NA NAV V b by y $ $0 0. .1 18 8 p per er s sh ha ar re. e. §§ O On n Ma Mar rc ch h 4 4, , 2 20 02 26 6, , B BCI CIC’ C’s s B Bo oa ar rd d o of f Di Dir rect ecto or rs s a au ut th ho or ri iz ze ed d a a r re en ne ew we ed d s st to oc ck k r re ep pu ur rc ch ha as se e p pr ro og gr ra am m o of f u up p t to o $ $1 10 0 m mi il ll li io on n fo for r t th he e p pe er ri io od d fr fro om m Ma Mar rc ch h 4 4, , 2 20 02 26 6, , t to o Ma Mar rc ch h 3 31 1, , 2 20 02 27 7. . B Be eg gin inning ning i in n A Apr pril il 20 2026 26: : Upc Upcom omin ing g §§ On On Ma Mar rc ch h 4 4, , 2 20 02 26 6, , t th he e B Bo oa ar rd d o of f Di Dir re ec ct to or rs s o of f t th he e C Co om mp pa an ny y a au ut th ho or ri iz ze ed d t th he e t tr ra an ns si it ti io on n o of f t th he e Co Com mp pa an ny y’ ’s s d di is st tr ri ib bu ut ti io on n p pa ay ym men ent t s sc ch he ed du ul le e f fr ro om m q qu ua ar rt ter erl ly y t to o m mo on nt th hl ly y, , w wh hi il le e r re et ta ai in ni in ng g t th he e p po ot te en nt ti ia al l f fo or r q qu ua ar rt ter erl ly y s su up pp pl le em men ent ta al l d di is st tr ri ib bu ut ti io on ns s. . I Initia nitiati tiv ve es s 4
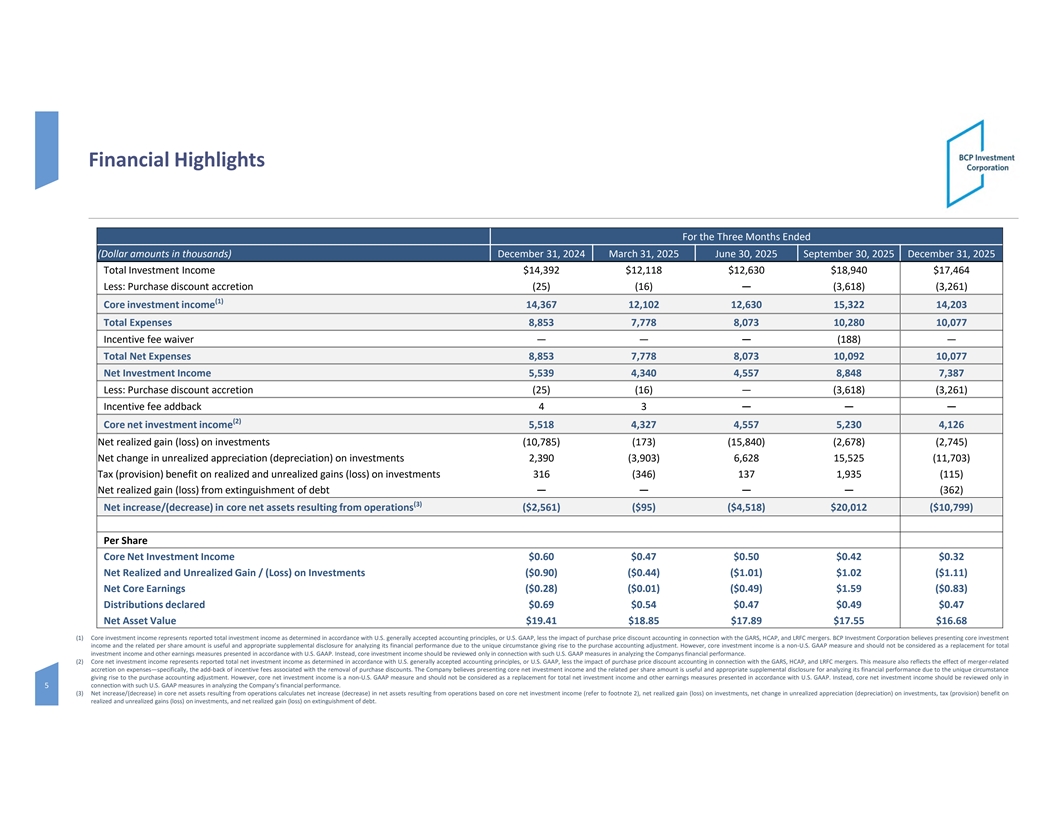
Financial Highlights For the Three Months Ended (Dollar amounts in thousands) December 31, 2024 March 31, 2025 June 30, 2025 September 30, 2025 December 31, 2025 Total Investment Income $14,392 $12,118 $12,630 $18,940 $17,464 Less: Purchase discount accretion (25) (16) — (3,618) (3,261) (1) Core investment income 14,367 12,102 12,630 15,322 14,203 Total Expenses 8,853 7,778 8,073 10,280 10,077 Incentive fee waiver — — — (188) — Total Net Expenses 8,853 7,778 8,073 10,092 10,077 Net Investment Income 5,539 4,340 4,557 8,848 7,387 Less: Purchase discount accretion (25) (16) — (3,618) (3,261) Incentive fee addback 4 3 — — — (2) Core net investment income 5,518 4,327 4,557 5,230 4,126 Net realized gain (loss) on investments (10,785) (173) (15,840) (2,678) (2,745) Net change in unrealized appreciation (depreciation) on investments 2,390 (3,903) 6,628 15,525 (11,703) Tax (provision) benefit on realized and unrealized gains (loss) on investments 316 (346) 137 1,935 (115) Net realized gain (loss) from extinguishment of debt — — — — (362) (3) Net increase/(decrease) in core net assets resulting from operations ($2,561) ($95) ($4,518) $20,012 ($10,799) Per Share Core Net Investment Income $0.60 $0.47 $0.50 $0.42 $0.32 Net Realized and Unrealized Gain / (Loss) on Investments ($0.90) ($0.44) ($1.01) $1.02 ($1.11) Net Core Earnings ($0.28) ($0.01) ($0.49) $1.59 ($0.83) Distributions declared $0.69 $0.54 $0.47 $0.49 $0.47 Net Asset Value $19.41 $18.85 $17.89 $17.55 $16.68 (1) Core investment income represents reported total investment income as determined in accordance with U.S. generally accepted accounting principles, or U.S. GAAP, less the impact of purchase price discount accounting in connection with the GARS, HCAP, and LRFC mergers. BCP Investment Corporation believes presenting core investment income and the related per share amount is useful and appropriate supplemental disclosure for analyzing its financial performance due to the unique circumstance giving rise to the purchase accounting adjustment. However, core investment income is a non-U.S. GAAP measure and should not be considered as a replacement for total investment income and other earnings measures presented in accordance with U.S. GAAP. Instead, core investment income should be reviewed only in connection with such U.S. GAAP measures in analyzing the Companys financial performance. (2) Core net investment income represents reported total net investment income as determined in accordance with U.S. generally accepted accounting principles, or U.S. GAAP, less the impact of purchase price discount accounting in connection with the GARS, HCAP, and LRFC mergers. This measure also reflects the effect of merger-related accretion on expenses—specifically, the add-back of incentive fees associated with the removal of purchase discounts. The Company believes presenting core net investment income and the related per share amount is useful and appropriate supplemental disclosure for analyzing its financial performance due to the unique circumstance giving rise to the purchase accounting adjustment. However, core net investment income is a non-U.S. GAAP measure and should not be considered as a replacement for total net investment income and other earnings measures presented in accordance with U.S. GAAP. Instead, core net investment income should be reviewed only in 5 connection with such U.S. GAAP measures in analyzing the Company’s financial performance. (3) Net increase/(decrease) in core net assets resulting from operations calculates net increase (decrease) in net assets resulting from operations based on core net investment income (refer to footnote 2), net realized gain (loss) on investments, net change in unrealized appreciation (depreciation) on investments, tax (provision) benefit on realized and unrealized gains (loss) on investments, and net realized gain (loss) on extinguishment of debt.
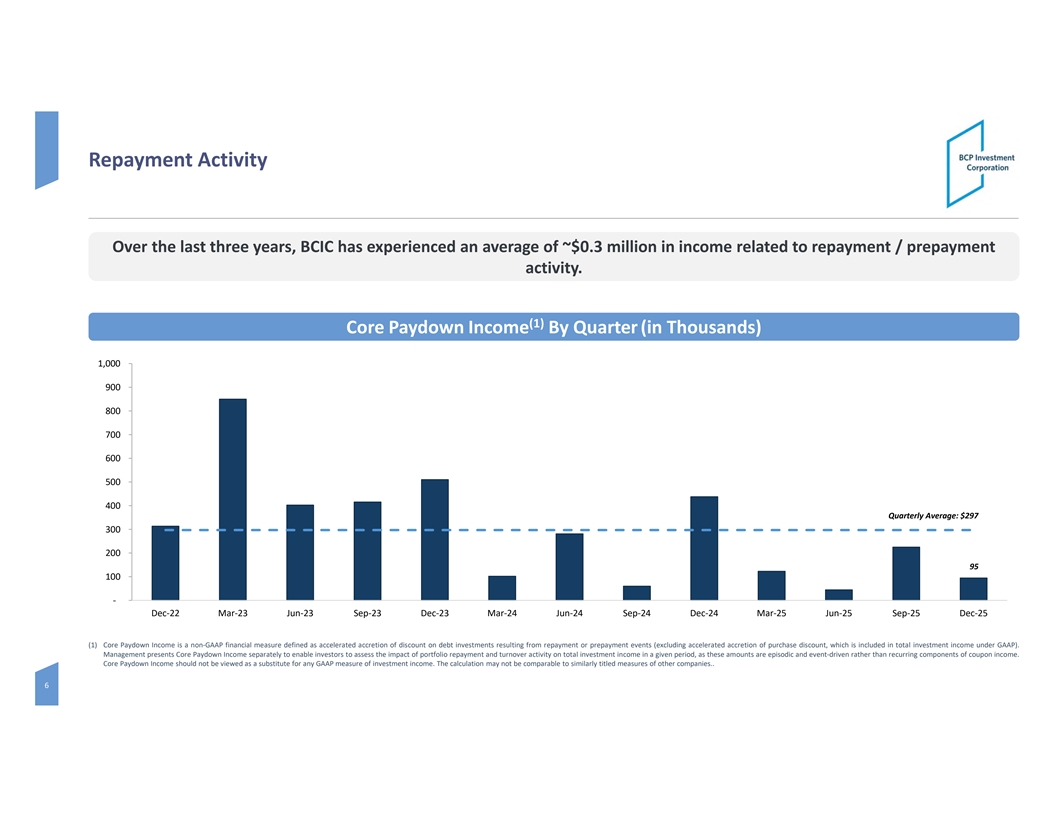
Repayment Activity O Ov ve er r t the he la las st t th thr re ee e y ye ea ar rs s, , B BC CI IC C ha has s e ex xpe peri rie enc nce ed d a an n a av ve er ra ag ge e o of f ~ ~$ $0 0. .3 3 m mi illio llion n in in i inc ncom ome e r re el la at te ed t d to o r re epa pay ym me en nt t / / pr pre epa paym yme en nt t a act ctivit ivity y. . (1) Core Paydown Income By Quarter (in Thousands) 1,000 900 800 700 600 500 400 Quarterly Average: $297 300 200 95 100 - Dec-22 Mar-23 Jun-23 Sep-23 Dec-23 Mar-24 Jun-24 Sep-24 Dec-24 Mar-25 Jun-25 Sep-25 Dec-25 (1) Core Paydown Income is a non-GAAP financial measure defined as accelerated accretion of discount on debt investments resulting from repayment or prepayment events (excluding accelerated accretion of purchase discount, which is included in total investment income under GAAP). Management presents Core Paydown Income separately to enable investors to assess the impact of portfolio repayment and turnover activity on total investment income in a given period, as these amounts are episodic and event-driven rather than recurring components of coupon income. Core Paydown Income should not be viewed as a substitute for any GAAP measure of investment income. The calculation may not be comparable to similarly titled measures of other companies.. 6
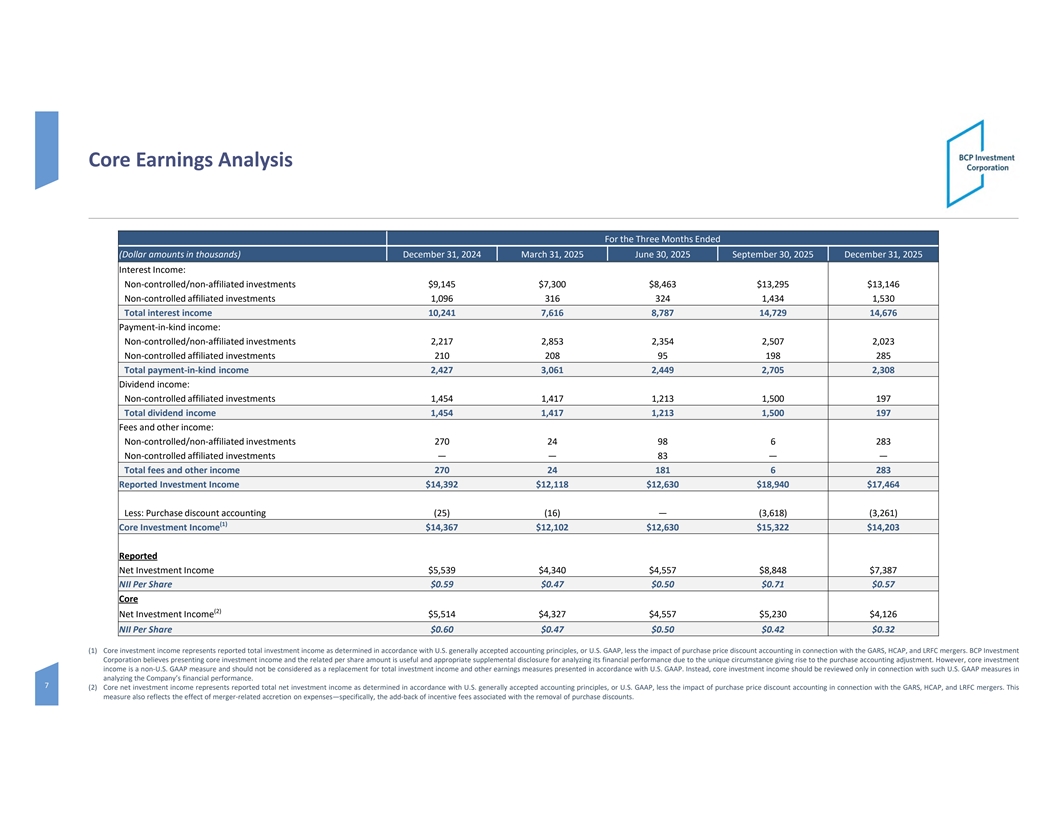
Core Earnings Analysis For the Three Months Ended (Dollar amounts in thousands) December 31, 2024 March 31, 2025 June 30, 2025 September 30, 2025 December 31, 2025 Interest Income: Non-controlled/non-affiliated investments $9,145 $7,300 $8,463 $13,295 $13,146 Non-controlled affiliated investments 1,096 316 324 1,434 1,530 Total interest income 10,241 7,616 8,787 14,729 14,676 Payment-in-kind income: Non-controlled/non-affiliated investments 2,217 2,853 2,354 2,507 2,023 Non-controlled affiliated investments 210 208 95 198 285 Total payment-in-kind income 2,427 3,061 2,449 2,705 2,308 Dividend income: Non-controlled affiliated investments 1,454 1,417 1,213 1,500 197 Total dividend income 1,454 1,417 1,213 1,500 197 Fees and other income: Non-controlled/non-affiliated investments 270 24 98 6 283 Non-controlled affiliated investments — — 83 — — Total fees and other income 270 24 181 6 283 Reported Investment Income $14,392 $12,118 $12,630 $18,940 $17,464 Less: Purchase discount accounting (25) (16) — (3,618) (3,261) (1) Core Investment Income $14,367 $12,102 $12,630 $15,322 $14,203 Reported Net Investment Income $5,539 $4,340 $4,557 $8,848 $7,387 NII Per Share $0.59 $0.47 $0.50 $0.71 $0.57 Core (2) Net Investment Income $5,514 $4,327 $4,557 $5,230 $4,126 NII Per Share $0.60 $0.47 $0.50 $0.42 $0.32 (1) Core investment income represents reported total investment income as determined in accordance with U.S. generally accepted accounting principles, or U.S. GAAP, less the impact of purchase price discount accounting in connection with the GARS, HCAP, and LRFC mergers. BCP Investment Corporation believes presenting core investment income and the related per share amount is useful and appropriate supplemental disclosure for analyzing its financial performance due to the unique circumstance giving rise to the purchase accounting adjustment. However, core investment income is a non-U.S. GAAP measure and should not be considered as a replacement for total investment income and other earnings measures presented in accordance with U.S. GAAP. Instead, core investment income should be reviewed only in connection with such U.S. GAAP measures in analyzing the Company’s financial performance. 7 (2) Core net investment income represents reported total net investment income as determined in accordance with U.S. generally accepted accounting principles, or U.S. GAAP, less the impact of purchase price discount accounting in connection with the GARS, HCAP, and LRFC mergers. This measure also reflects the effect of merger-related accretion on expenses—specifically, the add-back of incentive fees associated with the removal of purchase discounts.
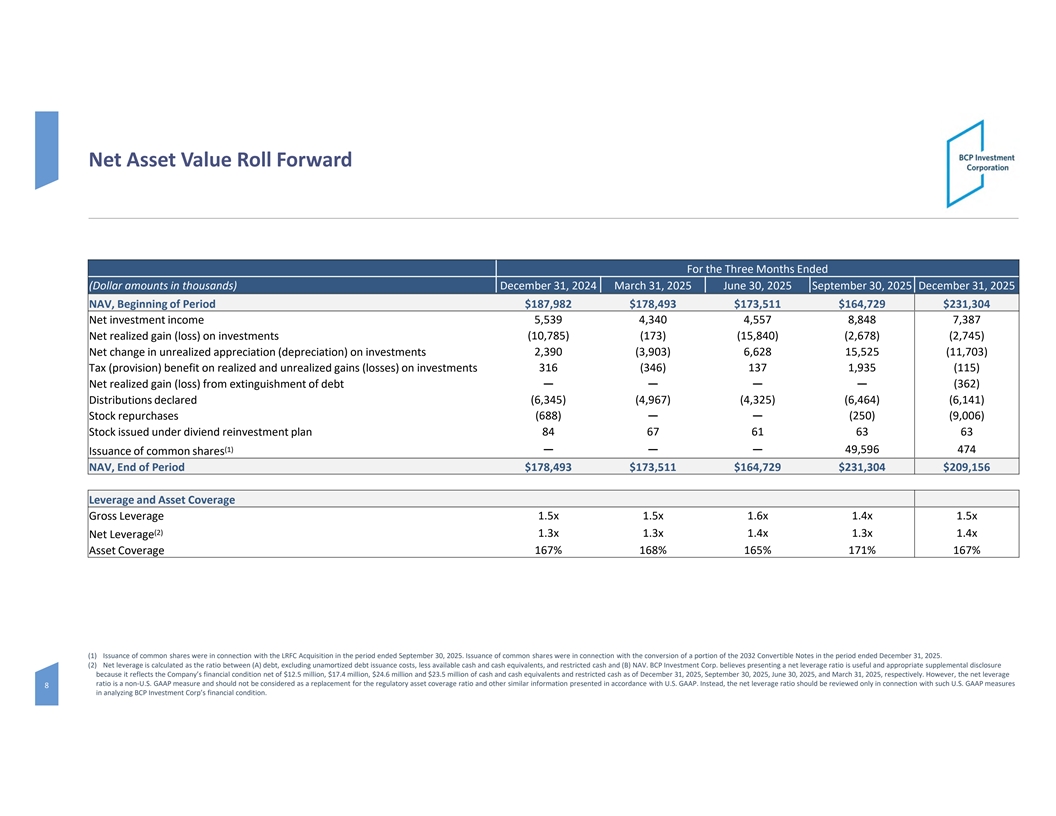
Net Asset Value Roll Forward For the Three Months Ended (Dollar amounts in thousands) December 31, 2024 March 31, 2025 June 30, 2025 September 30, 2025 December 31, 2025 NAV, Beginning of Period $187,982 $178,493 $173,511 $164,729 $231,304 Net investment income 5,539 4,340 4,557 8,848 7,387 Net realized gain (loss) on investments (10,785) (173) (15,840) (2,678) (2,745) Net change in unrealized appreciation (depreciation) on investments 2,390 (3,903) 6,628 15,525 (11,703) Tax (provision) benefit on realized and unrealized gains (losses) on investments 316 (346) 137 1,935 (115) Net realized gain (loss) from extinguishment of debt — — — — (362) Distributions declared (6,345) (4,967) (4,325) (6,464) (6,141) Stock repurchases (688) — — (250) (9,006) Stock issued under diviend reinvestment plan 84 67 61 63 63 (1) — — — 49,596 474 Issuance of common shares NAV, End of Period $178,493 $173,511 $164,729 $231,304 $209,156 Leverage and Asset Coverage Gross Leverage 1.5x 1.5x 1.6x 1.4x 1.5x (2) 1.3x 1.3x 1.4x 1.3x 1.4x Net Leverage Asset Coverage 167% 168% 165% 171% 167% (1) Issuance of common shares were in connection with the LRFC Acquisition in the period ended September 30, 2025. Issuance of common shares were in connection with the conversion of a portion of the 2032 Convertible Notes in the period ended December 31, 2025. (2) Net leverage is calculated as the ratio between (A) debt, excluding unamortized debt issuance costs, less available cash and cash equivalents, and restricted cash and (B) NAV. BCP Investment Corp. believes presenting a net leverage ratio is useful and appropriate supplemental disclosure because it reflects the Company’s financial condition net of $12.5 million, $17.4 million, $24.6 million and $23.5 million of cash and cash equivalents and restricted cash as of December 31, 2025, September 30, 2025, June 30, 2025, and March 31, 2025, respectively. However, the net leverage ratio is a non-U.S. GAAP measure and should not be considered as a replacement for the regulatory asset coverage ratio and other similar information presented in accordance with U.S. GAAP. Instead, the net leverage ratio should be reviewed only in connection with such U.S. GAAP measures 8 in analyzing BCP Investment Corp’s financial condition.
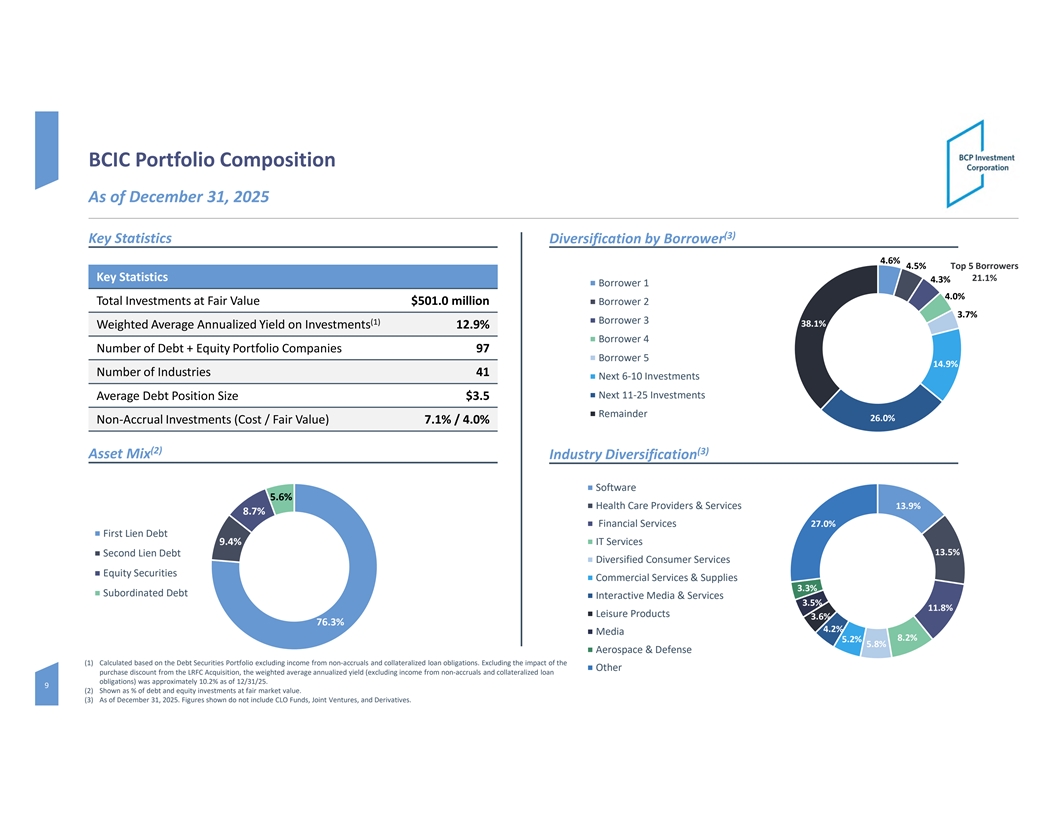
BCIC Portfolio Composition As of December 31, 2025 (3) Key Statistics Diversification by Borrower 4.6% 4.5% Top 5 Borrowers Key Statistics 21.1% 4.3% Borrower 1 4.0% Total Investments at Fair Value $501.0 million Borrower 2 3.7% Borrower 3 (1) 38.1% Weighted Average Annualized Yield on Investments 12.9% Borrower 4 Number of Debt + Equity Portfolio Companies 97 Borrower 5 14.9% Number of Industries 41 Next 6-10 Investments Next 11-25 Investments Average Debt Position Size $3.5 Remainder 26.0% Non-Accrual Investments (Cost / Fair Value) 7.1% / 4.0% (2) (3) Asset Mix Industry Diversification Software 5.6% Health Care Providers & Services 13.9% 8.7% Financial Services 27.0% First Lien Debt 9.4% IT Services 13.5% Second Lien Debt Diversified Consumer Services Equity Securities Commercial Services & Supplies 3.3% Subordinated Debt Interactive Media & Services 3.5% 11.8% Leisure Products 3.6% 76.3% 4.2% Media 8.2% 5.2% 5.8% Aerospace & Defense (1) Calculated based on the Debt Securities Portfolio excluding income from non-accruals and collateralized loan obligations. Excluding the impact of the Other purchase discount from the LRFC Acquisition, the weighted average annualized yield (excluding income from non-accruals and collateralized loan obligations) was approximately 10.2% as of 12/31/25. 9 (2) Shown as % of debt and equity investments at fair market value. (3) As of December 31, 2025. Figures shown do not include CLO Funds, Joint Ventures, and Derivatives.
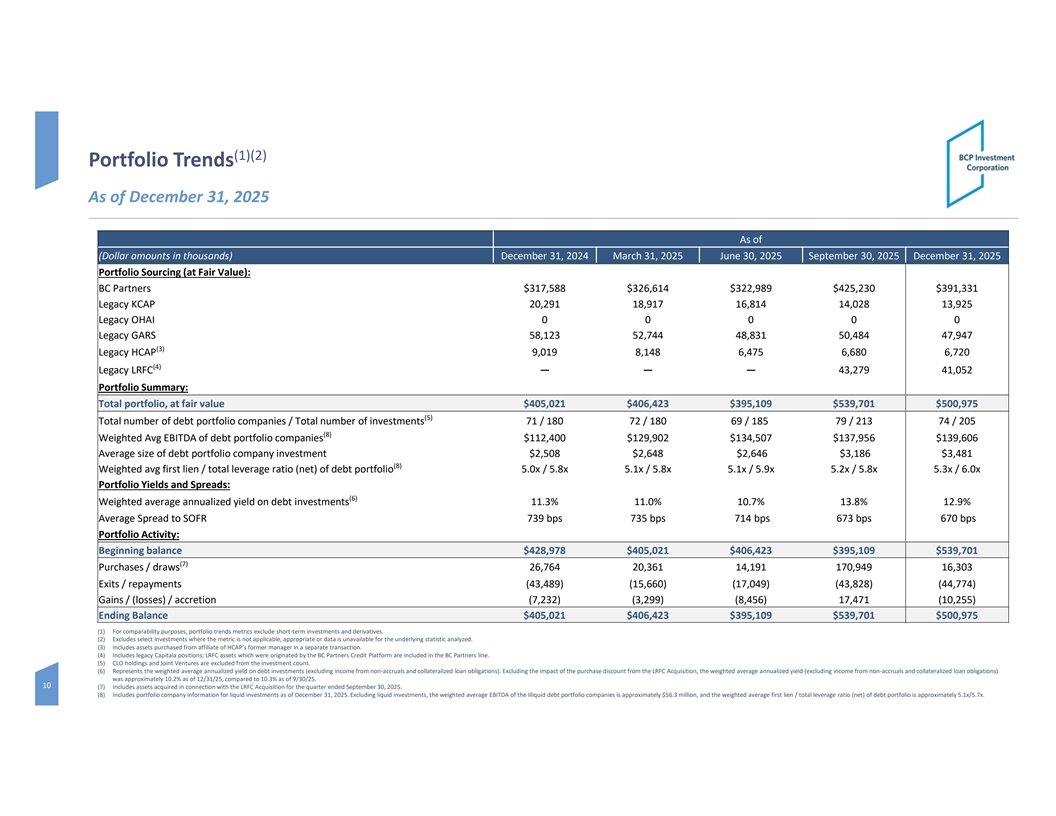
(1)(2) Portfolio Trends As of December 31, 2025 As of (Dollar amounts in thousands) December 31, 2024 March 31, 2025 June 30, 2025 September 30, 2025 December 31, 2025 Portfolio Sourcing (at Fair Value): BC Partners $317,588 $326,614 $322,989 $425,230 $391,331 Legacy KCAP 20,291 18,917 16,814 14,028 13,925 Legacy OHAI 0 0 0 0 0 Legacy GARS 58,123 52,744 48,831 50,484 47,947 (3) Legacy HCAP 9,019 8,148 6,475 6,680 6,720 (4) Legacy LRFC — — — 43,279 41,052 Portfolio Summary: Total portfolio, at fair value $405,021 $406,423 $395,109 $539,701 $500,975 (5) Total number of debt portfolio companies / Total number of investments 71 / 180 72 / 180 69 / 185 79 / 213 74 / 205 (8) Weighted Avg EBITDA of debt portfolio companies $112,400 $129,902 $134,507 $137,956 $139,606 Average size of debt portfolio company investment $2,508 $2,648 $2,646 $3,186 $3,481 (8) Weighted avg first lien / total leverage ratio (net) of debt portfolio 5.0x / 5.8x 5.1x / 5.8x 5.1x / 5.9x 5.2x / 5.8x 5.3x / 6.0x Portfolio Yields and Spreads: (6) Weighted average annualized yield on debt investments 11.3% 11.0% 10.7% 13.8% 12.9% Average Spread to SOFR 739 bps 735 bps 714 bps 673 bps 670 bps Portfolio Activity: Beginning balance $428,978 $405,021 $406,423 $395,109 $539,701 (7) Purchases / draws 26,764 20,361 14,191 170,949 16,303 Exits / repayments (43,489) (15,660) (17,049) (43,828) (44,774) Gains / (losses) / accretion (7,232) (3,299) (8,456) 17,471 (10,255) Ending Balance $405,021 $406,423 $395,109 $539,701 $500,975 (1) For comparability purposes, portfolio trends metrics exclude short-term investments and derivatives. (2) Excludes select investments where the metric is not applicable, appropriate or data is unavailable for the underlying statistic analyzed. (3) Includes assets purchased from affiliate of HCAP’s former manager in a separate transaction. (4) Includes legacy Capitala positions; LRFC assets which were originated by the BC Partners Credit Platform are included in the BC Partners line. (5) CLO holdings and Joint Ventures are excluded from the investment count. (6) Represents the weighted average annualized yield on debt investments (excluding income from non-accruals and collateralized loan obligations). Excluding the impact of the purchase discount from the LRFC Acquisition, the weighted average annualized yield (excluding income from non-accruals and collateralized loan obligations) was approximately 10.2% as of 12/31/25, compared to 10.3% as of 9/30/25. 10 (7) Includes assets acquired in connection with the LRFC Acquisition for the quarter ended September 30, 2025. (8) Includes portfolio company information for liquid investments as of December 31, 2025. Excluding liquid investments, the weighted average EBITDA of the illiquid debt portfolio companies is approximately $56.3 million, and the weighted average first lien / total leverage ratio (net) of debt portfolio is approximately 5.1x/5.7x.
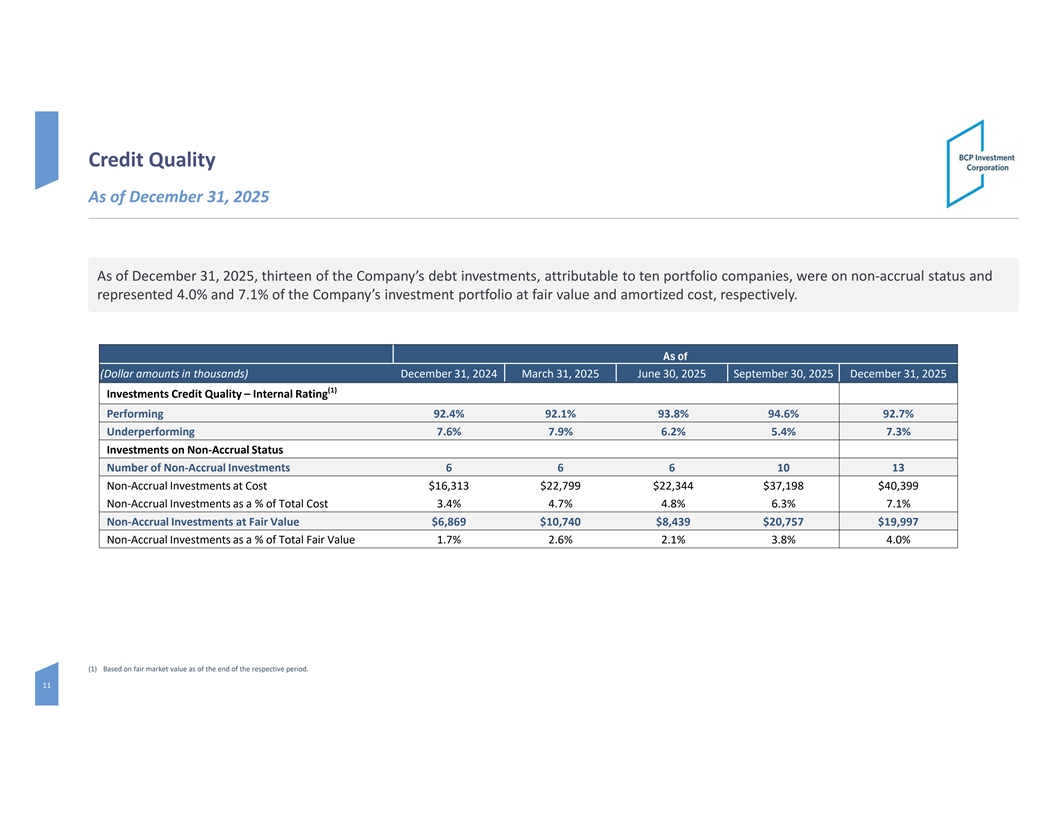
Credit Quality As of December 31, 2025 A As s o of f De Dec ce em mb be er r 3 31 1, , 2 20 02 25 5, , t th hir irt te ee en n o of f t th he e C Co om mp pan any y’ ’s s d de eb bt t in inv ve es st tm me en nt ts s, , a at tt tr rib ibu ut ta ab ble le t to o t te en n p po or rt tf fo oli lio o c co om mp pan ani ie es s, , w we er re e o on n n no on n- -ac acc cr ru ual al s st ta at tu us s an and d r re ep pr re es se en nt te ed d 4 4. .0 0% % an and d 7 7. .1 1% % o of f t th he e C Co om mp pan any y’ ’s s in inv ve es st tm me en nt t p po or rt tf fo oli lio o a at t f fai air r v val alu ue e an and d am amo or rt tiz ize ed d c co os st t, , r re es sp pe ec ct tiv ive ely ly. . As of (Dollar amounts in thousands) December 31, 2024 March 31, 2025 June 30, 2025 September 30, 2025 December 31, 2025 (1) Investments Credit Quality – Internal Rating Performing 92.4% 92.1% 93.8% 94.6% 92.7% Underperforming 7.6% 7.9% 6.2% 5.4% 7.3% Investments on Non-Accrual Status Number of Non-Accrual Investments 6 6 6 10 13 Non-Accrual Investments at Cost $16,313 $22,799 $22,344 $37,198 $40,399 Non-Accrual Investments as a % of Total Cost 3.4% 4.7% 4.8% 6.3% 7.1% Non-Accrual Investments at Fair Value $6,869 $10,740 $8,439 $20,757 $19,997 Non-Accrual Investments as a % of Total Fair Value 1.7% 2.6% 2.1% 3.8% 4.0% (1) Based on fair market value as of the end of the respective period. 11
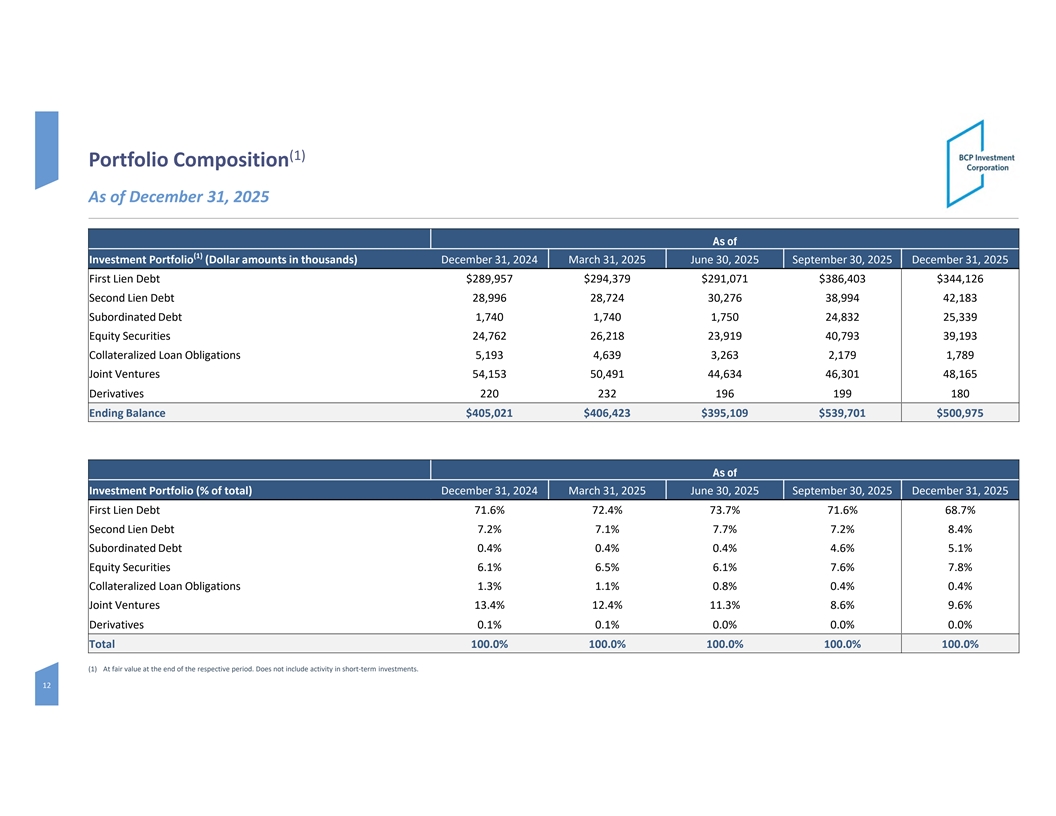
(1) Portfolio Composition As of December 31, 2025 As of (1) Investment Portfolio (Dollar amounts in thousands) December 31, 2024 March 31, 2025 June 30, 2025 September 30, 2025 December 31, 2025 First Lien Debt $289,957 $294,379 $291,071 $386,403 $344,126 Second Lien Debt 28,996 28,724 30,276 38,994 42,183 Subordinated Debt 1,740 1,740 1,750 24,832 25,339 Equity Securities 24,762 26,218 23,919 40,793 39,193 Collateralized Loan Obligations 5,193 4,639 3,263 2,179 1,789 Joint Ventures 54,153 50,491 44,634 46,301 48,165 Derivatives 220 232 196 199 180 Ending Balance $405,021 $406,423 $395,109 $539,701 $500,975 As of Investment Portfolio (% of total) December 31, 2024 March 31, 2025 June 30, 2025 September 30, 2025 December 31, 2025 First Lien Debt 71.6% 72.4% 73.7% 71.6% 68.7% Second Lien Debt 7.2% 7.1% 7.7% 7.2% 8.4% Subordinated Debt 0.4% 0.4% 0.4% 4.6% 5.1% Equity Securities 6.1% 6.5% 6.1% 7.6% 7.8% Collateralized Loan Obligations 1.3% 1.1% 0.8% 0.4% 0.4% Joint Ventures 13.4% 12.4% 11.3% 8.6% 9.6% Derivatives 0.1% 0.1% 0.0% 0.0% 0.0% Total 100.0% 100.0% 100.0% 100.0% 100.0% (1) At fair value at the end of the respective period. Does not include activity in short-term investments. 12

Appendix
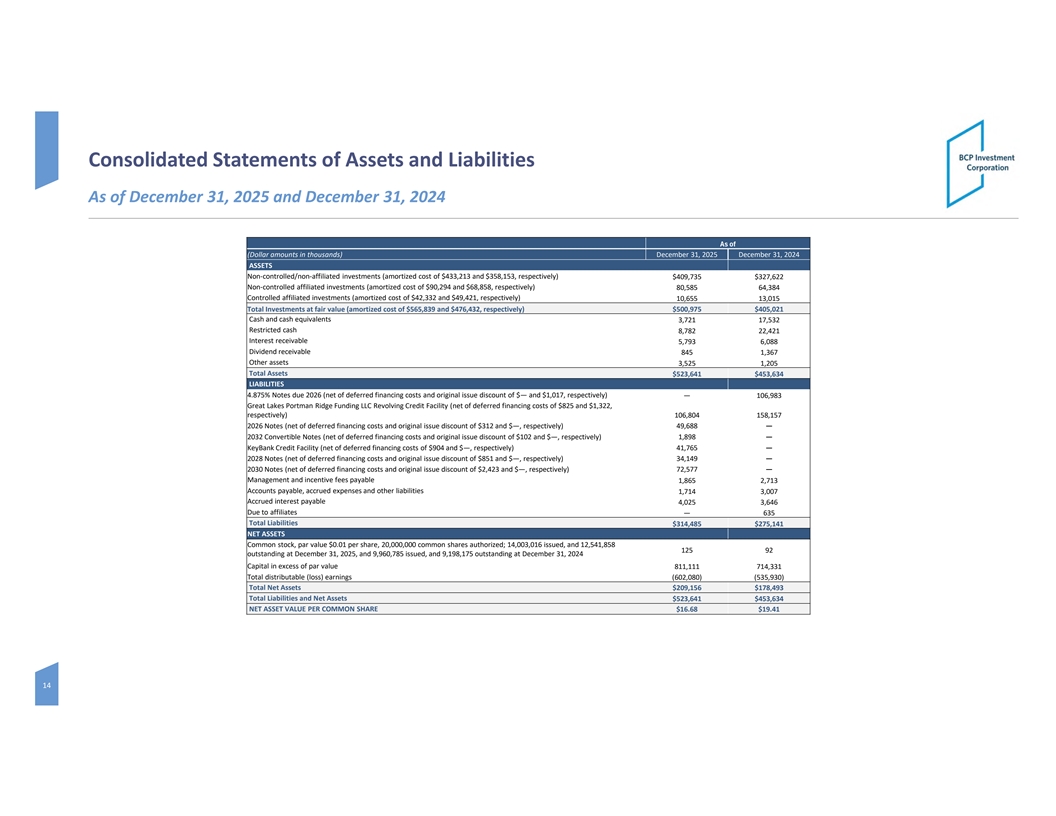
Consolidated Statements of Assets and Liabilities As of December 31, 2025 and December 31, 2024 As of (Dollar amounts in thousands) December 31, 2025 December 31, 2024 ASSETS Non-controlled/non-affiliated investments (amortized cost of $433,213 and $358,153, respectively) $409,735 $327,622 Non-controlled affiliated investments (amortized cost of $90,294 and $68,858, respectively) 80,585 64,384 Controlled affiliated investments (amortized cost of $42,332 and $49,421, respectively) 10,655 13,015 Total Investments at fair value (amortized cost of $565,839 and $476,432, respectively) $500,975 $405,021 Cash and cash equivalents 3,721 17,532 Restricted cash 8,782 22,421 Interest receivable 5,793 6,088 Dividend receivable 845 1,367 Other assets 3,525 1,205 Total Assets $523,641 $453,634 LIABILITIES 4.875% Notes due 2026 (net of deferred financing costs and original issue discount of $— and $1,017, respectively) — 106,983 Great Lakes Portman Ridge Funding LLC Revolving Credit Facility (net of deferred financing costs of $825 and $1,322, respectively) 106,804 158,157 2026 Notes (net of deferred financing costs and original issue discount of $312 and $—, respectively) 49,688 — 2032 Convertible Notes (net of deferred financing costs and original issue discount of $102 and $—, respectively) 1,898 — KeyBank Credit Facility (net of deferred financing costs of $904 and $—, respectively) 41,765 — 2028 Notes (net of deferred financing costs and original issue discount of $851 and $—, respectively) 34,149 — 2030 Notes (net of deferred financing costs and original issue discount of $2,423 and $—, respectively) 72,577 — Management and incentive fees payable 1,865 2,713 Accounts payable, accrued expenses and other liabilities 1,714 3,007 Accrued interest payable 4,025 3,646 Due to affiliates — 635 Total Liabilities $314,485 $275,141 NET ASSETS Common stock, par value $0.01 per share, 20,000,000 common shares authorized; 14,003,016 issued, and 12,541,858 125 92 outstanding at December 31, 2025, and 9,960,785 issued, and 9,198,175 outstanding at December 31, 2024 Capital in excess of par value 811,111 714,331 Total distributable (loss) earnings (602,080) (535,930) Total Net Assets $209,156 $178,493 Total Liabilities and Net Assets $523,641 $453,634 NET ASSET VALUE PER COMMON SHARE $16.68 $19.41 14
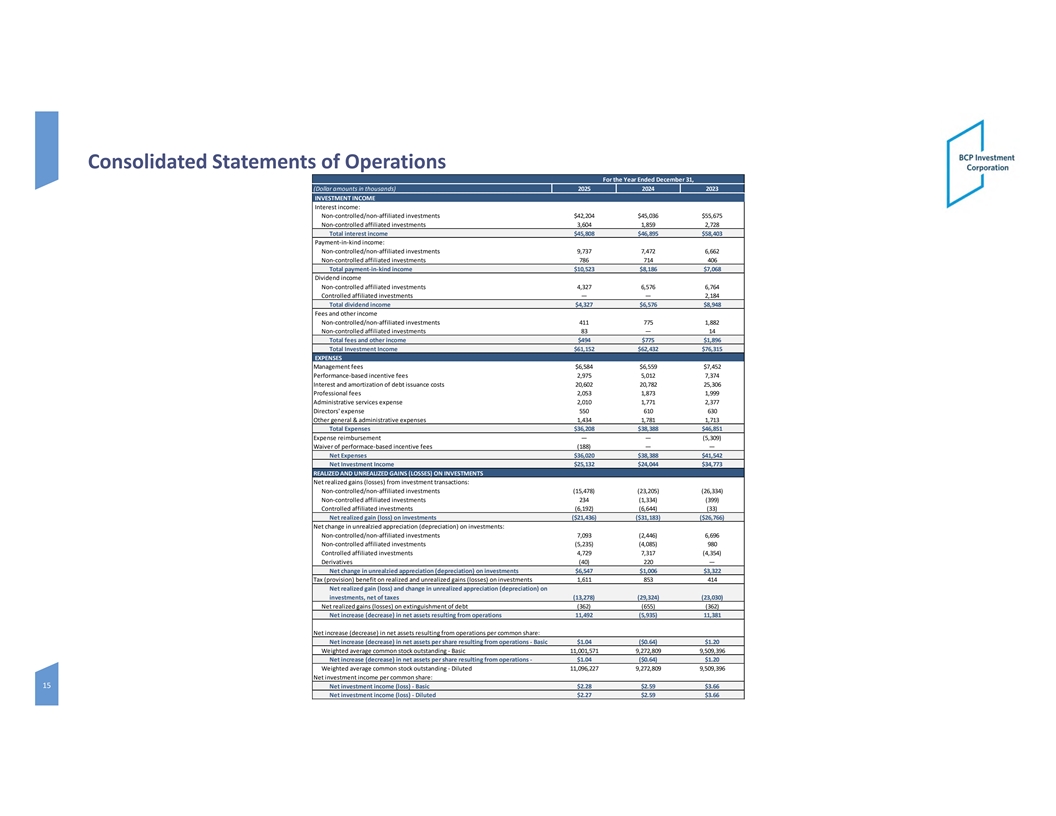
Consolidated Statements of Operations For the Year Ended December 31, (Dollar amounts in thousands) 2025 2024 2023 INVESTMENT INCOME Interest income: Non-controlled/non-affiliated investments $42,204 $45,036 $55,675 Non-controlled affiliated investments 3,604 1,859 2,728 Total interest income $45,808 $46,895 $58,403 Payment-in-kind income: Non-controlled/non-affiliated investments 9,737 7,472 6,662 Non-controlled affiliated investments 786 714 406 Total payment-in-kind income $10,523 $8,186 $7,068 Dividend income Non-controlled affiliated investments 4,327 6,576 6,764 Controlled affiliated investments — — 2,184 Total dividend income $4,327 $6,576 $8,948 Fees and other income Non-controlled/non-affiliated investments 411 775 1,882 Non-controlled affiliated investments 83 — 14 Total fees and other income $494 $775 $1,896 Total Investment Income $61,152 $62,432 $76,315 EXPENSES Management fees $6,584 $6,559 $7,452 Performance-based incentive fees 2,975 5,012 7,374 Interest and amortization of debt issuance costs 20,602 20,782 25,306 Professional fees 2,053 1,873 1,999 Administrative services expense 2,010 1,771 2,377 Directors' expense 550 610 630 Other general & administrative expenses 1,434 1,781 1,713 Total Expenses $36,208 $38,388 $46,851 Expense reimbursement — — (5,309) Waiver of performace-based incentive fees (188) — — Net Expenses $36,020 $38,388 $41,542 Net Investment Income $25,132 $24,044 $34,773 REALIZED AND UNREALIZED GAINS (LOSSES) ON INVESTMENTS Net realized gains (losses) from investment transactions: Non-controlled/non-affiliated investments (15,478) (23,205) (26,334) Non-controlled affiliated investments 234 (1,334) (399) Controlled affiliated investments (6,192) (6,644) (33) Net realized gain (loss) on investments ($21,436) ($31,183) ($26,766) Net change in unrealzied appreciation (depreciation) on investments: Non-controlled/non-affiliated investments 7,093 (2,446) 6,696 Non-controlled affiliated investments (5,235) (4,085) 980 Controlled affiliated investments 4,729 7,317 (4,354) Derivatives (40) 220 — Net change in unrealzied appreciation (depreciation) on investments $6,547 $1,006 $3,322 Tax (provision) benefit on realized and unrealized gains (losses) on investments 1,611 853 414 Net realized gain (loss) and change in unrealized appreciation (depreciation) on investments, net of taxes (13,278) (29,324) (23,030) Net realized gains (losses) on extinguishment of debt (362) (655) (362) Net increase (decrease) in net assets resulting from operations 11,492 (5,935) 11,381 Net increase (decrease) in net assets resulting from operations per common share: Net increase (decrease) in net assets per share resulting from operations - Basic $1.04 ($0.64) $1.20 Weighted average common stock outstanding - Basic 11,001,571 9,272,809 9,509,396 Net increase (decrease) in net assets per share resulting from operations - $1.04 ($0.64) $1.20 Weighted average common stock outstanding - Diluted 11,096,227 9,272,809 9,509,396 Net investment income per common share: 15 Net investment income (loss) - Basic $2.28 $2.59 $3.66 Net investment income (loss) - Diluted $2.27 $2.59 $3.66
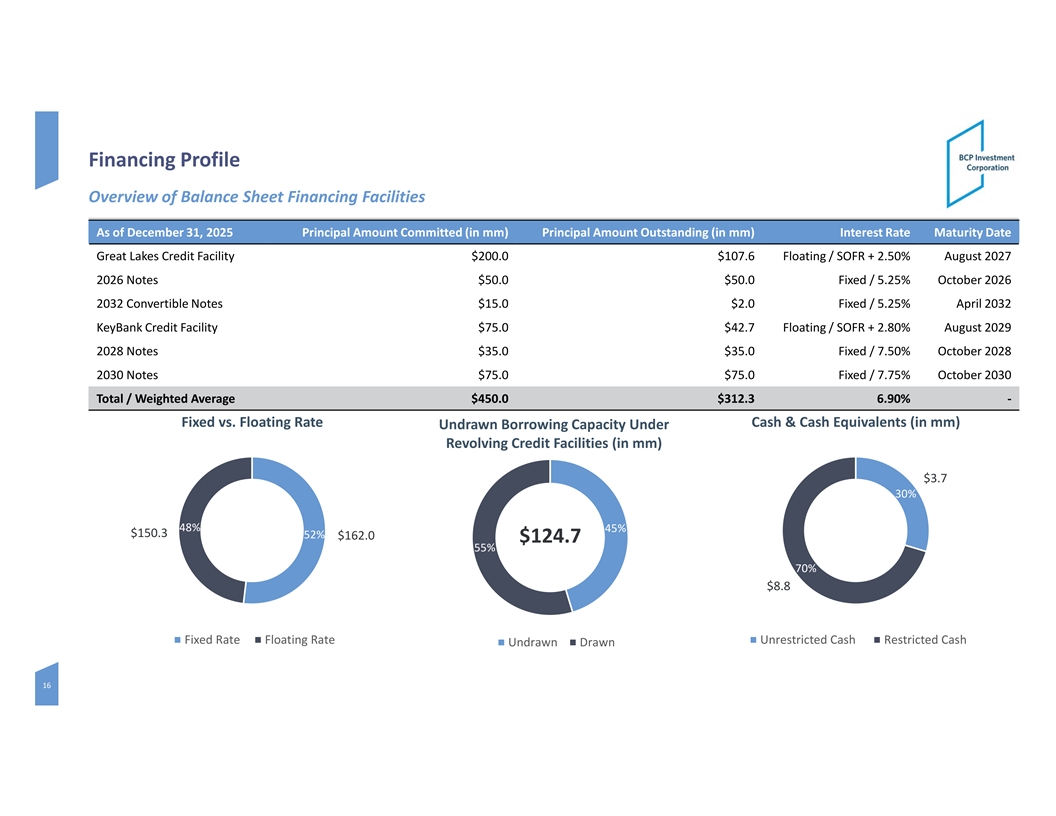
Financing Profile Overview of Balance Sheet Financing Facilities As of December 31, 2025 Principal Amount Committed (in mm) Principal Amount Outstanding (in mm) Interest Rate Maturity Date Great Lakes Credit Facility $200.0 $107.6 Floating / SOFR + 2.50% August 2027 2026 Notes $50.0 $50.0 Fixed / 5.25% October 2026 2032 Convertible Notes $15.0 $2.0 Fixed / 5.25% April 2032 KeyBank Credit Facility $75.0 $42.7 Floating / SOFR + 2.80% August 2029 2028 Notes $35.0 $35.0 Fixed / 7.50% October 2028 2030 Notes $75.0 $75.0 Fixed / 7.75% October 2030 Total / Weighted Average $450.0 $312.3 6.90% - Fixed vs. Floating Rate Cash & Cash Equivalents (in mm) Undrawn Borrowing Capacity Under Revolving Credit Facilities (in mm) $3.7 30% 48% 45% $150.3 52% $162.0 $124.7 55% 70% $8.8 Fixed Rate Floating Rate Unrestricted Cash Restricted Cash Undrawn Drawn 16
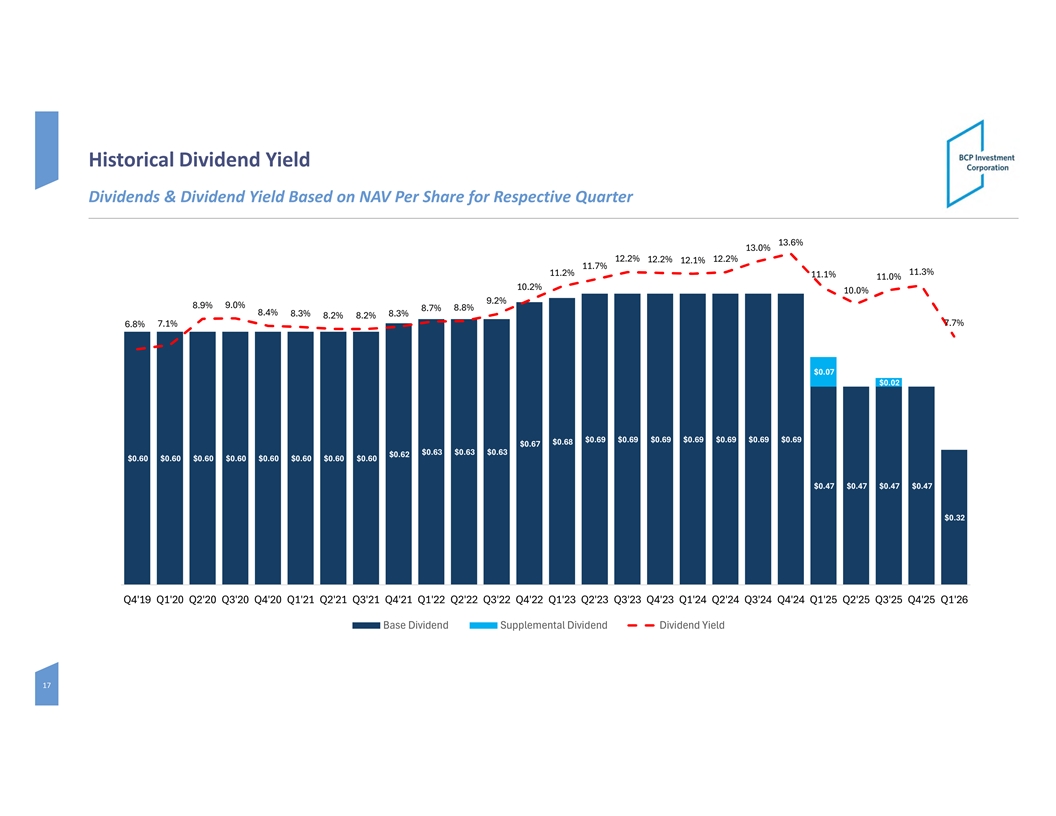
Historical Dividend Yield Dividends & Dividend Yield Based on NAV Per Share for Respective Quarter 13.6% $0.80 13.0% 12.2% 12.2% 12.2% 12.1% 11.7% 11.3% 11.2% 11.1% 11.0% 10.2% $0.70 10.0% 9.2% 10.0% 8.9% 9.0% 8.8% 8.7% 8.4% 8.3% 8.3% 8.2% 8.2% 7.1% 7.7% 6.8% $0.60 $0.07 $0.50 5.0% $0.02 $0.40 $0.69 $0.69 $0.69 $0.69 $0.69 $0.69 $0.69 $0.68 $0.67 0.0% $0.63 $0.63 $0.63 $0.62 $0.30 $0.60 $0.60 $0.60 $0.60 $0.60 $0.60 $0.60 $0.60 $0.47 $0.47 $0.47 $0.47 $0.20 -5.0% $0.32 $0.10 -10.0% $- Q4'19 Q1'20 Q2'20 Q3'20 Q4'20 Q1'21 Q2'21 Q3'21 Q4'21 Q1'22 Q2'22 Q3'22 Q4'22 Q1'23 Q2'23 Q3'23 Q4'23 Q1'24 Q2'24 Q3'24 Q4'24 Q1'25 Q2'25 Q3'25 Q4'25 Q1'26 Base Dividend Supplemental Dividend Dividend Yield 17
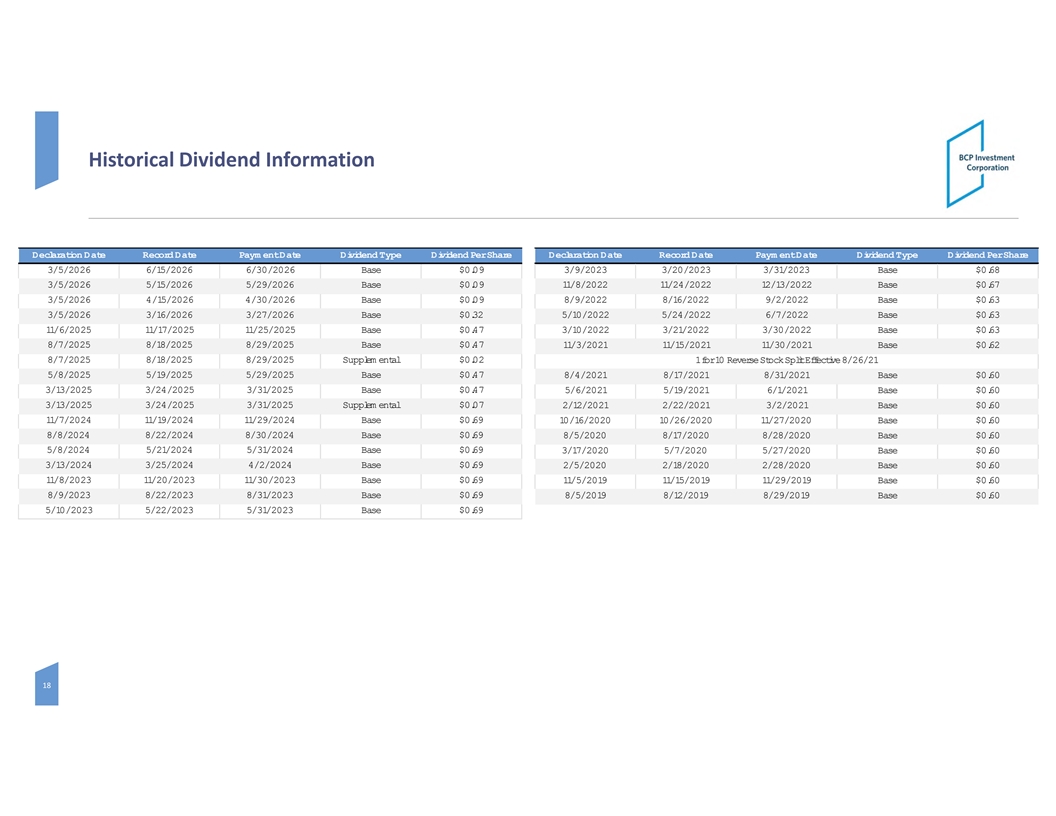
Historical Dividend Information Declaration Date Record Date Payment Date Dividend Type Dividend Per Share Declaration Date Record Date Payment Date Dividend Type Dividend Per Share 3/5/2026 6/15/2026 6/30/2026 Base $0.09 3/9/2023 3/20/2023 3/31/2023 Base $0.68 3/5/2026 5/15/2026 5/29/2026 Base $0.09 11/8/2022 11/24/2022 12/13/2022 Base $0.67 3/5/2026 4/15/2026 4/30/2026 Base $0.09 8/9/2022 8/16/2022 9/2/2022 Base $0.63 3/5/2026 3/16/2026 3/27/2026 Base $0.32 5/10/2022 5/24/2022 6/7/2022 Base $0.63 11/6/2025 11/17/2025 11/25/2025 Base $0.47 3/10/2022 3/21/2022 3/30/2022 Base $0.63 8/7/2025 8/18/2025 8/29/2025 Base $0.47 11/3/2021 11/15/2021 11/30/2021 Base $0.62 8/7/2025 8/18/2025 8/29/2025 Supplemental $0.02 1 for 10 Reverse Stock Split Effective 8/26/21 5/8/2025 5/19/2025 5/29/2025 Base $0.47 8/4/2021 8/17/2021 8/31/2021 Base $0.60 3/13/2025 3/24/2025 3/31/2025 Base $0.47 5/6/2021 5/19/2021 6/1/2021 Base $0.60 3/13/2025 3/24/2025 3/31/2025 Supplemental $0.07 2/12/2021 2/22/2021 3/2/2021 Base $0.60 11/7/2024 11/19/2024 11/29/2024 Base $0.69 10/16/2020 10/26/2020 11/27/2020 Base $0.60 8/8/2024 8/22/2024 8/30/2024 Base $0.69 8/5/2020 8/17/2020 8/28/2020 Base $0.60 5/8/2024 5/21/2024 5/31/2024 Base $0.69 3/17/2020 5/7/2020 5/27/2020 Base $0.60 3/13/2024 3/25/2024 4/2/2024 Base $0.69 2/5/2020 2/18/2020 2/28/2020 Base $0.60 11/8/2023 11/20/2023 11/30/2023 Base $0.69 11/5/2019 11/15/2019 11/29/2019 Base $0.60 8/9/2023 8/22/2023 8/31/2023 Base $0.69 8/5/2019 8/12/2019 8/29/2019 Base $0.60 5/10/2023 5/22/2023 5/31/2023 Base $0.69 18
Corporate Information Board of Directors Senior Management Research Coverage Ted Goldthorpe Ted Goldthorpe Paul Johnson Interested Director and Chairman of the Board Chief Executive Officer Keefe Bruyette & Woods Patrick Schafer Brandon Satoren Erik Zwick Interested Director Chief Financial Officer Lucid Capital Markets Robert Warshauer Patrick Schafer Chris Nolan Chief Investment Officer Ladenburg Thalmann Independent Director Alex Duka David Held Mitchel Penn Chief Compliance Officer Independent Director Oppenheimer & Co. George Grunebaum Independent Director Transfer Agent Jennifer Kwon Chou Common Stock Equiniti Trust Company, LLC Independent Director Nasdaq: BCIC Dean Kehler Independent Audit Firm Independent Director Deloitte & Touche LLP Joseph Morea Independent Director Investor Relations Corporate Headquarters The Equity Group, Inc. 650 Madison Avenue - 3rd Floor New York, NY 10022 USA Lena Cati (212) 836-9611 Lcati@theequitygroup.com Val Ferraro (212) 836-9633 Vferraro@theequitygroup.com 19