| Class | Costs of a $10,000 Investment | Costs Paid as a % of a $10,000 Investment |
|---|---|---|
| Variable Annuity | $199 | 1.78% |
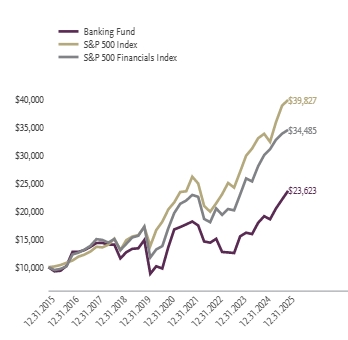
For the period of January 1, 2025 to December 31, 2025, the fund returned 23.74%, outperforming the fund's broad-based securities market index, the S&P 500 Index, which returned 17.88% for the same period and outperforming the fund's secondary index, the S&P 500 Financials Index, which returned 15.02% for the same period.
What factors materially affected the fund's performance over the last year?
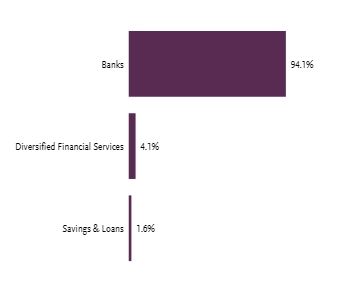
The industries that contributed the most to performance were diversified banks, regional banks, and asset management & custody banks. No industry detracted from performance. The holdings that contributed the most to performance were Citigroup, Inc., Nu Holdings Limited/Cayman Islands--Class A, and JP Morgan Chase & Co. Those that detracted the most were Pinnacle Financial Partners, Inc., First Financial Bankshares, Inc., and Commerce Bancshares, Inc.
| One Year | Five Years | Ten Years | |
|---|---|---|---|
| Banking Fund | 23.74% | 11.69% | 8.98% |
| S&P 500 Index | 17.88% | 14.42% | 14.82% |
| S&P 500 Financials Index | 15.02% | 15.27% | 13.18% |
| Net Assets | $7,169,488 |
|---|---|
| Total Number of Portfolio Holdings | |
| Portfolio Turnover Rate | 78% |
| Total Advisory Fees Paid | $44,497 |
| Citigroup, Inc. | |
| JPMorgan Chase & Co. | |
| Capital One Financial Corp. | |
| Bank of America Corp. | |
| Wells Fargo & Co. | |
| U.S. Bancorp | |
| PNC Financial Services Group, Inc. | |
| Bank of New York Mellon Corp. | |
| Truist Financial Corp. | |
| NU Holdings Limited/Cayman Islands — Class A | |
| Top 10 Total |
1 | "Holdings Diversification (Market Exposure as a % of Net Assets)" excludes any temporary cash investments, investments in Guggenheim Strategy Funds Trust mutual funds, or investments in Guggenheim Ultra Short Duration Fund. |
2 | "10 Largest Holdings (as a % of Net Assets)" excludes any temporary cash investments. |
| Top 10 | % of Net Assets |
|---|---|
| Citigroup, Inc. | |
| JPMorgan Chase & Co. | |
| Capital One Financial Corp. | |
| Bank of America Corp. | |
| Wells Fargo & Co. | |
| U.S. Bancorp | |
| PNC Financial Services Group, Inc. | |
| Bank of New York Mellon Corp. | |
| Truist Financial Corp. | |
| NU Holdings Limited/Cayman Islands — Class A | |
| Top 10 Total |
2 | "10 Largest Holdings (as a % of Net Assets)" excludes any temporary cash investments. |
There were no material changes for the period.
There were no changes in or disagreements with fund accountants for the period.
| Class | Costs of a $10,000 Investment | Costs Paid as a % of a $10,000 Investment |
|---|---|---|
| Variable Annuity | $207 | 1.78% |
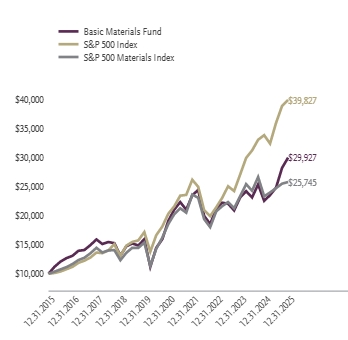
For the period of January 1, 2025 to December 31, 2025, the fund returned 32.89%, outperforming the fund's broad-based securities market index, the S&P 500 Index, which returned 17.88% for the same period and outperforming the fund's secondary index, the S&P 500 Materials Index, which returned 10.54% for the same period.
What factors materially affected the fund's performance over the last year?
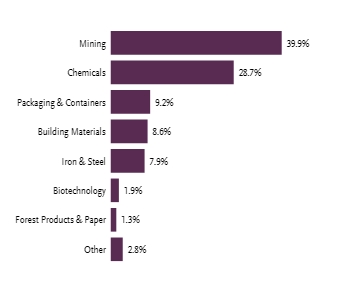
The industries that contributed the most to performance were gold, steel, and silver. Those that detracted the most were commodity chemicals, paper & plastic packaging products, and specialty chemicals. The holdings that contributed the most to performance were Newmont Corp., Barrick Mining Corp., and Anglogold Ahanti plc. Those that detracted the most were Dow, Inc., LyondellBasell Industries N.V. - Class A, and FMC Corp.
| One Year | Five Years | Ten Years | |
|---|---|---|---|
| Basic Materials Fund | 32.89% | 9.42% | 11.58% |
| S&P 500 Index | 17.88% | 14.42% | 14.82% |
| S&P 500 Materials Index | 10.54% | 6.79% | 9.92% |
| Net Assets | $7,790,917 |
|---|---|
| Total Number of Portfolio Holdings | |
| Portfolio Turnover Rate | 103% |
| Total Advisory Fees Paid | $51,972 |
| Linde plc | |
| Newmont Corp. | |
| Freeport-McMoRan, Inc. | |
| Sherwin-Williams Co. | |
| Ecolab, Inc. | |
| Air Products and Chemicals, Inc. | |
| Corteva, Inc. | |
| Martin Marietta Materials, Inc. | |
| Vulcan Materials Co. | |
| Nucor Corp. | |
| Top 10 Total |
1 | "Holdings Diversification (Market Exposure as a % of Net Assets)" excludes any temporary cash investments, investments in Guggenheim Strategy Funds Trust mutual funds, or investments in Guggenheim Ultra Short Duration Fund. |
2 | "10 Largest Holdings (as a % of Net Assets)" excludes any temporary cash investments. |
| Top 10 | % of Net Assets |
|---|---|
| Linde plc | |
| Newmont Corp. | |
| Freeport-McMoRan, Inc. | |
| Sherwin-Williams Co. | |
| Ecolab, Inc. | |
| Air Products and Chemicals, Inc. | |
| Corteva, Inc. | |
| Martin Marietta Materials, Inc. | |
| Vulcan Materials Co. | |
| Nucor Corp. | |
| Top 10 Total |
2 | "10 Largest Holdings (as a % of Net Assets)" excludes any temporary cash investments. |
There were no material changes for the period.
There were no changes in or disagreements with fund accountants for the period.
| Class | Costs of a $10,000 Investment | Costs Paid as a % of a $10,000 Investment |
|---|---|---|
| Variable Annuity | $206 | 1.79% |
For the period of January 1, 2025 to December 31, 2025, the fund returned 30.12%, outperforming the fund's broad-based securities market index, the S&P 500 Index, which returned 17.88% for the same period and outperforming the fund's secondary index, the S&P 500 Health Care Index, which returned 14.60% for the same period.
What factors materially affected the fund's performance over the last year?
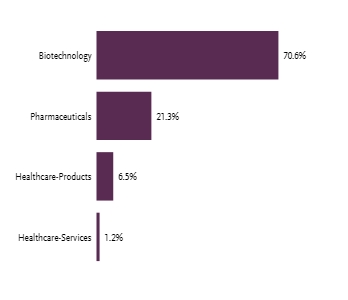
The industries that contributed the most to performance were biotechnology, pharmaceuticals, and health care services. No industry detracted from performance. The holdings that contributed the most to performance were Insmed, Inc., AbbVie, Inc., and Alnylam Pharmaceuticals, Inc. Those that detracted the most were Sarepta Therapeutics, Inc., Vaxcyte, Inc., and Iovance Biotherapeutics, Inc.
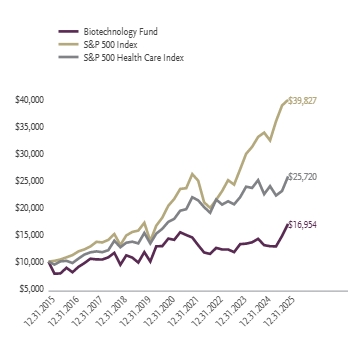
| One Year | Five Years | Ten Years | |
|---|---|---|---|
| Biotechnology Fund | 30.12% | 3.55% | 5.42% |
| S&P 500 Index | 17.88% | 14.42% | 14.82% |
| S&P 500 Health Care Index | 14.60% | 8.21% | 9.91% |
| Net Assets | $11,662,346 |
|---|---|
| Total Number of Portfolio Holdings | |
| Portfolio Turnover Rate | 553% |
| Total Advisory Fees Paid | $83,746 |
| AbbVie, Inc. | |
| Amgen, Inc. | |
| Gilead Sciences, Inc. | |
| Vertex Pharmaceuticals, Inc. | |
| Regeneron Pharmaceuticals, Inc. | |
| Alnylam Pharmaceuticals, Inc. | |
| Insmed, Inc. | |
| Natera, Inc. | |
| AstraZeneca plc ADR | |
| Biogen, Inc. | |
| Top 10 Total |
1 | "Holdings Diversification (Market Exposure as a % of Net Assets)" excludes any temporary cash investments, investments in Guggenheim Strategy Funds Trust mutual funds, or investments in Guggenheim Ultra Short Duration Fund. |
2 | "10 Largest Holdings (as a % of Net Assets)" excludes any temporary cash investments. |
| Top 10 | % of Net Assets |
|---|---|
| AbbVie, Inc. | |
| Amgen, Inc. | |
| Gilead Sciences, Inc. | |
| Vertex Pharmaceuticals, Inc. | |
| Regeneron Pharmaceuticals, Inc. | |
| Alnylam Pharmaceuticals, Inc. | |
| Insmed, Inc. | |
| Natera, Inc. | |
| AstraZeneca plc ADR | |
| Biogen, Inc. | |
| Top 10 Total |
2 | "10 Largest Holdings (as a % of Net Assets)" excludes any temporary cash investments. |
There were no material changes for the period.
There were no changes in or disagreements with fund accountants for the period.
| Class | Costs of a $10,000 Investment | Costs Paid as a % of a $10,000 Investment |
|---|---|---|
| Variable Annuity | $176 | 1.79% |
For the period of January 1, 2025 to December 31, 2025, the fund returned -3.52%, underperforming the fund's broad-based securities market index, the S&P 500 Index, which returned 17.88% for the same period and underperforming the fund's secondary index, the S&P 500 Consumer Staples Index, which returned 3.90% for the same period.
What factors materially affected the fund's performance over the last year?
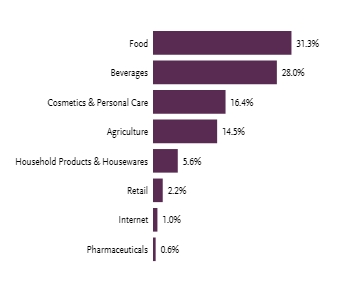
The industries that contributed the most to performance were tobacco, soft drinks & non-alcoholic beverages, and agricultural products & services. Those that detracted the most were packaged foods & meats, household products, and distillers & vintners. The holdings that contributed the most to performance were Phillip Morris International, Inc., Monster Beverage Corp., and Coca-Cola Co. Those that detracted the most were Procter & Gamble Co., BellRing Brands, Inc., and Constellation Brands, Inc.
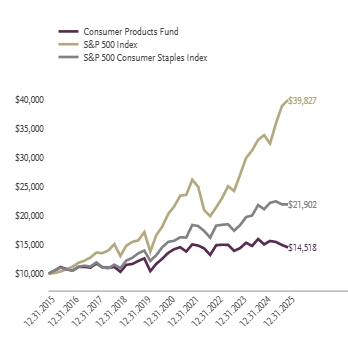
| One Year | Five Years | Ten Years | |
|---|---|---|---|
| Consumer Products Fund | -3.52% | 1.32% | 3.80% |
| S&P 500 Index | 17.88% | 14.42% | 14.82% |
| S&P 500 Consumer Staples Index | 3.90% | 7.18% | 8.16% |
| Net Assets | $5,029,999 |
|---|---|
| Total Number of Portfolio Holdings | |
| Portfolio Turnover Rate | 49% |
| Total Advisory Fees Paid | $44,964 |
| Procter & Gamble Co. | |
| Philip Morris International, Inc. | |
| Coca-Cola Co. | |
| PepsiCo, Inc. | |
| Altria Group, Inc. | |
| Mondelez International, Inc. — Class A | |
| Colgate-Palmolive Co. | |
| Monster Beverage Corp. | |
| Kroger Co. | |
| Hershey Co. | |
| Top 10 Total |
1 | "Holdings Diversification (Market Exposure as a % of Net Assets)" excludes any temporary cash investments, investments in Guggenheim Strategy Funds Trust mutual funds, or investments in Guggenheim Ultra Short Duration Fund. |
2 | "10 Largest Holdings (as a % of Net Assets)" excludes any temporary cash investments. |
| Top 10 | % of Net Assets |
|---|---|
| Procter & Gamble Co. | |
| Philip Morris International, Inc. | |
| Coca-Cola Co. | |
| PepsiCo, Inc. | |
| Altria Group, Inc. | |
| Mondelez International, Inc. — Class A | |
| Colgate-Palmolive Co. | |
| Monster Beverage Corp. | |
| Kroger Co. | |
| Hershey Co. | |
| Top 10 Total |
2 | "10 Largest Holdings (as a % of Net Assets)" excludes any temporary cash investments. |
There were no material changes for the period.
There were no changes in or disagreements with fund accountants for the period.
| Class | Costs of a $10,000 Investment | Costs Paid as a % of a $10,000 Investment |
|---|---|---|
| Variable Annuity | $215 | 1.78% |
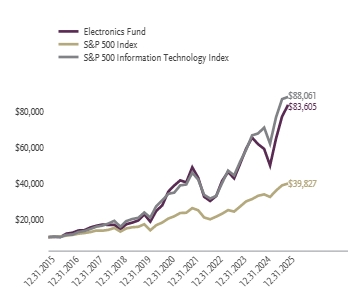
For the period of January 1, 2025 to December 31, 2025, the fund returned 41.49%, outperforming the fund's broad-based securities market index, the S&P 500 Index, which returned 17.88% for the same period and outperforming the fund's secondary index, the S&P 500 Information Technology Index, which returned 24.04% for the same period.
What factors materially affected the fund's performance over the last year?
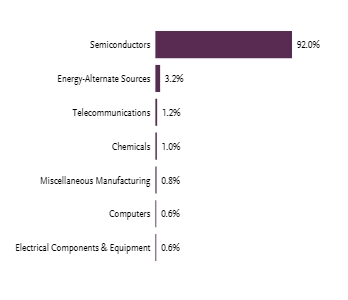
The industries that contributed the most to performance were semiconductors and semiconductor materials & equipment. No industry detracted from performance. The holdings that contributed the most to performance were NVIDIA Corp., Broadcom, Inc. and Micron Technology, Inc. Those that detracted the most were Marvell Technology, Enphase Energy, Inc., and Wolfspeed, Inc.
| One Year | Five Years | Ten Years | |
|---|---|---|---|
| Electronics Fund | 41.49% | 18.80% | 23.66% |
| S&P 500 Index | 17.88% | 14.42% | 14.82% |
| S&P 500 Information Technology Index | 24.04% | 20.91% | 24.30% |
| Net Assets | $19,859,258 |
|---|---|
| Total Number of Portfolio Holdings | |
| Portfolio Turnover Rate | 84% |
| Total Advisory Fees Paid | $141,084 |
| NVIDIA Corp. | |
| Broadcom, Inc. | |
| Micron Technology, Inc. | |
| Advanced Micro Devices, Inc. | |
| Lam Research Corp. | |
| Applied Materials, Inc. | |
| QUALCOMM, Inc. | |
| KLA Corp. | |
| Texas Instruments, Inc. | |
| Intel Corp. | |
| Top 10 Total |
1 | "Holdings Diversification (Market Exposure as a % of Net Assets)" excludes any temporary cash investments, investments in Guggenheim Strategy Funds Trust mutual funds, or investments in Guggenheim Ultra Short Duration Fund. |
2 | "10 Largest Holdings (as a % of Net Assets)" excludes any temporary cash investments. |
| Top 10 | % of Net Assets |
|---|---|
| NVIDIA Corp. | |
| Broadcom, Inc. | |
| Micron Technology, Inc. | |
| Advanced Micro Devices, Inc. | |
| Lam Research Corp. | |
| Applied Materials, Inc. | |
| QUALCOMM, Inc. | |
| KLA Corp. | |
| Texas Instruments, Inc. | |
| Intel Corp. | |
| Top 10 Total |
2 | "10 Largest Holdings (as a % of Net Assets)" excludes any temporary cash investments. |
There were no material changes for the period.
There were no changes in or disagreements with fund accountants for the period.
| Class | Costs of a $10,000 Investment | Costs Paid as a % of a $10,000 Investment |
|---|---|---|
| Variable Annuity | $186 | 1.79% |
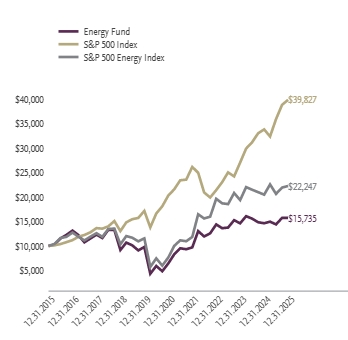
For the period of January 1, 2025 to December 31, 2025, the fund returned 7.51%, underperforming the fund's broad-based securities market index, the S&P 500 Index, which returned 17.88% for the same period and underperforming the fund's secondary index, the S&P 500 Energy Index, which returned 8.67% for the same period.
What factors materially affected the fund's performance over the last year?
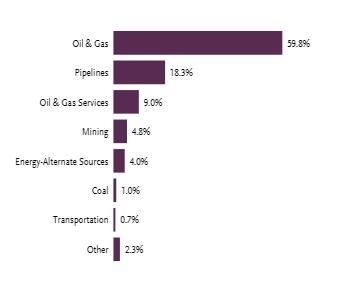
The industries that contributed the most to performance were coal & consumable fuels, integrated oil and gas, and oil & gas refining and marketing. Those that detracted the most were oil & gas exploration & production, automotive retail, and oil & gas drilling. The holdings that contributed the most to performance were Cameco Corp., Equities Corp., and SolarEdge Technologies, Inc. Those that detracted the most were ONEOK, Inc., New Fortress Energy, Inc., and Enphase Energy, Inc.
| One Year | Five Years | Ten Years | |
|---|---|---|---|
| Energy Fund | 7.51% | 19.52% | 4.64% |
| S&P 500 Index | 17.88% | 14.42% | 14.82% |
| S&P 500 Energy Index | 8.67% | 23.78% | 8.32% |
| Net Assets | $8,068,391 |
|---|---|
| Total Number of Portfolio Holdings | |
| Portfolio Turnover Rate | 519% |
| Total Advisory Fees Paid | $78,387 |
| Exxon Mobil Corp. | |
| Chevron Corp. | |
| ConocoPhillips | |
| Williams Companies, Inc. | |
| EOG Resources, Inc. | |
| Kinder Morgan, Inc. | |
| SLB Ltd. | |
| Valero Energy Corp. | |
| Phillips 66 | |
| ONEOK, Inc. | |
| Top 10 Total |
1 | "Holdings Diversification (Market Exposure as a % of Net Assets)" excludes any temporary cash investments, investments in Guggenheim Strategy Funds Trust mutual funds, or investments in Guggenheim Ultra Short Duration Fund. |
2 | "10 Largest Holdings (as a % of Net Assets)" excludes any temporary cash investments. |
| Top 10 | % of Net Assets |
|---|---|
| Exxon Mobil Corp. | |
| Chevron Corp. | |
| ConocoPhillips | |
| Williams Companies, Inc. | |
| EOG Resources, Inc. | |
| Kinder Morgan, Inc. | |
| SLB Ltd. | |
| Valero Energy Corp. | |
| Phillips 66 | |
| ONEOK, Inc. | |
| Top 10 Total |
2 | "10 Largest Holdings (as a % of Net Assets)" excludes any temporary cash investments. |
There were no material changes for the period.
There were no changes in or disagreements with fund accountants for the period.
| Class | Costs of a $10,000 Investment | Costs Paid as a % of a $10,000 Investment |
|---|---|---|
| Variable Annuity | $181 | 1.79% |
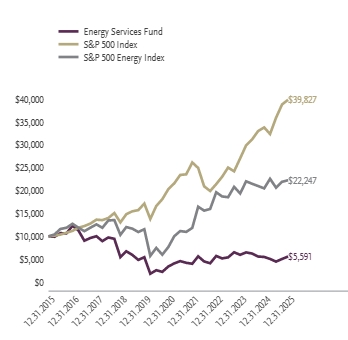
For the period of January 1, 2025 to December 31, 2025, the fund returned 1.74%, underperforming the fund's broad-based securities market index, the S&P 500 Index, which returned 17.88% for the same period and underperforming the fund's secondary index, the S&P 500 Energy Index, which returned 8.67% for the same period.
What factors materially affected the fund's performance over the last year?
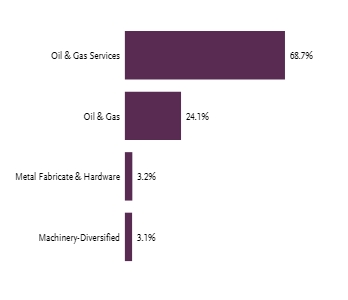
The industries that contributed the most to performance were oil & gas equipment & services, oil & gas drilling, and oil & gas storage & transportation. The industry that detracted the most was environmental & facilities services. The holdings that contributed the most to performance were Solaris Energy Infrastructure, Inc. - Class A, TechnipFMC plc, and Baker Hughes Co. Those that detracted the most were Atlas Energy Solutions, Inc., Patterson-UTI Energy, Inc., and Cactus, Inc.– Class A.
| One Year | Five Years | Ten Years | |
|---|---|---|---|
| Energy Services Fund | 1.74% | 10.39% | -5.65% |
| S&P 500 Index | 17.88% | 14.42% | 14.82% |
| S&P 500 Energy Index | 8.67% | 23.78% | 8.32% |
| Net Assets | $2,730,695 |
|---|---|
| Total Number of Portfolio Holdings | |
| Portfolio Turnover Rate | 2,071% |
| Total Advisory Fees Paid | $28,235 |
| SLB Ltd. | |
| Baker Hughes Co. | |
| Halliburton Co. | |
| TechnipFMC plc | |
| Weatherford International plc | |
| NOV, Inc. | |
| Archrock, Inc. | |
| Transocean Ltd. | |
| Tenaris S.A. ADR | |
| Cactus, Inc. — Class A | |
| Top 10 Total |
1 | "Holdings Diversification (Market Exposure as a % of Net Assets)" excludes any temporary cash investments, investments in Guggenheim Strategy Funds Trust mutual funds, or investments in Guggenheim Ultra Short Duration Fund. |
2 | "10 Largest Holdings (as a % of Net Assets)" excludes any temporary cash investments. |
| Top 10 | % of Net Assets |
|---|---|
| SLB Ltd. | |
| Baker Hughes Co. | |
| Halliburton Co. | |
| TechnipFMC plc | |
| Weatherford International plc | |
| NOV, Inc. | |
| Archrock, Inc. | |
| Transocean Ltd. | |
| Tenaris S.A. ADR | |
| Cactus, Inc. — Class A | |
| Top 10 Total |
2 | "10 Largest Holdings (as a % of Net Assets)" excludes any temporary cash investments. |
There were no material changes for the period.
There were no changes in or disagreements with fund accountants for the period.
| Class | Costs of a $10,000 Investment | Costs Paid as a % of a $10,000 Investment |
|---|---|---|
| Variable Annuity | $189 | 1.79% |
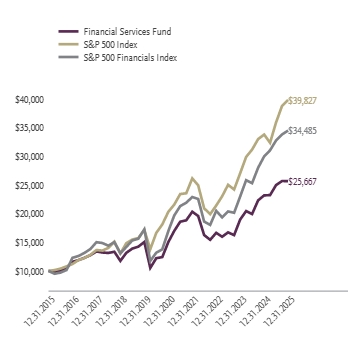
For the period of January 1, 2025 to December 31, 2025, the fund returned 10.76%, underperforming the fund's broad-based securities market index, the S&P 500 Index, which returned 17.88% for the same period and underperforming the fund's secondary index, the S&P 500 Financials Index, which returned 15.02% for the same period.
What factors materially affected the fund's performance over the last year?
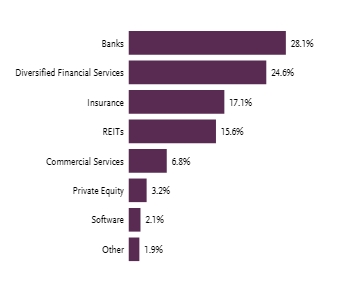
The industries that contributed the most to performance were diversified banks, investment banking & brokerage, and consumer finance. Those that detracted the most were transaction & payment processing services, insurance brokers, and multi-family residential REITs. The holdings that contributed the most to performance were Robinhood Markets, Inc. – Class A, JPMorgan Chase & Co., and Citigroup, Inc. Those that detracted the most were FiServ, Inc., PayPal Holdings, Inc., and Alexandria Real Estate Equities, Inc.
| One Year | Five Years | Ten Years | |
|---|---|---|---|
| Financial Services Fund | 10.76% | 11.31% | 9.88% |
| S&P 500 Index | 17.88% | 14.42% | 14.82% |
| S&P 500 Financials Index | 15.02% | 15.27% | 13.18% |
| Net Assets | $11,122,704 |
|---|---|
| Total Number of Portfolio Holdings | |
| Portfolio Turnover Rate | 97% |
| Total Advisory Fees Paid | $90,112 |
| Berkshire Hathaway, Inc. — Class B | |
| JPMorgan Chase & Co. | |
| Visa, Inc. — Class A | |
| Mastercard, Inc. — Class A | |
| Bank of America Corp. | |
| Wells Fargo & Co. | |
| Goldman Sachs Group, Inc. | |
| Citigroup, Inc. | |
| Morgan Stanley | |
| Blackstone, Inc. — Class A | |
| Top 10 Total |
1 | "Holdings Diversification (Market Exposure as a % of Net Assets)" excludes any temporary cash investments, investments in Guggenheim Strategy Funds Trust mutual funds, or investments in Guggenheim Ultra Short Duration Fund. |
2 | "10 Largest Holdings (as a % of Net Assets)" excludes any temporary cash investments. |
| Top 10 | % of Net Assets |
|---|---|
| Berkshire Hathaway, Inc. — Class B | |
| JPMorgan Chase & Co. | |
| Visa, Inc. — Class A | |
| Mastercard, Inc. — Class A | |
| Bank of America Corp. | |
| Wells Fargo & Co. | |
| Goldman Sachs Group, Inc. | |
| Citigroup, Inc. | |
| Morgan Stanley | |
| Blackstone, Inc. — Class A | |
| Top 10 Total |
2 | "10 Largest Holdings (as a % of Net Assets)" excludes any temporary cash investments. |
There were no material changes for the period.
There were no changes in or disagreements with fund accountants for the period.
| Class | Costs of a $10,000 Investment | Costs Paid as a % of a $10,000 Investment |
|---|---|---|
| Variable Annuity | $192 | 1.79% |
For the period of January 1, 2025 to December 31, 2025, the fund returned 14.07%, underperforming the fund's broad-based securities market index, the S&P 500 Index, which returned 17.88% for the same period and underperforming the fund's secondary index, the S&P 500 Health Care Index, which returned 14.60% for the same period.
What factors materially affected the fund's performance over the last year?
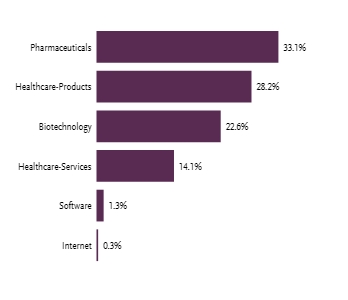
The industries that contributed the most to performance were biotechnology, pharmaceuticals, and health care services. Those that detracted the most were managed health care and health care supplies. The holdings that contributed the most to performance were Eli Lilly and Co., Johnson & Johnson and CVS Health Corp. Those that detracted the most were UnitedHealth Group, Inc., Sarepta Therapeutics, Inc., and Novo Nordisk A/S ADR.
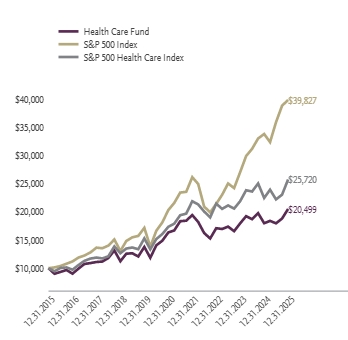
| One Year | Five Years | Ten Years | |
|---|---|---|---|
| Health Care Fund | 14.07% | 4.64% | 7.44% |
| S&P 500 Index | 17.88% | 14.42% | 14.82% |
| S&P 500 Health Care Index | 14.60% | 8.21% | 9.91% |
| Net Assets | $10,538,629 |
|---|---|
| Total Number of Portfolio Holdings | |
| Portfolio Turnover Rate | 90% |
| Total Advisory Fees Paid | $87,116 |
| Eli Lilly & Co. | |
| Johnson & Johnson | |
| AbbVie, Inc. | |
| UnitedHealth Group, Inc. | |
| Merck & Company, Inc. | |
| Thermo Fisher Scientific, Inc. | |
| Abbott Laboratories | |
| Intuitive Surgical, Inc. | |
| Amgen, Inc. | |
| Gilead Sciences, Inc. | |
| Top 10 Total |
1 | "Holdings Diversification (Market Exposure as a % of Net Assets)" excludes any temporary cash investments, investments in Guggenheim Strategy Funds Trust mutual funds, or investments in Guggenheim Ultra Short Duration Fund. |
2 | "10 Largest Holdings (as a % of Net Assets)" excludes any temporary cash investments. |
| Top 10 | % of Net Assets |
|---|---|
| Eli Lilly & Co. | |
| Johnson & Johnson | |
| AbbVie, Inc. | |
| UnitedHealth Group, Inc. | |
| Merck & Company, Inc. | |
| Thermo Fisher Scientific, Inc. | |
| Abbott Laboratories | |
| Intuitive Surgical, Inc. | |
| Amgen, Inc. | |
| Gilead Sciences, Inc. | |
| Top 10 Total |
2 | "10 Largest Holdings (as a % of Net Assets)" excludes any temporary cash investments. |
There were no material changes for the period.
There were no changes in or disagreements with fund accountants for the period.
| Class | Costs of a $10,000 Investment | Costs Paid as a % of a $10,000 Investment |
|---|---|---|
| Variable Annuity | $196 | 1.79% |
For the period of January 1, 2025 to December 31, 2025, the fund returned 18.50%, outperforming the fund's broad-based securities market index, the S&P 500 Index, which returned 17.88% for the same period and underperforming the fund's secondary index, the S&P 500 Information Technology Index, which returned 24.04% for the same period.
What factors materially affected the fund's performance over the last year?
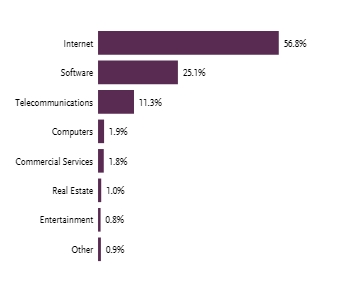
The industries that contributed the most to performance were communications equipment, interactive media & services, and internet services & infrastructure. Those that detracted the most were application software, transaction & payment processing, and human resource & employment services. The holdings that contributed the most to performance were Alphabet, Inc.—Class A, Lumentum Holdings, Inc., and Cloudflare, Inc.—Class A. Those that detracted the most were Salesforce, Inc., Adobe, Inc., and PayPal Holdings, Inc.
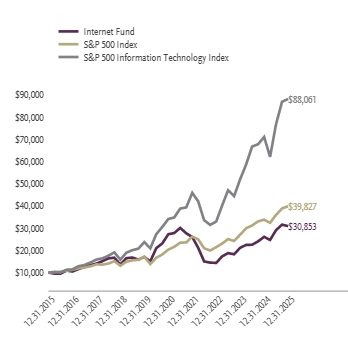
| One Year | Five Years | Ten Years | |
|---|---|---|---|
| Internet Fund | 18.50% | 2.54% | 11.93% |
| S&P 500 Index | 17.88% | 14.42% | 14.82% |
| S&P 500 Information Technology Index | 24.04% | 20.91% | 24.30% |
| Net Assets | $5,189,555 |
|---|---|
| Total Number of Portfolio Holdings | |
| Portfolio Turnover Rate | 73% |
| Total Advisory Fees Paid | $45,634 |
| Alphabet, Inc. — Class A | |
| Amazon.com, Inc. | |
| Meta Platforms, Inc. — Class A | |
| Netflix, Inc. | |
| Cisco Systems, Inc. | |
| Salesforce, Inc. | |
| Booking Holdings, Inc. | |
| Uber Technologies, Inc. | |
| Adobe, Inc. | |
| Arista Networks, Inc. | |
| Top 10 Total |
1 | "Holdings Diversification (Market Exposure as a % of Net Assets)" excludes any temporary cash investments, investments in Guggenheim Strategy Funds Trust mutual funds, or investments in Guggenheim Ultra Short Duration Fund. |
2 | "10 Largest Holdings (as a % of Net Assets)" excludes any temporary cash investments. |
| Top 10 | % of Net Assets |
|---|---|
| Alphabet, Inc. — Class A | |
| Amazon.com, Inc. | |
| Meta Platforms, Inc. — Class A | |
| Netflix, Inc. | |
| Cisco Systems, Inc. | |
| Salesforce, Inc. | |
| Booking Holdings, Inc. | |
| Uber Technologies, Inc. | |
| Adobe, Inc. | |
| Arista Networks, Inc. | |
| Top 10 Total |
2 | "10 Largest Holdings (as a % of Net Assets)" excludes any temporary cash investments. |
There were no material changes for the period.
There were no changes in or disagreements with fund accountants for the period.
| Class | Costs of a $10,000 Investment | Costs Paid as a % of a $10,000 Investment |
|---|---|---|
| Variable Annuity | $187 | 1.79% |
For the period of January 1, 2025 to December 31, 2025, the fund returned 8.47%, underperforming the fund's broad-based securities market index, the S&P 500 Index, which returned 17.88% for the same period and outperforming the fund's secondary index, the S&P 500 Consumer Discretionary Index, which returned 6.04% for the same period.
What factors materially affected the fund's performance over the last year?
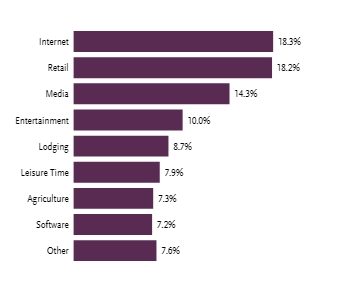
The industries that contributed the most to performance were movies & entertainment, interactive home entertainment, and tobacco. Those that detracted the most were restaurants, distillers & vintners, and leisure facilities. The holdings that contributed the most to performance were EchoStar Corp.—Class A, Warner Bros Discovery, Inc., and Phillip Morris International, Inc. Those that detracted the most were Chipotle Mexican Grill, Inc.—Class A, Charter Communications, Inc—Class A, and Comcast Corp. — Class A.
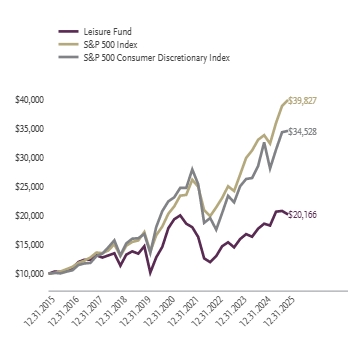
| One Year | Five Years | Ten Years | |
|---|---|---|---|
| Leisure Fund | 8.47% | 2.50% | 7.27% |
| S&P 500 Index | 17.88% | 14.42% | 14.82% |
| S&P 500 Consumer Discretionary Index | 6.04% | 9.02% | 13.19% |
| Net Assets | $5,097,671 |
|---|---|
| Total Number of Portfolio Holdings | |
| Portfolio Turnover Rate | 288% |
| Total Advisory Fees Paid | $42,504 |
| Netflix, Inc. | |
| Philip Morris International, Inc. | |
| McDonald's Corp. | |
| Walt Disney Co. | |
| Booking Holdings, Inc. | |
| Comcast Corp. — Class A | |
| Starbucks Corp. | |
| Altria Group, Inc. | |
| DoorDash, Inc. — Class A | |
| Airbnb, Inc. — Class A | |
| Top 10 Total |
1 | "Holdings Diversification (Market Exposure as a % of Net Assets)" excludes any temporary cash investments, investments in Guggenheim Strategy Funds Trust mutual funds, or investments in Guggenheim Ultra Short Duration Fund. |
2 | "10 Largest Holdings (as a % of Net Assets)" excludes any temporary cash investments. |
| Top 10 | % of Net Assets |
|---|---|
| Netflix, Inc. | |
| Philip Morris International, Inc. | |
| McDonald's Corp. | |
| Walt Disney Co. | |
| Booking Holdings, Inc. | |
| Comcast Corp. — Class A | |
| Starbucks Corp. | |
| Altria Group, Inc. | |
| DoorDash, Inc. — Class A | |
| Airbnb, Inc. — Class A | |
| Top 10 Total |
2 | "10 Largest Holdings (as a % of Net Assets)" excludes any temporary cash investments. |
There were no material changes for the period.
There were no changes in or disagreements with fund accountants for the period.
| Class | Costs of a $10,000 Investment | Costs Paid as a % of a $10,000 Investment |
|---|---|---|
| Variable Annuity | $292 | 1.68% |
For the period of January 1, 2025 to December 31, 2025, the fund returned 147.37%, outperforming the fund's broad-based securities market index, the S&P 500 Index, which returned 17.88% for the same period and outperforming the fund's secondary index, the S&P 500 Materials Index, which returned 10.54% for the same period.
What factors materially affected the fund's performance over the last year?
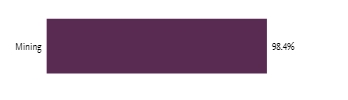
The industries that contributed the most to performance were gold, silver, and precious metals & minerals. No industry detracted from performance. The holdings that contributed the most to performance were Newmont Corp., Agnico Eagle Mines Ltd., and Barrick Mining Corp. The holdings that detracted the most was Triple Flag Precious Metals Corp.
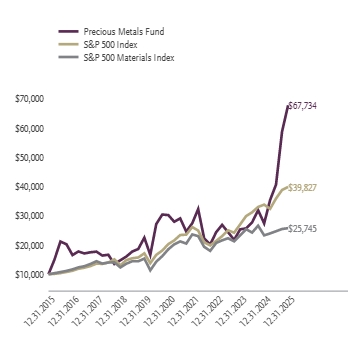
| One Year | Five Years | Ten Years | |
|---|---|---|---|
| Precious Metals Fund | 147.37% | 17.52% | 21.08% |
| S&P 500 Index | 17.88% | 14.42% | 14.82% |
| S&P 500 Materials Index | 10.54% | 6.79% | 9.92% |
| Net Assets | $41,226,276 |
|---|---|
| Total Number of Portfolio Holdings | |
| Portfolio Turnover Rate | 178% |
| Total Advisory Fees Paid | $199,938 |
| Newmont Corp. | |
| Agnico Eagle Mines Ltd. | |
| Freeport-McMoRan, Inc. | |
| Barrick Mining Corp. | |
| Wheaton Precious Metals Corp. | |
| Anglogold Ashanti plc | |
| Gold Fields Ltd. ADR | |
| Kinross Gold Corp. | |
| Pan American Silver Corp. | |
| Franco-Nevada Corp. | |
| Top 10 Total |
1 | "Holdings Diversification (Market Exposure as a % of Net Assets)" excludes any temporary cash investments, investments in Guggenheim Strategy Funds Trust mutual funds, or investments in Guggenheim Ultra Short Duration Fund. |
2 | "10 Largest Holdings (as a % of Net Assets)" excludes any temporary cash investments. |
| Top 10 | % of Net Assets |
|---|---|
| Newmont Corp. | |
| Agnico Eagle Mines Ltd. | |
| Freeport-McMoRan, Inc. | |
| Barrick Mining Corp. | |
| Wheaton Precious Metals Corp. | |
| Anglogold Ashanti plc | |
| Gold Fields Ltd. ADR | |
| Kinross Gold Corp. | |
| Pan American Silver Corp. | |
| Franco-Nevada Corp. | |
| Top 10 Total |
2 | "10 Largest Holdings (as a % of Net Assets)" excludes any temporary cash investments. |
There were no material changes for the period.
There were no changes in or disagreements with fund accountants for the period.
| Class | Costs of a $10,000 Investment | Costs Paid as a % of a $10,000 Investment |
|---|---|---|
| Variable Annuity | $181 | 1.78% |
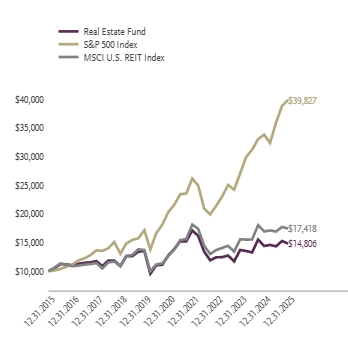
For the period of January 1, 2025 to December 31, 2025, the fund returned 2.88%, underperforming the fund's broad-based securities market index, the S&P 500 Index, which returned 17.88% for the same period and underperforming the fund's secondary index, the MSCI U.S. REIT Index, which returned 2.95% for the same period.
What factors materially affected the fund's performance over the last year?
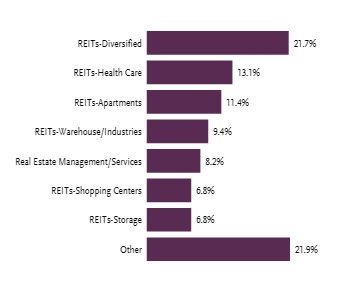
The industries that contributed the most to performance were real estate services, health care REITs, and industrial REITs. Those that detracted the most were office REITs, multi-family residential REITs, and self-storage REITs. The holdings that contributed the most to performance were Opendoor Technologies, Inc., Welltower, Inc., and Prologis, Inc. Those that detracted the most were Alexandria Real Estate Equities Inc., Equinix, Inc., and Americold Realty Trust, Inc.
| One Year | Five Years | Ten Years | |
|---|---|---|---|
| Real Estate Fund | 2.88% | 3.02% | 4.00% |
| S&P 500 Index | 17.88% | 14.42% | 14.82% |
| MSCI U.S. REIT Index | 2.95% | 6.58% | 5.71% |
| Net Assets | $3,766,976 |
|---|---|
| Total Number of Portfolio Holdings | |
| Portfolio Turnover Rate | 269% |
| Total Advisory Fees Paid | $30,856 |
| Welltower, Inc. | |
| Prologis, Inc. | |
| American Tower Corp. — Class A | |
| Equinix, Inc. | |
| Simon Property Group, Inc. | |
| Digital Realty Trust, Inc. | |
| Realty Income Corp. | |
| CBRE Group, Inc. — Class A | |
| Public Storage | |
| Crown Castle, Inc. | |
| Top 10 Total |
1 | "Holdings Diversification (Market Exposure as a % of Net Assets)" excludes any temporary cash investments, investments in Guggenheim Strategy Funds Trust mutual funds, or investments in Guggenheim Ultra Short Duration Fund. |
2 | "10 Largest Holdings (as a % of Net Assets)" excludes any temporary cash investments. |
| Top 10 | % of Net Assets |
|---|---|
| Welltower, Inc. | |
| Prologis, Inc. | |
| American Tower Corp. — Class A | |
| Equinix, Inc. | |
| Simon Property Group, Inc. | |
| Digital Realty Trust, Inc. | |
| Realty Income Corp. | |
| CBRE Group, Inc. — Class A | |
| Public Storage | |
| Crown Castle, Inc. | |
| Top 10 Total |
2 | "10 Largest Holdings (as a % of Net Assets)" excludes any temporary cash investments. |
There were no material changes for the period.
There were no changes in or disagreements with fund accountants for the period.
| Class | Costs of a $10,000 Investment | Costs Paid as a % of a $10,000 Investment |
|---|---|---|
| Variable Annuity | $187 | 1.78% |
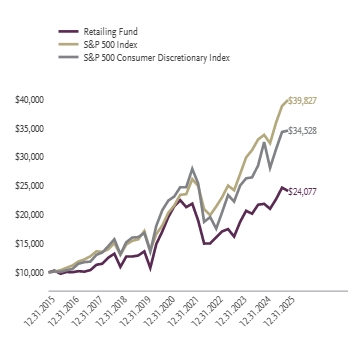
For the period of January 1, 2025 to December 31, 2025, the fund returned 10.18%, underperforming the fund's broad-based securities market index, the S&P 500 Index, which returned 17.88% for the same period and outperforming the fund's secondary index, the S&P 500 Consumer Discretionary Index, which returned 6.04% for the same period.
What factors materially affected the fund's performance over the last year?
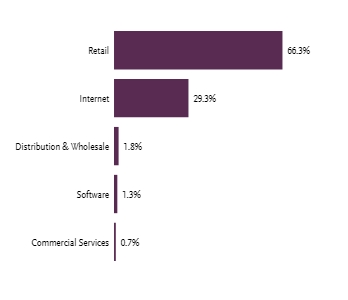
The industries that contributed the most to performance were broadline retail, automotive retail, and apparel retail. Those that detracted the most were home improvement retail, computer & electronics retail and interactive home entertainment. The holdings that contributed the most to performance were Carvana Co., Alibaba Group Holding Ltd. ADR, and TJX Companies, Inc. Those that detracted the most were CarMax, Inc., Target Corp., and Sea Ltd. ADR.
| One Year | Five Years | Ten Years | |
|---|---|---|---|
| Retailing Fund | 10.18% | 4.22% | 9.18% |
| S&P 500 Index | 17.88% | 14.42% | 14.82% |
| S&P 500 Consumer Discretionary Index | 6.04% | 9.02% | 13.19% |
| Net Assets | $3,109,101 |
|---|---|
| Total Number of Portfolio Holdings | |
| Portfolio Turnover Rate | 292% |
| Total Advisory Fees Paid | $21,605 |
| Amazon.com, Inc. | |
| Walmart, Inc. | |
| Costco Wholesale Corp. | |
| TJX Companies, Inc. | |
| Home Depot, Inc. | |
| Lowe's Companies, Inc. | |
| Carvana Co. | |
| O'Reilly Automotive, Inc. | |
| PDD Holdings, Inc. ADR | |
| Ross Stores, Inc. | |
| Top 10 Total |
1 | "Holdings Diversification (Market Exposure as a % of Net Assets)" excludes any temporary cash investments, investments in Guggenheim Strategy Funds Trust mutual funds, or investments in Guggenheim Ultra Short Duration Fund. |
2 | "10 Largest Holdings (as a % of Net Assets)" excludes any temporary cash investments. |
| Top 10 | % of Net Assets |
|---|---|
| Amazon.com, Inc. | |
| Walmart, Inc. | |
| Costco Wholesale Corp. | |
| TJX Companies, Inc. | |
| Home Depot, Inc. | |
| Lowe's Companies, Inc. | |
| Carvana Co. | |
| O'Reilly Automotive, Inc. | |
| PDD Holdings, Inc. ADR | |
| Ross Stores, Inc. | |
| Top 10 Total |
2 | "10 Largest Holdings (as a % of Net Assets)" excludes any temporary cash investments. |
There were no material changes for the period.
There were no changes in or disagreements with fund accountants for the period.
| Class | Costs of a $10,000 Investment | Costs Paid as a % of a $10,000 Investment |
|---|---|---|
| Variable Annuity | $201 | 1.78% |
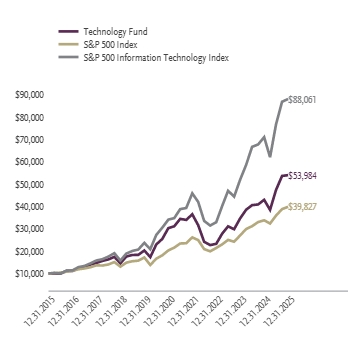
For the period of January 1, 2025 to December 31, 2025, the fund returned 25.70%, outperforming the fund's broad-based securities market index, the S&P 500 Index, which returned 17.88% for the same period and outperforming the fund's secondary index, the S&P 500 Information Technology Index, which returned 24.04% for the same period.
What factors materially affected the fund's performance over the last year?
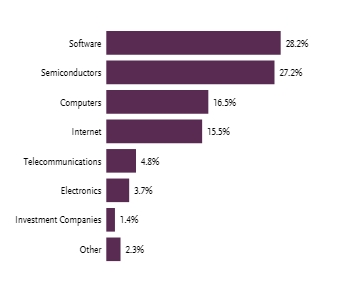
The industries that contributed the most to performance were semiconductors, interactive media & services, and semiconductor materials & equipment. The industry that detracted the most was technology distributors. The holdings that contributed the most to performance were Alphabet, Inc.—Class A, NVIDIA Corp., and Palantir Technologies, Inc.—Class A. Those that detracted the most were Salesforce, Inc., Adobe, Inc., and Marvell Technology, Inc.
| One Year | Five Years | Ten Years | |
|---|---|---|---|
| Technology Fund | 25.70% | 12.27% | 18.37% |
| S&P 500 Index | 17.88% | 14.42% | 14.82% |
| S&P 500 Information Technology Index | 24.04% | 20.91% | 24.30% |
| Net Assets | $28,793,259 |
|---|---|
| Total Number of Portfolio Holdings | |
| Portfolio Turnover Rate | 190% |
| Total Advisory Fees Paid | $200,602 |
| NVIDIA Corp. | |
| Apple, Inc. | |
| Alphabet, Inc. — Class A | |
| Microsoft Corp. | |
| Meta Platforms, Inc. — Class A | |
| Broadcom, Inc. | |
| Palantir Technologies, Inc. — Class A | |
| Micron Technology, Inc. | |
| Oracle Corp. | |
| Advanced Micro Devices, Inc. | |
| Top 10 Total |
1 | "Holdings Diversification (Market Exposure as a % of Net Assets)" excludes any temporary cash investments, investments in Guggenheim Strategy Funds Trust mutual funds, or investments in Guggenheim Ultra Short Duration Fund. |
2 | "10 Largest Holdings (as a % of Net Assets)" excludes any temporary cash investments. |
| Top 10 | % of Net Assets |
|---|---|
| NVIDIA Corp. | |
| Apple, Inc. | |
| Alphabet, Inc. — Class A | |
| Microsoft Corp. | |
| Meta Platforms, Inc. — Class A | |
| Broadcom, Inc. | |
| Palantir Technologies, Inc. — Class A | |
| Micron Technology, Inc. | |
| Oracle Corp. | |
| Advanced Micro Devices, Inc. | |
| Top 10 Total |
2 | "10 Largest Holdings (as a % of Net Assets)" excludes any temporary cash investments. |
There were no material changes for the period.
There were no changes in or disagreements with fund accountants for the period.
| Class | Costs of a $10,000 Investment | Costs Paid as a % of a $10,000 Investment |
|---|---|---|
| Variable Annuity | $206 | 1.78% |
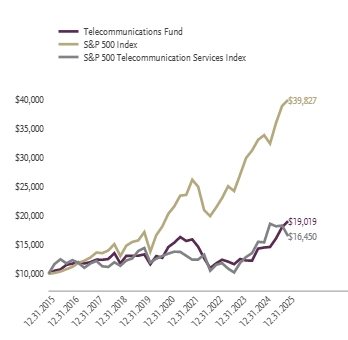
For the period of January 1, 2025 to December 31, 2025, the fund returned 31.13%, outperforming the fund's broad-based securities market index, the S&P 500 Index, which returned 17.88% for the same period and outperforming the fund's secondary index, the S&P 500 Telecommunication Services Index, which returned 6.91% for the same period.
What factors materially affected the fund's performance over the last year?
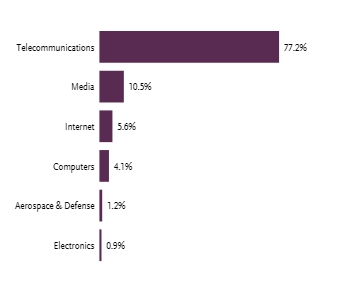
The industries that contributed the most to performance were communications equipment, alternative carriers, and integrated telecommunication services. No industry detracted from performance. The holdings that contributed the most to performance were EchoStar Corp.—Class A, Lumentum Holdings, Inc., and Ciena Corp. Those that detracted the most were Charter Communications, Inc.—Class A, Comcast Corp. – Class A, and Cogent Communications Holdings, Inc.
| One Year | Five Years | Ten Years | |
|---|---|---|---|
| Telecommunications Fund | 31.13% | 5.45% | 6.64% |
| S&P 500 Index | 17.88% | 14.42% | 14.82% |
| S&P 500 Telecommunication Services Index | 6.91% | 4.09% | 5.10% |
| Net Assets | $3,776,220 |
|---|---|
| Total Number of Portfolio Holdings | |
| Portfolio Turnover Rate | 574% |
| Total Advisory Fees Paid | $33,361 |
| Cisco Systems, Inc. | |
| AT&T, Inc. | |
| Verizon Communications, Inc. | |
| Arista Networks, Inc. | |
| Comcast Corp. — Class A | |
| T-Mobile US, Inc. | |
| Motorola Solutions, Inc. | |
| Ciena Corp. | |
| EchoStar Corp. — Class A | |
| Lumentum Holdings, Inc. | |
| Top 10 Total |
1 | "Holdings Diversification (Market Exposure as a % of Net Assets)" excludes any temporary cash investments, investments in Guggenheim Strategy Funds Trust mutual funds, or investments in Guggenheim Ultra Short Duration Fund. |
2 | "10 Largest Holdings (as a % of Net Assets)" excludes any temporary cash investments. |
| Top 10 | % of Net Assets |
|---|---|
| Cisco Systems, Inc. | |
| AT&T, Inc. | |
| Verizon Communications, Inc. | |
| Arista Networks, Inc. | |
| Comcast Corp. — Class A | |
| T-Mobile US, Inc. | |
| Motorola Solutions, Inc. | |
| Ciena Corp. | |
| EchoStar Corp. — Class A | |
| Lumentum Holdings, Inc. | |
| Top 10 Total |
2 | "10 Largest Holdings (as a % of Net Assets)" excludes any temporary cash investments. |
There were no material changes for the period.
There were no changes in or disagreements with fund accountants for the period.
| Class | Costs of a $10,000 Investment | Costs Paid as a % of a $10,000 Investment |
|---|---|---|
| Variable Annuity | $188 | 1.78% |
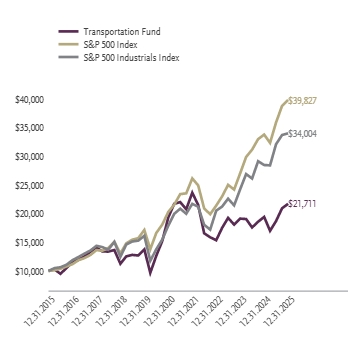
For the period of January 1, 2025 to December 31, 2025, the fund returned 11.79%, underperforming the fund's broad-based securities market index, the S&P 500 Index, which returned 17.88% for the same period and underperforming the fund's secondary index, the S&P 500 Industrials Index, which returned 19.42% for the same period.
What factors materially affected the fund's performance over the last year?
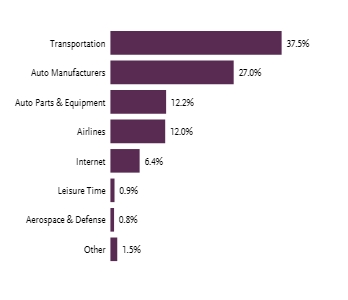
The industries that contributed the most to performance were automobile manufacturers, passenger airlines, passenger ground transportation, and automotive parts & equipment. Those that detracted the most were cargo ground transportation and motorcycle manufacturers. The holdings that contributed the most to performance were Tesla, Inc., Uber Technologies, Inc., and General Motors Co. Those that detracted the most were United Parcel Service, Inc. — Class B, Mobileye Global, Inc.—Class A and Lucid Group, Inc.
| One Year | Five Years | Ten Years | |
|---|---|---|---|
| Transportation Fund | 11.79% | 2.32% | 8.06% |
| S&P 500 Index | 17.88% | 14.42% | 14.82% |
| S&P 500 Industrials Index | 19.42% | 13.66% | 13.02% |
| Net Assets | $3,431,956 |
|---|---|
| Total Number of Portfolio Holdings | |
| Portfolio Turnover Rate | 1,303% |
| Total Advisory Fees Paid | $29,003 |
| Tesla, Inc. | |
| Uber Technologies, Inc. | |
| Union Pacific Corp. | |
| United Parcel Service, Inc. — Class B | |
| General Motors Co. | |
| CSX Corp. | |
| Norfolk Southern Corp. | |
| FedEx Corp. | |
| Ford Motor Co. | |
| Delta Air Lines, Inc. | |
| Top 10 Total |
1 | "Holdings Diversification (Market Exposure as a % of Net Assets)" excludes any temporary cash investments, investments in Guggenheim Strategy Funds Trust mutual funds, or investments in Guggenheim Ultra Short Duration Fund. |
2 | "10 Largest Holdings (as a % of Net Assets)" excludes any temporary cash investments. |
| Top 10 | % of Net Assets |
|---|---|
| Tesla, Inc. | |
| Uber Technologies, Inc. | |
| Union Pacific Corp. | |
| United Parcel Service, Inc. — Class B | |
| General Motors Co. | |
| CSX Corp. | |
| Norfolk Southern Corp. | |
| FedEx Corp. | |
| Ford Motor Co. | |
| Delta Air Lines, Inc. | |
| Top 10 Total |
2 | "10 Largest Holdings (as a % of Net Assets)" excludes any temporary cash investments. |
There were no material changes for the period.
There were no changes in or disagreements with fund accountants for the period.
| Class | Costs of a $10,000 Investment | Costs Paid as a % of a $10,000 Investment |
|---|---|---|
| Variable Annuity | $194 | 1.79% |
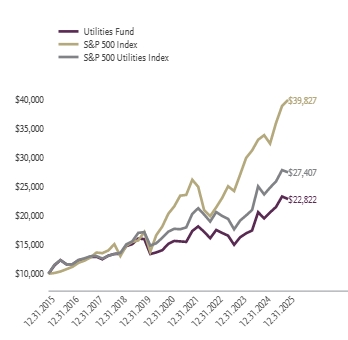
For the period of January 1, 2025 to December 31, 2025, the fund returned 17.07%, underperforming the fund's broad-based securities market index, the S&P 500 Index, which returned 17.88% for the same period and outperforming the fund's secondary index, the S&P 500 Utilities Index, which returned 16.04% for the same period.
What factors materially affected the fund's performance over the last year?
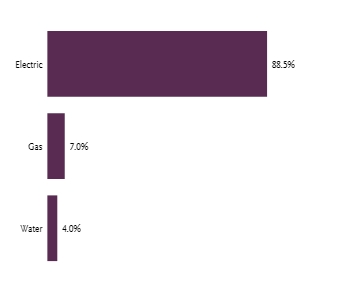
The industries that contributed the most to performance were electric utilities, multi-utilities, and independent power producers & energy traders. No industry detracted from performance. The holdings that contributed the most to performance were Constellation Energy Corp., NRG Energy, Inc., and Oklo, Inc. Those that detracted the most were PG&E Corp., Edison International, and Sunnova Energy International, Inc.
| One Year | Five Years | Ten Years | |
|---|---|---|---|
| Utilities Fund | 17.07% | 8.56% | 8.60% |
| S&P 500 Index | 17.88% | 14.42% | 14.82% |
| S&P 500 Utilities Index | 16.04% | 9.73% | 10.61% |
| Net Assets | $9,900,669 |
|---|---|
| Total Number of Portfolio Holdings | |
| Portfolio Turnover Rate | 249% |
| Total Advisory Fees Paid | $90,146 |
| NextEra Energy, Inc. | |
| Constellation Energy Corp. | |
| Southern Co. | |
| Duke Energy Corp. | |
| American Electric Power Company, Inc. | |
| Sempra | |
| Dominion Energy, Inc. | |
| Vistra Corp. | |
| Exelon Corp. | |
| Xcel Energy, Inc. | |
| Top 10 Total |
1 | "Holdings Diversification (Market Exposure as a % of Net Assets)" excludes any temporary cash investments, investments in Guggenheim Strategy Funds Trust mutual funds, or investments in Guggenheim Ultra Short Duration Fund. |
2 | "10 Largest Holdings (as a % of Net Assets)" excludes any temporary cash investments. |
| Top 10 | % of Net Assets |
|---|---|
| NextEra Energy, Inc. | |
| Constellation Energy Corp. | |
| Southern Co. | |
| Duke Energy Corp. | |
| American Electric Power Company, Inc. | |
| Sempra | |
| Dominion Energy, Inc. | |
| Vistra Corp. | |
| Exelon Corp. | |
| Xcel Energy, Inc. | |
| Top 10 Total |
2 | "10 Largest Holdings (as a % of Net Assets)" excludes any temporary cash investments. |
There were no material changes for the period.
There were no changes in or disagreements with fund accountants for the period.
| Class | Costs of a $10,000 Investment | Costs Paid as a % of a $10,000 Investment |
|---|---|---|
| Variable Annuity | $203 | 1.85% |
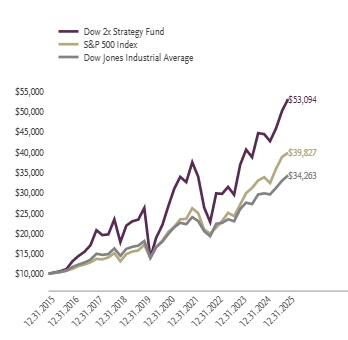
For the period of January 1, 2025 to December 31, 2025, the fund returned 19.49%, outperforming the fund's broad-based securities market index, the S&P 500 Index, which returned 17.88% for the same period and outperforming the fund's secondary index, the Dow Jones Industrial Average, which returned 14.92% for the same period.
What factors materially affected the fund's performance over the last year?
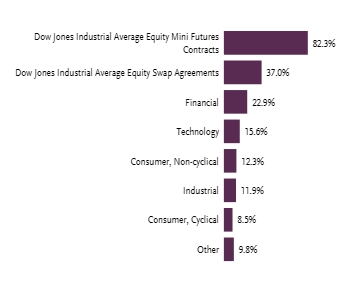
The sectors that contributed the most to the return of the underlying index were financials, industrials, and information technology. Those that detracted the most were health care, materials, and consumer discretionary. The holdings that contributed the most to return of the underlying index were Goldman Sachs Group, Inc., Caterpillar, Inc., and JP Morgan Chase & Co. Those that detracted the most were UnitedHealth Group, Inc. Salesforce, Inc., and Home Depot, Inc. The Fund maintained a daily correlation of over 99% to its benchmark of 200% of the daily price movement of the Dow Jones Industrial Average.
| One Year | Five Years | Ten Years | |
|---|---|---|---|
| Dow 2x Strategy Fund | 19.49% | 14.77% | 18.17% |
| S&P 500 Index | 17.88% | 14.42% | 14.82% |
| Dow Jones Industrial Average | 14.92% | 11.58% | 13.11% |
| Net Assets | $8,226,509 |
|---|---|
| Total Number of Portfolio Holdings | |
| Portfolio Turnover Rate | 978% |
| Total Advisory Fees Paid | $63,262 |
| Goldman Sachs Group, Inc. | |
| Caterpillar, Inc. | |
| Microsoft Corp. | |
| American Express Co. | |
| Visa, Inc. — Class A | |
| Home Depot, Inc. | |
| UnitedHealth Group, Inc. | |
| Amgen, Inc. | |
| Sherwin-Williams Co. | |
| JPMorgan Chase & Co. | |
| Top 10 Total |
1 | "Holdings Diversification (Market Exposure as a % of Net Assets)" excludes any temporary cash investments, investments in Guggenheim Strategy Funds Trust mutual funds, or investments in Guggenheim Ultra Short Duration Fund. |
2 | "10 Largest Holdings (as a % of Net Assets)" excludes any temporary cash or derivative investments. |
| Top 10 | % of Net Assets |
|---|---|
| Goldman Sachs Group, Inc. | |
| Caterpillar, Inc. | |
| Microsoft Corp. | |
| American Express Co. | |
| Visa, Inc. — Class A | |
| Home Depot, Inc. | |
| UnitedHealth Group, Inc. | |
| Amgen, Inc. | |
| Sherwin-Williams Co. | |
| JPMorgan Chase & Co. | |
| Top 10 Total |
2 | "10 Largest Holdings (as a % of Net Assets)" excludes any temporary cash or derivative investments. |
There were no material changes for the period.
There were no changes in or disagreements with fund accountants for the period.
| Class | Costs of a $10,000 Investment | Costs Paid as a % of a $10,000 Investment |
|---|---|---|
| Variable Annuity | $165 | 1.84% |
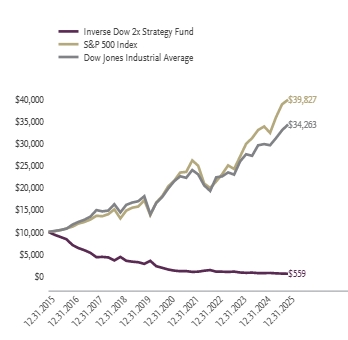
For the period of January 1, 2025 to December 31, 2025, the fund returned -20.69%, underperforming the fund's broad-based securities market index, the S&P 500 Index, which returned 17.88% for the same period and underperforming the fund's secondary index, the Dow Jones Industrial Average, which returned 14.92% for the same period.
What factors materially affected the fund's performance over the last year?
The sectors that contributed the most to the return of the underlying index were financials, industrials, and information technology. Those that detracted the most were health care, materials, and consumer discretionary. The holdings that contributed the most to return of the underlying index were Goldman Sachs Group, Inc., Caterpillar, Inc., and JP Morgan Chase & Co. Those that detracted the most were UnitedHealth Group, Inc. Salesforce, Inc., and Home Depot, Inc. The Fund maintained a daily correlation of over 99% to its benchmark of -200% of the daily price movement of the Dow Jones Industrial Average.
| One Year | Five Years | Ten Years | |
|---|---|---|---|
| Inverse Dow 2x Strategy Fund | -20.69% | -18.02% | -25.05% |
| S&P 500 Index | 17.88% | 14.42% | 14.82% |
| Dow Jones Industrial Average | 14.92% | 11.58% | 13.11% |
| Net Assets | $488,766 |
|---|---|
| Total Number of Portfolio Holdings | |
| Portfolio Turnover Rate | 0% |
| Total Advisory Fees Paid | $8,372 |

1 | "Holdings Diversification (Market Exposure as a % of Net Assets)" excludes any temporary cash investments, investments in Guggenheim Strategy Funds Trust mutual funds, or investments in Guggenheim Ultra Short Duration Fund. |
There were no material changes for the period.
There were no changes in or disagreements with fund accountants for the period.
| Class | Costs of a $10,000 Investment | Costs Paid as a % of a $10,000 Investment |
|---|---|---|
| Variable Annuity | $184 | 1.79% |
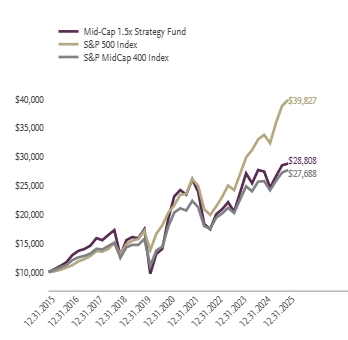
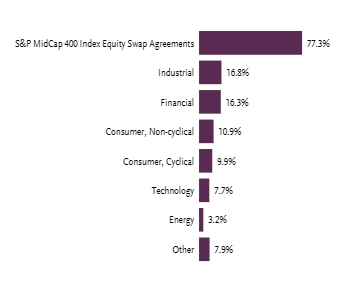
For the period of January 1, 2025 to December 31, 2025, the fund returned 5.04%, underperforming the fund's broad-based securities market index, the S&P 500 Index, which returned 17.88% for the same period and underperforming the fund's secondary index, the S&P MidCap 400 Index, which returned 7.50% for the same period.
What factors materially affected the fund's performance over the last year?
The sectors that contributed the most to the return of the underlying index were industrials, information technology, and financials. The sectors that detracted the most were consumer discretionary and consumer staples. The holdings that contributed the most to the return of the underlying index were Ciena Corp., Comfort Systems USA, Inc., and Lumentum Holdings, Inc. Those that detracted the most were Sarepta Therapeutics, Inc., Avantor, Inc., and Nutanix, Inc.—Class A. The Fund maintained a correlation of over 99% to its benchmark of 150% of the daily price movement of the S&P MidCap 400 Index.
| One Year | Five Years | Ten Years | |
|---|---|---|---|
| Mid-Cap 1.5x Strategy Fund | 5.04% | 8.37% | 11.16% |
| S&P 500 Index | 17.88% | 14.42% | 14.82% |
| S&P MidCap 400 Index | 7.50% | 9.12% | 10.72% |
| Net Assets | $3,599,249 |
|---|---|
| Total Number of Portfolio Holdings | |
| Portfolio Turnover Rate | 20% |
| Total Advisory Fees Paid | $28,611 |
| Guggenheim Ultra Short Duration Fund — Institutional Class | |
| Guggenheim Strategy Fund II | |
| Ciena Corp. | |
| Coherent Corp. | |
| Lumentum Holdings, Inc. | |
| Flex Ltd. | |
| Twilio, Inc. — Class A | |
| Pure Storage, Inc. — Class A | |
| United Therapeutics Corp. | |
| Casey's General Stores, Inc. | |
| Top 10 Total |
1 | "Holdings Diversification (Market Exposure as a % of Net Assets)" excludes any temporary cash investments, investments in Guggenheim Strategy Funds Trust mutual funds, or investments in Guggenheim Ultra Short Duration Fund. |
2 | "10 Largest Holdings (as a % of Net Assets)" excludes any temporary cash or derivative investments. |
| Top 10 | % of Net Assets |
|---|---|
| Guggenheim Ultra Short Duration Fund — Institutional Class | |
| Guggenheim Strategy Fund II | |
| Ciena Corp. | |
| Coherent Corp. | |
| Lumentum Holdings, Inc. | |
| Flex Ltd. | |
| Twilio, Inc. — Class A | |
| Pure Storage, Inc. — Class A | |
| United Therapeutics Corp. | |
| Casey's General Stores, Inc. | |
| Top 10 Total |
2 | "10 Largest Holdings (as a % of Net Assets)" excludes any temporary cash or derivative investments. |
There were no material changes for the period.
There were no changes in or disagreements with fund accountants for the period.
| Class | Costs of a $10,000 Investment | Costs Paid as a % of a $10,000 Investment |
|---|---|---|
| Variable Annuity | $175 | 1.80% |
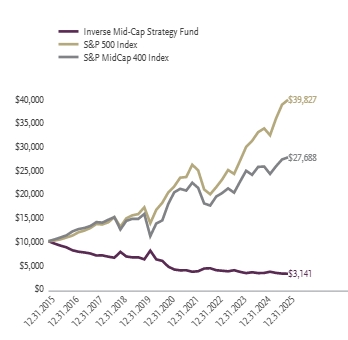
For the period of January 1, 2025 to December 31, 2025, the fund returned -5.11%, underperforming the fund's broad-based securities market index, the S&P 500 Index, which returned 17.88% for the same period and underperforming the fund's secondary index, the S&P MidCap 400 Index, which returned 7.50% for the same period.
What factors materially affected the fund's performance over the last year?
The sectors that contributed the most to the return of the underlying index were industrials, information technology, and financials. The sectors that detracted the most were consumer discretionary and consumer staples. The holdings that contributed the most to the return of the underlying index were Ciena Corp., Comfort Systems USA, Inc., and Lumentum Holdings, Inc. Those that detracted the most were Sarepta Therapeutics, Inc., Avantor, Inc., and Nutanix, Inc.—Class A. The Fund maintained a daily correlation of 99% to its benchmark of -100% of the daily price movement of the S&P MidCap 400 Index.
| One Year | Five Years | Ten Years | |
|---|---|---|---|
| Inverse Mid-Cap Strategy Fund | -5.11% | -7.51% | -10.94% |
| S&P 500 Index | 17.88% | 14.42% | 14.82% |
| S&P MidCap 400 Index | 7.50% | 9.12% | 10.72% |
| Net Assets | $115,358 |
|---|---|
| Total Number of Portfolio Holdings | |
| Portfolio Turnover Rate | 0% |
| Total Advisory Fees Paid | $985 |

| Guggenheim Ultra Short Duration Fund — Institutional Class | |
| Guggenheim Strategy Fund II | |
| Total |
1 | "Holdings Diversification (Market Exposure as a % of Net Assets)" excludes any temporary cash investments, investments in Guggenheim Strategy Funds Trust mutual funds, or investments in Guggenheim Ultra Short Duration Fund. |
2 | "Largest Holdings (as a % of Net Assets)" excludes any temporary cash or derivative investments. |
| Top 10 | % of Net Assets |
|---|---|
| Guggenheim Ultra Short Duration Fund — Institutional Class | |
| Guggenheim Strategy Fund II | |
| Total |
2 | "Largest Holdings (as a % of Net Assets)" excludes any temporary cash or derivative investments. |
There were no material changes for the period.
There were no changes in or disagreements with fund accountants for the period.
| Class | Costs of a $10,000 Investment | Costs Paid as a % of a $10,000 Investment |
|---|---|---|
| Variable Annuity | $188 | 1.72% |
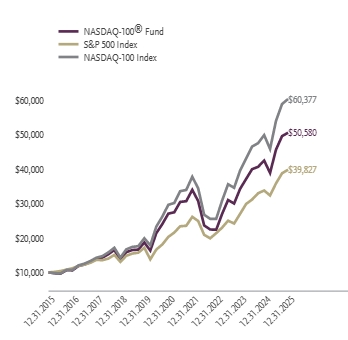
For the period of January 1, 2025 to December 31, 2025, the fund returned 19.04%, outperforming the fund's broad-based securities market index, the S&P 500 Index, which returned 17.88% for the same period and underperforming the fund's secondary index, the NASDAQ-100 Index, which returned 21.02% for the same period.
What factors materially affected the fund's performance over the last year?
The sectors that contributed the most to the return of the underlying index were information technology, communication services, and consumer discretionary. Those that detracted the most were industrials, financials, and consumer staples. The holdings that contributed the most to the return of the underlying index were NVIDIA Corp., Broadcom, Inc., and Microsoft Corp. Those that detracted the most were Adobe, Inc., Trade Desk, Inc.—Class A, and Marvell Technology, Inc. The Fund maintained a daily correlation of over 99% to its benchmark of 100% of the daily price movement of the NASDAQ-100 Index.
| One Year | Five Years | Ten Years | |
|---|---|---|---|
| NASDAQ-100® Fund | 19.04% | 13.32% | 17.60% |
| S&P 500 Index | 17.88% | 14.42% | 14.82% |
| NASDAQ-100 Index | 21.02% | 15.30% | 19.70% |
| Net Assets | $121,017,516 |
|---|---|
| Total Number of Portfolio Holdings | |
| Portfolio Turnover Rate | 152% |
| Total Advisory Fees Paid | $837,036 |
| Guggenheim Ultra Short Duration Fund — Institutional Class | |
| Guggenheim Strategy Fund II | |
| NVIDIA Corp. | |
| Apple, Inc. | |
| Microsoft Corp. | |
| Amazon.com, Inc. | |
| Tesla, Inc. | |
| Meta Platforms, Inc. — Class A | |
| Alphabet, Inc. — Class A | |
| Alphabet, Inc. — Class C | |
| Top 10 Total |
1 | "Holdings Diversification (Market Exposure as a % of Net Assets)" excludes any temporary cash investments, investments in Guggenheim Strategy Funds Trust mutual funds, or investments in Guggenheim Ultra Short Duration Fund. |
2 | "10 Largest Holdings (as a % of Net Assets)" excludes any temporary cash or derivative investments. |
| Top 10 | % of Net Assets |
|---|---|
| Guggenheim Ultra Short Duration Fund — Institutional Class | |
| Guggenheim Strategy Fund II | |
| NVIDIA Corp. | |
| Apple, Inc. | |
| Microsoft Corp. | |
| Amazon.com, Inc. | |
| Tesla, Inc. | |
| Meta Platforms, Inc. — Class A | |
| Alphabet, Inc. — Class A | |
| Alphabet, Inc. — Class C | |
| Top 10 Total |
2 | "10 Largest Holdings (as a % of Net Assets)" excludes any temporary cash or derivative investments. |
There were no material changes for the period.
There were no changes in or disagreements with fund accountants for the period.
| Class | Costs of a $10,000 Investment | Costs Paid as a % of a $10,000 Investment |
|---|---|---|
| Variable Annuity | $218 | 1.90% |
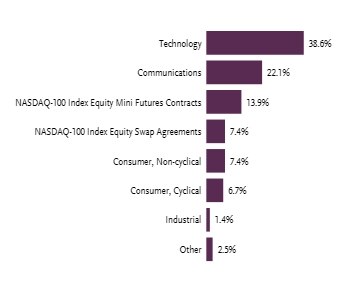
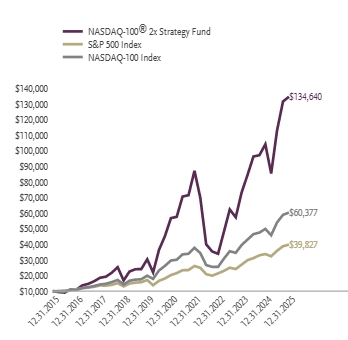
For the period of January 1, 2025 to December 31, 2025, the fund returned 29.24%, outperforming the fund's broad-based securities market index, the S&P 500 Index, which returned 17.88% for the same period and outperforming the fund's secondary index, the NASDAQ-100 Index, which returned 21.02% for the same period.
What factors materially affected the fund's performance over the last year?
The sectors that contributed the most to the return of the underlying index were information technology, communication services, and consumer discretionary. Those that detracted the most were industrials, financials, and consumer staples. The holdings that contributed the most to the return of the underlying index were NVIDIA Corp., Broadcom, Inc., and Microsoft Corp. Those that detracted the most were Adobe, Inc., Trade Desk, Inc.—Class A, and Marvell Technology, Inc. The Fund maintained a daily correlation of over 99% to its benchmark of 200% of the daily price movement of the NASDAQ-100 Index.
| One Year | Five Years | Ten Years | |
|---|---|---|---|
| NASDAQ-100® 2x Strategy Fund | 29.24% | 18.83% | 29.69% |
| S&P 500 Index | 17.88% | 14.42% | 14.82% |
| NASDAQ-100 Index | 21.02% | 15.30% | 19.70% |
| Net Assets | $149,185,631 |
|---|---|
| Total Number of Portfolio Holdings | |
| Portfolio Turnover Rate | 497% |
| Total Advisory Fees Paid | $1,067,195 |

| NVIDIA Corp. | |
| Apple, Inc. | |
| Microsoft Corp. | |
| Amazon.com, Inc. | |
| Tesla, Inc. | |
| Meta Platforms, Inc. — Class A | |
| Alphabet, Inc. — Class A | |
| Alphabet, Inc. — Class C | |
| Broadcom, Inc. | |
| Palantir Technologies, Inc. — Class A | |
| Top 10 Total |
1 | "Holdings Diversification (Market Exposure as a % of Net Assets)" excludes any temporary cash investments, investments in Guggenheim Strategy Funds Trust mutual funds, or in investments in Guggenheim Ultra Short Duration Fund. |
2 | "10 Largest Holdings (as a % of Net Assets)" excludes any temporary cash or derivative investments. |
| Top 10 | % of Net Assets |
|---|---|
| NVIDIA Corp. | |
| Apple, Inc. | |
| Microsoft Corp. | |
| Amazon.com, Inc. | |
| Tesla, Inc. | |
| Meta Platforms, Inc. — Class A | |
| Alphabet, Inc. — Class A | |
| Alphabet, Inc. — Class C | |
| Broadcom, Inc. | |
| Palantir Technologies, Inc. — Class A | |
| Top 10 Total |
2 | "10 Largest Holdings (as a % of Net Assets)" excludes any temporary cash or derivative investments. |
There were no material changes for the period.
There were no changes in or disagreements with fund accountants for the period.
| Class | Costs of a $10,000 Investment | Costs Paid as a % of a $10,000 Investment |
|---|---|---|
| Variable Annuity | $165 | 1.79% |
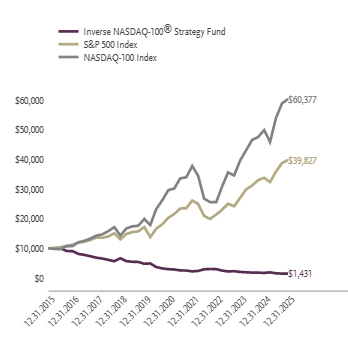
For the period of January 1, 2025 to December 31, 2025, the fund returned -16.18%, underperforming the fund's broad-based securities market index, the S&P 500 Index, which returned 17.88% for the same period and underperforming the fund's secondary index, the NASDAQ-100 Index, which returned 21.02% for the same period.
What factors materially affected the fund's performance over the last year?
The sectors that contributed the most to the return of the underlying index were information technology, communication services, and consumer discretionary. Those that detracted the most were industrials, financials, and consumer staples. The holdings that contributed the most to the return of the underlying index were NVIDIA Corp., Broadcom, Inc., and Microsoft Corp. Those that detracted the most were Adobe, Inc., Trade Desk, Inc.—Class A, and Marvell Technology, Inc. The fund maintained a daily correlation of over 99% to its benchmark of -100% of the daily price movement of the NASDAQ-100 Index.
| One Year | Five Years | Ten Years | |
|---|---|---|---|
| Inverse NASDAQ-100® Strategy Fund | -16.18% | -13.53% | -17.67% |
| S&P 500 Index | 17.88% | 14.42% | 14.82% |
| NASDAQ-100 Index | 21.02% | 15.30% | 19.70% |
| Net Assets | $492,316 |
|---|---|
| Total Number of Portfolio Holdings | |
| Portfolio Turnover Rate | 0% |
| Total Advisory Fees Paid | $11,446 |
| Guggenheim Ultra Short Duration Fund — Institutional Class | |
| Guggenheim Strategy Fund II | |
| Total |
1 | "Holdings Diversification (Market Exposure as a % of Net Assets)" excludes any temporary cash investments, investments in Guggenheim Strategy Funds Trust mutual funds, or investments in Guggenheim Ultra Short Duration Fund. |
2 | "Largest Holdings (as a % of Net Assets)" excludes any temporary cash or derivative investments. |
| Top 10 | % of Net Assets |
|---|---|
| Guggenheim Ultra Short Duration Fund — Institutional Class | |
| Guggenheim Strategy Fund II | |
| Total |
2 | "Largest Holdings (as a % of Net Assets)" excludes any temporary cash or derivative investments. |
There were no material changes for the period.
There were no changes in or disagreements with fund accountants for the period.
| Class | Costs of a $10,000 Investment | Costs Paid as a % of a $10,000 Investment |
|---|---|---|
| Variable Annuity | $191 | 1.80% |
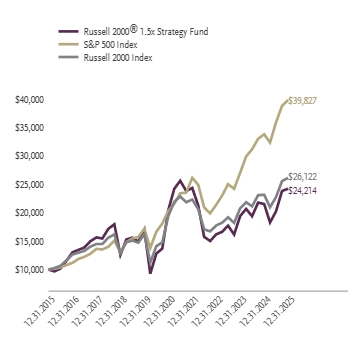
For the period of January 1, 2025 to December 31, 2025, the fund returned 12.47%, underperforming the fund's broad-based securities market index, the S&P 500 Index, which returned 17.88% for the same period and underperforming the fund's secondary index, the Russell 2000 Index, which returned 12.81% for the same period.
What factors materially affected the fund's performance over the last year?
The sectors that contributed the most to the return of the underlying index were health care, industrials, and financials. The sectors that detracted the most were consumer staples and energy. The holdings that contributed the most were Credo Technology Group Holding Ltd., Bloom Energy Corp.—Class A, and EchoStar Corp.—Class A. Those that detracted the most were Vaxcyte, Inc., SPS Commerce, Inc., and Six Flags Entertainment Corp. The fund maintained a daily correlation of over 99% to its benchmark of 150% of the daily price movement of the Russell 2000 Index.
| One Year | Five Years | Ten Years | |
|---|---|---|---|
| Russell 2000® 1.5x Strategy Fund | 12.47% | 3.43% | 9.25% |
| S&P 500 Index | 17.88% | 14.42% | 14.82% |
| Russell 2000 Index | 12.81% | 6.09% | 10.08% |
| Net Assets | $2,890,126 |
|---|---|
| Total Number of Portfolio Holdings | |
| Portfolio Turnover Rate | 5% |
| Total Advisory Fees Paid | $21,165 |
| Vanguard Russell 2000 ETF | |
| iShares Russell 2000 Index ETF | |
| Guggenheim Strategy Fund II | |
| Guggenheim Ultra Short Duration Fund — Institutional Class | |
| Credo Technology Group Holding Ltd. | |
| Bloom Energy Corp. — Class A | |
| Fabrinet | |
| IonQ, Inc. | |
| EchoStar Corp. — Class A | |
| Kratos Defense & Security Solutions, Inc. | |
| Top 10 Total |
1 | "Holdings Diversification (Market Exposure as a % of Net Assets)" excludes any temporary cash investments, investments in Guggenheim Strategy Funds Trust mutual funds, or investments in Guggenheim Ultra Short Duration Fund. |
2 | "10 Largest Holdings (as a % of Net Assets)" excludes any temporary cash or derivative investments. |
| Top 10 | % of Net Assets |
|---|---|
| Vanguard Russell 2000 ETF | |
| iShares Russell 2000 Index ETF | |
| Guggenheim Strategy Fund II | |
| Guggenheim Ultra Short Duration Fund — Institutional Class | |
| Credo Technology Group Holding Ltd. | |
| Bloom Energy Corp. — Class A | |
| Fabrinet | |
| IonQ, Inc. | |
| EchoStar Corp. — Class A | |
| Kratos Defense & Security Solutions, Inc. | |
| Top 10 Total |
2 | "10 Largest Holdings (as a % of Net Assets)" excludes any temporary cash or derivative investments. |
There were no material changes for the period.
There were no changes in or disagreements with fund accountants for the period.
| Class | Costs of a $10,000 Investment | Costs Paid as a % of a $10,000 Investment |
|---|---|---|
| Variable Annuity | $199 | 1.88% |
For the period of January 1, 2025 to December 31, 2025, the fund returned 12.07%, underperforming the fund's broad-based securities market index, the S&P 500 Index, which returned 17.88% for the same period and underperforming the fund's secondary index, the Russell 2000 Index, which returned 12.81% for the same period.
What factors materially affected the fund's performance over the last year?
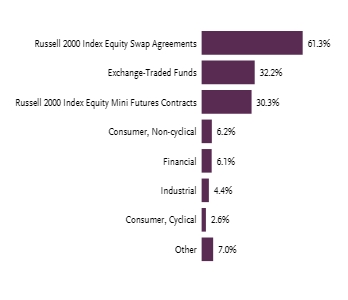
The sectors that contributed the most to the return of the underlying index were health care, industrials, and financials. The sectors that detracted the most were consumer staples and energy. The holdings that contributed the most were Credo Technology Group Holding Ltd., Bloom Energy Corp.—Class A, and EchoStar Corp.—Class A. Those that detracted the most were Vaxcyte, Inc., SPS Commerce, Inc., and Six Flags Entertainment Corp. The Fund maintained a daily correlation of over 99% to its benchmark of 200% of the daily price movement of the Russell 2000 Index.
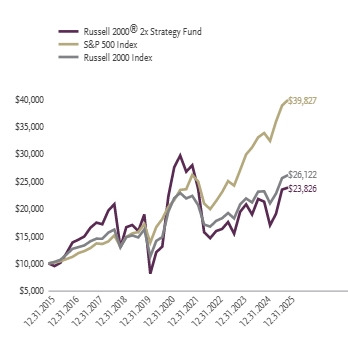
| One Year | Five Years | Ten Years | |
|---|---|---|---|
| Russell 2000® 2x Strategy Fund | 12.07% | 1.43% | 9.07% |
| S&P 500 Index | 17.88% | 14.42% | 14.82% |
| Russell 2000 Index | 12.81% | 6.09% | 10.08% |
| Net Assets | $6,594,109 |
|---|---|
| Total Number of Portfolio Holdings | |
| Portfolio Turnover Rate | 0% |
| Total Advisory Fees Paid | $43,321 |
| Vanguard Russell 2000 ETF | |
| iShares Russell 2000 Index ETF | |
| Total |
1 | "Holdings Diversification (Market Exposure as a % of Net Assets)" excludes any temporary cash investments, investments in Guggenheim Strategy Funds Trust mutual funds, or investments in Guggenheim Ultra Short Duration Fund. |
2 | "Largest Holdings (as a % of Net Assets)" excludes any temporary cash or derivative investments. |
| Top 10 | % of Net Assets |
|---|---|
| Vanguard Russell 2000 ETF | |
| iShares Russell 2000 Index ETF | |
| Total |
2 | "Largest Holdings (as a % of Net Assets)" excludes any temporary cash or derivative investments. |
There were no material changes for the period.
There were no changes in or disagreements with fund accountants for the period.
| Class | Costs of a $10,000 Investment | Costs Paid as a % of a $10,000 Investment |
|---|---|---|
| Variable Annuity | $172 | 1.81% |
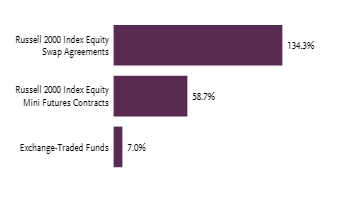
For the period of January 1, 2025 to December 31, 2025, the fund returned -9.58%, underperforming the fund's broad-based securities market index, the S&P 500 Index, which returned 17.88% for the same period and underperforming the fund's secondary index, the Russell 2000 Index, which returned 12.81% for the same period.
What factors materially affected the fund's performance over the last year?
The sectors that contributed the most to the return of the underlying index were health care, industrials, and financials. The sectors that detracted the most were consumer staples and energy. The holdings that contributed the most were Credo Technology Group Holding Ltd., Bloom Energy Corp.—Class A, and EchoStar Corp.—Class A. Those that detracted the most were Vaxcyte, Inc., SPS Commerce, Inc., and Six Flags Entertainment Corp. The fund maintained a daily correlation of over 99% to its benchmark of -100% of the daily price movement of the Russell 2000 Index.
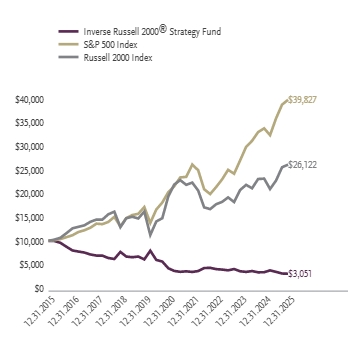
| One Year | Five Years | Ten Years | |
|---|---|---|---|
| Inverse Russell 2000® Strategy Fund | -9.58% | -6.24% | -11.19% |
| S&P 500 Index | 17.88% | 14.42% | 14.82% |
| Russell 2000 Index | 12.81% | 6.09% | 10.08% |
| Net Assets | $207,126 |
|---|---|
| Total Number of Portfolio Holdings | |
| Portfolio Turnover Rate | 0% |
| Total Advisory Fees Paid | $5,162 |
| Guggenheim Strategy Fund II | |
| Guggenheim Ultra Short Duration Fund — Institutional Class | |
| Total |
1 | "Holdings Diversification (Market Exposure as a % of Net Assets)" excludes any temporary cash investments, investments in Guggenheim Strategy Funds Trust mutual funds, or investments in Guggenheim Ultra Short Duration Fund. |
2 | "Largest Holdings (as a % of Net Assets)" excludes any temporary cash or derivative investments. |
| Top 10 | % of Net Assets |
|---|---|
| Guggenheim Strategy Fund II | |
| Guggenheim Ultra Short Duration Fund — Institutional Class | |
| Total |
2 | "Largest Holdings (as a % of Net Assets)" excludes any temporary cash or derivative investments. |
There were no material changes for the period.
There were no changes in or disagreements with fund accountants for the period.
| Class | Costs of a $10,000 Investment | Costs Paid as a % of a $10,000 Investment |
|---|---|---|
| Variable Annuity | $189 | 1.71% |
For the period of January 1, 2025 to December 31, 2025, the fund returned 20.87%, outperforming the fund's broad-based securities market index, the S&P 500 Index, which returned 17.88% for the same period.
What factors materially affected the fund's performance over the last year?
The sectors that contributed the most to the return of the underlying index were information technology, communication services, and financials. No sector detracted from performance. The holdings that contributed the most to the return of the underlying index were NVIDIA Corp., Alphabet, Inc.—Class A, and Microsoft Corp. Those that detracted the most were UnitedHealth Group, Inc, Fiserv, Inc., and Salesforce, Inc. The Fund maintained a daily correlation of over 99% to its benchmark of 150% of the daily price movement of the S&P 500 Index.
| One Year | Five Years | Ten Years | |
|---|---|---|---|
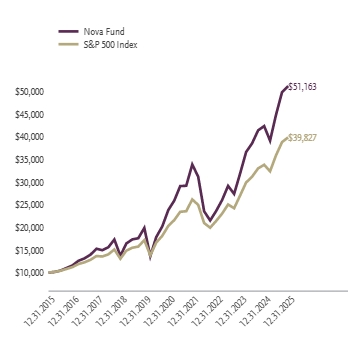
| Nova Fund | 20.87% | 16.53% | 17.73% |
| S&P 500 Index | 17.88% | 14.42% | 14.82% |
| Net Assets | $41,598,981 |
|---|---|
| Total Number of Portfolio Holdings | |
| Portfolio Turnover Rate | 197% |
| Total Advisory Fees Paid | $254,143 |
| NVIDIA Corp. | |
| Apple, Inc. | |
| Guggenheim Ultra Short Duration Fund — Institutional Class | |
| Microsoft Corp. | |
| Guggenheim Strategy Fund II | |
| Amazon.com, Inc. | |
| Alphabet, Inc. — Class A | |
| Broadcom, Inc. | |
| Alphabet, Inc. — Class C | |
| Meta Platforms, Inc. — Class A | |
| Top 10 Total |
1 | "Holdings Diversification (Market Exposure as a % of Net Assets)" excludes any temporary cash investments, investments in Guggenheim Strategy Funds Trust mutual funds, or investments in Guggenheim Ultra Short Duration Fund. |
2 | "10 Largest Holdings (as a % of Net Assets)" excludes any temporary cash or derivative investments. |
| NVIDIA Corp. | |
| Apple, Inc. | |
| Guggenheim Ultra Short Duration Fund — Institutional Class | |
| Microsoft Corp. | |
| Guggenheim Strategy Fund II | |
| Amazon.com, Inc. | |
| Alphabet, Inc. — Class A | |
| Broadcom, Inc. | |
| Alphabet, Inc. — Class C | |
| Meta Platforms, Inc. — Class A | |
| Top 10 Total |
2 | "10 Largest Holdings (as a % of Net Assets)" excludes any temporary cash or derivative investments. |
There were no material changes for the period.
There were no changes in or disagreements with fund accountants for the period.
| Class | Costs of a $10,000 Investment | Costs Paid as a % of a $10,000 Investment |
|---|---|---|
| Variable Annuity | $214 | 1.90% |
For the period of January 1, 2025 to December 31, 2025, the fund returned 25.28%, outperforming the fund's broad-based securities market index, the S&P 500 Index, which returned 17.88% for the same period.
What factors materially affected the fund's performance over the last year?
The sectors that contributed the most to the return of the underlying index were information technology, communication services, and financials. No sector detracted from performance. The holdings that contributed the most to the return of the underlying index were NVIDIA Corp., Alphabet, Inc.—Class A, and Microsoft Corporation. Those that detracted the most were UnitedHealth Group, Inc, Fiserv, Inc., and Salesforce, Inc. The Fund maintained a daily correlation of over 99% to its benchmark of 200% of the daily price movement of the S&P 500 Index.
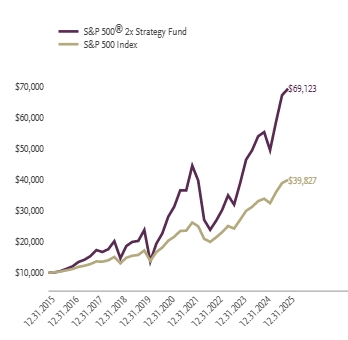
| One Year | Five Years | Ten Years | |
|---|---|---|---|
| S&P 500® 2x Strategy Fund | 25.28% | 19.77% | 21.33% |
| S&P 500 Index | 17.88% | 14.42% | 14.82% |
| Net Assets | $108,631,455 |
|---|---|
| Total Number of Portfolio Holdings | |
| Portfolio Turnover Rate | 73% |
| Total Advisory Fees Paid | $645,052 |
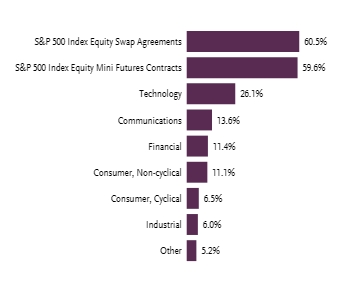
| NVIDIA Corp. | |
| Apple, Inc. | |
| Microsoft Corp. | |
| Amazon.com, Inc. | |
| Alphabet, Inc. — Class A | |
| Broadcom, Inc. | |
| Alphabet, Inc. — Class C | |
| Meta Platforms, Inc. — Class A | |
| Tesla, Inc. | |
| Berkshire Hathaway, Inc. — Class B | |
| Top 10 Total |
1 | "Holdings Diversification (Market Exposure as a % of Net Assets)" excludes any temporary cash investments, investments in Guggenheim Strategy Funds Trust mutual funds, or investments in Guggenheim Ultra Short Duration Fund. |
2 | "10 Largest Holdings (as a % of Net Assets)" excludes any temporary cash or derivative investments. |
| Top 10 | % of Net Assets |
|---|---|
| NVIDIA Corp. | |
| Apple, Inc. | |
| Microsoft Corp. | |
| Amazon.com, Inc. | |
| Alphabet, Inc. — Class A | |
| Broadcom, Inc. | |
| Alphabet, Inc. — Class C | |
| Meta Platforms, Inc. — Class A | |
| Tesla, Inc. | |
| Berkshire Hathaway, Inc. — Class B | |
| Top 10 Total |
2 | "10 Largest Holdings (as a % of Net Assets)" excludes any temporary cash or derivative investments. |
There were no material changes for the period.
There were no changes in or disagreements with fund accountants for the period.
| Class | Costs of a $10,000 Investment | Costs Paid as a % of a $10,000 Investment |
|---|---|---|
| Variable Annuity | $168 | 1.78% |
For the period of January 1, 2025 to December 31, 2025, the fund returned -11.76%, underperforming the fund's broad-based securities market index, the S&P 500 Index, which returned 17.88% for the same period.
What factors materially affected the fund's performance over the last year?
The sectors that contributed the most to the return of the underlying index were information technology, communication services, and financials. No sector detracted from performance. The holdings that contributed the most to the return of the underlying index were NVIDIA Corp., Alphabet, Inc.—Class A, and Microsoft Corp. Those that detracted the most were UnitedHealth Group, Inc, Fiserv, Inc., and Salesforce, Inc. The Fund maintained a daily correlation of over 99% to its benchmark of -100% of the daily price movement of the S&P 500 Index.
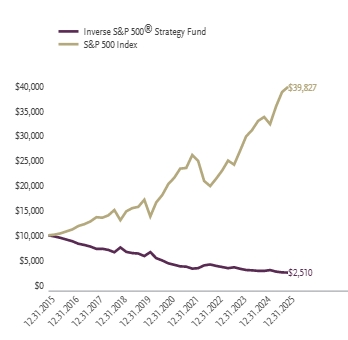
| One Year | Five Years | Ten Years | |
|---|---|---|---|
| Inverse S&P 500® Strategy Fund | -11.76% | -10.49% | -12.91% |
| S&P 500 Index | 17.88% | 14.42% | 14.82% |
| Net Assets | $1,269,162 |
|---|---|
| Total Number of Portfolio Holdings | |
| Portfolio Turnover Rate | 0% |
| Total Advisory Fees Paid | $11,452 |

| Guggenheim Ultra Short Duration Fund — Institutional Class | |
| Guggenheim Strategy Fund II | |
| Total |
1 | "Holdings Diversification (Market Exposure as a % of Net Assets)" excludes any temporary cash investments, investments in Guggenheim Strategy Funds Trust mutual funds, or investments in Guggenheim Ultra Short Duration Fund. |
2 | "Largest Holdings (as a % of Net Assets)" excludes any temporary cash or derivative investments. |
| Top 10 | % of Net Assets |
|---|---|
| Guggenheim Ultra Short Duration Fund — Institutional Class | |
| Guggenheim Strategy Fund II | |
| Total |
2 | "Largest Holdings (as a % of Net Assets)" excludes any temporary cash or derivative investments. |
There were no material changes for the period.
There were no changes in or disagreements with fund accountants for the period.
| Class | Costs of a $10,000 Investment | Costs Paid as a % of a $10,000 Investment |
|---|---|---|
| Variable Annuity | $179 | 1.69% |
For the period of January 1, 2025 to December 31, 2025, the fund returned 11.75%, underperforming the fund's broad-based securities market index, the S&P 500 Index, which returned 17.88% for the same period and underperforming the fund's secondary index, the S&P 500 Pure Growth Index, which returned 13.86% for the same period.
What factors materially affected the fund's performance over the last year?
The sectors that contributed the most to the return of the underlying index for the reporting period were industrials, information technology, and consumer discretionary. The sectors that detracted were financials, energy, and materials. The holdings that contributed the most to the return of the underlying index for the reporting period were Palantir Technologies, Inc.—Class A, Howmet Aerospace, Inc., and Tapestry, Inc. Those that detracted the most were Trade Desk, Inc.—Class A, Deckers Outdoor Corp., and Fiserv, Inc. The Fund maintained a daily correlation of over 99% to the S&P 500 Pure Growth Index for the reporting period.
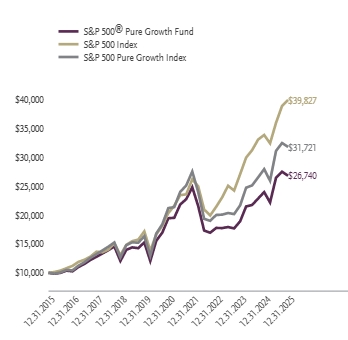
| One Year | Five Years | Ten Years | |
|---|---|---|---|
| S&P 500® Pure Growth Fund | 11.75% | 6.62% | 10.34% |
| S&P 500 Index | 17.88% | 14.42% | 14.82% |
| S&P 500 Pure Growth Index | 13.86% | 8.41% | 12.24% |
| Net Assets | $24,647,882 |
|---|---|
| Total Number of Portfolio Holdings | |
| Portfolio Turnover Rate | 197% |
| Total Advisory Fees Paid | $200,575 |
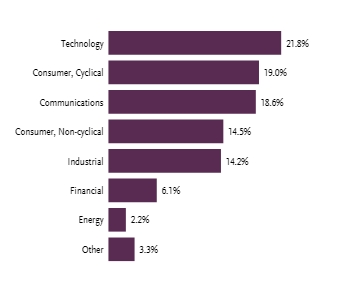
| Berkshire Hathaway, Inc. — Class B | |
| AppLovin Corp. — Class A | |
| Palantir Technologies, Inc. — Class A | |
| Comfort Systems USA, Inc. | |
| Amphenol Corp. — Class A | |
| Howmet Aerospace, Inc. | |
| TKO Group Holdings, Inc. | |
| Eli Lilly & Co. | |
| First Solar, Inc. | |
| Robinhood Markets, Inc. — Class A | |
| Top 10 Total |
1 | "Holdings Diversification (Market Exposure as a % of Net Assets)" excludes any temporary cash investments, investments in Guggenheim Strategy Funds Trust mutual funds, or investments in Guggenheim Ultra Short Duration Fund. |
2 | "10 Largest Holdings (as a % of Net Assets)" excludes any temporary cash or derivative investments. |
| Top 10 | % of Net Assets |
|---|---|
| Berkshire Hathaway, Inc. — Class B | |
| AppLovin Corp. — Class A | |
| Palantir Technologies, Inc. — Class A | |
| Comfort Systems USA, Inc. | |
| Amphenol Corp. — Class A | |
| Howmet Aerospace, Inc. | |
| TKO Group Holdings, Inc. | |
| Eli Lilly & Co. | |
| First Solar, Inc. | |
| Robinhood Markets, Inc. — Class A | |
| Top 10 Total |
2 | "10 Largest Holdings (as a % of Net Assets)" excludes any temporary cash or derivative investments. |
There were no material changes for the period.
There were no changes in or disagreements with fund accountants for the period.
| Class | Costs of a $10,000 Investment | Costs Paid as a % of a $10,000 Investment |
|---|---|---|
| Variable Annuity | $183 | 1.69% |
For the period of January 1, 2025 to December 31, 2025, the fund returned 16.02%, underperforming the fund's broad-based securities market index, the S&P 500 Index, which returned 17.88% for the same period and underperforming the fund's secondary index, the S&P 500 Pure Value Index, which returned 17.66% for the same period.
What factors materially affected the fund's performance over the last year?
The sectors that contributed the most to the return of the underlying index for the reporting period were financials, communication services, and health care. Those that detracted the most were materials and real estate. The holdings that contributed the most to the return of the underlying index for the reporting period were Warner Bros Discovery, Inc.—Series A, CVS Health Corp, and General Motors Company. Those that detracted the most were Centene Corp., CarMax, Inc., and Molina Healthcare, Inc. The Fund maintained a daily correlation of over 99% to the S&P 500 Pure Value Index for the reporting period.
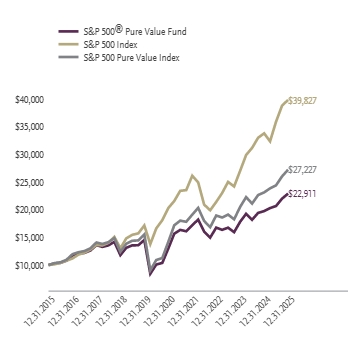
| One Year | Five Years | Ten Years | |
|---|---|---|---|
| S&P 500® Pure Value Fund | 16.02% | 12.00% | 8.64% |
| S&P 500 Index | 17.88% | 14.42% | 14.82% |
| S&P 500 Pure Value Index | 17.66% | 13.92% | 10.53% |
| Net Assets | $17,500,306 |
|---|---|
| Total Number of Portfolio Holdings | |
| Portfolio Turnover Rate | 247% |
| Total Advisory Fees Paid | $129,042 |
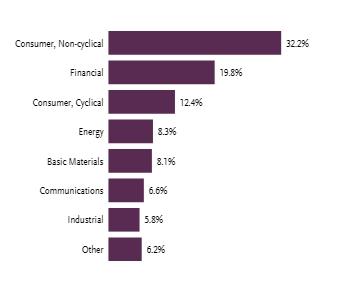
| Ford Motor Co. | |
| Bunge Global S.A. | |
| General Motors Co. | |
| Mosaic Co. | |
| Centene Corp. | |
| Molina Healthcare, Inc. | |
| Tyson Foods, Inc. — Class A | |
| Archer-Daniels-Midland Co. | |
| Cigna Group | |
| CVS Health Corp. | |
| Top 10 Total |
1 | "Holdings Diversification (Market Exposure as a % of Net Assets)" excludes any temporary cash investments, investments in Guggenheim Strategy Funds Trust mutual funds, or investments in Guggenheim Ultra Short Duration Fund. |
2 | "10 Largest Holdings (as a % of Net Assets)" excludes any temporary cash or derivative investments. |
| Top 10 | % of Net Assets |
|---|---|
| Ford Motor Co. | |
| Bunge Global S.A. | |
| General Motors Co. | |
| Mosaic Co. | |
| Centene Corp. | |
| Molina Healthcare, Inc. | |
| Tyson Foods, Inc. — Class A | |
| Archer-Daniels-Midland Co. | |
| Cigna Group | |
| CVS Health Corp. | |
| Top 10 Total |
2 | "10 Largest Holdings (as a % of Net Assets)" excludes any temporary cash or derivative investments. |
There were no material changes for the period.
There were no changes in or disagreements with fund accountants for the period.
| Class | Costs of a $10,000 Investment | Costs Paid as a % of a $10,000 Investment |
|---|---|---|
| Variable Annuity | $175 | 1.69% |
For the period of January 1, 2025 to December 31, 2025, the fund returned 7.18%, underperforming the fund's broad-based securities market index, the S&P 500 Index, which returned 17.88% for the same period and underperforming the fund's secondary index, the S&P MidCap 400 Pure Growth Index, which returned 9.10% for the same period.
What factors materially affected the fund's performance over the last year?
The sectors that contributed the most to the return of the underlying index for the reporting period were industrials, materials and health care. Those that detracted the most from the return of the underlying index were consumer discretionary, consumer staples, and financials. The holdings that contributed the most to the return of the underly index for the reporting period were Comfort Systems USA, Inc., Roivant Sciences Ltd., and Carpenter Technology Corp. Those that detracted the most were Sarepta Therapeutics, Shift4 Payments, Inc.—Class A, and AAON, Inc. The Fund maintained a daily correlation of over 99% to the S&P MidCap 400 Pure Growth Index for the reporting period.
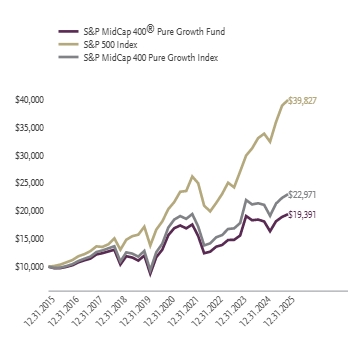
| One Year | Five Years | Ten Years | |
|---|---|---|---|
| S&P MidCap 400® Pure Growth Fund | 7.18% | 4.39% | 6.85% |
| S&P 500 Index | 17.88% | 14.42% | 14.82% |
| S&P MidCap 400 Pure Growth Index | 9.10% | 6.21% | 8.68% |
| Net Assets | $9,008,049 |
|---|---|
| Total Number of Portfolio Holdings | |
| Portfolio Turnover Rate | 188% |
| Total Advisory Fees Paid | $67,763 |
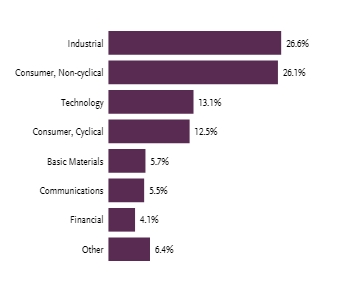
| Medpace Holdings, Inc. | |
| Halozyme Therapeutics, Inc. | |
| Celsius Holdings, Inc. | |
| Talen Energy Corp. | |
| Woodward, Inc. | |
| Hecla Mining Co. | |
| AeroVironment, Inc. | |
| EchoStar Corp. — Class A | |
| Five Below, Inc. | |
| Rambus, Inc. | |
| Top 10 Total |
1 | "Holdings Diversification (Market Exposure as a % of Net Assets)" excludes any temporary cash investments, investments in Guggenheim Strategy Funds Trust mutual funds, or investments in Guggenheim Ultra Short Duration Fund. |
2 | "10 Largest Holdings (as a % of Net Assets)" excludes any temporary cash or derivative investments. |
| Top 10 | % of Net Assets |
|---|---|
| Medpace Holdings, Inc. | |
| Halozyme Therapeutics, Inc. | |
| Celsius Holdings, Inc. | |
| Talen Energy Corp. | |
| Woodward, Inc. | |
| Hecla Mining Co. | |
| AeroVironment, Inc. | |
| EchoStar Corp. — Class A | |
| Five Below, Inc. | |
| Rambus, Inc. | |
| Top 10 Total |
2 | "10 Largest Holdings (as a % of Net Assets)" excludes any temporary cash or derivative investments. |
There were no material changes for the period.
There were no changes in or disagreements with fund accountants for the period.
| Class | Costs of a $10,000 Investment | Costs Paid as a % of a $10,000 Investment |
|---|---|---|
| Variable Annuity | $174 | 1.69% |
For the period of January 1, 2025 to December 31, 2025, the fund returned 6.12%, underperforming the fund's broad-based securities market index, the S&P 500 Index, which returned 17.88% for the same period and underperforming the fund's secondary index, the S&P MidCap 400 Pure Value Index, which returned 7.94% for the same period.
What factors materially affected the fund's performance over the last year?
The sectors that contributed the most to the return of the underlying index for the reporting period were materials, financials, and consumer discretionary. Those that detracted the most were health care, consumer staples, and real estate. The holdings that contributed the most to the return of the underlying index for the reporting period were United States Steel Corporation, HF Sinclair Corp., and Macy's, Inc. Those that detracted the most were Manpower Group, Inc., Perrigo Company plc, and Civitas Resources, Inc. The Fund maintained a daily correlation of over 99% to the S&P MidCap 400 Pure Value Index for the reporting period.
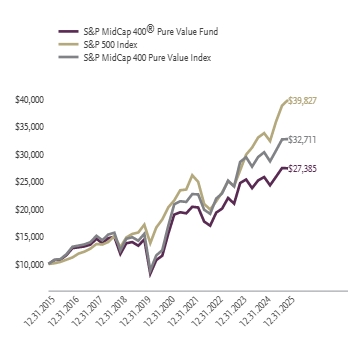
| One Year | Five Years | Ten Years | |
|---|---|---|---|
| S&P MidCap 400® Pure Value Fund | 6.12% | 12.00% | 10.60% |
| S&P 500 Index | 17.88% | 14.42% | 14.82% |
| S&P MidCap 400 Pure Value Index | 7.94% | 13.99% | 12.58% |
| Net Assets | $6,976,358 |
|---|---|
| Total Number of Portfolio Holdings | |
| Portfolio Turnover Rate | 247% |
| Total Advisory Fees Paid | $51,240 |
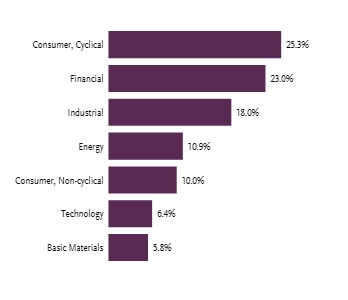
| Concentrix Corp. | |
| Avnet, Inc. | |
| Arrow Electronics, Inc. | |
| Brighthouse Financial, Inc. | |
| Lear Corp. | |
| Lithia Motors, Inc. — Class A | |
| PBF Energy, Inc. — Class A | |
| HF Sinclair Corp. | |
| Macy's, Inc. | |
| Civitas Resources, Inc. | |
| Top 10 Total |
1 | "Holdings Diversification (Market Exposure as a % of Net Assets)" excludes any temporary cash investments, investments in Guggenheim Strategy Funds Trust mutual funds, or investments in Guggenheim Ultra Short Duration Fund. |
2 | "10 Largest Holdings (as a % of Net Assets)" excludes any temporary cash or derivative investments. |
| Top 10 | % of Net Assets |
|---|---|
| Concentrix Corp. | |
| Avnet, Inc. | |
| Arrow Electronics, Inc. | |
| Brighthouse Financial, Inc. | |
| Lear Corp. | |
| Lithia Motors, Inc. — Class A | |
| PBF Energy, Inc. — Class A | |
| HF Sinclair Corp. | |
| Macy's, Inc. | |
| Civitas Resources, Inc. | |
| Top 10 Total |
2 | "10 Largest Holdings (as a % of Net Assets)" excludes any temporary cash or derivative investments. |
There were no material changes for the period.
There were no changes in or disagreements with fund accountants for the period.
| Class | Costs of a $10,000 Investment | Costs Paid as a % of a $10,000 Investment |
|---|---|---|
| Variable Annuity | $176 | 1.69% |
For the period of January 1, 2025 to December 31, 2025, the fund returned 8.59%, underperforming the fund's broad-based securities market index, the S&P 500 Index, which returned 17.88% for the same period and underperforming the fund's secondary index, the S&P SmallCap 600 Pure Growth Index, which returned 10.48% for the same period.
What factors materially affected the fund's performance over the last year?
The sectors that contributed the most to the return of the underlying index for the reporting period were health care, industrials, and financials. The sectors that detracted were energy, communication services, and consumer discretionary. The holdings that contributed the most to the return of the underlying index for the reporting period were Protagonist Therapeutics, Inc., Sterling Infrastructure, Inc., and InterDigital, Inc. Those that detracted the most were Sabre Corporation, Six Flags Entertainment Corp., and Atlas Energy Solutions, Inc. The Fund maintained a daily correlation of over 99% to the S&P 600 Pure Growth Index for the reporting period.
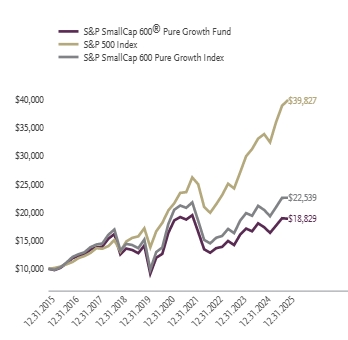
| One Year | Five Years | Ten Years | |
|---|---|---|---|
| S&P SmallCap 600® Pure Growth Fund | 8.59% | 2.89% | 6.53% |
| S&P 500 Index | 17.88% | 14.42% | 14.82% |
| S&P SmallCap 600 Pure Growth Index | 10.48% | 4.70% | 8.46% |
| Net Assets | $10,724,832 |
|---|---|
| Total Number of Portfolio Holdings | |
| Portfolio Turnover Rate | 315% |
| Total Advisory Fees Paid | $53,234 |
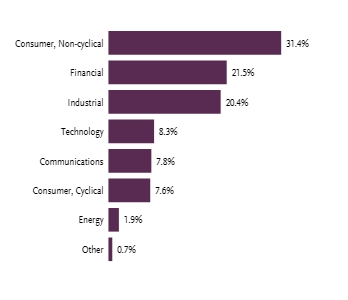
| PTC Therapeutics, Inc. | |
| Progyny, Inc. | |
| ACM Research, Inc. — Class A | |
| ARMOUR Residential, Inc. REIT | |
| ACADIA Pharmaceuticals, Inc. | |
| Arrowhead Pharmaceuticals, Inc. | |
| Protagonist Therapeutics, Inc. | |
| TransMedics Group, Inc. | |
| Adamas Trust, Inc. | |
| SiriusPoint Ltd. | |
| Top 10 Total |
1 | "Holdings Diversification (Market Exposure as a % of Net Assets)" excludes any temporary cash investments, investments in Guggenheim Strategy Funds Trust mutual funds, or investments in Guggenheim Ultra Short Duration Fund. |
2 | "10 Largest Holdings (as a % of Net Assets)" excludes any temporary cash or derivative investments. |
| Top 10 | % of Net Assets |
|---|---|
| PTC Therapeutics, Inc. | |
| Progyny, Inc. | |
| ACM Research, Inc. — Class A | |
| ARMOUR Residential, Inc. REIT | |
| ACADIA Pharmaceuticals, Inc. | |
| Arrowhead Pharmaceuticals, Inc. | |
| Protagonist Therapeutics, Inc. | |
| TransMedics Group, Inc. | |
| Adamas Trust, Inc. | |
| SiriusPoint Ltd. | |
| Top 10 Total |
2 | "10 Largest Holdings (as a % of Net Assets)" excludes any temporary cash or derivative investments. |
There were no material changes for the period.
There were no changes in or disagreements with fund accountants for the period.
| Class | Costs of a $10,000 Investment | Costs Paid as a % of a $10,000 Investment |
|---|---|---|
| Variable Annuity | $175 | 1.69% |
For the period of January 1, 2025 to December 31, 2025, the fund returned 6.77%, underperforming the fund's broad-based securities market index, the S&P 500 Index, which returned 17.88% for the same period and underperforming the fund's secondary index, the S&P SmallCap 600 Pure Value Index, which returned 8.76% for the same period.
What factors materially affected the fund's performance over the last year?
The sectors that contributed the most to the return of the underlying index for the reporting period were information technology, consumer discretionary, and financials. Those that detracted the most were health care, materials, and consumer staples. The holdings that contributed the most to the return of the underlying index for the reporting period were ViaSat, Inc., Par Pacific Holdings, Inc., and Enviri Corp. Those that detracted the most were Owens & Minor, Inc., Green Plains, Inc., and VitalEnergy, Inc. The Fund maintained a daily correlation of over 99% to the S&P SmallCap 600 Pure Value Index for the reporting period.
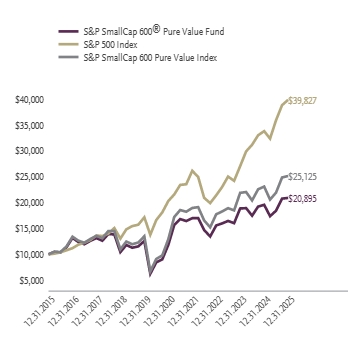
| One Year | Five Years | Ten Years | |
|---|---|---|---|
| S&P SmallCap 600® Pure Value Fund | 6.77% | 12.03% | 7.65% |
| S&P 500 Index | 17.88% | 14.42% | 14.82% |
| S&P SmallCap 600 Pure Value Index | 8.76% | 14.20% | 9.65% |
| Net Assets | $11,884,134 |
|---|---|
| Total Number of Portfolio Holdings | |
| Portfolio Turnover Rate | 253% |
| Total Advisory Fees Paid | $63,450 |
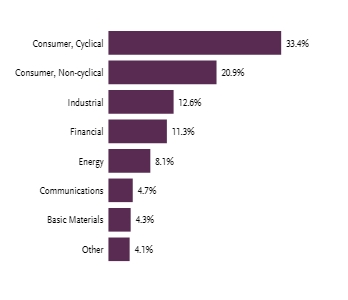
| ManpowerGroup, Inc. | |
| SunCoke Energy, Inc. | |
| DXC Technology Co. | |
| MillerKnoll, Inc. | |
| Newell Brands, Inc. | |
| Edgewell Personal Care Co. | |
| Kohl's Corp. | |
| MarineMax, Inc. | |
| Perrigo Company plc | |
| Winnebago Industries, Inc. | |
| Top 10 Total |
1 | "Holdings Diversification (Market Exposure as a % of Net Assets)" excludes any temporary cash investments, investments in Guggenheim Strategy Funds Trust mutual funds, or investments in Guggenheim Ultra Short Duration Fund. |
2 | "10 Largest Holdings (as a % of Net Assets)" excludes any temporary cash or derivative investments. |
| Top 10 | % of Net Assets |
|---|---|
| ManpowerGroup, Inc. | |
| SunCoke Energy, Inc. | |
| DXC Technology Co. | |
| MillerKnoll, Inc. | |
| Newell Brands, Inc. | |
| Edgewell Personal Care Co. | |
| Kohl's Corp. | |
| MarineMax, Inc. | |
| Perrigo Company plc | |
| Winnebago Industries, Inc. | |
| Top 10 Total |
2 | "10 Largest Holdings (as a % of Net Assets)" excludes any temporary cash or derivative investments. |
There were no material changes for the period.
There were no changes in or disagreements with fund accountants for the period.
| Class | Costs of a $10,000 Investment | Costs Paid as a % of a $10,000 Investment |
|---|---|---|
| Variable Annuity | $144 | 1.43% |
For the period of January 1, 2025 to December 31, 2025, the fund returned 1.67%, underperforming the fund's broad-based securities market index, the Bloomberg U.S. Aggregate Bond Index, which returned 7.30% for the same period and underperforming the fund's secondary index, the Bloomberg U.S. Treasury 30 Year Bellwether Index, which returned 3.73% for the same period.
What factors materially affected the fund's performance over the last year?
Despite periods of volatility during the year, long-term U.S. Treasury yields ended 2025 relatively close to where they began. Early year movements were influenced by tariff-related uncertainty and shifting expectations for Federal Reserve policy. Long-term yields reached their lows in April 2025 before moving higher through the middle of the year. In the second half of 2025, yields fluctuated, with volatility driven by mixed or missing economic data and evolving views on monetary policy easing. During the second half of the year, the U.S. Federal Reserve reduced its target rate three times, broadly in line with market expectations, citing risks to employment and a desire to support continued economic expansion.
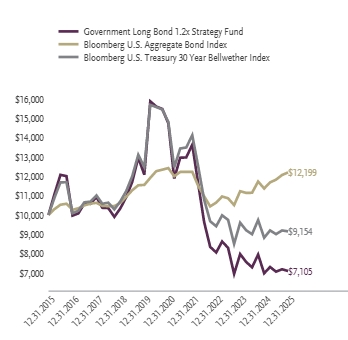
| One Year | Five Years | Ten Years | |
|---|---|---|---|
| Government Long Bond 1.2x Strategy Fund | 1.67% | -13.64% | -3.35% |
| Bloomberg U.S. Aggregate Bond Index | 7.30% | -0.36% | 2.01% |
| Bloomberg U.S. Treasury 30 Year Bellwether Index | 3.73% | -9.17% | -0.88% |
| Net Assets | $5,975,847 |
|---|---|
| Total Number of Portfolio Holdings | |
| Portfolio Turnover Rate | 8,524% |
| Total Advisory Fees Paid | $32,980 |
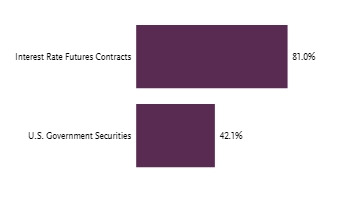
| U.S. Treasury Bonds | |
| Guggenheim Strategy Fund II | |
| Guggenheim Ultra Short Duration Fund — Institutional Class | |
| Total |
1 | "Holdings Diversification (Market Exposure as a % of Net Assets)" excludes any temporary cash investments, investments in Guggenheim Strategy Funds Trust mutual funds, or investments in Guggenheim Ultra Short Duration Fund. |
2 | "Largest Holdings (as a % of Net Assets)" excludes any temporary cash or derivative investments. |
| Top 10 | % of Net Assets |
|---|---|
| U.S. Treasury Bonds | |
| Guggenheim Strategy Fund II | |
| Guggenheim Ultra Short Duration Fund — Institutional Class | |
| Total |
2 | "Largest Holdings (as a % of Net Assets)" excludes any temporary cash or derivative investments. |
There were no material changes for the period.
There were no changes in or disagreements with fund accountants for the period.
| Class | Costs of a $10,000 Investment | Costs Paid as a % of a $10,000 Investment |
|---|---|---|
| Variable Annuity | $562 | 5.57% |
For the period of January 1, 2025 to December 31, 2025, the fund returned 1.85%, underperforming the fund's broad-based securities market index, the Bloomberg U.S. Aggregate Bond Index, which returned 7.30% for the same period and underperforming the fund's secondary index, the Bloomberg U.S. Treasury 30 Year Bellwether Index, which returned 3.73% for the same period.
What factors materially affected the fund's performance over the last year?
Despite periods of volatility during the year, long-term U.S. Treasury yields ended 2025 relatively close to where they began. Early year movements were influenced by tariff-related uncertainty and shifting expectations for Federal Reserve policy. Long-term yields reached their lows in April 2025 before moving higher through the middle of the year. In the second half of 2025, yields fluctuated, with volatility driven by mixed or missing economic data and evolving views on monetary policy easing. During the second half of the year, the Federal Reserve reduced its target rate three times, broadly in line with market expectations, citing risks to employment and a desire to support continued economic expansion.
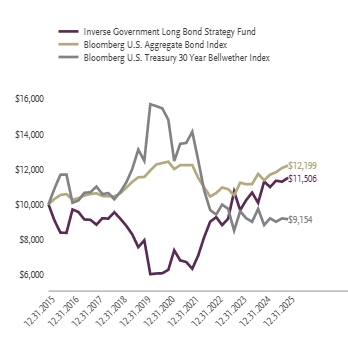
| One Year | Five Years | Ten Years | |
|---|---|---|---|
| Inverse Government Long Bond Strategy Fund | 1.85% | 12.87% | 1.41% |
| Bloomberg U.S. Aggregate Bond Index | 7.30% | -0.36% | 2.01% |
| Bloomberg U.S. Treasury 30 Year Bellwether Index | 3.73% | -9.17% | -0.88% |
| Net Assets | $1,389,578 |
|---|---|
| Total Number of Portfolio Holdings | |
| Portfolio Turnover Rate | 994% |
| Total Advisory Fees Paid | $16,766 |
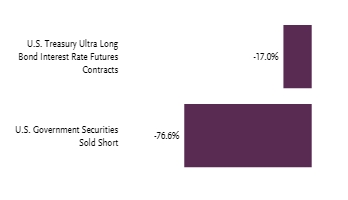
| Guggenheim Ultra Short Duration Fund — Institutional Class | |
| Guggenheim Strategy Fund II | |
| Total |
1 | "Holdings Diversification (Market Exposure as a % of Net Assets)" excludes any temporary cash investments, investments in Guggenheim Strategy Funds Trust mutual funds, or investments in Guggenheim Ultra Short Duration Fund. |
2 | "Largest Holdings (as a % of Net Assets)" excludes any temporary cash or derivative investments. |
| Top 10 | % of Net Assets |
|---|---|
| Guggenheim Ultra Short Duration Fund — Institutional Class | |
| Guggenheim Strategy Fund II | |
| Total |
2 | "Largest Holdings (as a % of Net Assets)" excludes any temporary cash or derivative investments. |
This is a summary of certain changes to the fund since December 31, 2024. For more complete information, you may review the fund's next prospectus, which we expect to be available by May 1, 2026 at GuggenheimInvestments.com/variable-insurance-funds or, by contacting 800 820 0888 or services@guggenheiminvestments.com.
The fund's net expense ratio, which reflects expense waivers and reimbursements and includes interest expense on short sales, was 5.57% for the year ended December 31, 2025, an increase of 0.57% compared to the prior year. The primary driver of the increase was an increase in interest expense on short sales during the reporting period.
There were no changes in or disagreements with fund accountants for the period.
| Class | Costs of a $10,000 Investment | Costs Paid as a % of a $10,000 Investment |
|---|---|---|
| Variable Annuity | $175 | 1.67% |
For the period of January 1, 2025 to December 31, 2025, the fund returned 9.87%, outperforming the fund's broad-based securities market index, the Bloomberg U.S. Aggregate Bond Index, which returned 7.30% for the same period and outperforming the fund's secondary index, the Bloomberg U.S. Corporate High Yield Index, which returned 8.62% for the same period.
What factors materially affected the fund's performance over the last year?
High yield continued to generate positive returns for the reporting period. In the first half of 2025, the high yield market experienced volatility due to tariffs and trade negotiations. Markets quickly rebounded from the initial shock as concerns subsided and generated positive absolute returns for the remainder of the year. All sectors contributed positively to the Bloomberg U.S. Corporate High Yield Index (the "Secondary Index") with notable positive contribution from communications and consumer discretionary. On the ratings side, BB-rated holdings led contribution to returns of the Secondary Index.
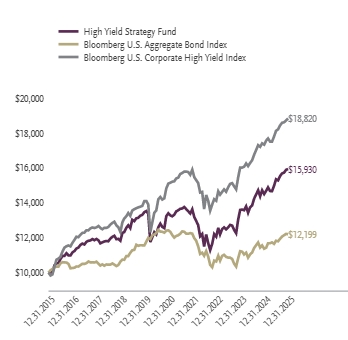
| One Year | Five Years | Ten Years | |
|---|---|---|---|
| High Yield Strategy Fund | 9.87% | 3.52% | 4.77% |
| Bloomberg U.S. Aggregate Bond Index | 7.30% | -0.36% | 2.01% |
| Bloomberg U.S. Corporate High Yield Index | 8.62% | 4.51% | 6.53% |
| Net Assets | $7,194,102 |
|---|---|
| Total Number of Portfolio Holdings | |
| Portfolio Turnover Rate | 0% |
| Total Advisory Fees Paid | $47,319 |
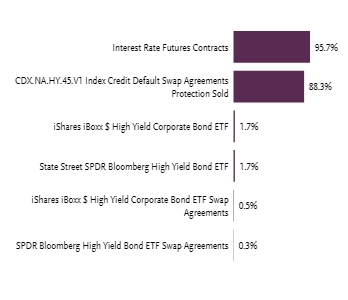
| Guggenheim Ultra Short Duration Fund — Institutional Class | |
| Guggenheim Strategy Fund II | |
| iShares iBoxx $ High Yield Corporate Bond ETF | |
| State Street SPDR Bloomberg High Yield Bond ETF | |
| Total |
1 | "Holdings Diversification (Market Exposure as a % of Net Assets)" excludes any temporary cash investments, investments in Guggenheim Strategy Funds Trust mutual funds, or investments in Guggenheim Ultra Short Duration Fund. The Fund's target exposure is achieved through a combination of total return swaps, credit default swaps, and interest rate futures contracts. |
2 | "Largest Holdings (as a % of Net Assets)" excludes any temporary cash or derivative investments. |
| Top 10 | % of Net Assets |
|---|---|
| Guggenheim Ultra Short Duration Fund — Institutional Class | |
| Guggenheim Strategy Fund II | |
| iShares iBoxx $ High Yield Corporate Bond ETF | |
| State Street SPDR Bloomberg High Yield Bond ETF | |
| Total |
2 | "Largest Holdings (as a % of Net Assets)" excludes any temporary cash or derivative investments. |
There were no material changes for the period.
There were no changes in or disagreements with fund accountants for the period.
| Class | Costs of a $10,000 Investment | Costs Paid as a % of a $10,000 Investment |
|---|---|---|
| Variable Annuity | $203 | 1.72% |
For the period of January 1, 2025 to December 31, 2025, the fund returned 36.46%, outperforming the fund's broad-based securities market index, the MSCI World ex US Index, which returned 28.59% for the same period and outperforming the fund's secondary index, the STOXX Europe 50 Index, which returned 33.10% for the same period.
What factors materially affected the fund's performance over the last year?
The sectors that contributed the most to the return of the underlying index for the reporting period were financials, industrials, and health care. There were no sectors that detracted from performance. The holdings that contributed the most to the return of the underlying index for the Reporting Period were ASML Holding NV— Class G, HSBC Holdings plc ADR, Banco Santander S.A. ADR. Those that detracted the most were Novo Nordisk A/S ADR, Diageo plc ADR, and Rheinmetall AG ADR. The Fund maintained a daily correlation of over 98% to its benchmark of 125% of the daily price movement of the STOXX Europe 50 Index.
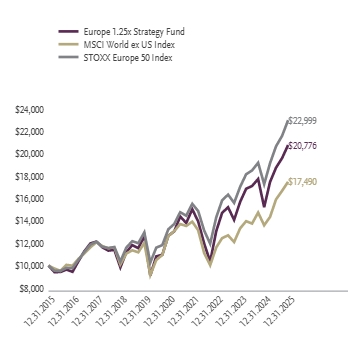
| One Year | Five Years | Ten Years | |
|---|---|---|---|
| Europe 1.25x Strategy Fund | 36.46% | 10.40% | 7.59% |
| MSCI World ex US Index | 28.59% | 6.70% | 5.75% |
| STOXX Europe 50 Index | 33.10% | 11.66% | 8.69% |
| Net Assets | $2,719,477 |
|---|---|
| Total Number of Portfolio Holdings | |
| Portfolio Turnover Rate | 467% |
| Total Advisory Fees Paid | $17,983 |
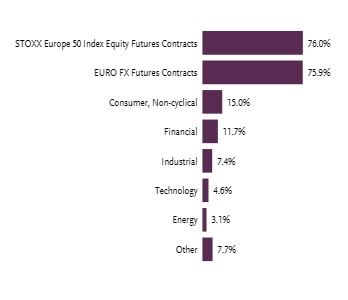
| United States | |
| France | |
| United Kingdom | |
| Switzerland | |
| Germany | |
| Netherlands | |
| Spain | |
| Other | |
| Total Investments |
| Guggenheim Strategy Fund II | |
| Guggenheim Ultra Short Duration Fund — Institutional Class | |
| ASML Holding N.V. — Class G | |
| Roche Holding AG ADR | |
| AstraZeneca plc ADR | |
| HSBC Holdings plc ADR | |
| Novartis AG ADR | |
| Nestle S.A. ADR | |
| SAP SE ADR | |
| Shell plc ADR | |
| Top 10 Total |
1 | "Holdings Diversification (Market Exposure as a % of Net Assets)" excludes any temporary cash investments, investments in Guggenheim Strategy Funds Trust mutual funds, or investments in Guggenheim Ultra Short Duration Fund. The fund's target exposure is achieved through a combination of equity futures contracts and currency futures contracts. |
2 | "10 Largest Holdings (as a % of Net Assets)" excludes any temporary cash or derivative investments. |
3 | Country Diversification (% of Total Investments) includes temporary cash investments. |
| Top 10 | % of Net Assets |
|---|---|
| Guggenheim Strategy Fund II | |
| Guggenheim Ultra Short Duration Fund — Institutional Class | |
| ASML Holding N.V. — Class G | |
| Roche Holding AG ADR | |
| AstraZeneca plc ADR | |
| HSBC Holdings plc ADR | |
| Novartis AG ADR | |
| Nestle S.A. ADR | |
| SAP SE ADR | |
| Shell plc ADR | |
| Top 10 Total |
2 | "10 Largest Holdings (as a % of Net Assets)" excludes any temporary cash or derivative investments. |
3 | Country Diversification (% of Total Investments) includes temporary cash investments. |
There were no material changes for the period.
There were no changes in or disagreements with fund accountants for the period.
| Class | Costs of a $10,000 Investment | Costs Paid as a % of a $10,000 Investment |
|---|---|---|
| Variable Annuity | $211 | 1.68% |
For the period of January 1, 2025 to December 31, 2025, the fund returned 51.54%, outperforming the fund's broad-based securities market index, the MSCI World ex US Index, which returned 28.59% for the same period and outperforming the fund's secondary index, the Nikkei-225 Stock Average Index, which returned 26.84% for the same period.
What factors materially affected the fund's performance over the last year?
The sectors that contributed the most to the return of the underlying index for the reporting period were information technology, communication services, and industrials. There were no sectors that detracted from performance. The holdings that contributed the most to the return of the underlying index were Advantest Corp., SoftBank Group Corp., and Tokyo Electron, Ltd. Those that detracted the most were Recruit Holdings Co., Ltd, Terumo Corporation, Daiichi Sankyo Company, Ltd. The Fund maintained a daily correlation of over 99% to its benchmark of 200% of the daily price movement of the fair value of the Nikkei-225 Stock Average Index.
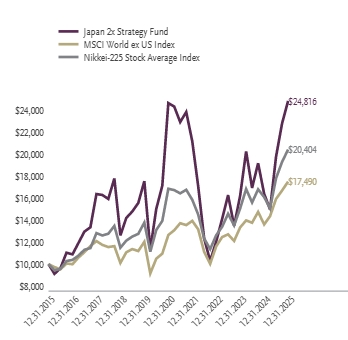
| One Year | Five Years | Ten Years | |
|---|---|---|---|
| Japan 2x Strategy Fund | 51.54% | 0.16% | 9.51% |
| MSCI World ex US Index | 28.59% | 6.70% | 5.75% |
| Nikkei-225 Stock Average Index | 26.84% | 3.91% | 7.39% |
| Net Assets | $1,684,625 |
|---|---|
| Total Number of Portfolio Holdings | |
| Portfolio Turnover Rate | 0% |
| Total Advisory Fees Paid | $10,264 |
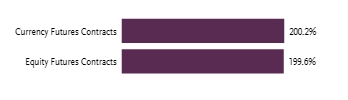
1 | "Holdings Diversification (Market Exposure as a % of Net Assets)" excludes any temporary cash investments, investments in Guggenheim Strategy Funds Trust mutual funds, or investments in Guggenheim Ultra Short Duration Fund. The Fund's target exposure is achieved through a combination of equity futures contracts and currency futures contracts. |
There were no material changes for the period.
There were no changes in or disagreements with fund accountants for the period.
| Class | Costs of a $10,000 Investment | Costs Paid as a % of a $10,000 Investment |
|---|---|---|
| Variable Annuity | $189 | 2.04% |
For the period of January 1, 2025 to December 31, 2025, the fund returned -14.29%, underperforming the fund's broad-based securities market index, the Bloomberg U.S. Aggregate Bond Index, which returned 7.30% for the same period and underperforming the fund's secondary index, the U.S. Dollar Index, which returned -9.37% for the same period.
What factors materially affected the fund's performance over the last year?
There were no components that contributed to the return of the underlying index for the reporting period. The euro, British pound, and Swedish krona were the components that detracted the most from the DXY during 2025. The Fund maintained a daily correlation of over 99% to its benchmark of 200% of the daily price movement of the U.S. Dollar Index.
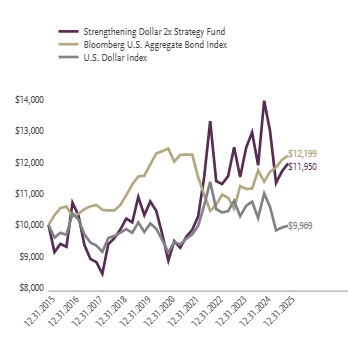
| One Year | Five Years | Ten Years | |
|---|---|---|---|
| Strengthening Dollar 2x Strategy Fund | -14.29% | 6.16% | 1.80% |
| Bloomberg U.S. Aggregate Bond Index | 7.30% | -0.36% | 2.01% |
| U.S. Dollar Index | -9.37% | 1.80% | -0.03% |
| Net Assets | $1,166,586 |
|---|---|
| Total Number of Portfolio Holdings | |
| Portfolio Turnover Rate | 0% |
| Total Advisory Fees Paid | $14,723 |
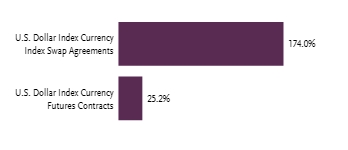
1 | "Holdings Diversification (Market Exposure as a % of Net Assets)" excludes any temporary cash investments, investments in Guggenheim Strategy Funds Trust mutual funds, or investments in Guggenheim Ultra Short Duration Fund. |
There were no material changes for the period.
There were no changes in or disagreements with fund accountants for the period.
| Class | Costs of a $10,000 Investment | Costs Paid as a % of a $10,000 Investment |
|---|---|---|
| Variable Annuity | $223 | 2.04% |
For the period of January 1, 2025 to December 31, 2025, the fund returned 18.97%, outperforming the fund's broad-based securities market index, the Bloomberg U.S. Aggregate Bond Index, which returned 7.30% for the same period and outperforming the fund's secondary index, the U.S. Dollar Index, which returned -9.37% for the same period.
What factors materially affected the fund's performance over the last year?
There were no components that contributed to the return of the underlying index for the reporting period. The euro, British pound, and Swedish krona were the components that detracted the most from the DXY during 2025. The Fund maintained a daily correlation of over 99% to its benchmark of -200% of the daily price movement of the U.S. Dollar Index.
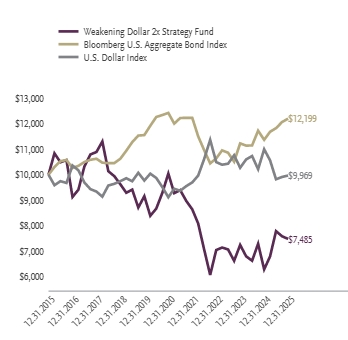
| One Year | Five Years | Ten Years | |
|---|---|---|---|
| Weakening Dollar 2x Strategy Fund | 18.97% | -5.72% | -2.86% |
| Bloomberg U.S. Aggregate Bond Index | 7.30% | -0.36% | 2.01% |
| U.S. Dollar Index | -9.37% | 1.80% | -0.03% |
| Net Assets | $377,783 |
|---|---|
| Total Number of Portfolio Holdings | |
| Portfolio Turnover Rate | 0% |
| Total Advisory Fees Paid | $5,438 |
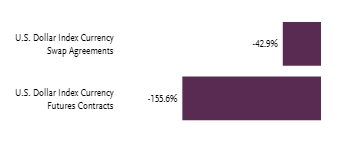
1 | "Holdings Diversification (Market Exposure as a % of Net Assets)" excludes any temporary cash investments, investments in Guggenheim Strategy Funds Trust mutual funds, or investments in Guggenheim Ultra Short Duration Fund. |
There were no material changes for the period.
There were no changes in or disagreements with fund accountants for the period.
| Class | Costs of a $10,000 Investment | Costs Paid as a % of a $10,000 Investment |
|---|---|---|
| Variable Annuity | $166 | 1.62% |
For the period of January 1, 2025 to December 31, 2025, the fund returned 4.89%, underperforming the fund's broad-based securities market index, the S&P 500 Index, which returned 17.88% for the same period and underperforming the fund's secondary index, the S&P Goldman Sachs Commodity Index, which returned 7.12% for the same period.
What factors materially affected the fund's performance over the last year?
The fund obtained exposure to the commodities markets through futures on the S&P Goldman Sachs Commodity Index (the "Secondary Index"). During the reporting period, the industrial metals and precious metals sectors had some of the strongest returns. 14 of the 24 Secondary Index components had positive returns during the reporting period. The components of the Secondary Index with some of the largest positive returns were silver, gold and copper. The components of the Secondary Index with some of the largest negative returns were cocoa, natural gas, and wheat.
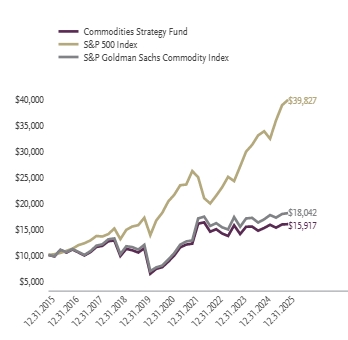
| One Year | Five Years | Ten Years | |
|---|---|---|---|
| Commodities Strategy Fund | 4.89% | 12.80% | 4.76% |
| S&P 500 Index | 17.88% | 14.42% | 14.82% |
| S&P Goldman Sachs Commodity Index | 7.12% | 14.65% | 6.08% |
| Net Assets | $4,449,784 |
|---|---|
| Total Number of Portfolio Holdings | |
| Portfolio Turnover Rate | 0% |
| Total Advisory Fees Paid | $38,218 |
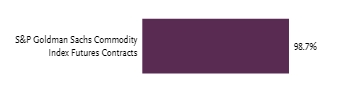
| Guggenheim Ultra Short Duration Fund — Institutional Class | |
| Guggenheim Strategy Fund II | |
| Total |
1 | "Consolidated Holdings Diversification (Market Exposure as a % of Net Assets)" excludes any temporary cash investments, investments in Guggenheim Strategy Funds Trust mutual funds, or investments in Guggenheim Ultra Short Duration Fund. |
2 | "Largest Holdings (as a % of Net Assets)" excludes any temporary cash or derivative investments. |
| Top 10 | % of Net Assets |
|---|---|
| Guggenheim Ultra Short Duration Fund — Institutional Class | |
| Guggenheim Strategy Fund II | |
| Total |
2 | "Largest Holdings (as a % of Net Assets)" excludes any temporary cash or derivative investments. |
There were no material changes for the period.
There were no changes in or disagreements with fund accountants for the period.
| Class | Costs of a $10,000 Investment | Costs Paid as a % of a $10,000 Investment |
|---|---|---|
| Variable Annuity | $210 | 2.06% |
For the period of January 1, 2025 to December 31, 2025, the fund returned 3.65%, underperforming the fund's broad-based securities market index, the S&P 500 Index, which returned 17.88% for the same period and underperforming the fund's secondary index, the ICE BofA 3-Month U.S. Treasury Bill Index, which returned 4.21% for the same period.
What factors materially affected the fund's performance over the last year?
In 2025, futures markets were defined by pronounced macro regime shifts, producing a mixed but ultimately constructive environment for systematic trend following. Commodities were the standout sector: precious metals, particularly gold, exhibited strong, persistent upside trends driven by central bank demand and geopolitical hedging, while industrial metals trended more clearly later in the year; energy markets remained comparatively range-bound. In currencies, broad U.S. Dollar weakness supported durable trends across several G10 pairs, though intermittent volatility led to whipsaws. Equity Index futures saw sharp downturns early in the year followed by a sustained risk-on rally, rewarding medium- to longer-term trend models. Bond futures were marked by choppy transitions around monetary-policy inflection points. Overall, 2025 highlighted the importance of cross-asset diversification, adaptive risk management, and patience through regime shifts.
The fund recorded three consecutive positive quarters following a negative first quarter in 2025. Q1 losses were broad-based, led by currencies and fixed income amid a difficult trend environment. Q2 saw a recovery driven by equities, with commodities and currencies contributing modestly while fixed income remained weak. Q3 was the strongest quarter, dominated by equity gains with additional support from commodities, while currencies and fixed income detracted. Q4 extended the equity-led pattern, with commodities essentially flat and modest headwinds from currencies and fixed income. For the year overall, equities were the primary driver of performance, with support from commodities, while currencies and fixed income were persistent drags, particularly in the early part of the year.
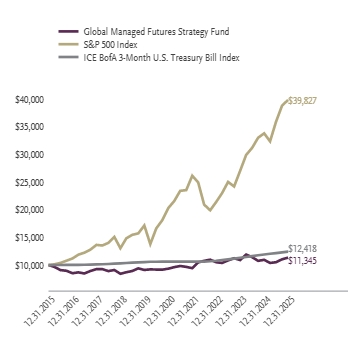
| One Year | Five Years | Ten Years | |
|---|---|---|---|
| Global Managed Futures Strategy Fund | 3.65% | 3.94% | 1.27% |
| S&P 500 Index | 17.88% | 14.42% | 14.82% |
| ICE BofA 3-Month U.S. Treasury Bill Index | 4.21% | 3.19% | 2.19% |
| Net Assets | $12,344,879 |
|---|---|
| Total Number of Portfolio Holdings | |
| Portfolio Turnover Rate | 0% |
| Total Advisory Fees Paid | $102,720 |
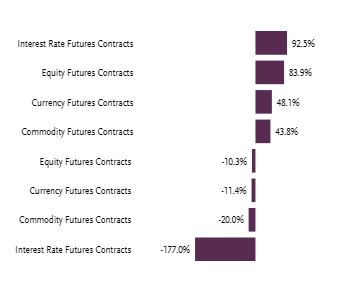
| Guggenheim Variable Insurance Strategy Fund III | |
| Guggenheim Strategy Fund III | |
| Guggenheim Strategy Fund II | |
| Guggenheim Ultra Short Duration Fund — Institutional Class | |
| Total |
1 | "Consolidated Holdings Diversification (Market Exposure as a % of Net Assets)" excludes any temporary cash investments, investments in Guggenheim Strategy Funds Trust mutual funds, or investments in Guggenheim Ultra Short Duration Fund. |
2 | "Largest Holdings (as a % of Net Assets)" excludes any temporary cash or derivative investments. |
| Top 10 | % of Net Assets |
|---|---|
| Guggenheim Variable Insurance Strategy Fund III | |
| Guggenheim Strategy Fund III | |
| Guggenheim Strategy Fund II | |
| Guggenheim Ultra Short Duration Fund — Institutional Class | |
| Total |
2 | "Largest Holdings (as a % of Net Assets)" excludes any temporary cash or derivative investments. |
There were no material changes for the period.
There were no changes in or disagreements with fund accountants for the period.
| Class | Costs of a $10,000 Investment | Costs Paid as a % of a $10,000 Investment |
|---|---|---|
| Variable Annuity | $159 | 1.58% |
For the period of January 1, 2025 to December 31, 2025, the fund returned 1.25%, underperforming the fund's broad-based securities market index, the S&P 500 Index, which returned 17.88% for the same period and underperforming the fund's secondary index, the HFRX Global Hedge Fund Index, which returned 7.13% for the same period.
What factors materially affected the fund's performance over the last year?
The fund's merger arbitrage strategy was the largest positive contributor of the year as several notable deals closed (e.g. Capital One Financial Corp. / Discover, UMB Financial Corp. / Harland Financial, and Chevron Corp. / Hess). The long/short equity strategy, driven by a fundamental tilt toward value and industry tilts (long technology and capital goods, short REITs and Materials), proved to be the second largest contributor for the year. Closed-end fund arbitrage also made modest positive contributions as underlying fund discounts narrowed. The fund's global macro strategies were a net detractor during the reporting period as positive contributions from flow (driven primarily by fixed income) did not make up for poor performance in value (primarily commodities and currency) and momentum (hurt by equities and currency). Flow strategies take positions based on expected capital flows in markets which are determined through economic theory or statistical observation of market behavior. Momentum is a systematic trend-following strategy that seeks to capture momentum premia in futures markets. Carry strategies seek to capture inefficiencies in the futures curves of different markets and asset classes including commodities, fixed income, and implied volatility. Value premia strategies take positions based on expected future prices in markets as derived from economic and/or non-price data and include strategies applied to commodities, currencies, and fixed income. A market neutral strategy attempts to profit whether the market is going up or down.
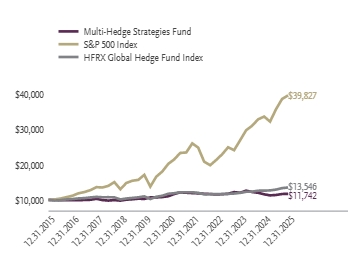
| One Year | Five Years | Ten Years | |
|---|---|---|---|
| Multi-Hedge Strategies Fund | 1.25% | 1.23% | 1.62% |
| S&P 500 Index | 17.88% | 14.42% | 14.82% |
| HFRX Global Hedge Fund Index | 7.13% | 2.87% | 3.08% |
| Net Assets | $25,818,317 |
|---|---|
| Total Number of Portfolio Holdings | |
| Portfolio Turnover Rate | 163% |
| Total Advisory Fees Paid | $314,620 |
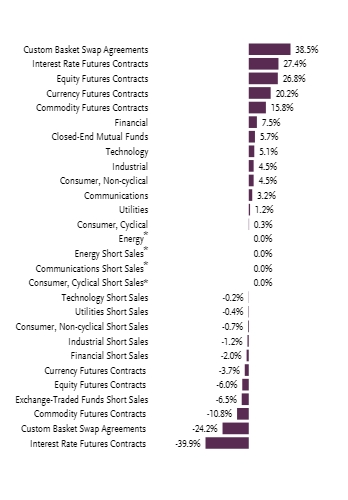
| Guggenheim Strategy Fund III | |
| Guggenheim Variable Insurance Strategy Fund III | |
| Guggenheim Strategy Fund II | |
| Guggenheim Ultra Short Duration Fund — Institutional Class | |
| Chart Industries, Inc. | |
| Frontier Communications Parent, Inc. | |
| ProAssurance Corp. | |
| International Money Express, Inc. | |
| Janus Henderson Group plc | |
| Dynavax Technologies Corp. | |
| Top 10 Total |
* | Less than 0.1% |
1 | "Consolidated Holdings Diversification (Market Exposure as a % of Net Assets)" excludes any temporary cash investments, investments in Guggenheim Strategy Funds Trust mutual funds, or investments in Guggenheim Ultra Short Duration Fund. |
2 | "10 Largest Holdings (as a % of Net Assets)" excludes any temporary cash or derivative investments. |
| Top 10 | % of Net Assets |
|---|---|
| Guggenheim Strategy Fund III | |
| Guggenheim Variable Insurance Strategy Fund III | |
| Guggenheim Strategy Fund II | |
| Guggenheim Ultra Short Duration Fund — Institutional Class | |
| Chart Industries, Inc. | |
| Frontier Communications Parent, Inc. | |
| ProAssurance Corp. | |
| International Money Express, Inc. | |
| Janus Henderson Group plc | |
| Dynavax Technologies Corp. | |
| Top 10 Total |
2 | "10 Largest Holdings (as a % of Net Assets)" excludes any temporary cash or derivative investments. |
There were no material changes for the period.
There were no changes in or disagreements with fund accountants for the period.
| Class | Costs of a $10,000 Investment | Costs Paid as a % of a $10,000 Investment |
|---|---|---|
| Variable Annuity | $151 | 1.49% |
For the period of January 1, 2025 to December 31, 2025, the fund returned 2.84%.
What factors materially affected the fund's performance over the last year?
During the reporting period, the U.S. Federal Open Market Committee lowered the federal funds target range by 75 basis points (one basis point is equal to 0.01%) as job growth moderated while inflation remained above the Federal Reserve's target. In the first half of 2025, resilient economic data tempered rate-cut expectations and supported elevated short-term yields. As the year progressed, uncertainty related to employment, tariffs and fiscal policy contributed to a shift toward a more accommodative policy stance. By the end of the reporting period, markets were pricing two 25-basis-point cuts in 2026, potentially pointing to a gradual normalization of short-term rates.
| One Year | Five Years | Ten Years | |
|---|---|---|---|
| U.S. Government Money Market Fund | 2.84% | 2.22% | 1.26% |
| Net Assets | $44,333,149 |
|---|---|
| Total Number of Portfolio Holdings | |
| Total Advisory Fees Paid | $230,089 |
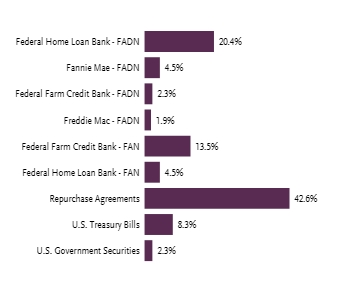
FADN - Federal Agency Discount Note
FAN - Federal Agency Note
There were no material changes for the period.
There were no changes in or disagreements with fund accountants for the period.