Shareholder Report
Dec. 31, 2025
USD ($)
Holding
This report describes changes to the Fund that occurred during the reporting period.
What were the Fund costs for the last year? (based on a hypothetical $10,000 investment)
| Cost of a $10,000 investment |
Costs paid as a percentage of $10,000 investment* | |||
| Nuveen Life Growth Equity Fund |
$56 | 0.52% | ||
* Annualized for period less than one year.
How did the Fund perform last year? What affected the Fund’s performance?
| Performance Highlights • The Nuveen Life Growth Equity Fund returned 15.30% at net asset value (NAV) for the 12 months ended December 31, 2025. The Fund underperformed the Russell 1000 Growth Index, which returned 18.56%. • Top contributors to relative performance • An overweight to Alphabet Inc. • Security selection in the industrials sector, led by an overweight to Vertiv Holdings Co. and an underweight to Uber Technologies, Inc. • An out‑of‑benchmark position in Galderma Group AG. • Top detractors from relative performance • Security selection in the information technology sector, including underweights to Palantir Technologies Inc. and NVIDIA Corporation, an overweight to Salesforce, Inc. and a lack of exposure to Lam Research Corporation. • Security selection in the health care sector, including an overweight to UnitedHealth Group Incorporated and an underweight to Eli Lilly and Company. • An overweight to Amazon.com, Inc. |
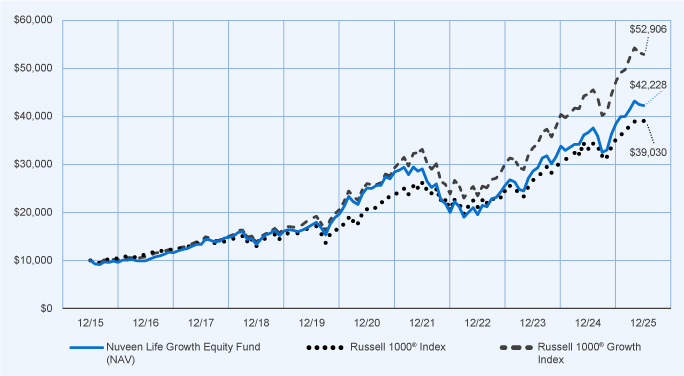
Average Annual Total Returns
| 1‑Year | 5‑Year | 10‑Year | ||||
| Nuveen Life Growth Equity Fund at NAV |
15.30% | 11.03% | 15.49% | |||
| Russell 1000® Index |
17.37% | 13.59% | 14.59% | |||
| Russell 1000® Growth Index |
18.56% | 15.32% | 18.13% | |||
Fund Statistics (as of December 31, 2025)
| Fund net assets |
$201,083,664 | |||
| Total number of portfolio holdings |
68 | |||
| Portfolio turnover (%) |
41% | |||
| Total management fees paid for the year |
$ 850,344 | |||
How has the Fund changed?
For more complete information, you may review the Fund’s next prospectus, which is expected to be available by May 1, 2026 at https://www.tiaa.org/public/prospectuses/ or upon request at (800) 842‑2252.
For more complete information, you may review the Fund’s next prospectus, which is expected to be available by May 1, 2026 at https://www.tiaa.org/public/prospectuses/ or upon request at (800) 842‑2252.
This report describes changes to the Fund that occurred during the reporting period.
What were the Fund costs for the last year? (based on a hypothetical $10,000 investment)
| Cost of a $10,000 investment |
Costs paid as a percentage of $10,000 investment* | |||
| Nuveen Life Money Market Fund |
$15 | 0.15% | ||
* Annualized for period less than one year.
Fund Statistics (as of December 31, 2025)
| Fund net assets |
$ | 141,331,971 | ||
| Total number of portfolio holdings |
62 | |||
| Portfolio turnover (%) |
0% | |||
| Total management fees paid for the year |
$ | 144,279 | ||
How has the Fund changed?
For more complete information, you may review the Fund’s next prospectus, which is expected to be available by May 1, 2026 at https://www.tiaa.org/public/prospectuses/ or upon request at (800) 842‑2252.
For more complete information, you may review the Fund’s next prospectus, which is expected to be available by May 1, 2026 at https://www.tiaa.org/public/prospectuses/ or upon request at (800) 842‑2252.
This report describes changes to the Fund that occurred during the reporting period.
What were the Fund costs for the last year? (based on a hypothetical $10,000 investment)
| Cost of a $10,000 investment |
Costs paid as a percentage of $10,000 investment* | |||
| Nuveen Life Core Equity Fund |
$55 | 0.51% | ||
* Annualized for period less than one year.
How did the Fund perform last year? What affected the Fund’s performance?
| Performance Highlights • The Nuveen Life Core Equity Fund returned 13.80% at net asset value (NAV) for the 12 months ended December 31, 2025. The Fund significantly underperformed the S&P 500 Index, which returned 17.88%. • Top contributors to relative performance • An overweight to Lam Research Corporation. • An overweight to Bank of New York Mellon Corporation. • An overweight to HCA Healthcare, Inc. • Top detractors from relative performance • Security selection in the information technology sector, including overweights to Intuit Inc., Arista Networks, Inc. and Gen Digital Inc. • An overweight position and security selection in the health care sector, including overweights to Eli Lilly and Company and Merck & Co., Inc. • Security selection in the financials sector, including an overweight to Progressive Corporation. • An overweight to Freeport-McMoRan, Inc. |
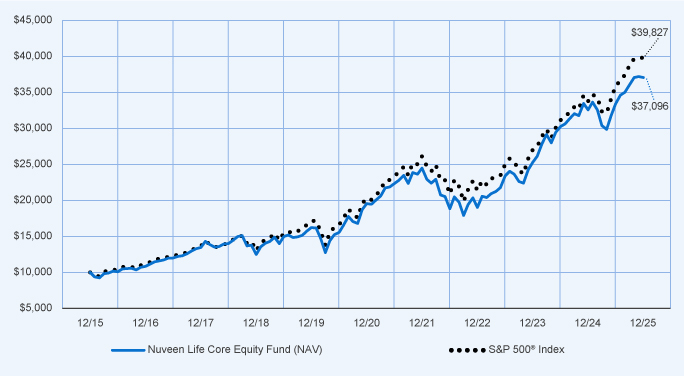
Average Annual Total Returns
| 1‑Year | 5‑Year | 10‑Year | ||||
| Nuveen Life Core Equity Fund at NAV |
13.80% | 13.66% | 14.01% | |||
| S&P 500® Index |
17.88% | 14.42% | 14.82% | |||
Fund Statistics (as of December 31, 2025)
| Fund net assets |
$ | 221,475,684 | ||
| Total number of portfolio holdings |
60 | |||
| Portfolio turnover (%) |
103% | |||
| Total management fees paid for the year |
$ | 951,973 | ||
How has the Fund changed?
For more complete information, you may review the Fund’s next prospectus, which is expected to be available by May 1, 2026 at https://www.tiaa.org/public/prospectuses/ or upon request at (800) 842‑2252.
For more complete information, you may review the Fund’s next prospectus, which is expected to be available by May 1, 2026 at https://www.tiaa.org/public/prospectuses/ or upon request at (800) 842‑2252.
This report describes changes to the Fund that occurred during the reporting period.
What were the Fund costs for the last year? (based on a hypothetical $10,000 investment)
| Cost of a $10,000 investment |
Costs paid as a percentage of $10,000 investment* | |||
| Nuveen Life International Equity Fund |
$70 | 0.60% | ||
* Annualized for period less than one year.
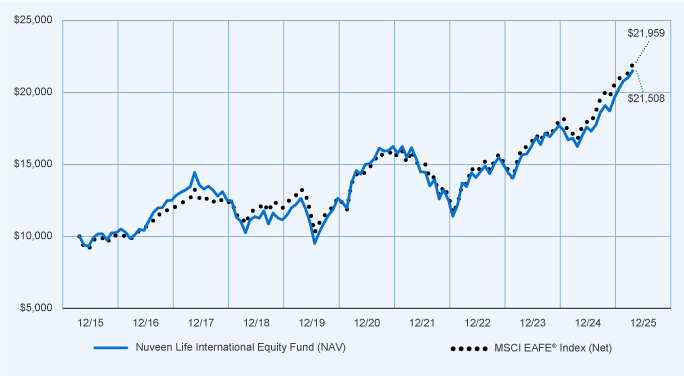
How did the Fund perform last year? What affected the Fund’s performance?
| Performance Highlights • The Nuveen Life International Equity Fund returned 32.44% at net asset value (NAV) for the 12 months ended December 31, 2025. The Fund outperformed the MSCI EAFE Index (Net), which returned 31.22%. • Top contributors to relative performance • Security selection in the financials sector, led by overweights to Banco Bilbao Vizcaya Argentaria, S.A., Banco Santander, S.A. and ING Groep N.V. • Security selection in the information technology sector, led by an out-of-benchmark position in Samsung Electronics Co., Ltd. and an overweight to Advantest Corporation. • An overweight to Heidelberg Materials AG. • Top detractors from relative performance • Security selection and an overweight allocation in the health care sector, including overweights to Novo Nordisk A/S and Daiichi Sankyo Company, Limited. • An out-of-benchmark position in Smurfit WestRock Plc. • Security selection in the industrials sector, including a lack of exposure to Rolls-Royce Holdings plc and Siemens Energy AG. |
Average Annual Total Returns
| 1-Year | 5-Year | 10-Year | ||||||||||
| Nuveen Life International Equity Fund at NAV |
32.44 | % | 8.09 | % | 7.96 | % | ||||||
| MSCI EAFE® Index |
31.22 | % | 8.92 | % | 8.18 | % | ||||||
Fund Statistics (as of December 31, 2025)
| Fund net assets |
$ | 187,532,768 | ||
| Total number of portfolio holdings |
70 | |||
| Portfolio turnover (%) |
23% | |||
| Total management fees paid for the year |
$ | 835,587 | ||
How has the Fund changed?
For more complete information, you may review the Fund’s next prospectus, which is expected to be available by May 1, 2026 at https://www.tiaa.org/public/prospectuses/ or upon request at (800) 842-2252.
For more complete information, you may review the Fund’s next prospectus, which is expected to be available by May 1, 2026 at https://www.tiaa.org/public/prospectuses/ or upon request at (800) 842-2252.
This report describes changes to the Fund that occurred during the reporting period.
What were the Fund costs for the last year? (based on a hypothetical $10,000 investment)
| Cost of a $10,000 investment |
Costs paid as a percentage of $10,000 investment* | |||
| Nuveen Life Large Cap Value Fund |
$56 | 0.52% | ||
* Annualized for period less than one year.
How did the Fund perform last year? What affected the Fund’s performance?
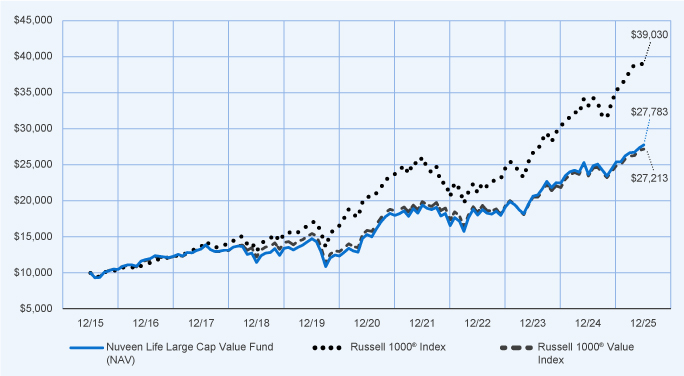
| Performance Highlights • The Nuveen Life Large Cap Value Fund returned 17.23% at net asset value (NAV) for the 12 months ended December 31, 2025. The Fund outperformed the Russell 1000 Value Index, which returned 15.91%. • Top contributors to relative performance • Security selection in the information technology sector, led by out‑of‑benchmark positions to Lam Research Corporation and TE Connectivity Plc. • Security selection and an underweight allocation in the real estate sector, including a lack of exposure to Equinix, Inc. and an overweight to Prologis, Inc. • Security selection and an underweight allocation in the consumer staples sector, led by an overweight to Philip Morris International Inc. • Top detractors from relative performance • Security selection in the materials sector, including an overweight to Smurfit WestRock Plc and a lack of exposure to Newmont Corporation. • An overweight to UnitedHealth Group Incorporated. • Security selection in the industrials sector, including a lack of exposure to Caterpillar Inc. and GE Vernova Inc. |
Average Annual Total Returns
| 1‑Year | 5‑Year | 10‑Year | ||||
| Nuveen Life Large Cap Value Fund at NAV |
17.23% | 12.63% | 10.76% | |||
| Russell 1000® Index |
17.37% | 13.59% | 14.59% | |||
| Russell 1000® Value Index |
15.91% | 11.33% | 10.53% | |||
Fund Statistics (as of December 31, 2025)
| Fund net assets |
$ | 91,646,843 | ||
| Total number of portfolio holdings |
78 | |||
| Portfolio turnover (%) |
27% | |||
| Total management fees paid for the year |
$ | 383,529 | ||

How has the Fund changed?
For more complete information, you may review the Fund’s next prospectus, which is expected to be available by May 1, 2026 at https://www.tiaa.org/public/prospectuses/ or upon request at (800) 842‑2252.
For more complete information, you may review the Fund’s next prospectus, which is expected to be available by May 1, 2026 at https://www.tiaa.org/public/prospectuses/ or upon request at (800) 842‑2252.
This report describes changes to the Fund that occurred during the reporting period.
What were the Fund costs for the last year? (based on a hypothetical $10,000 investment)
| Cost of a $10,000 investment |
Costs paid as a percentage of $10,000 investment* | |||
| Nuveen Life Small Cap Equity Fund |
$57 | 0.53% | ||
* Annualized for period less than one year.
How did the Fund perform last year? What affected the Fund’s performance?
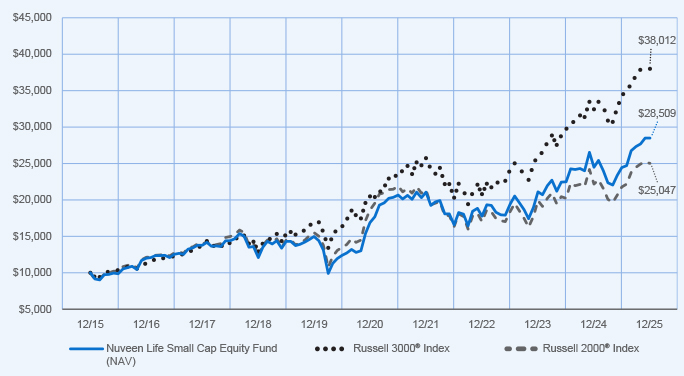
| Performance Highlights • The Nuveen Life Small Cap Equity Fund returned 16.40% at net asset value (NAV) for the 12 months ended December 31, 2025. The Fund outperformed the Russell 2000 Index, which returned 12.81%. • Top contributors to relative performance • Security selection in the health care sector, led by overweights to Terns Pharmaceuticals, Inc., Hims & Hers Health, Inc. and Nuvation Bio, Inc. • Security selection in the industrials sector, led by overweights to Bloom Energy Corporation and Nextpower Inc. • Security selection in the consumer discretionary sector, including overweights to GigaCloud Technology, Inc. and FIGS, Inc. and a lack of exposure to Six Flags Entertainment Corporation. • Security selection in the financials sector, led by an overweight to Dave, Inc. • Top detractors from relative performance • Security selection in the communication services sector, including a lack of exposure to EchoStar Corporation and AST SpaceMobile, Inc. • Security selection in the consumer staples sector, including an overweight to Sprouts Farmers Market, Inc. • An overweight to Praxis Precision Medicines, Inc. |
Average Annual Total Returns
| 1-Year | 5-Year | 10-Year | ||||||||||
| Nuveen Life Small Cap Equity Fund at NAV |
16.40 | % | 11.02 | % | 11.04 | % | ||||||
| Russell 3000® Index |
17.15 | % | 13.15 | % | 14.29 | % | ||||||
| Russell 2000® Index |
12.81 | % | 6.09 | % | 9.62 | % | ||||||
Fund Statistics (as of December 31, 2025)
| Fund net assets |
$74,484,991 | |||
| Total number of portfolio holdings |
384 | |||
| Portfolio turnover (%) |
75% | |||
| Total management fees paid for the year |
$ 312,784 | |||
How has the Fund changed?
| • | Portfolio manager update: Effective March 1, 2025, Nan Zhang, CFA has been added as a portfolio manager of the Fund. |
For more complete information, you may review the Fund’s next prospectus, which is expected to be available by May 1, 2026 at https://www.tiaa.org/public/prospectuses/ or upon request at (800) 842-2252.
For more complete information, you may review the Fund’s next prospectus, which is expected to be available by May 1, 2026 at https://www.tiaa.org/public/prospectuses/ or upon request at (800) 842-2252.
This report describes changes to the Fund that occurred during the reporting period.
What were the Fund costs for the last year? (based on a hypothetical $10,000 investment)
| Cost of a $10,000 investment |
Costs paid as a percentage of $10,000 investment* | |||
| Nuveen Life Stock Index Fund |
$9 | 0.08% | ||
* Annualized for period less than one year.
How did the Fund perform last year? What affected the Fund’s performance?
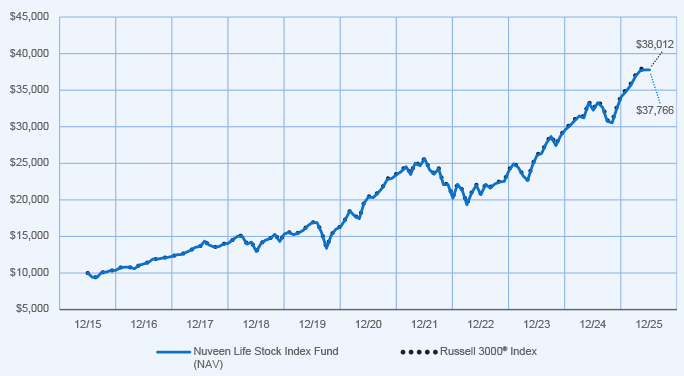
| Performance Highlights • The Nuveen Life Stock Index Fund’s total return at net asset value (NAV) was 17.04% for the 12 months ended December 31, 2025. The Fund’s index, the Russell 3000 Index, returned 17.15%. • The difference between the Fund’s total return at NAV and that of the index is attributable to management fees and other expenses incurred by the Fund that are not incurred by the index. • The Fund had a risk profile similar to that of its benchmark. As such, there were no material contributors or detractors relative to the Fund’s benchmark during the period. |
Average Annual Total Returns
| 1-Year | 5-Year | 10-Year | ||||||||||
| Nuveen Life Stock Index Fund at NAV |
17.04 | % | 13.10 | % | 14.21 | % | ||||||
| Russell 3000® Index |
17.15 | % | 13.15 | % | 14.29 | % | ||||||
Fund Statistics (as of December 31, 2025)
| Fund net assets |
$939,752,765 | |||
| Total number of portfolio holdings |
2,600 | |||
| Portfolio turnover (%) |
2% | |||
| Total management fees paid for the year |
$ 529,054 | |||
How has the Fund changed?
For more complete information, you may review the Fund’s next prospectus, which is expected to be available by May 1, 2026 at https://www.tiaa.org/public/prospectuses/ or upon request at (800) 842-2252.
For more complete information, you may review the Fund’s next prospectus, which is expected to be available by May 1, 2026 at https://www.tiaa.org/public/prospectuses/ or upon request at (800) 842-2252.
This report describes changes to the Fund that occurred during the reporting period.
What were the Fund costs for the last year? (based on a hypothetical $10,000 investment)
| Cost of a $10,000 investment |
Costs paid as a percentage of $10,000 investment* | |||
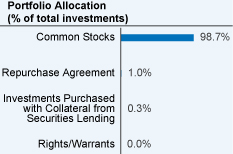
| Nuveen Life Large Cap Responsible Equity Fund |
$24 | 0.22% | ||
* Annualized for period less than one year.
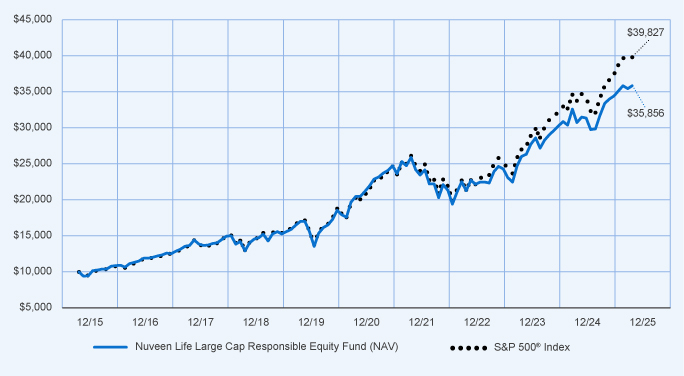
How did the Fund perform last year? What affected the Fund’s performance?
| Performance Highlights • The Nuveen Life Large Cap Responsible Equity Fund returned 16.63% at net asset value (NAV) for the 12 months ended December 31, 2025. The Fund underperformed the S&P 500 Index, which returned 17.88%. • Top contributors to relative performance • Security selection in the financials sector, led by overweights to Citigroup Inc., Goldman Sachs Group, Inc. and Morgan Stanley. • Security selection in the materials sector, led by an overweight to Newmont Corporation. • Security selection and an underweight allocation in the consumer discretionary sector, including a lack of exposure to Amazon.com, Inc. and an overweight to eBay Inc. • Top detractors from relative performance • Security selection and an underweight allocation in the communication services sector, including a lack of exposure to Alphabet Inc. and an overweight to Comcast Corporation. • Security selection in the industrials sector, including an overweight to Copart, Inc. and a lack of exposure to GE Aerospace. • An underweight to Broadcom Inc. |
Average Annual Total Returns
| 1-Year | 5-Year | 10-Year | ||||||||||
| Nuveen Life Large Cap Responsible Equity Fund at NAV |
16.63 | % | 11.83 | % | 13.62 | % | ||||||
| S&P 500® Index |
17.88 | % | 14.42 | % | 14.82 | % | ||||||
Fund Statistics (as of December 31, 2025)
| Fund net assets |
$103,237,812 | |||
| Total number of portfolio holdings |
120 | |||
| Portfolio turnover (%) |
34% | |||
| Total management fees paid for the year |
$ 149,132 | |||
How has the Fund changed?
For more complete information, you may review the Fund’s next prospectus, which is expected to be available by May 1, 2026 at https://www.tiaa.org/public/prospectuses/ or upon request at (800) 842-2252.
For more complete information, you may review the Fund’s next prospectus, which is expected to be available by May 1, 2026 at https://www.tiaa.org/public/prospectuses/ or upon request at (800) 842-2252.
This report describes changes to the Fund that occurred during the reporting period.
What were the Fund costs for the last year? (based on a hypothetical $10,000 investment)
| Cost of a $10,000 investment |
Costs paid as a percentage of $10,000 investment* | |||
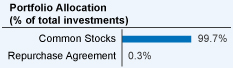
| Nuveen Life Real Estate Securities Select Fund |
$58 | 0.57% | ||
* Annualized for period less than one year.
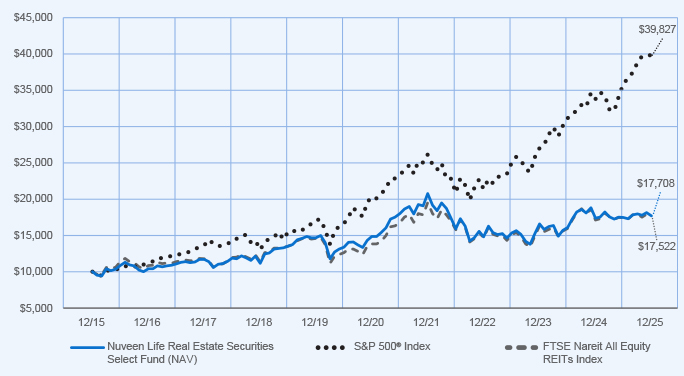
How did the Fund perform last year? What affected the Fund’s performance?
| Performance Highlights • The Nuveen Life Real Estate Securities Select Fund returned 1.86% at net asset value (NAV) for the 12 months ended December 31, 2025. The Fund underperformed the FTSE Nareit All Equity REITs Index, which returned 2.27%. • Top contributors to relative performance • Security selection in the health care sector, led by overweights to American Healthcare REIT, Inc. and Ventas, Inc. and a lack of exposure to Alexandria Real Estate Equities, Inc. • Security selection in the industrial sector, including an overweight to Prologis, Inc., and a lack of exposure to Americold Realty Trust, Inc. • An overweight allocation in the regional malls sector, led by an overweight to Simon Property Group, Inc. • Top detractors from relative performance • Security selection in the specialty sector, including an out-of-benchmark position in Fermi Inc. • An overweight allocation and security selection in the shopping centers sector, including overweights to Kimco Realty Corporation and Kite Realty Group Trust. • An overweight to SL Green Realty Corp, which is included in the office property sector. |
Average Annual Total Returns
| 1‑Year | 5‑Year | 10‑Year | ||||||||||
| Nuveen Life Real Estate Securities Select Fund at NAV |
1.86 | % | 3.55 | % | 5.88 | % | ||||||
| S&P 500® Index |
17.88 | % | 14.42 | % | 14.82 | % | ||||||
| FTSE Nareit All Equity REITs Index |
2.27 | % | 4.85 | % | 5.77 | % | ||||||
Fund Statistics (as of December 31, 2025)
| Fund net assets |
$ | 60,287,226 | ||
| Total number of portfolio holdings |
44 | |||
| Portfolio turnover (%) |
29% | |||
| Total management fees paid for the year |
$ | 312,963 | ||
How has the Fund changed?
| • | Portfolio manager update: Effective January 7, 2026, Benjamin Kerl and Griffin Bazor, CFA were added as portfolio managers of the Fund and David Copp and Brendan Lee were removed as portfolio managers of the Fund. |
For more complete information, you may review the Fund’s next prospectus, which is expected to be available by May 1, 2026 at https://www.tiaa.org/public/prospectuses/ or upon request at (800) 842‑2252.
For more complete information, you may review the Fund’s next prospectus, which is expected to be available by May 1, 2026 at https://www.tiaa.org/public/prospectuses/ or upon request at (800) 842‑2252.
This report describes changes to the Fund that occurred during the reporting period.
What were the Fund costs for the last year? (based on a hypothetical $10,000 investment)
| Cost of a $10,000 investment |
Costs paid as a percentage of $10,000 investment* | |||
| Nuveen Life Core Bond Fund |
$36 | 0.35% | ||
* Annualized for period less than one year.
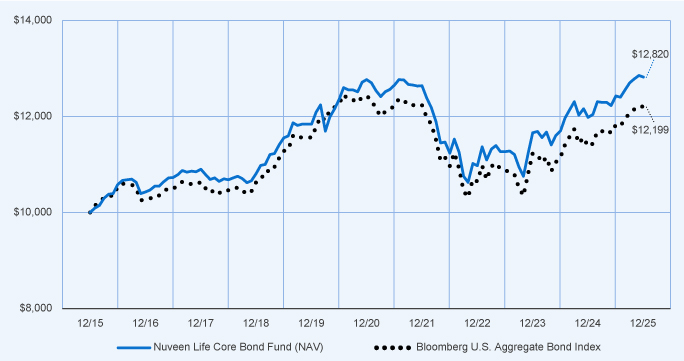
How did the Fund perform last year? What affected the Fund’s performance?
| Performance Highlights • The Nuveen Life Core Bond Fund returned 7.07% at net asset value (NAV) for the 12 months ended December 31, 2025. The Fund performed in line with the Bloomberg U.S. Aggregate Bond Index, which returned 7.30%. • Top contributors to relative performance • Broadly diversified overweights to non-treasury sectors, including small, out-of-benchmark allocations to emerging-markets debt, positions in mortgage-backed securities (MBS) and an overweight to corporate bonds. • A corresponding underweight to U.S. Treasuries. • Security selection, especially within commercial mortgage-backed securities and corporate bonds. • Top detractors from relative performance • Yield curve positioning. • Security selection in agency MBS. |
Average Annual Total Returns
| 1-Year | 5-Year | 10-Year | ||||
| Nuveen Life Core Bond Fund at NAV |
7.07% | 0.09% | 2.52% | |||
| Bloomberg U.S. Aggregate Bond Index |
7.30% | (0.36)% | 2.01% | |||
Fund Statistics (as of December 31, 2025)
| Fund net assets |
$215,980,551 | |||
| Total number of portfolio holdings |
1,008 | |||
| Portfolio turnover (%) |
86% | |||
| Total management fees paid for the year |
$ 619,775 | |||
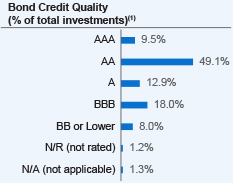
(1) Credit quality ratings are based on the Bloomberg Barclays methodology, which uses the median rating of those compiled by the Moody’s, Standard & Poor’s and Fitch ratings agencies. If ratings are available from only two of these agencies, the lower rating is used. When only one rating is available, that one is used. These ratings are subject to change without notice.
How has the Fund changed?
For more complete information, you may review the Fund’s next prospectus, which is expected to be available by May 1, 2026 at https://www.tiaa.org/public/prospectuses/ or upon request at (800) 842-2252.
For more complete information, you may review the Fund’s next prospectus, which is expected to be available by May 1, 2026 at https://www.tiaa.org/public/prospectuses/ or upon request at (800) 842-2252.
This report describes changes to the Fund that occurred during the reporting period.
What were the Fund costs for the last year? (based on a hypothetical $10,000 investment)
| Cost of a $10,000 investment |
Costs paid as a percentage of $10,000 investment* | |||
| Nuveen Life Balanced Fund |
$11 | 0.10% | ||
* The Fund’s ratios do not include the expenses or income of the Underlying Funds related to the Balanced Fund. Annualized for period less than one year.
How did the Fund perform last year? What affected the Fund’s performance?
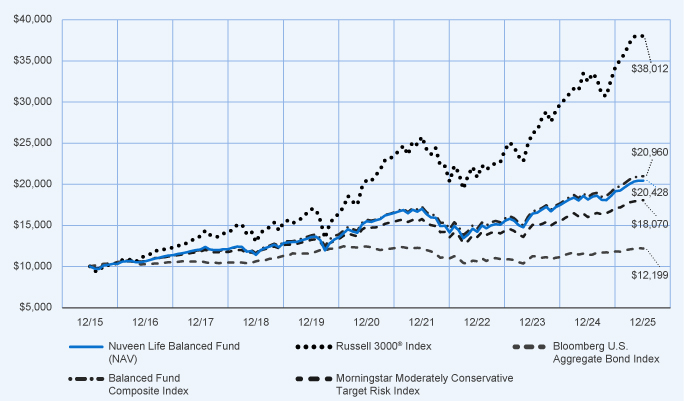
| Performance Highlights • The Nuveen Life Balanced Fund returned 12.71% at net asset value (NAV) for the 12 months ended December 31, 2025. The Fund underperformed the Balanced Fund Composite Index, which returned 13.60%. • The Fund’s Composite Index consisted of: 50.0% Bloomberg U.S. Aggregate Bond Index; 40.0% Russell 3000® Index; 10.0% MSCI EAFE® Index. • Top contributors to relative performance • An allocation to the Nuveen Life Large Cap Value Fund. • Holding the Nuveen Life Small Cap Equity Fund. • Top detractors from relative performance • An allocation to the Nuveen Life Core Equity Fund. • A position in the Nuveen Life Growth Equity Fund. • Holding the Nuveen Life Core Bond Fund. |
Average Annual Total Returns
| 1-Year | 5-Year | 10-Year | ||||
| Nuveen Life Balanced Fund at NAV |
12.71% | 5.69% | 7.40% | |||
| Russell 3000® Index |
17.15% | 13.15% | 14.29% | |||
| Bloomberg U.S. Aggregate Bond Index |
7.30% | (0.36)% | 2.01% | |||
| Balanced Fund Composite Index |
13.60% | 6.00% | 7.68% | |||
| Morningstar Moderately Conservative Target Risk Index |
12.87% | 4.06% | 6.10% | |||
Fund Statistics (as of December 31, 2025)
| Fund net assets |
$70,106,000 | |||
| Total number of portfolio holdings |
9 | |||
| Portfolio turnover (%) |
12% | |||
| Total management fees paid for the year |
$ 66,705 | |||
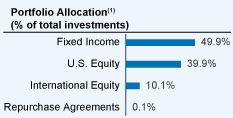
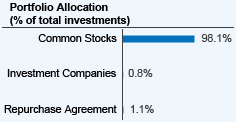
(1) Affiliated investment companies (Underlying Funds), except for repurchase agreements.
How has the Fund changed?
| • | Portfolio manager update: Effective October 1, 2025, Jeff Sun, CFA has been added as a portfolio manager of the Fund. |
For more complete information, you may review the Fund’s next prospectus, which is expected to be available by May 1, 2026 at https://www.tiaa.org/public/prospectuses/ or upon request at (800) 842-2252.
For more complete information, you may review the Fund’s next prospectus, which is expected to be available by May 1, 2026 at https://www.tiaa.org/public/prospectuses/ or upon request at (800) 842-2252.
| [1] | Annualized for period less than one year. |
| [2] | Annualized for period less than one year. |
| [3] | Annualized for period less than one year. |
| [4] | Annualized for period less than one year. |
| [5] | Annualized for period less than one year. |
| [6] | Annualized for period less than one year. |
| [7] | Annualized for period less than one year. |
| [8] | Annualized for period less than one year. |
| [9] | Annualized for period less than one year. |
| [10] | Annualized for period less than one year. |
| [11] | The Fund’s ratios do not include the expenses or income of the Underlying Funds related to the Balanced Fund. Annualized for period less than one year. |