| What were the Fund costs for the last year? (Based on a hypothetical $10,000 investment) | ||
| Class Name | Cost of a $10,000 | Costs paid as a |
| Institutional Class | $227 | 2.49% |
What factors influence performance?
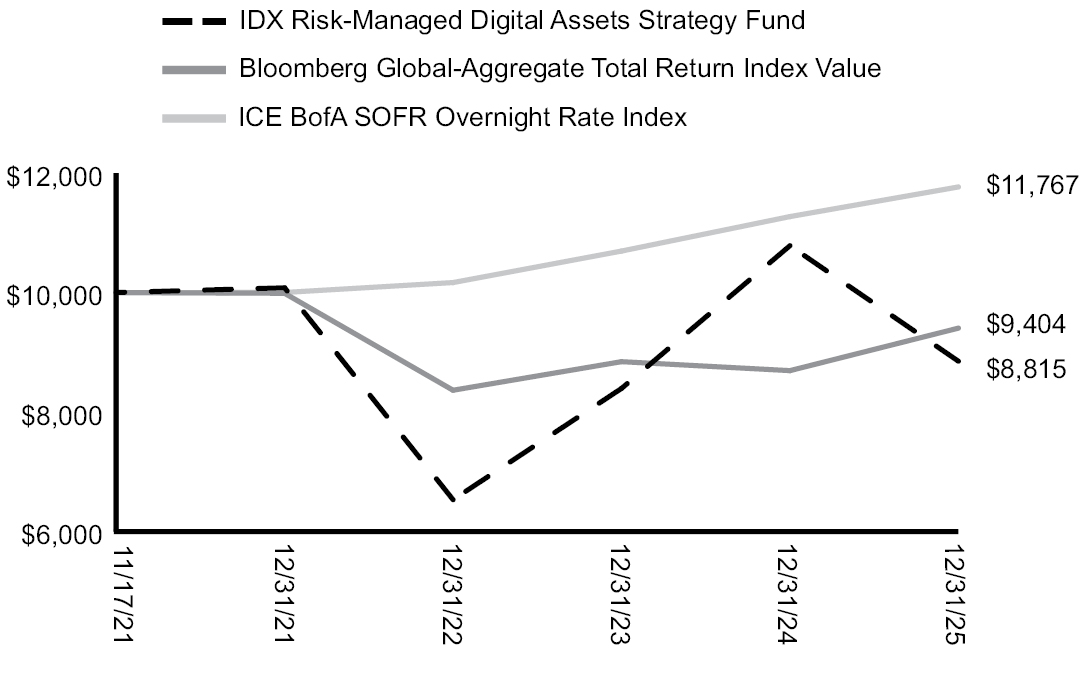
For the year ended December 31st, 2025, the Fund returned -17.93% relative to +8.17% and -18.93% for the Bloomberg Global-Aggregate Total Return Index and the Bloomberg Galaxy Crypto Index, respectively. Digital assets began 2025 on the back of a historical change in the regulatory posture of the U.S. government that likely secured the long-term future of the asset class and followed up with a year that was much ado about nothing in terms of price movements.
Bitcoin began 2025 near $94,000 and zoomed to an all-time high in October of more than $125,000 only to finish the year down roughly 6% at $87k. Ethereum had a similar year in that it rallied to an all-time high of more than $4,800 only to finish the year down more than 11%. This kind of trading environment that features no sustainable trends, false breakouts, and sharp corrections/rebounds is one that is not conducive to our trend following strategy. Institutional adoption via ETFs, lower realized volatility, and the macroeconomic environment leads the Adviser to believe this will be a feature of the asset class for the foreseeable future. For this reason, the Adviser has elected to return the capital allocated to this strategy as the Adviser believes it can be better used elsewhere.
How did the Fund perform in the past 12 months?
The chart reflects a hypothetical $10,000 investment. The chart uses total return NAV performance and assumes reinvestment of dividends and capital gains. Fund expenses, including management fees, were deducted.
Annual Average Total Return (%)
| 1-Year | Since | |
| IDX Risk-Managed Digital Assets Strategy Fund | -18.26% | -1.05% |
| Bloomberg Global-Aggregate Total Return Index* | 8.17% | -5.97% |
| ICE BofA SOFR Overnight Rate Index** | 4.40% | 4.28% |
The Fund’s past performance is not a good predictor of how the Fund will perform in the future. The graph and table do not reflect the deduction of taxes that a shareholder would pay on Fund distributions or redemption of Fund shares. For updated performance information visit https://idxfunds.com/btidx/.
* The Bloomberg Global Aggregate Index is a flagship measure of global investment grade debt from twenty-seven local currency markets. This multi-currency benchmark includes treasury, government-related, corporate and securitized fixed-rate bonds from both developed and emerging markets issuers.
** ICE BofA SOFR Overnight Rate Index tracks the performance of a synthetic asset paying SOFR to a stated maturity. The index is based on the assumed purchase at par of a synthetic instrument having exactly its stated maturity and with a coupon equal to that day’s fixing rate. That issue is assumed to be sold the following business day (priced at a yield equal to the current day fixing rate) and rolled into a new instrument.
| Key Fund Statistics (as of December 31, 2025) | |
| Net Assets ($) | $4,327,323 |
| Number of Holdings | 1 |
| Total Advisory Fees Paid ($) (net of waivers) | $136,996 |
| Portfolio Turnover Rate (%) | 100.00% |
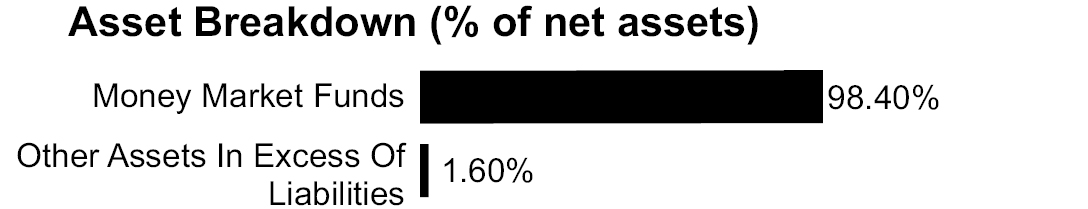
| What did the Fund invest in? (as of December 31, 2025) | |
| Top Holdings (% of net assets) | |
| First American Government Obligations Fund, Class X | 98.40% |
| Total | 98.40% |
Material Fund Changes
This is a summary of certain changes to the Fund since January 1, 2025. For more complete information, you may review the Fund’s prospectus dated April 30, 2025, which is available at https://idxfunds.com/btidx/ or upon request at (216) 329-4271.
On December 18, 2025, the Board of Trustees, after careful consideration and upon the recommendation of the Adviser, approved the liquidation of the Fund, effective January 20, 2026.
| What were the Fund costs for the last year? (Based on a hypothetical $10,000 investment) | ||
| Class Name | Cost of a $10,000 | Costs paid as a |
| Institutional Class | $196 | 1.79% |
What factors influence performance?
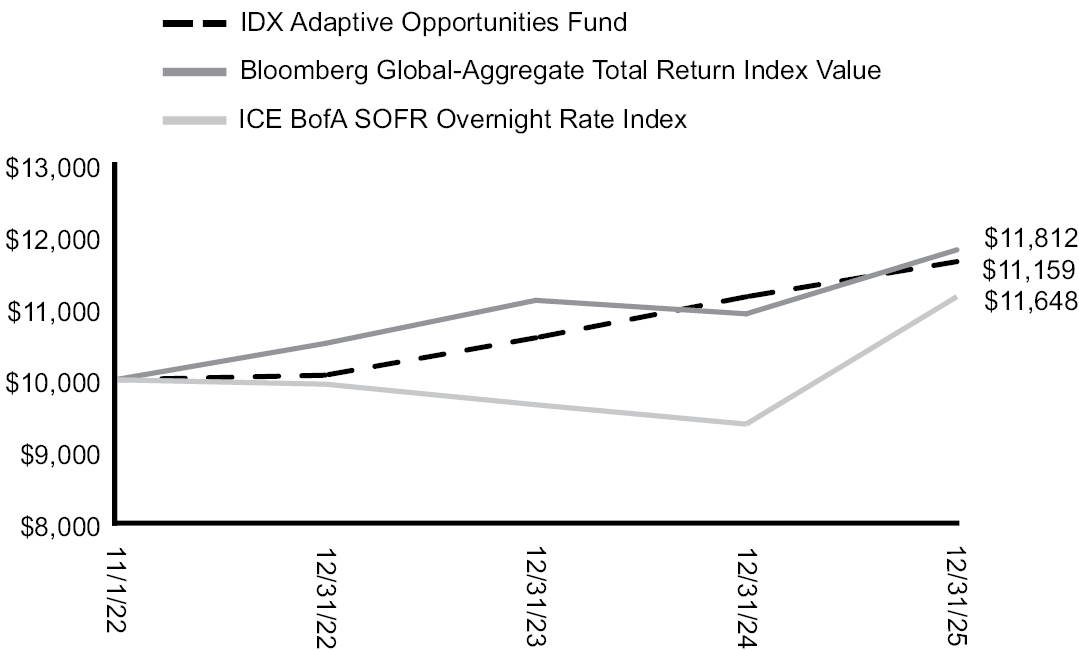
For the year ended December 31st, 2025, the Fund returned +18.94% relative to +8.17%, +15.77%, and -0.16% for the Bloomberg Global-Aggregate Total Return Index, Bloomberg Commodity Total Return Index, and the SocGen CTA Index, respectively.
The main performance driver in 2025 was a banner year for precious metals. Gold rallied significantly on fears over political stability and a declining U.S. dollar as individuals and foreign central banks alike stockpiled the metal. Silver, on the other hand, was the main driver of the positive year as a supply shortage wrecked global markets. Demand from solar producers, EVs, and other industrial uses (AI, etc.) drove shortages from Shanghai to New York. As COMEX (New York) stocks head towards five-year lows, this trading environment for silver shows no sign of abating.
How did the Fund perform in the past 12 months?
The chart reflects a hypothetical $10,000 investment. The chart uses total return NAV performance and assumes reinvestment of dividends and capital gains. Fund expenses, including management fees, were deducted.
Annual Average Total Return (%)
| 1-Year | Since | |
| IDX Adaptive Opportunities Fund | 18.94% | 3.53% |
| Bloomberg Global-Aggregate Total Return Index* | 8.17% | 18.21% |
| ICE BofA SOFR Overnight Rate Index** | 4.40% | 5.20% |
The Fund’s past performance is not a good predictor of how the Fund will perform in the future. The graph and table do not reflect the deduction of taxes that a shareholder would pay on Fund distributions or redemption of Fund shares. For updated performance information visit https://idxfunds.com/coidx/.
* The Bloomberg Global Aggregate Index is a flagship measure of global investment grade debt from twenty-seven local currency markets. This multi-currency benchmark includes treasury, government-related, corporate and securitized fixed-rate bonds from both developed and emerging markets issuers.
** ICE BofA SOFR Overnight Rate Index tracks the performance of a synthetic asset paying SOFR to a stated maturity. The index is based on the assumed purchase at par of a synthetic instrument having exactly its stated maturity and with a coupon equal to that day’s fixing rate. That issue is assumed to be sold the following business day (priced at a yield equal to the current day fixing rate) and rolled into a new instrument.
| Key Fund Statistics (as of December 31, 2025) | |
| Net Assets ($) | $31,123,962 |
| Number of Holdings* | 14 |
| Total Advisory Fees Paid ($) (net of waivers) | $181,453 |
| Portfolio Turnover Rate (%) | 41.85% |
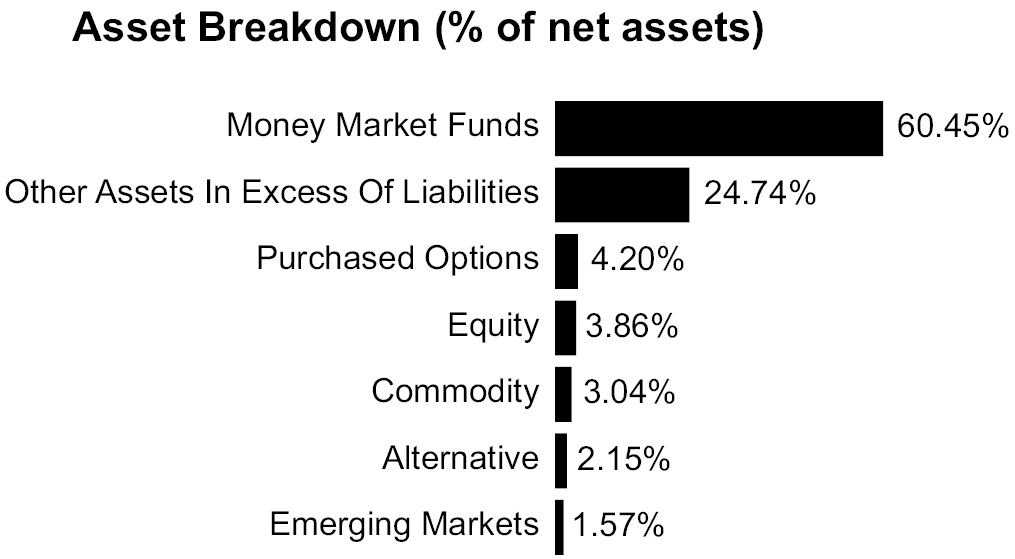
| What did the Fund invest in? (as of December 31, 2025) | |
| Top Holdings (% of net assets) | |
| First American Government Obligations Fund, Class X | 60.45% |
| Sprott Physical Silver Trust | 3.04% |
| Sarmaya Thematic ETF | 1.99% |
| iShares Core MSCI EAFE ETF | 1.87% |
| First Trust Long/Short Equity ETF | 1.71% |
| SPDR S&P Emerging Markets Dividend ETF | 1.57% |
| Convergence Long/Short Equity ETF | 0.44% |
| Total | 71.07% |
How has the Fund Changed?
There were no material fund changes during the period ended December 31, 2025.
| [1] | Does not include derivatives. |