Pay vs Performance Disclosure
Dec. 31, 2025
USD ($)
Dec. 31, 2024
USD ($)
Dec. 31, 2023
USD ($)
Dec. 31, 2022
USD ($)
Dec. 31, 2021
USD ($)
As required by Section 953(a) of the Dodd-Frank Wall Street Reform and Consumer Protection Act and Item 402(v) of Regulation S-K, we have prepared this pay versus performance disclosure, which serves to further demonstrate the alignment of our executive compensation program with stockholder interests.
| Value of Initial Fixed $100 Investment Based on: | ||||||||||||||||||||||||||||||||
| Year | Summary Compensation Table Total for Current CEO1 | Summary Compensation Table Total for Prior CEO1 | Compensation Actually Paid to Current CEO1 | Compensation Actually Paid to Prior CEO1 | Average Summary Compensation Table Total for Non-CEO NEOs2 | Average Compensation Actually Paid to Non-CEO NEOs2 | Total Stock-holder Return3 | Peer Group Total Stock-holder Return3,4 | Net Income ($ in Millions)5 | Relative Annual Economic Return6 | ||||||||||||||||||||||
| 2025 | $14,208,500 | N/A | $23,403,879 | N/A | $4,984,935 | $8,354,812 | $133.05 | $113.98 | $1,670 | 11.7 | ||||||||||||||||||||||
| 2024 | $13,098,200 | N/A | $15,493,368 | N/A | $5,840,085 | $6,808,308 | $98.66 | $98.24 | $863 | 7.6 | ||||||||||||||||||||||
| 2023 | $12,318,800 | N/A | $13,343,838 | N/A | $5,558,785 | $6,145,933 | $90.61 | $97.89 | $155 | 6.4 | ||||||||||||||||||||||
| 2022 | $7,646,700 | N/A | $3,653,990 | N/A | $4,266,463 | $1,425,320 | $82.36 | $84.86 | $(1,190) | (2.1) | ||||||||||||||||||||||
| 2021 | $6,949,900 | $11,254,900 | $7,745,878 | $15,106,695 | $2,952,885 | $3,317,861 | $105.23 | $115.64 | $749 | 9.9 | ||||||||||||||||||||||
1.Peter Federico (“Current CEO”) served as our CEO throughout 2022, 2023, 2024 and 2025. During 2021, each of Peter Federico and Gary Kain (“Prior CEO”) served as CEO of the Company for a six month period. Compensation totals during 2021 reflect the full-year compensation received by each of Messrs. Kain and Federico and do not reflect pro-rated payment for the period that each individual served as CEO.
2.During 2023, 2024 and 2025, our remaining NEOs consisted of Messrs. Kain, Kuehl, Pollack, and Reid and Ms. Bell. During 2022, remaining NEOs included Messrs. Kain, Kuehl and Pollack and Ms. Bell. During 2021, our remaining NEOs consisted of Messrs. Kuehl, Pas, and Pollack and Ms. Bell. For more details regarding how the amounts in this column are calculated, refer to the “Adjustments to Summary Compensation Tables to Determine Compensation Actually Paid” tables immediately below.
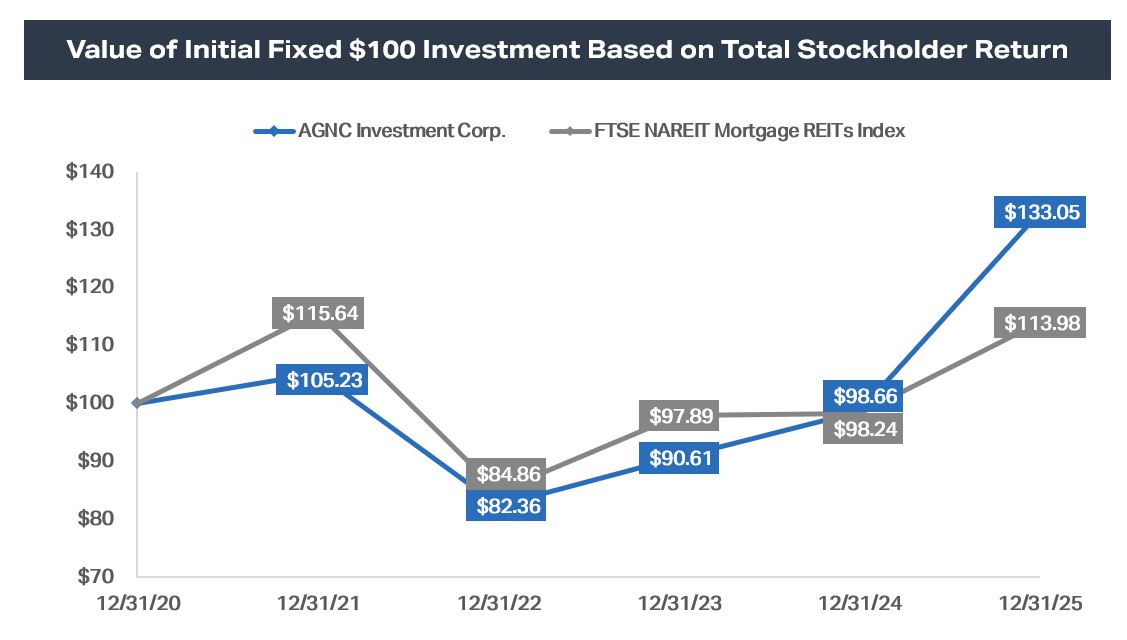
3.Total Stockholder Return and Peer Group Total Stockholder Return assumes $100 invested at December 31, 2020.
4.As permitted by SEC rules, the peer group referenced for purpose of the Total Stockholder Return comparison consists of the FTSE NAREIT Mortgage REITs Index.
5.Reflects after-tax net income attributable to stockholders prepared in accordance with GAAP for each of the years shown.
6.The Company has designated “Relative Annual Economic Return” as its Company Selected Measure, as this is the largest financial component of our 2025 Corporate Scorecard and our most important financial measure (that is not otherwise required to be disclosed in this table) used by us to link compensation actually paid to our NEOs to Company performance. Relative Annual Economic Return compares the economic return of AGNC to that of the average of the Agency REIT Peer Group and is calculated based on percentage points. For purposes of AGNC’s Corporate Scorecard, relative annual economic return is calculated on an October 1 - September 30 year, but consistent with the requirements of Regulation S-K, it is calculated for purposes of this table on a calendar year basis. Additional details regarding the calculation of Relative Annual Economic Return and the companies included in the Agency REIT Peer Group for 2025 are included in the discussion of our 2025 Corporate Scorecard on page 29. For 2021, the component companies were ARR, CMO, DX, IVR, NLY, and TWO, although CMO was included only through September 30, 2021 as a result of its acquisition. Since 2022, the peer group has included ARR, DX, IVR, NLY, ORC, and TWO.
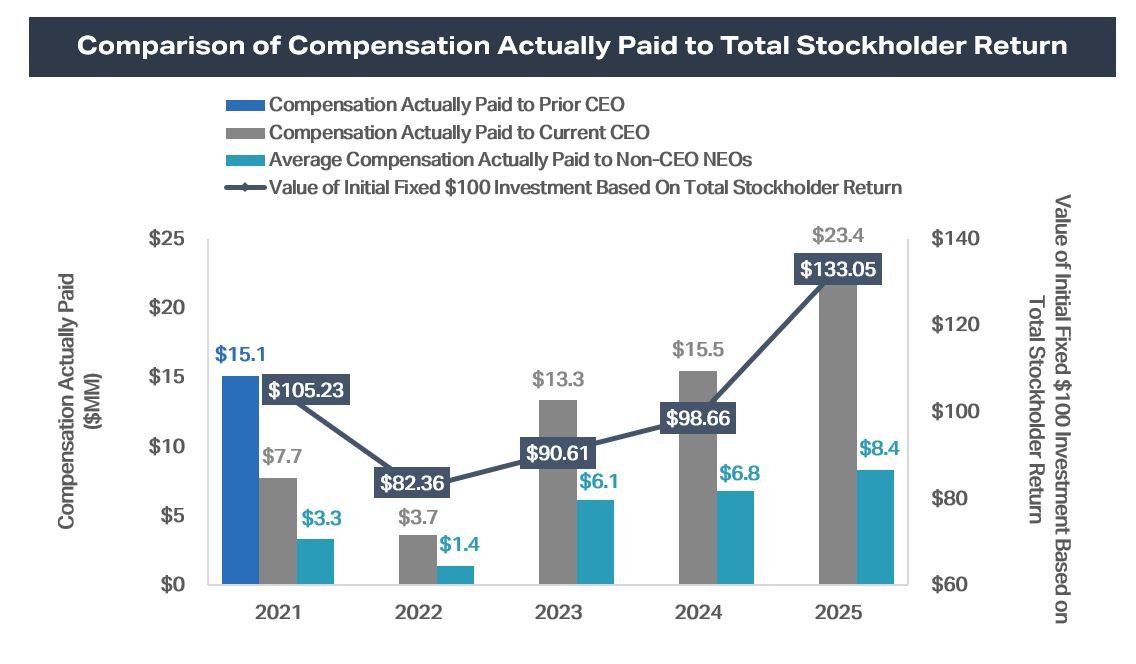
The following graph illustrates the relationship between compensation actually paid to our NEOs and AGNC’s total stockholder return on a cumulative basis assuming investment of $100 on December 31, 2020:
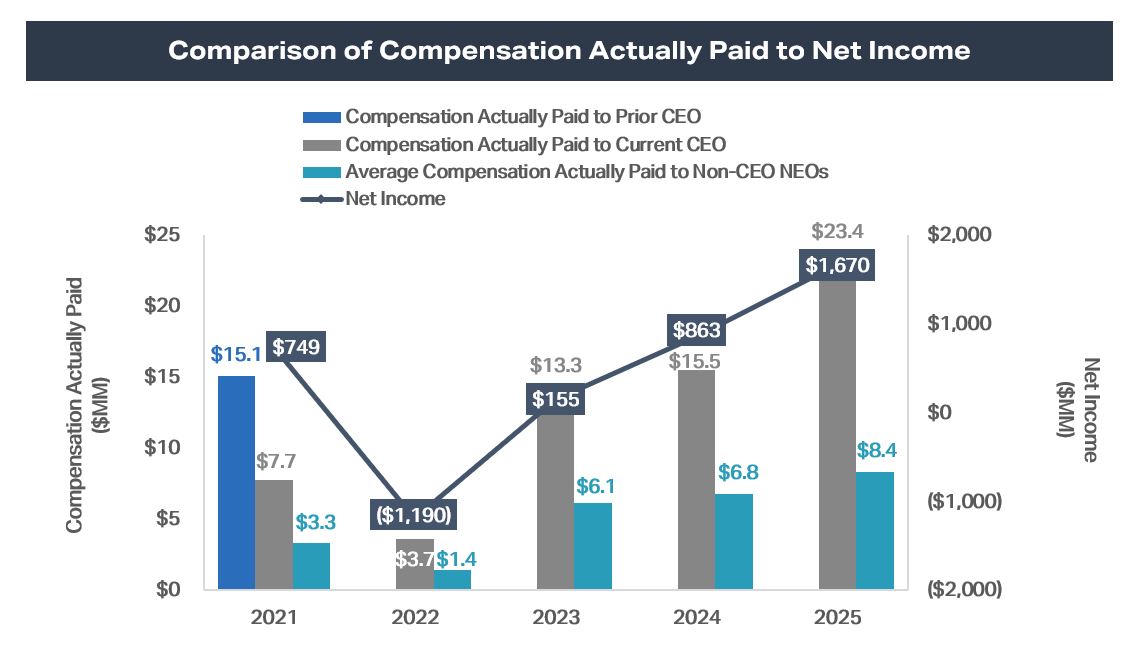
The following graph illustrates the relationship between compensation actually paid to our NEOs and AGNC’s net income on an annual basis:
The following graph illustrates the relationship between compensation actually paid to our NEOs and AGNC’s economic return relative to the Agency REIT Peer Group on an annual basis:
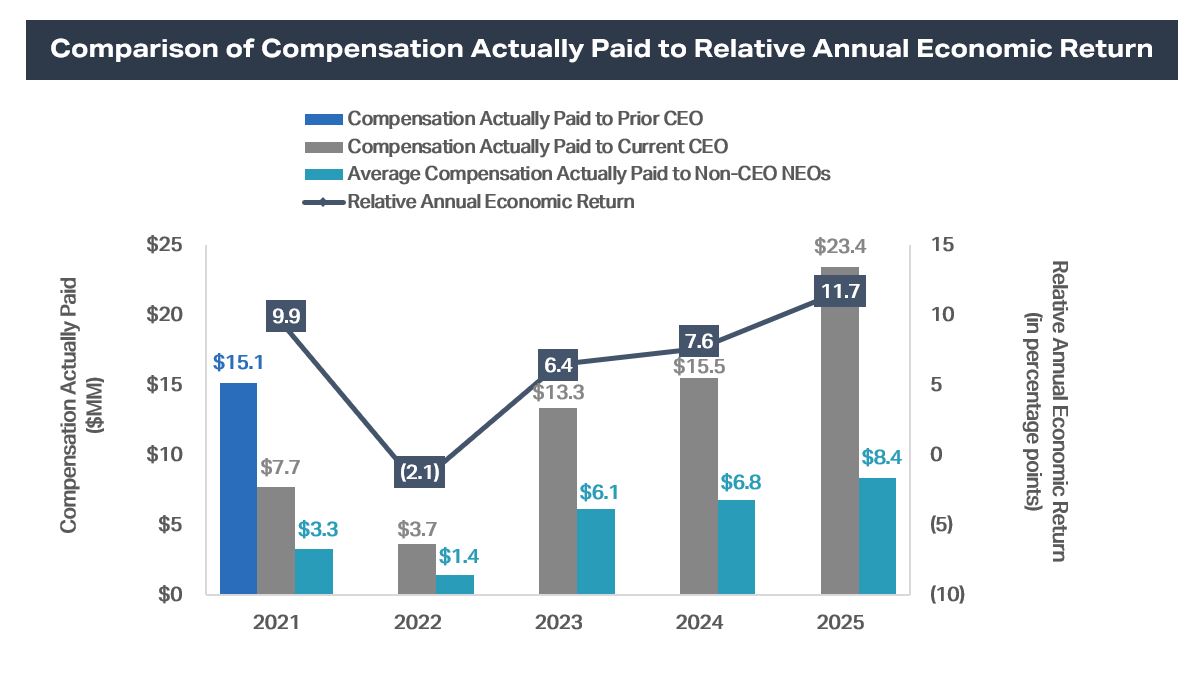
•Annual Economic Return Relative to the Agency REIT Peer Group
•Absolute Annual Economic Return
•Price-to-Tangible Book Value Ratio Relative to the Agency REIT Peer Group
Compensation Actually Paid represents the Summary Compensation Table Totals adjusted for the following items:
| Year 2025 | |||||||||||
| Adjustments to Summary Compensation Table Totals to Determine Compensation Actually Paid | Current CEO | Prior CEO | Average for Non-CEO-NEOs | ||||||||
| Deduction for amounts reported under the Stock Awards Column in the Summary Compensation Table | $ | (5,750,000) | N/A | $ | (1,895,000) | ||||||
| Increase for fair value at year-end of awards granted during year that remain unvested as of year-end | $ | 6,770,312 | N/A | $ | 2,231,284 | ||||||
| Increase/(Deduction) for change in fair value from prior year-end to current year-end of awards granted prior to year that were outstanding and unvested as of year-end | $ | 7,542,403 | N/A | $ | 2,737,181 | ||||||
| Increase/(Deduction) for change in fair value from prior year-end to vesting date of awards granted prior to year that vested during year | $ | 632,664 | N/A | $ | 296,412 | ||||||
| Total adjustments | $ | 9,195,379 | N/A | $ | 3,369,877 | ||||||
| Year 2024 | |||||||||||
| Adjustments to Summary Compensation Table Totals to Determine Compensation Actually Paid | Current CEO | Prior CEO | Average for Non-CEO-NEOs | ||||||||
| Deduction for amounts reported under the Stock Awards Column in the Summary Compensation Table | $ | (5,000,000) | N/A | $ | (2,042,000) | ||||||
| Increase for fair value at year-end of awards granted during year that remain unvested as of year-end | $ | 5,431,984 | N/A | $ | 2,218,426 | ||||||
| Increase/(Deduction) for change in fair value from prior year-end to current year-end of awards granted prior to year that were outstanding and unvested as of year-end | $ | 1,978,383 | N/A | $ | 800,694 | ||||||
| Increase/(Deduction) for change in fair value from prior year-end to vesting date of awards granted prior to year that vested during year | $ | (15,199) | N/A | $ | (8,896) | ||||||
| Total adjustments | $ | 2,395,168 | N/A | $ | 968,224 | ||||||
| Year 2023 | |||||||||||
| Adjustments to Summary Compensation Table Totals to Determine Compensation Actually Paid | Current CEO | Prior CEO | Average for Non-CEO-NEOs | ||||||||
| Deduction for amounts reported under the Stock Awards Column in the Summary Compensation Table | $ | (5,000,000) | N/A | $ | (2,042,000) | ||||||
| Increase for fair value at year-end of awards granted during year that remain unvested as of year-end | $ | 5,250,910 | N/A | $ | 2,144,458 | ||||||
| Increase/(Deduction) for change in fair value from prior year-end to current year-end of awards granted prior to year that were outstanding and unvested as of year-end | $ | 643,902 | N/A | $ | 356,759 | ||||||
| Increase/(Deduction) for change in fair value from prior year-end to vesting date of awards granted prior to year that vested during year | $ | 130,226 | N/A | $ | 127,931 | ||||||
| Total adjustments | $ | 1,025,038 | N/A | $ | 587,148 | ||||||
| Year 2022 | |||||||||||
| Adjustments to Summary Compensation Table Totals to Determine Compensation Actually Paid | Current CEO | Prior CEO | Average for Non-CEO-NEOs | ||||||||
| Deduction for amounts reported under the Stock Awards Column in the Summary Compensation Table | $ | (4,500,000) | N/A | $ | (2,262,500) | ||||||
| Increase for fair value at year-end of awards granted during year that remain unvested as of year-end | $ | 2,663,407 | N/A | $ | 1,339,108 | ||||||
| Increase/(Deduction) for change in fair value from prior year-end to current year-end of awards granted prior to year that were outstanding and unvested as of year-end | $ | (2,009,058) | N/A | $ | (1,669,332) | ||||||
| Increase/(Deduction) for change in fair value from prior year-end to vesting date of awards granted prior to year that vested during year | $ | (147,059) | N/A | $ | (248,419) | ||||||
| Total adjustments | $ | (3,992,710) | N/A | $ | (2,841,143) | ||||||
| Year 2021 | |||||||||||
| Adjustments to Summary Compensation Table Totals to Determine Compensation Actually Paid | Current CEO | Prior CEO | Average for Non-CEO-NEOs | ||||||||
| Deduction for amounts reported under the Stock Awards Column in the Summary Compensation Table | $ | (3,400,000) | $ | (6,150,000) | $ | (1,257,500) | |||||
| Increase for fair value at year-end of awards granted during year that remain unvested as of year-end | $ | 3,443,197 | $ | 6,228,139 | $ | 1,273,459 | |||||
| Increase/(Deduction) for change in fair value from prior year-end to current year-end of awards granted prior to year that were outstanding and unvested as of year-end | $ | 635,848 | $ | 3,420,757 | $ | 316,660 | |||||
| Increase/(Deduction) for change in fair value from prior year-end to vesting date of awards granted prior to year that vested during year | $ | 116,933 | $ | 352,899 | $ | 32,357 | |||||
| Total adjustments | $ | 795,978 | $ | 3,851,795 | $ | 364,976 | |||||