What were the Fund costs for the past year?
(based on a hypothetical $10,000 investment)
|
Fund
Name |
Costs
of a $10,000 investment |
Costs
paid as a percentage of a $10,000 investment |
|---|---|---|
|
RPAR
Risk Parity ETF |
$52 |
0.48% |
How did the Fund perform in the past year?
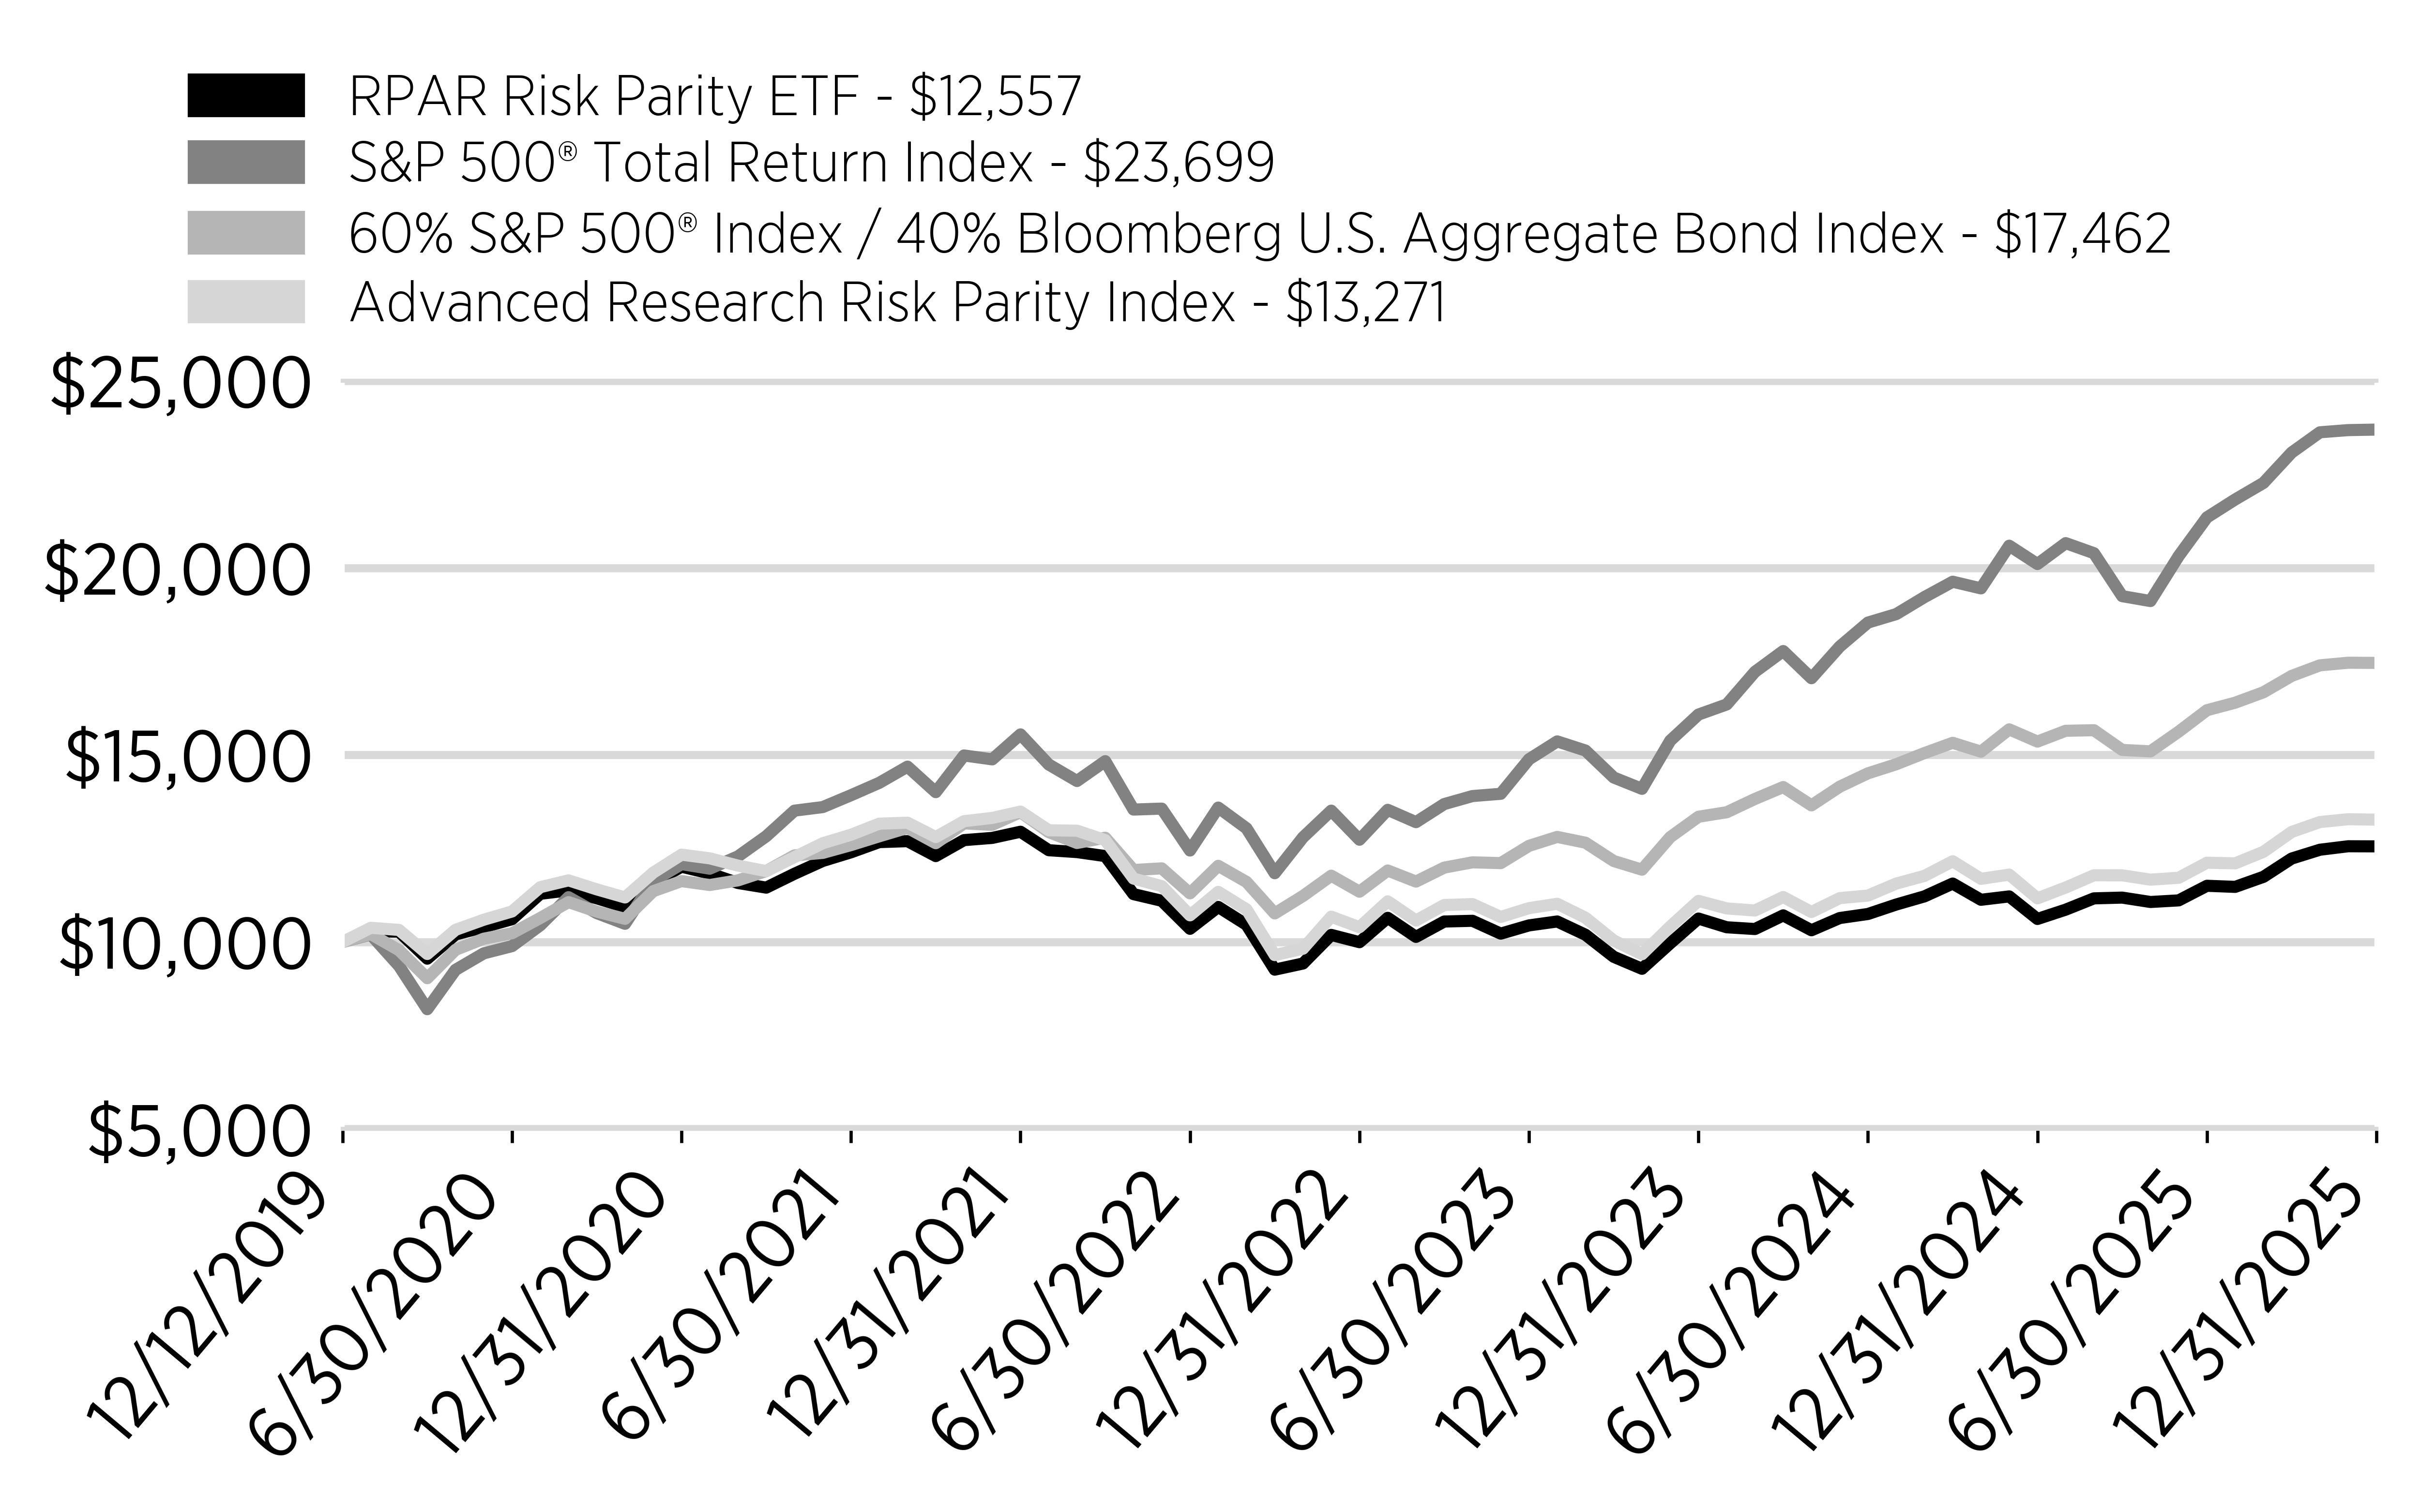
The RPAR Risk Parity ETF (“RPAR”) returned 18.28% for the fiscal year ended December 31, 2025, compared to 18.83% for the Advanced Research Risk Parity Index (“RPAR Index”). RPAR seeks to achieve exposures similar to those of the RPAR Index, investing across four major asset classes—global equities, U.S. Treasuries, commodities, and U.S. Treasury Inflation‑Protected Securities (“TIPS”). These markets were selected because each has historically tended to outperform in different economic environments, allowing RPAR to maintain a balanced, diversified profile across growth and inflation regimes.
What Factors Influenced Performance?
RPAR’s 2025 performance benefited from strong returns across several of its key allocations. Global equities, gold, and commodity‑producer equities were notable contributors, supported by resilient global growth, a weaker U.S. dollar, and increased geopolitical uncertainty that boosted demand for real‑asset exposures. Gold, in particular, delivered exceptionally strong results.
On the other hand, long‑term U.S. Treasuries and long‑term TIPS produced modestly positive but comparatively muted returns. Yields remained volatile during the year as markets digested shifting expectations for interest‑rate policy and inflation. While rates stabilized later in the year, earlier periods of adjustment tempered the overall contribution from rate‑sensitive assets.
The combination of strong performance from real assets and equities, partially offset by softer results from U.S. Treasuries and TIPS, ultimately produced a solid outcome for the Fund in 2025.
Cumulative Performance
(Initial Investment of $10,000)
Annual Performance
|
Annualized
Returns for the
Periods
Ended December 31, 2025 |
1
Year |
5
Year |
Since
Inception
(12/12/2019) |
|---|---|---|---|
|
RPAR
Risk Parity ETF |
18.28% |
0.89% |
3.83% |
|
S&P
500® Total Return Index |
17.88% |
14.42% |
15.32% |
|
60%
S&P 500® Index /
40%
Bloomberg U.S.
Aggregate
Bond Index |
13.70% |
8.47% |
9.65% |
|
Advanced
Research Risk
Parity
Index |
18.83% |
1.47% |
4.78% |
Key Fund Statistics
(as of December 31, 2025)
|
Fund
Size (Thousands) |
$562,709 |
|
Number
of Holdings |
104 |
|
Total
Advisory Fee |
$2,663,737 |
|
Portfolio
Turnover Rate |
17% |
What did the Fund invest in?
(as of December 31, 2025)
Sector/Security Type Breakdown
(% of total net assets)
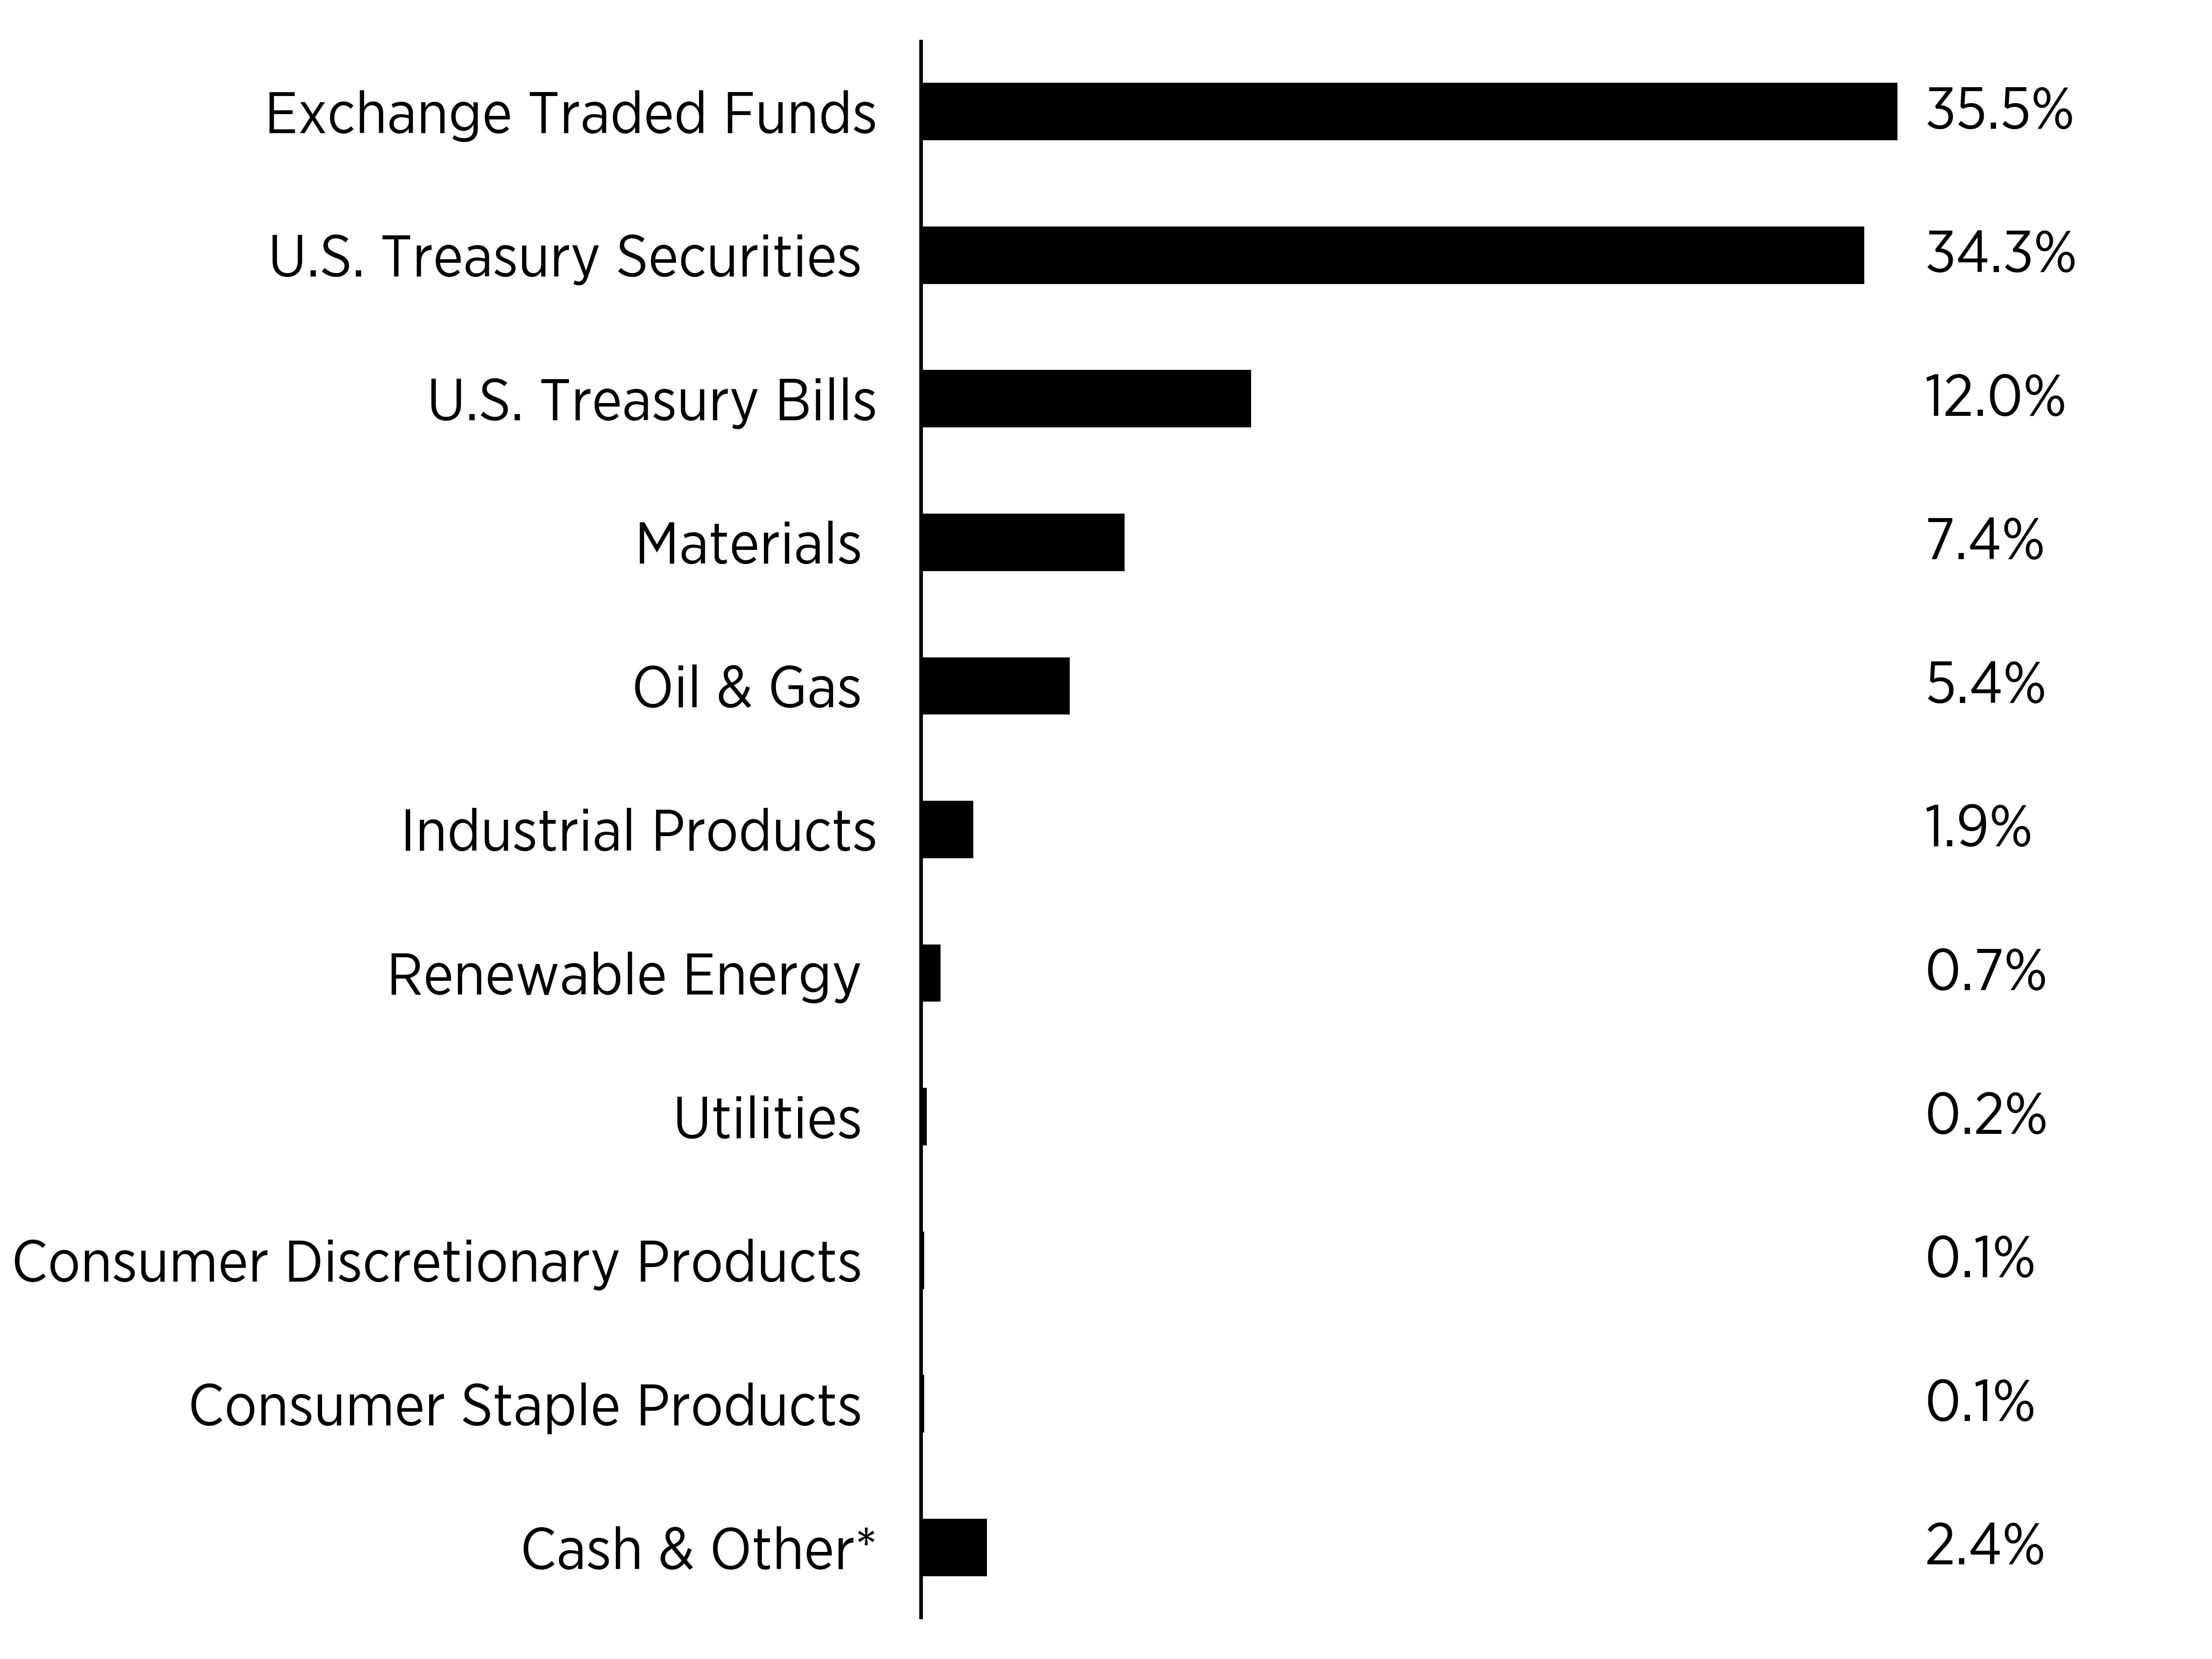
| * | Includes Futures Contracts |
|
Top
Ten Holdings |
(% of total
net assets) |
|---|---|
|
Vanguard
Total Stock Market ETF |
|
|
U.S.
Treasury Bill, 1/29/2026, 3.33% |
|
|
SPDR
Gold MiniShares Trust |
|
|
Vanguard
FTSE Emerging
Markets
ETF |
|
|
Vanguard
FTSE Developed
Markets
ETF |
|
|
U.S.
Treasury Inflation Indexed
Bonds
1.38%, 02/15/2044 |
|
|
U.S.
Treasury Inflation Indexed
Bonds
1.00%, 02/15/2046 |
|
|
U.S.
Treasury Inflation Indexed
Bonds
0.75%, 02/15/2042 |
|
|
U.S.
Treasury Inflation Indexed
Bonds
0.75%, 02/15/2045 |
|
|
U.S.
Treasury Inflation Indexed
Bonds
0.63%, 02/15/2043 |
How has the Fund Changed?
Effective August 1, 2025, U.S. Bancorp Fund Services, LLC, doing business as Global Fund Services, no longer serves as the Sub-Administrator for each series of Tidal Trust I, including the Fund.
What were the Fund costs for the past year?
(based on a hypothetical $10,000 investment)
|
Fund
Name |
Costs
of a $10,000 investment |
Costs
paid as a percentage of a $10,000 investment |
|---|---|---|
|
UPAR
Ultra Risk Parity ETF |
$72 |
0.64% |
How did the Fund perform in the past year?
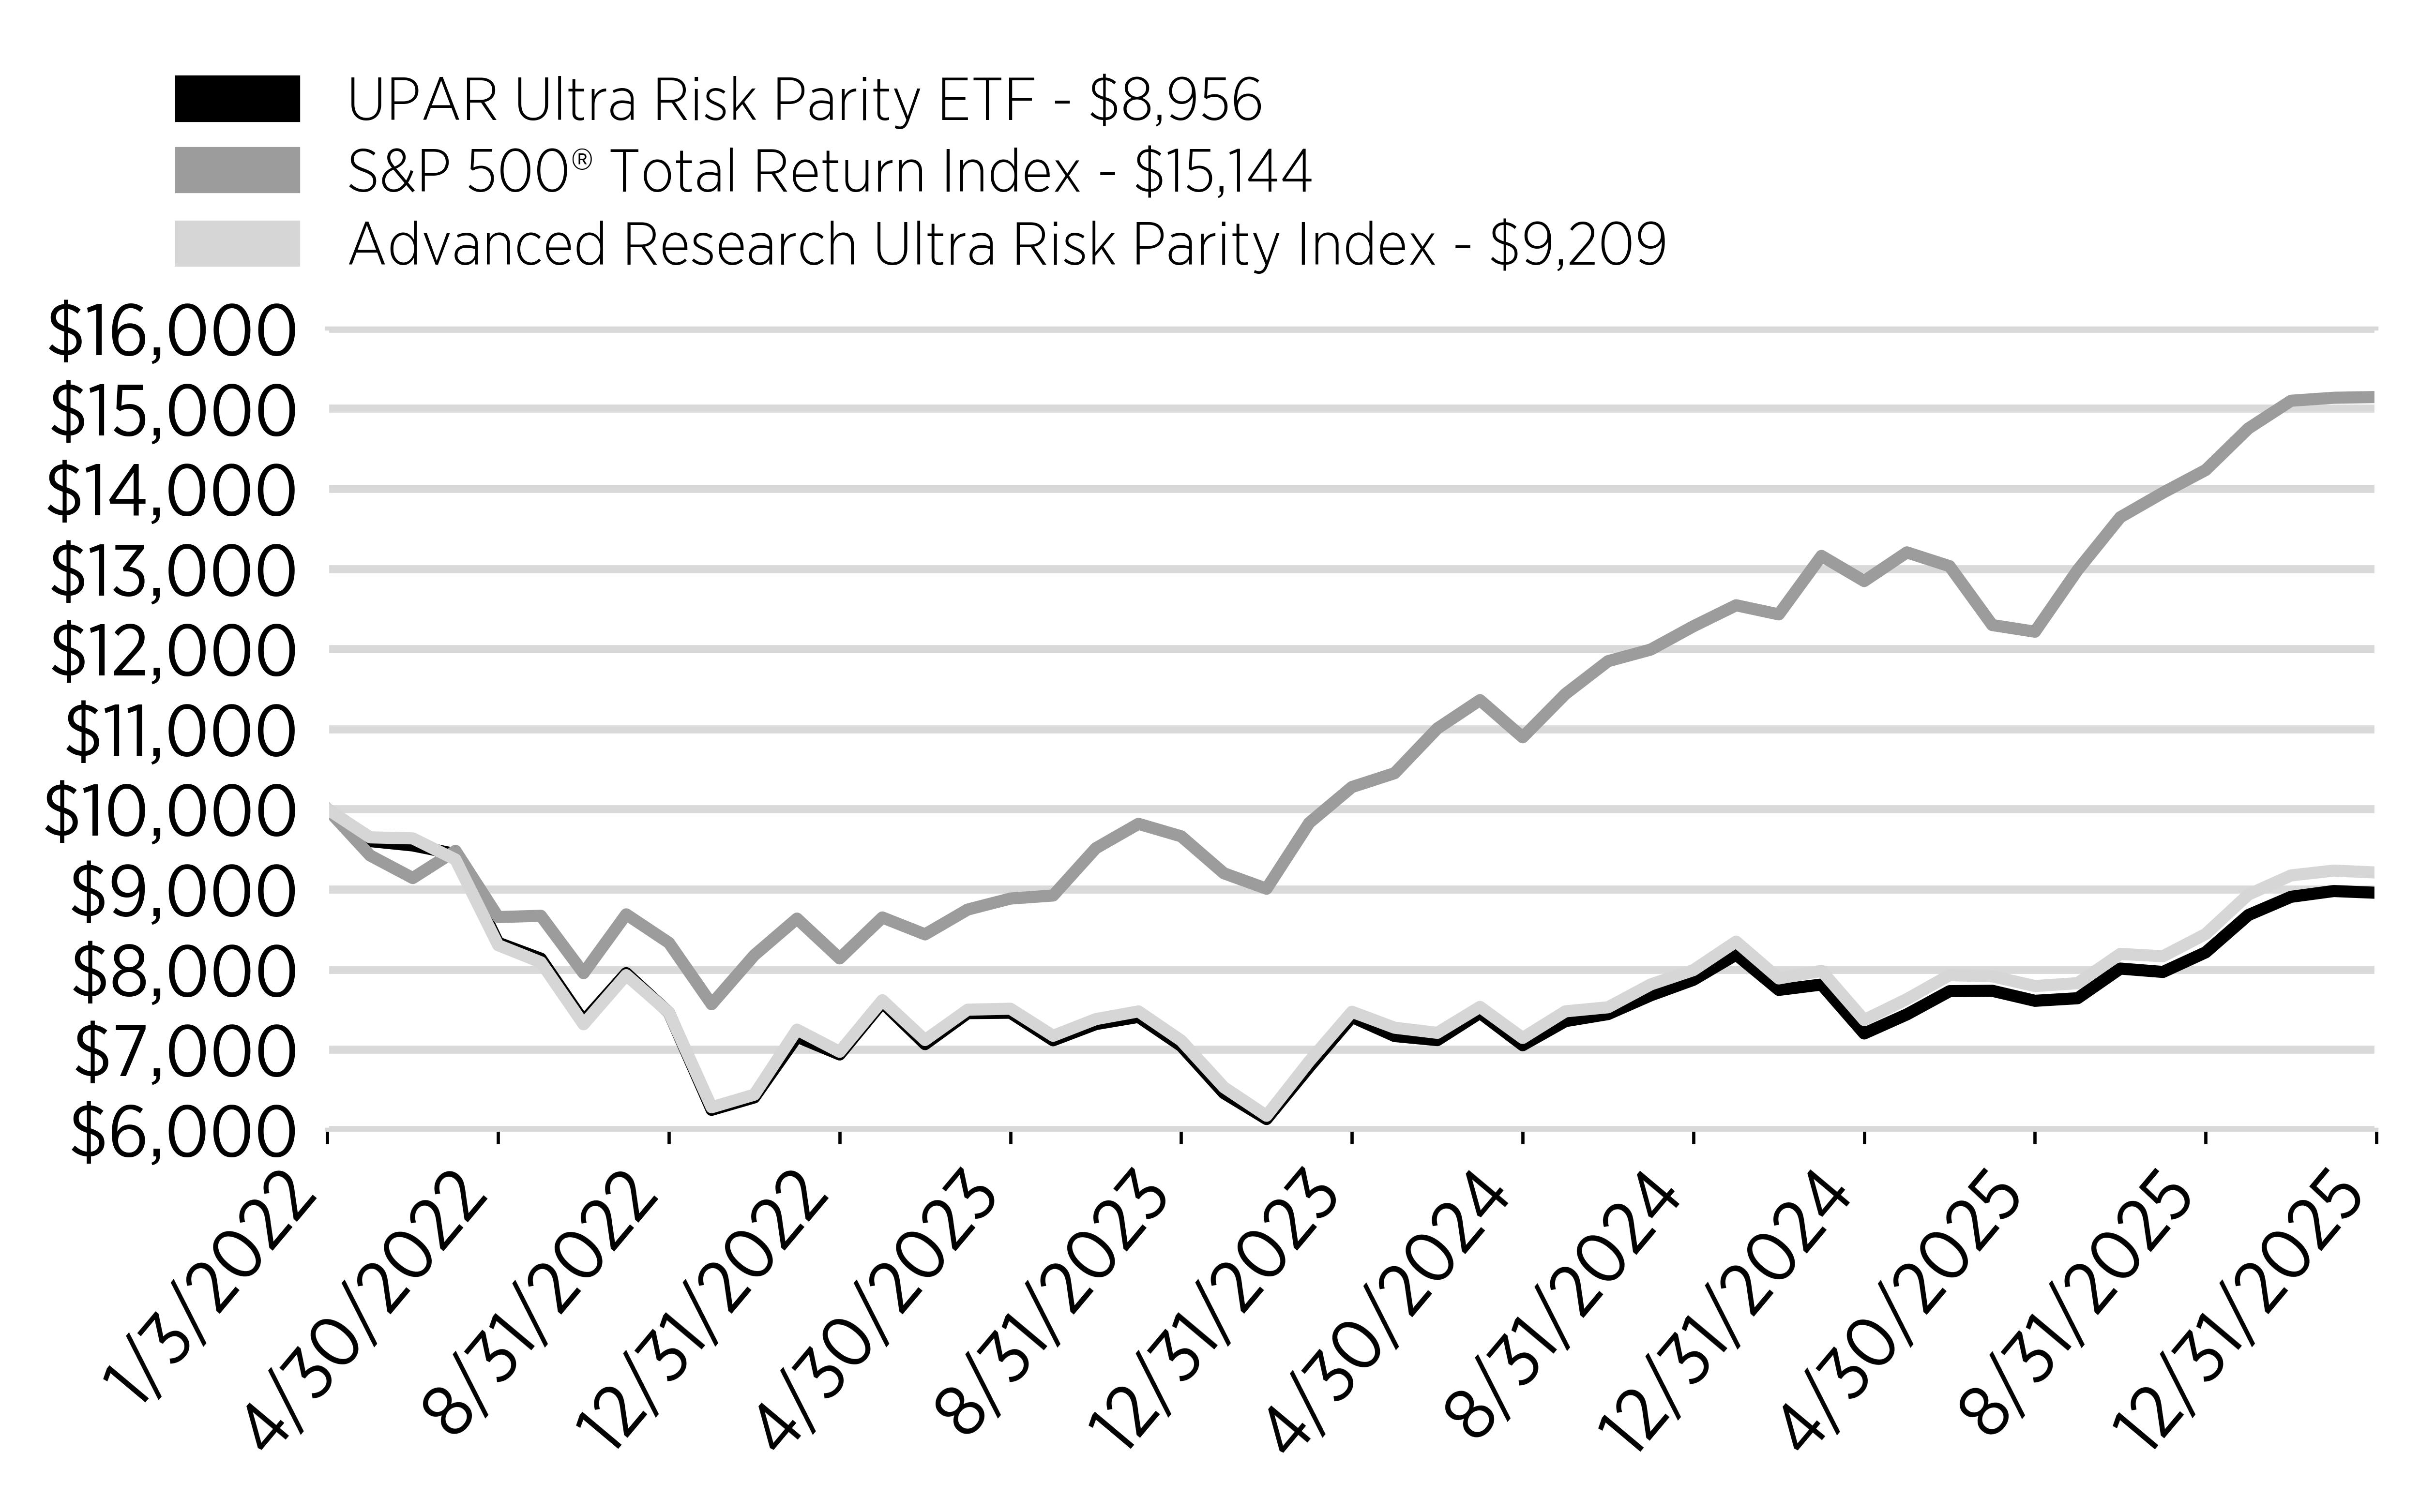
The UPAR Ultra Risk Parity ETF (“UPAR”) returned 24.38% for the fiscal year ended December 31, 2025, compared to 24.98% for the Advanced Research Ultra Risk Parity Index (“UPAR Index”). UPAR seeks to achieve exposures similar to those of the UPAR Index, investing across four major asset classes—global equities, U.S. Treasuries, commodities, and U.S. Treasury Inflation‑Protected Securities (“TIPS”). These markets were selected because each has historically tended to outperform in different economic environments, allowing UPAR to maintain a balanced, diversified profile across growth and inflation regimes.
What Factors Influenced Performance?
UPAR’s 2025 performance benefited from strong returns across several of its key allocations. Global equities, gold, and commodity‑producer equities were notable contributors, supported by resilient global growth, a weaker U.S. dollar, and increased geopolitical uncertainty that boosted demand for real‑asset exposures. Gold, in particular, delivered exceptionally strong results.
On the other hand, long‑term U.S. Treasuries and long‑term TIPS produced modestly positive but comparatively muted returns. Yields remained volatile during the year as markets digested shifting expectations for interest‑rate policy and inflation. While rates stabilized later in the year, earlier periods of adjustment tempered the overall contribution from rate‑sensitive assets.
The combination of strong performance from real assets and equities, partially offset by softer results from U.S. Treasuries and TIPS, ultimately produced a solid outcome for the Fund in 2025.
Cumulative Performance
(Initial Investment of $10,000)
Annual Performance
|
Annualized
Returns for the
Periods
Ended December 31, 2025 |
1
Year |
Since
Inception
(1/3/2022) |
|---|---|---|
|
UPAR
Ultra Risk Parity ETF |
24.38% |
-2.73% |
|
S&P
500® Total Return Index |
17.88% |
10.96% |
|
Advanced
Research Ultra Risk Parity Index |
24.98% |
-2.04% |
Key Fund Statistics
(as of December 31, 2025)
|
Fund
Size (Thousands) |
$63,625 |
|
Number
of Holdings |
105 |
|
Total
Advisory Fee |
$390,611 |
|
Portfolio
Turnover Rate |
24% |
What did the Fund invest in?
(as of December 31, 2025)
Sector/Security Type Breakdown
(% of total net assets)
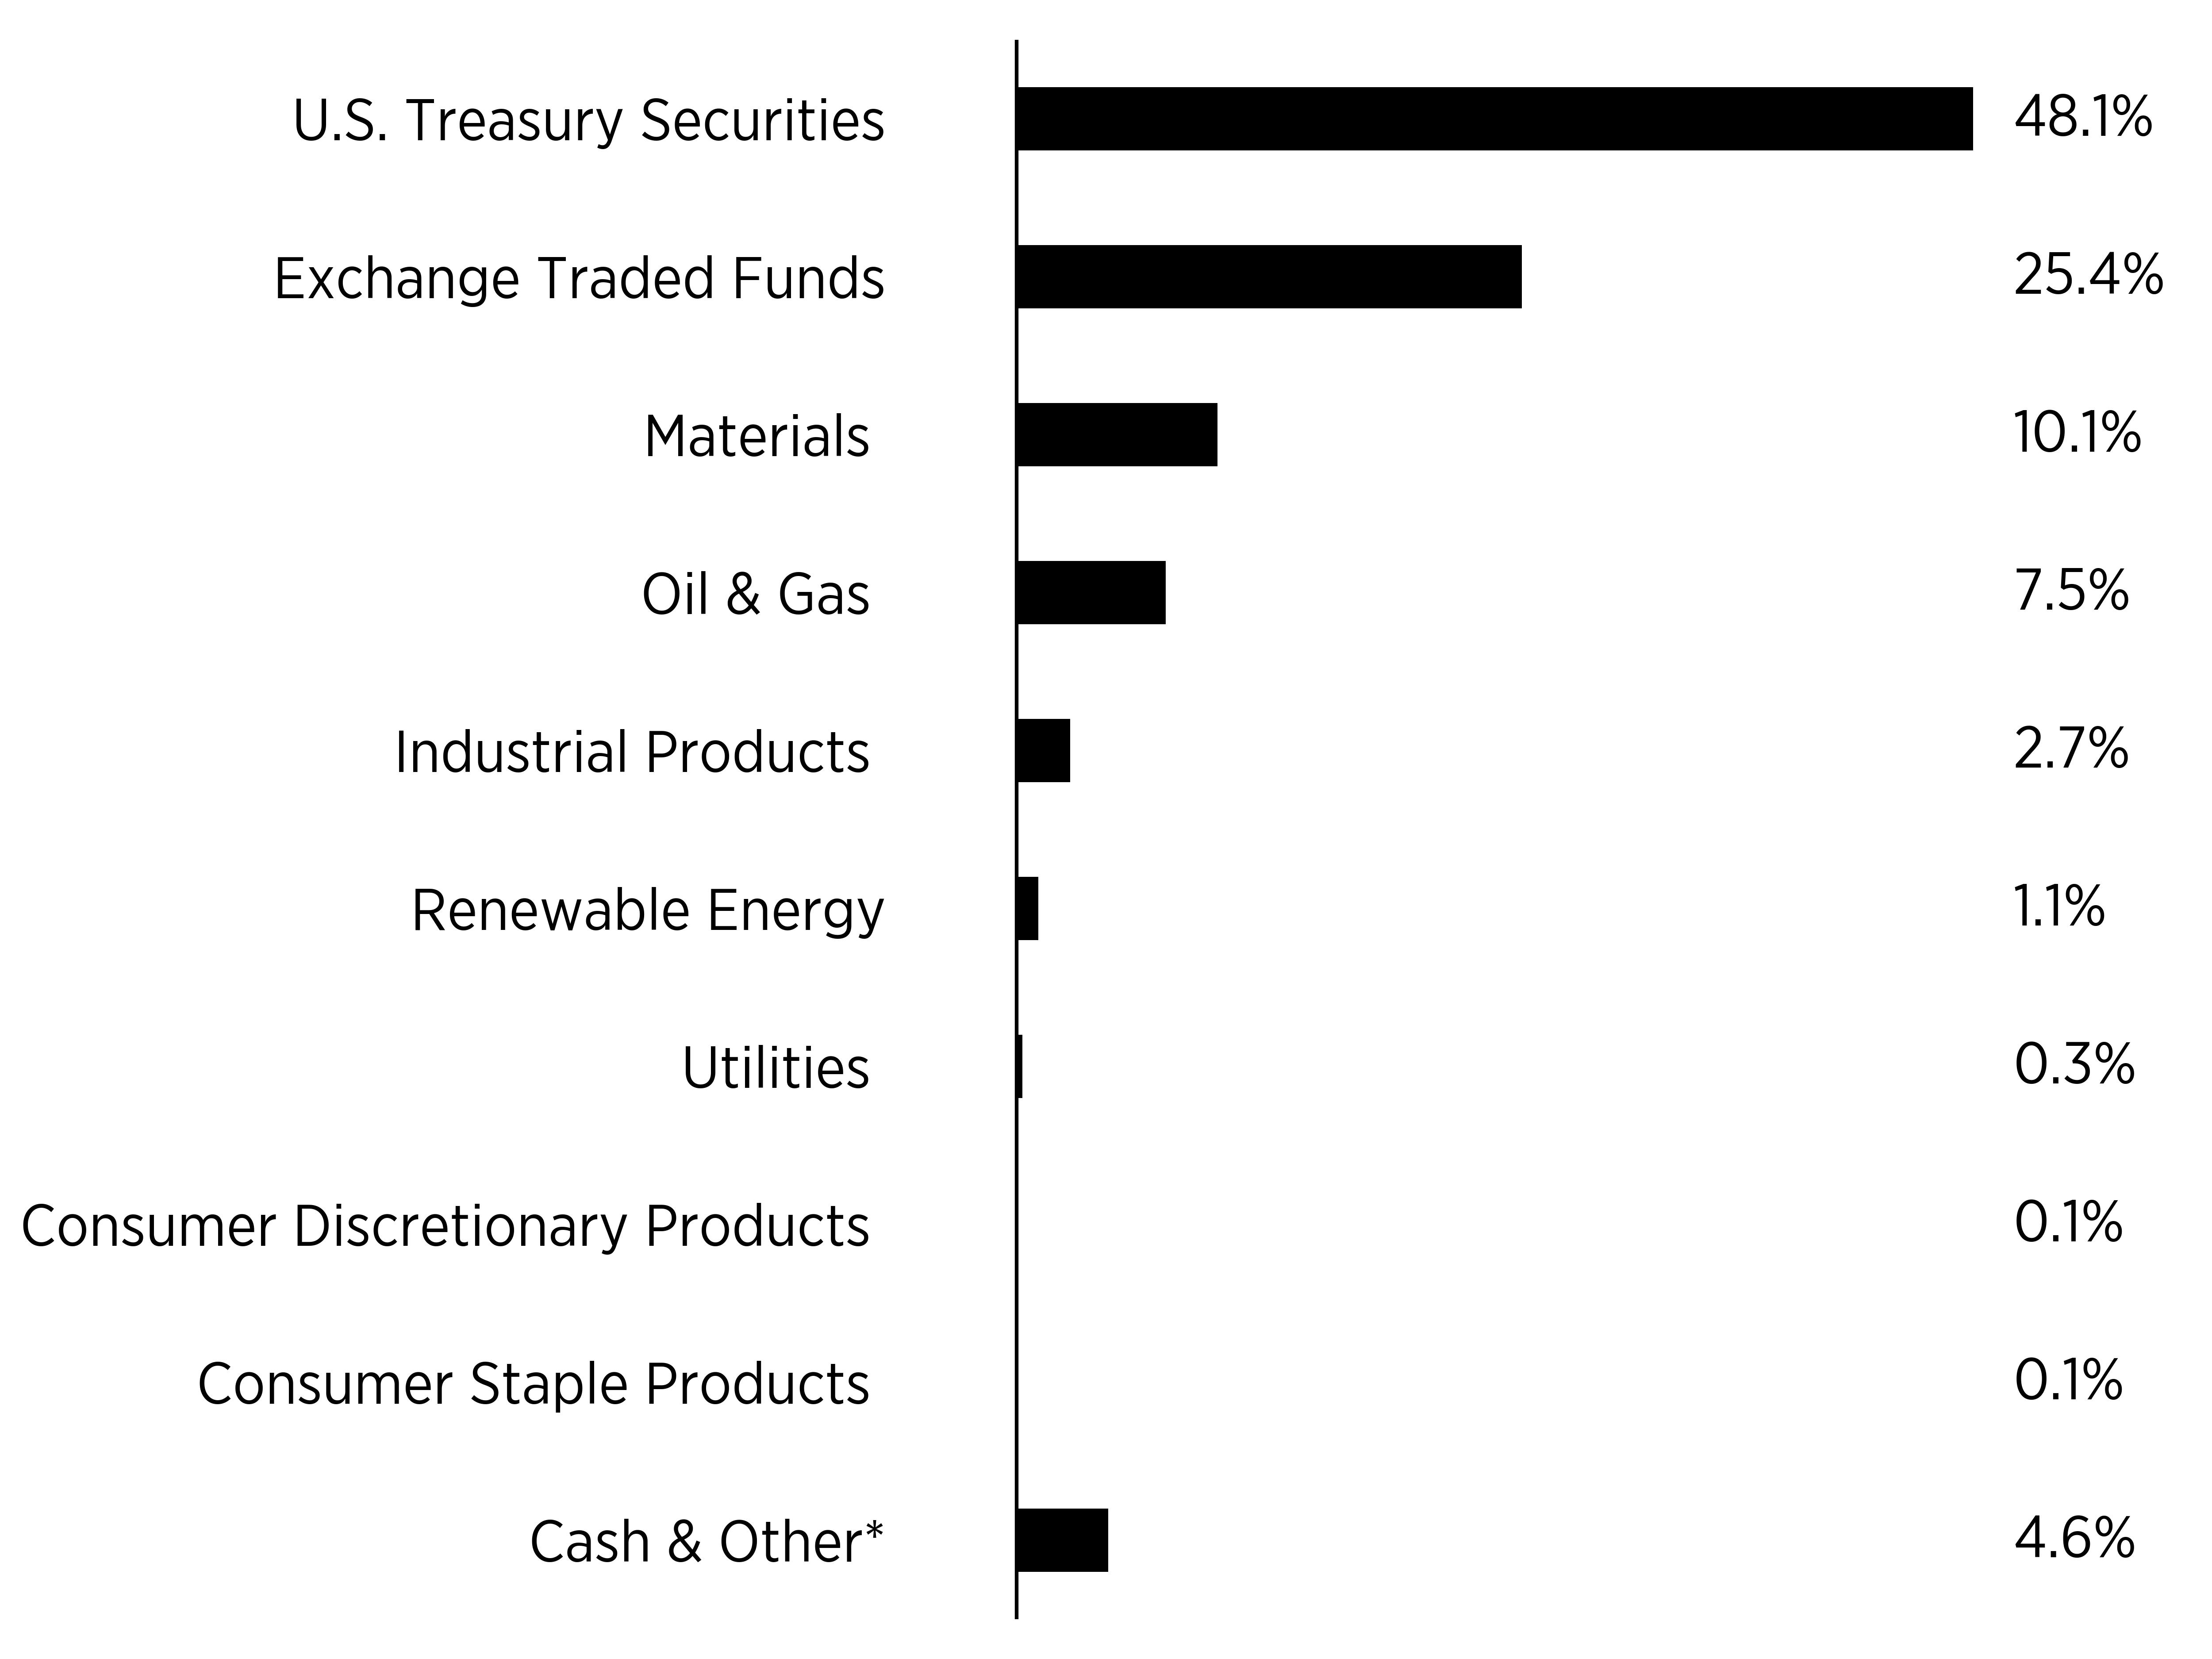
| * | Includes Futures Contracts |
|
Top
Ten Holdings |
(% of total
net assets) |
|---|---|
|
SPDR
Gold MiniShares Trust |
|
|
U.S.
Treasury Inflation Indexed
Bonds
1.38%, 02/15/2044 |
|
|
Vanguard
FTSE Emerging
Markets
ETF |
|
|
U.S.
Treasury Inflation Indexed
Bonds
1.00%, 02/15/2046 |
|
|
U.S.
Treasury Inflation Indexed
Bonds
0.75%, 02/15/2042 |
|
|
U.S.
Treasury Inflation Indexed
Bonds
0.75%, 02/15/2045 |
|
|
U.S.
Treasury Inflation Indexed
Bonds
0.63%, 02/15/2043 |
|
|
U.S.
Treasury Inflation Indexed
Bonds
0.88%, 02/15/2047 |
|
|
U.S.
Treasury Inflation Indexed
Bonds
1.00%, 02/15/2048 |
|
|
U.S.
Treasury Inflation Indexed
Bonds
2.13%, 02/15/2041 |
How has the Fund Changed?
Effective August 1, 2025, U.S. Bancorp Fund Services, LLC, doing business as Global Fund Services, no longer serves as the Sub-Administrator for each series of Tidal Trust I, including the Fund.