What were the Fund costs for the period?
(based on a hypothetical $10,000 investment)
Fund Name | Costs of a $10,000 investment* | Costs paid as a percentage of a $10,000 investment** |
|---|---|---|
SMART Earnings Growth 30 ETF | $25 | 0.59% |
| * | The Fund commenced operations on August 19, 2025. Expenses for a full reporting period would be higher than figures shown. |
| ** | Cost paid as a percentage of a $10,000 investment is an annualized figure. |
How did the Fund perform in the past period?
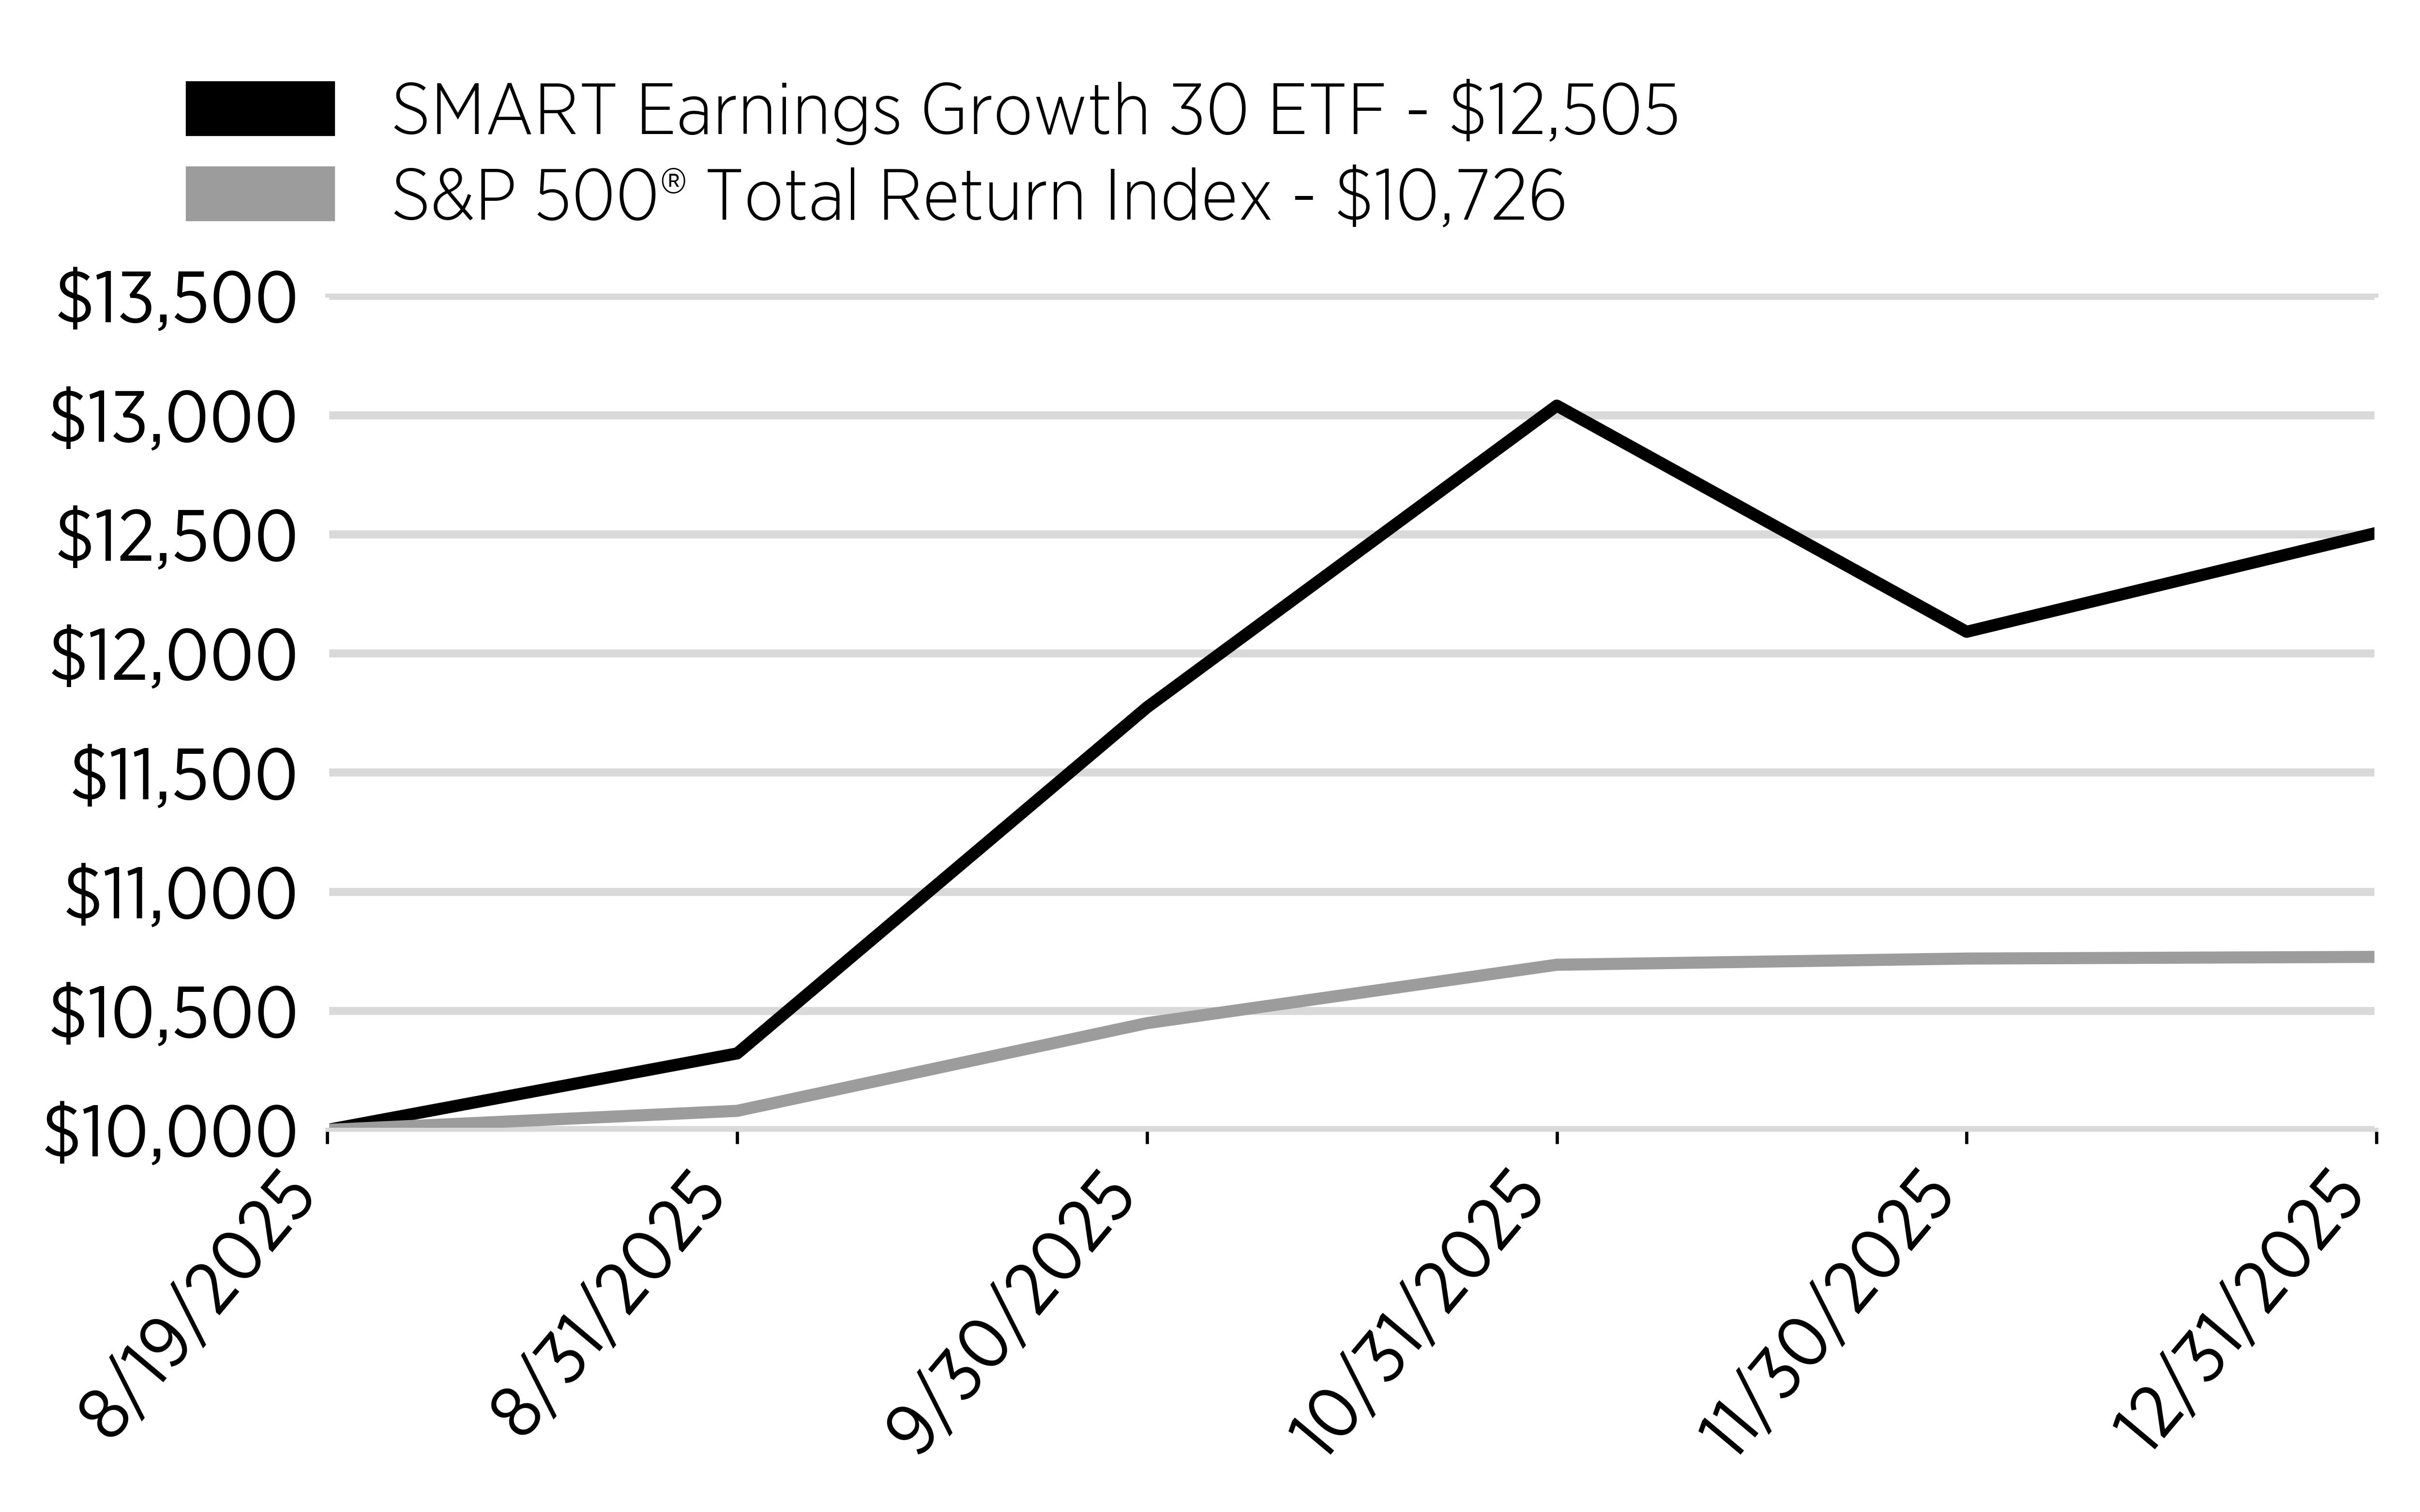
The SMART Earnings Growth 30 ETF (“SGRT”) delivered strong results since inception returning 25.05% for the fiscal period ended December 31, 2025, significantly outperforming the S&P 500® Total Return Index which returned 7.26%, while generating meaningful positive alpha. This outperformance reflects the disciplined stock selection process and the concentrated portfolio construction, which typically consists of approximately 30 high-conviction companies.
What Factors Influenced Performance?
The higher concentration of the portfolio increased the Fund’s sensitivity to market movements, resulting in a higher beta profile. This structure enabled SGRT to capture a greater share of market upside during favorable conditions, producing a larger margin of benchmark outperformance and higher alpha relative to the S&P 500® Total Return Index. While this approach can lead to increased volatility, it remains a deliberate component of the Fund’s long-term capital appreciation objective.
Cumulative Performance
(Initial Investment of $10,000)
Annual Performance
Average Annual Total Returns for the Period Ended December 31, 2025 | Since Inception (08/19/2025) |
|---|---|
SMART Earnings Growth 30 ETF | 25.05% |
S&P 500® Total Return Index | 7.26% |
Key Fund Statistics
(as of December 31, 2025)
Fund Size (Thousands) | $31,839 |
Number of Holdings | 25 |
Total Advisory Fee Paid | $31,926 |
Portfolio Turnover Rate | 175% |
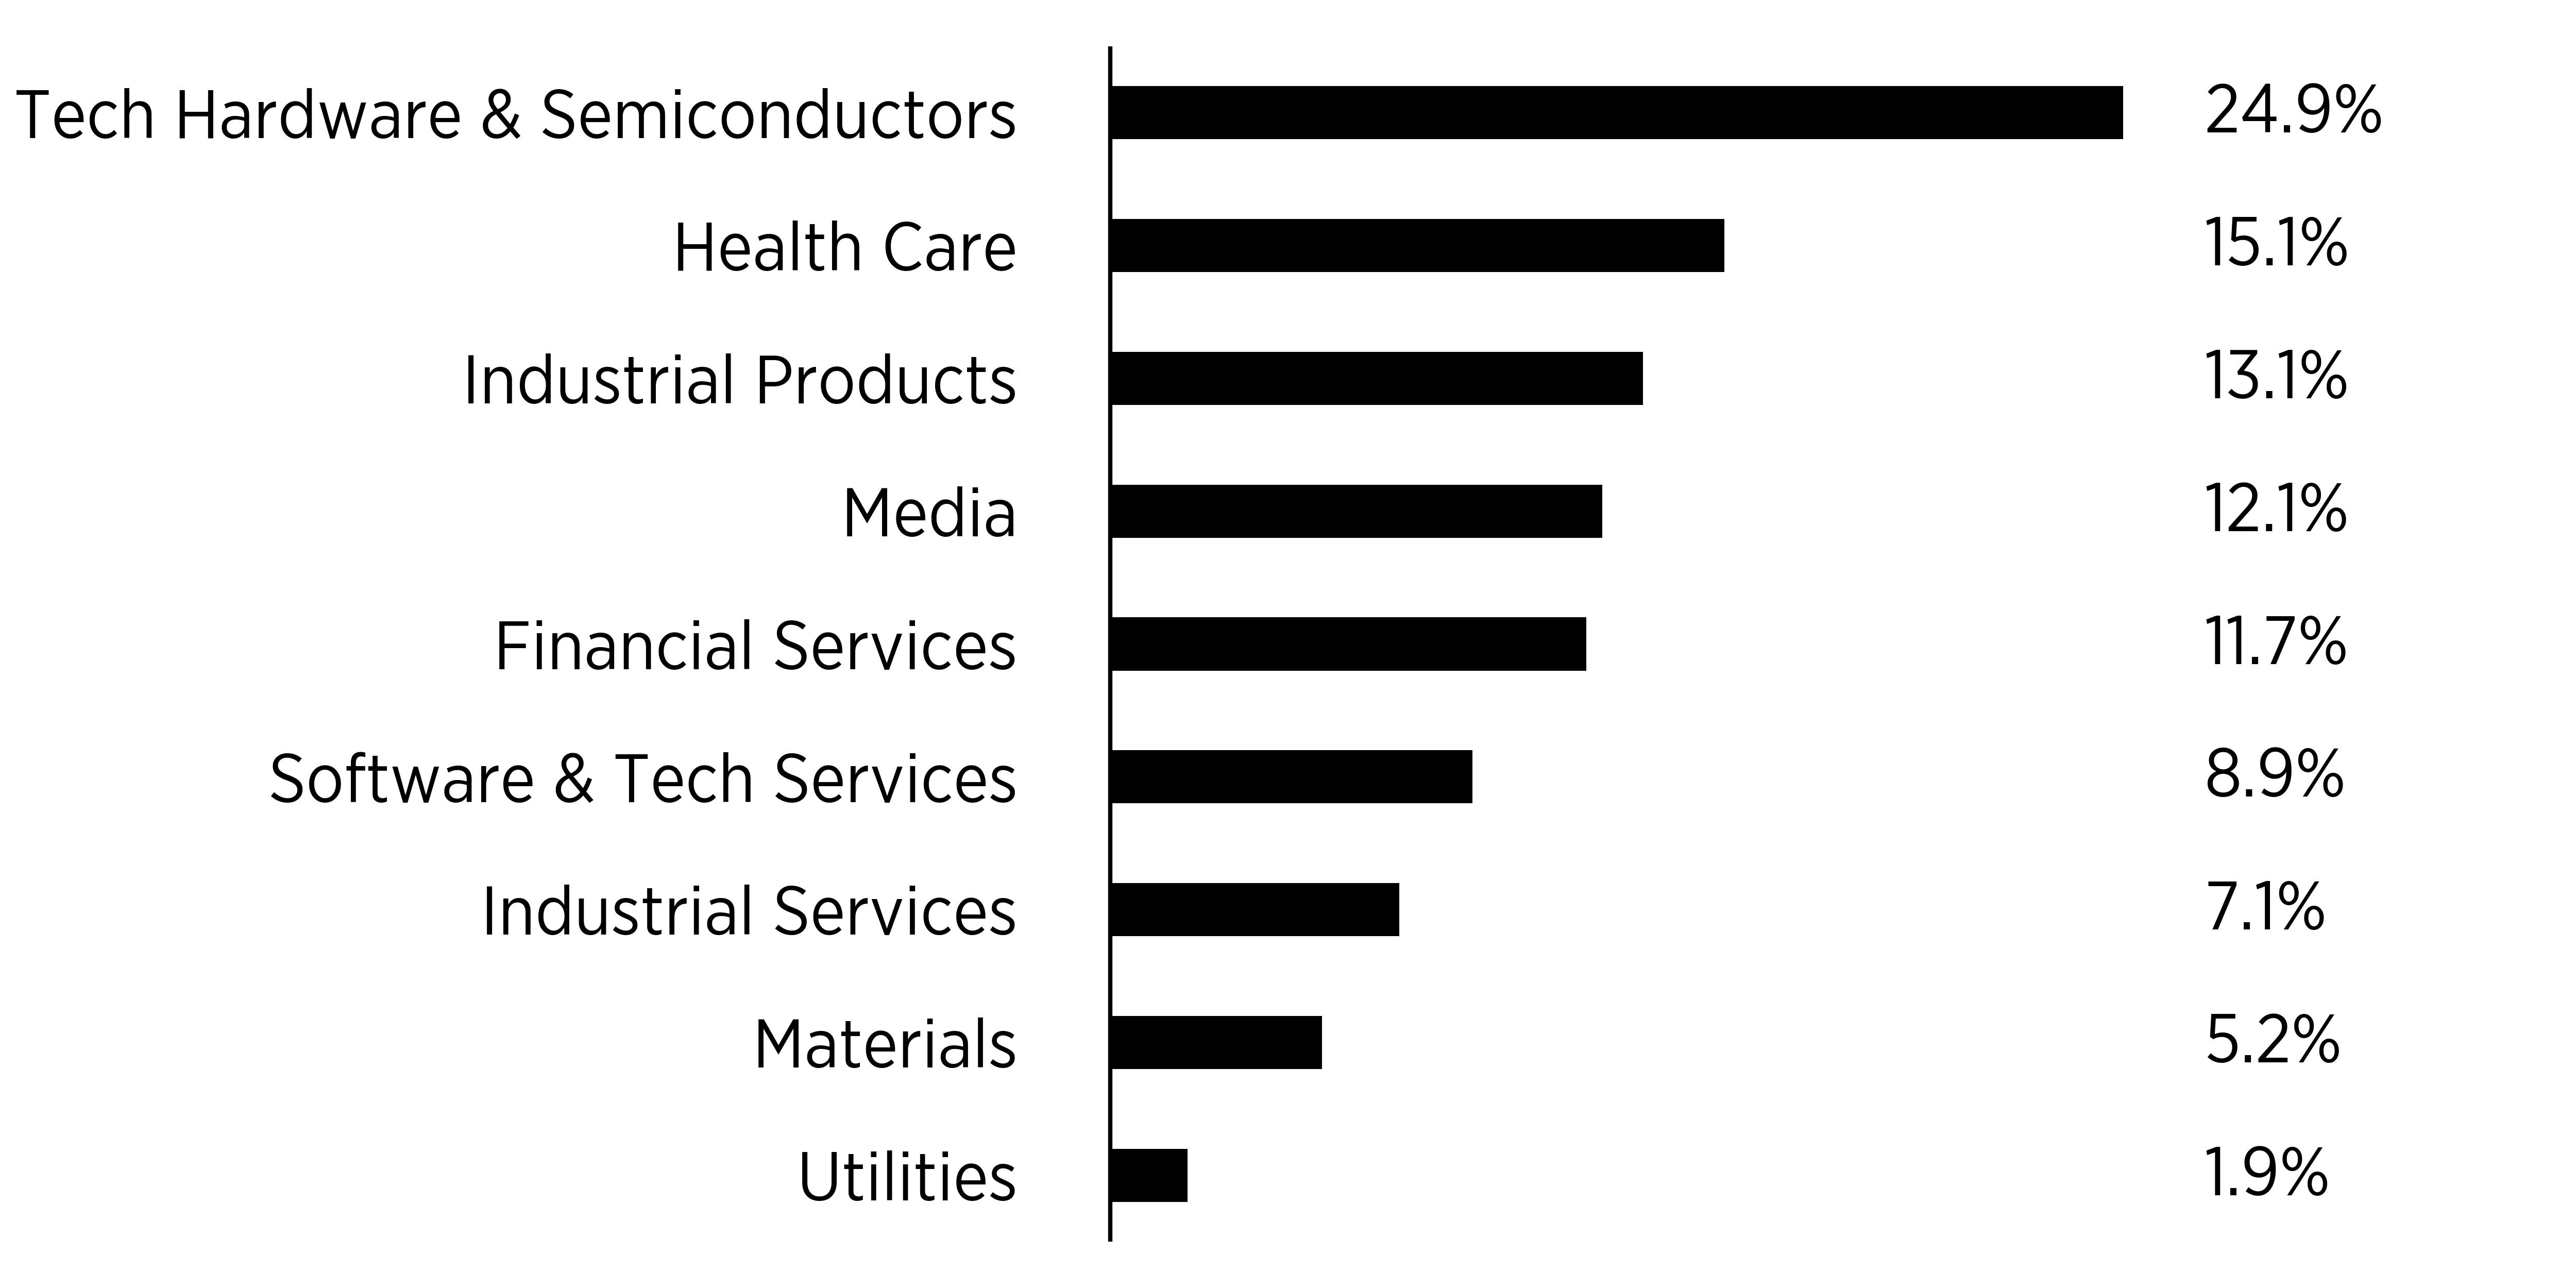
What did the Fund invest in?
(as of December 31, 2025)
Sector Breakdown
(% of total net assets)
Top Ten Holdings | (% of total net assets) |
|---|---|
Eli Lilly & Co. | |
Micron Technology, Inc. | |
AppLovin Corp. - Class A | |
Palantir Technologies, Inc. - Class A | |
Capital One Financial Corp. | |
Amphenol Corp. | |
Broadcom, Inc. | |
Lumentum Holdings, Inc. | |
Corning, Inc. | |
Comfort Systems USA, Inc. |
What were the Fund costs for the period?
(based on a hypothetical $10,000 investment)
Fund Name | Costs of a $10,000 investment* | Costs paid as a percentage of a $10,000 investment** |
|---|---|---|
SMART Trend 25 ETF | $23 | 0.59% |
| * | The Fund commenced operations on August 19, 2025. Expenses for a full reporting period would be higher than figures shown. |
| ** | Cost paid as a percentage of a $10,000 investment is an annualized figure. |
How did the Fund perform in the past period?
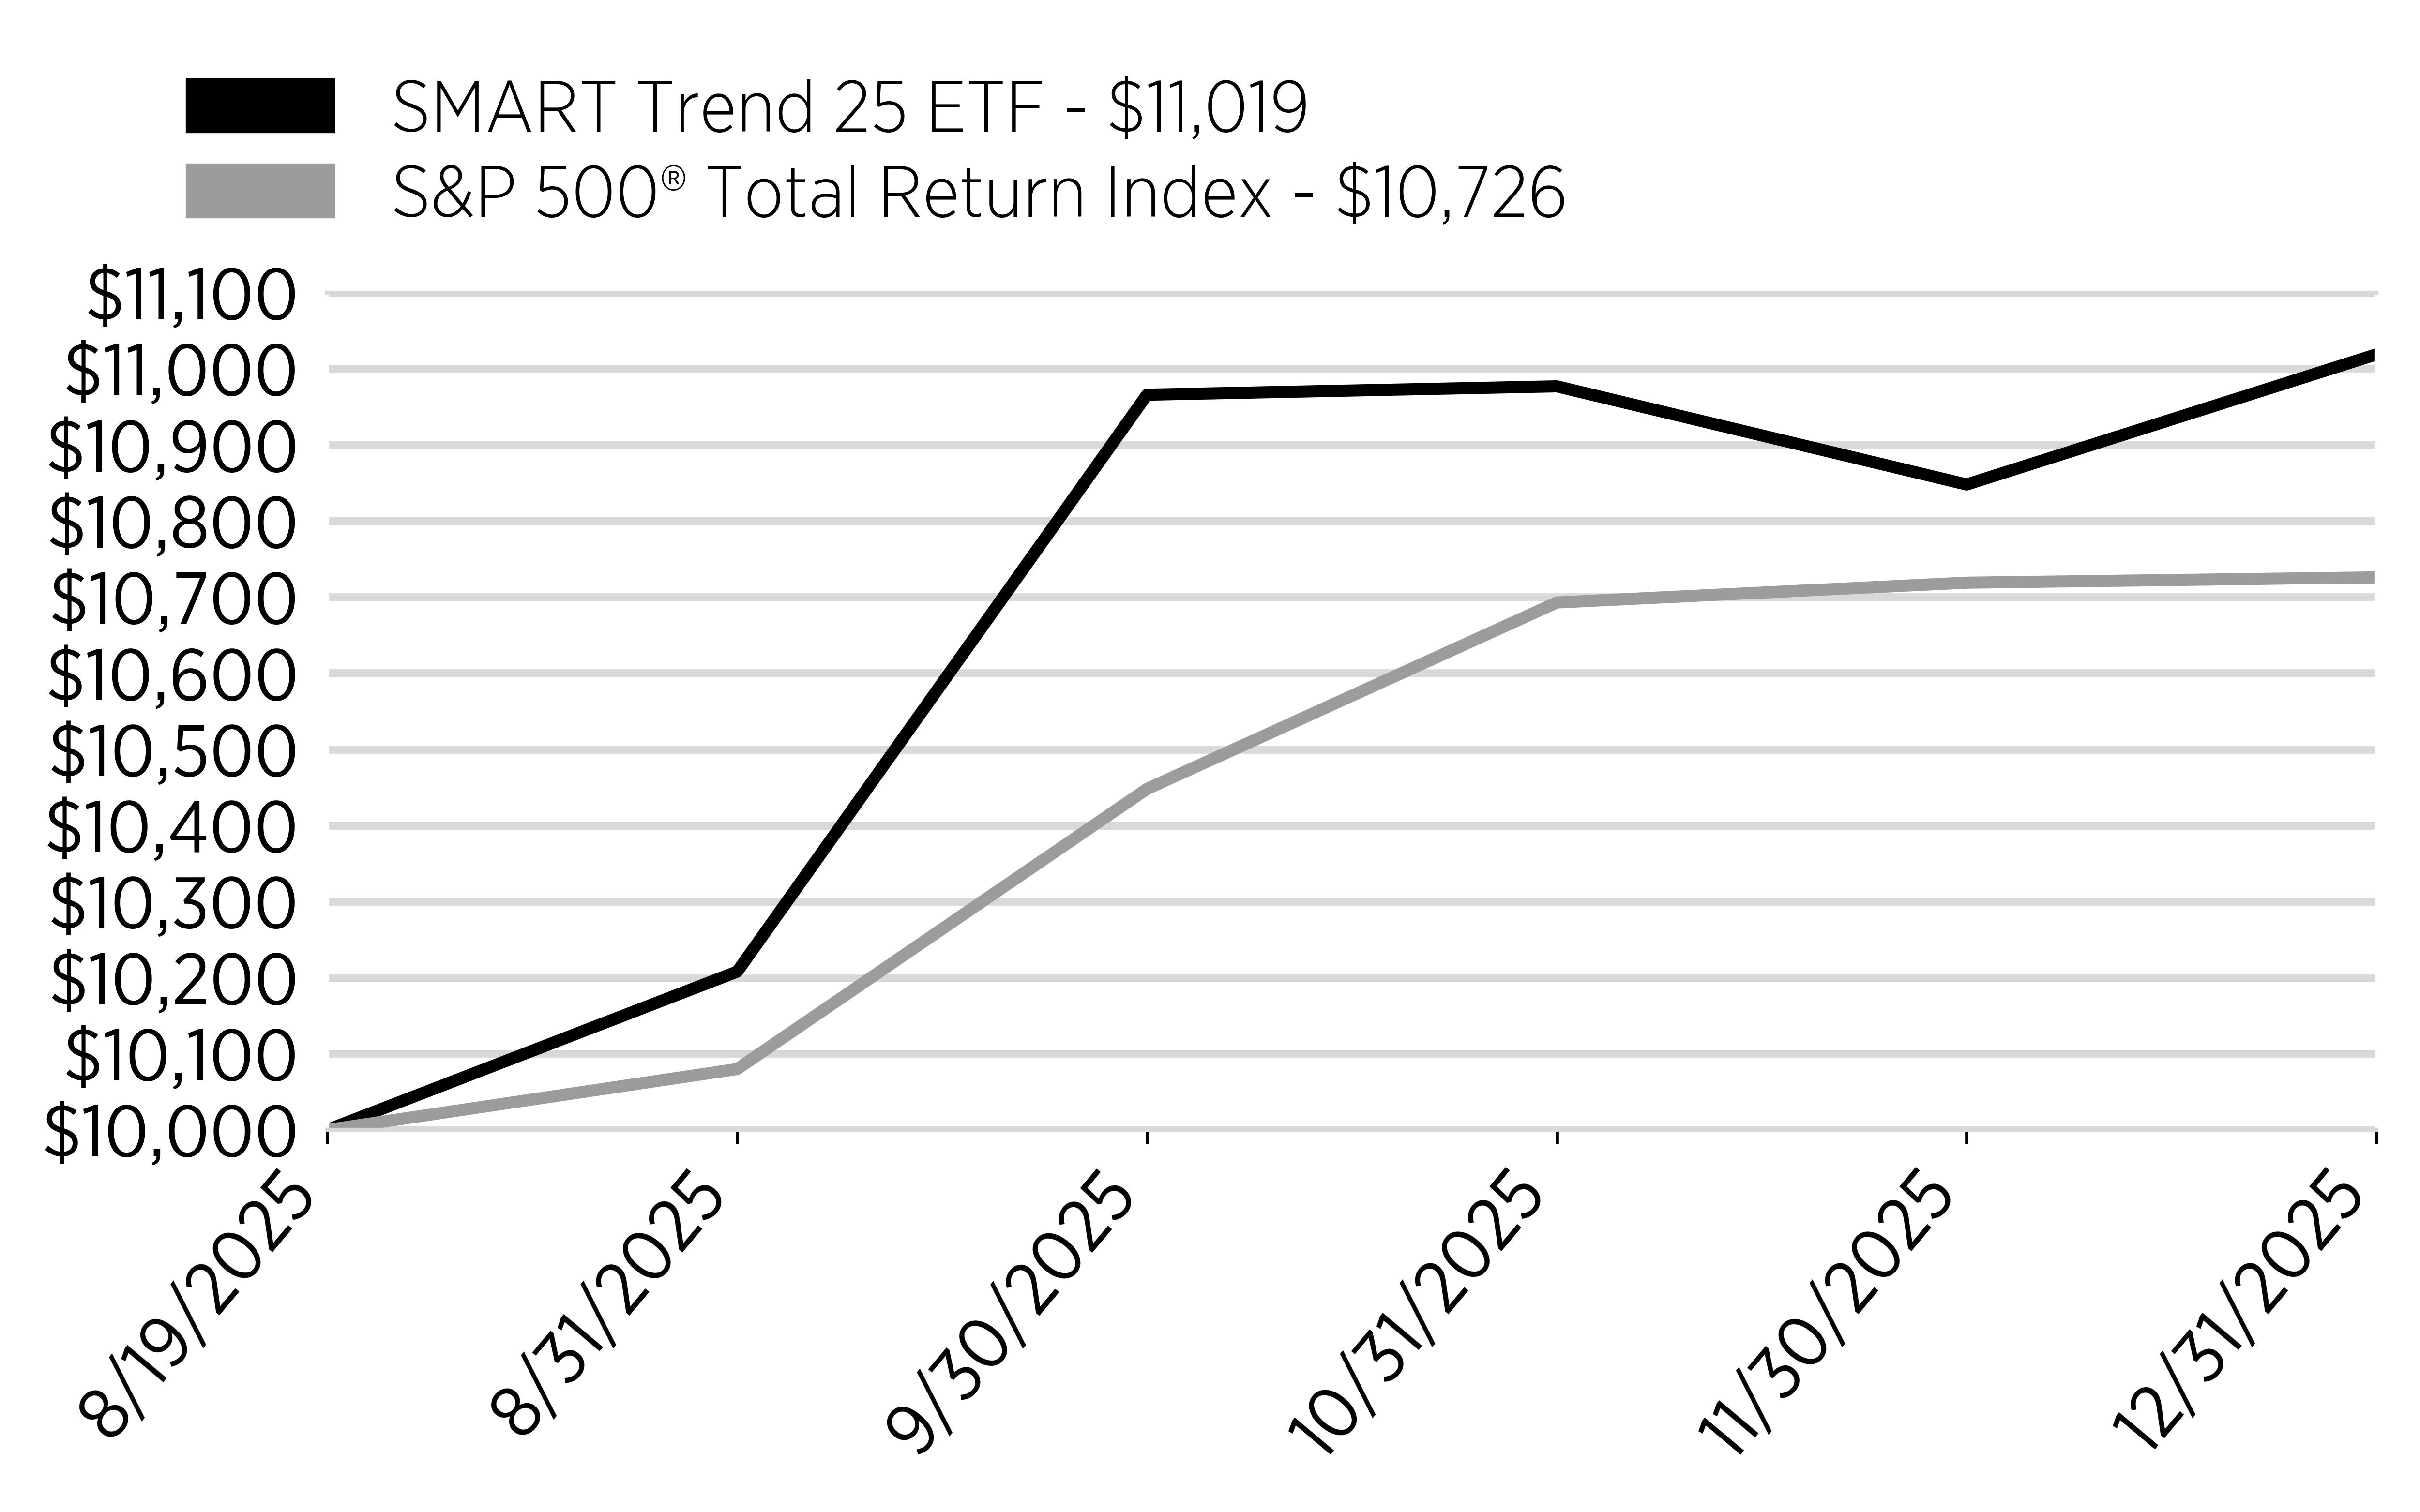
The SMART Trend 25 ETF (“STRN”) delivered strong results since inception returning 10.19% for the fiscal period ended December 31, 2025, outperforming the S&P 500® Total Return Index which returned 7.26%, and generating positive alpha. This performance was driven by a disciplined stock selection process, combined with a more balanced portfolio structure that typically holds approximately 25 companies.
What Factors Influenced Performance?
STRN’s lower concentration resulted in a reduced beta profile and lower overall volatility. While this led to a more moderate level of alpha generation, the Fund still delivered clear excess returns over the benchmark, providing investors with a smoother return profile while participating meaningfully in market upside. This balance reflects STRN’s strategy of capturing market trends while managing risk more conservatively.
Cumulative Performance
(Initial Investment of $10,000)
Annual Performance
Average Annual Total Returns for the Period Ended December 31, 2025 | Since Inception (08/19/2025) |
|---|---|
SMART Trend 25 ETF | 10.19% |
S&P 500® Total Return Index | 7.26% |
Key Fund Statistics
(as of December 31, 2025)
Fund Size (Thousands) | $10,449 |
Number of Holdings | 26 |
Total Advisory Fee Paid | $19,106 |
Portfolio Turnover Rate | 183% |
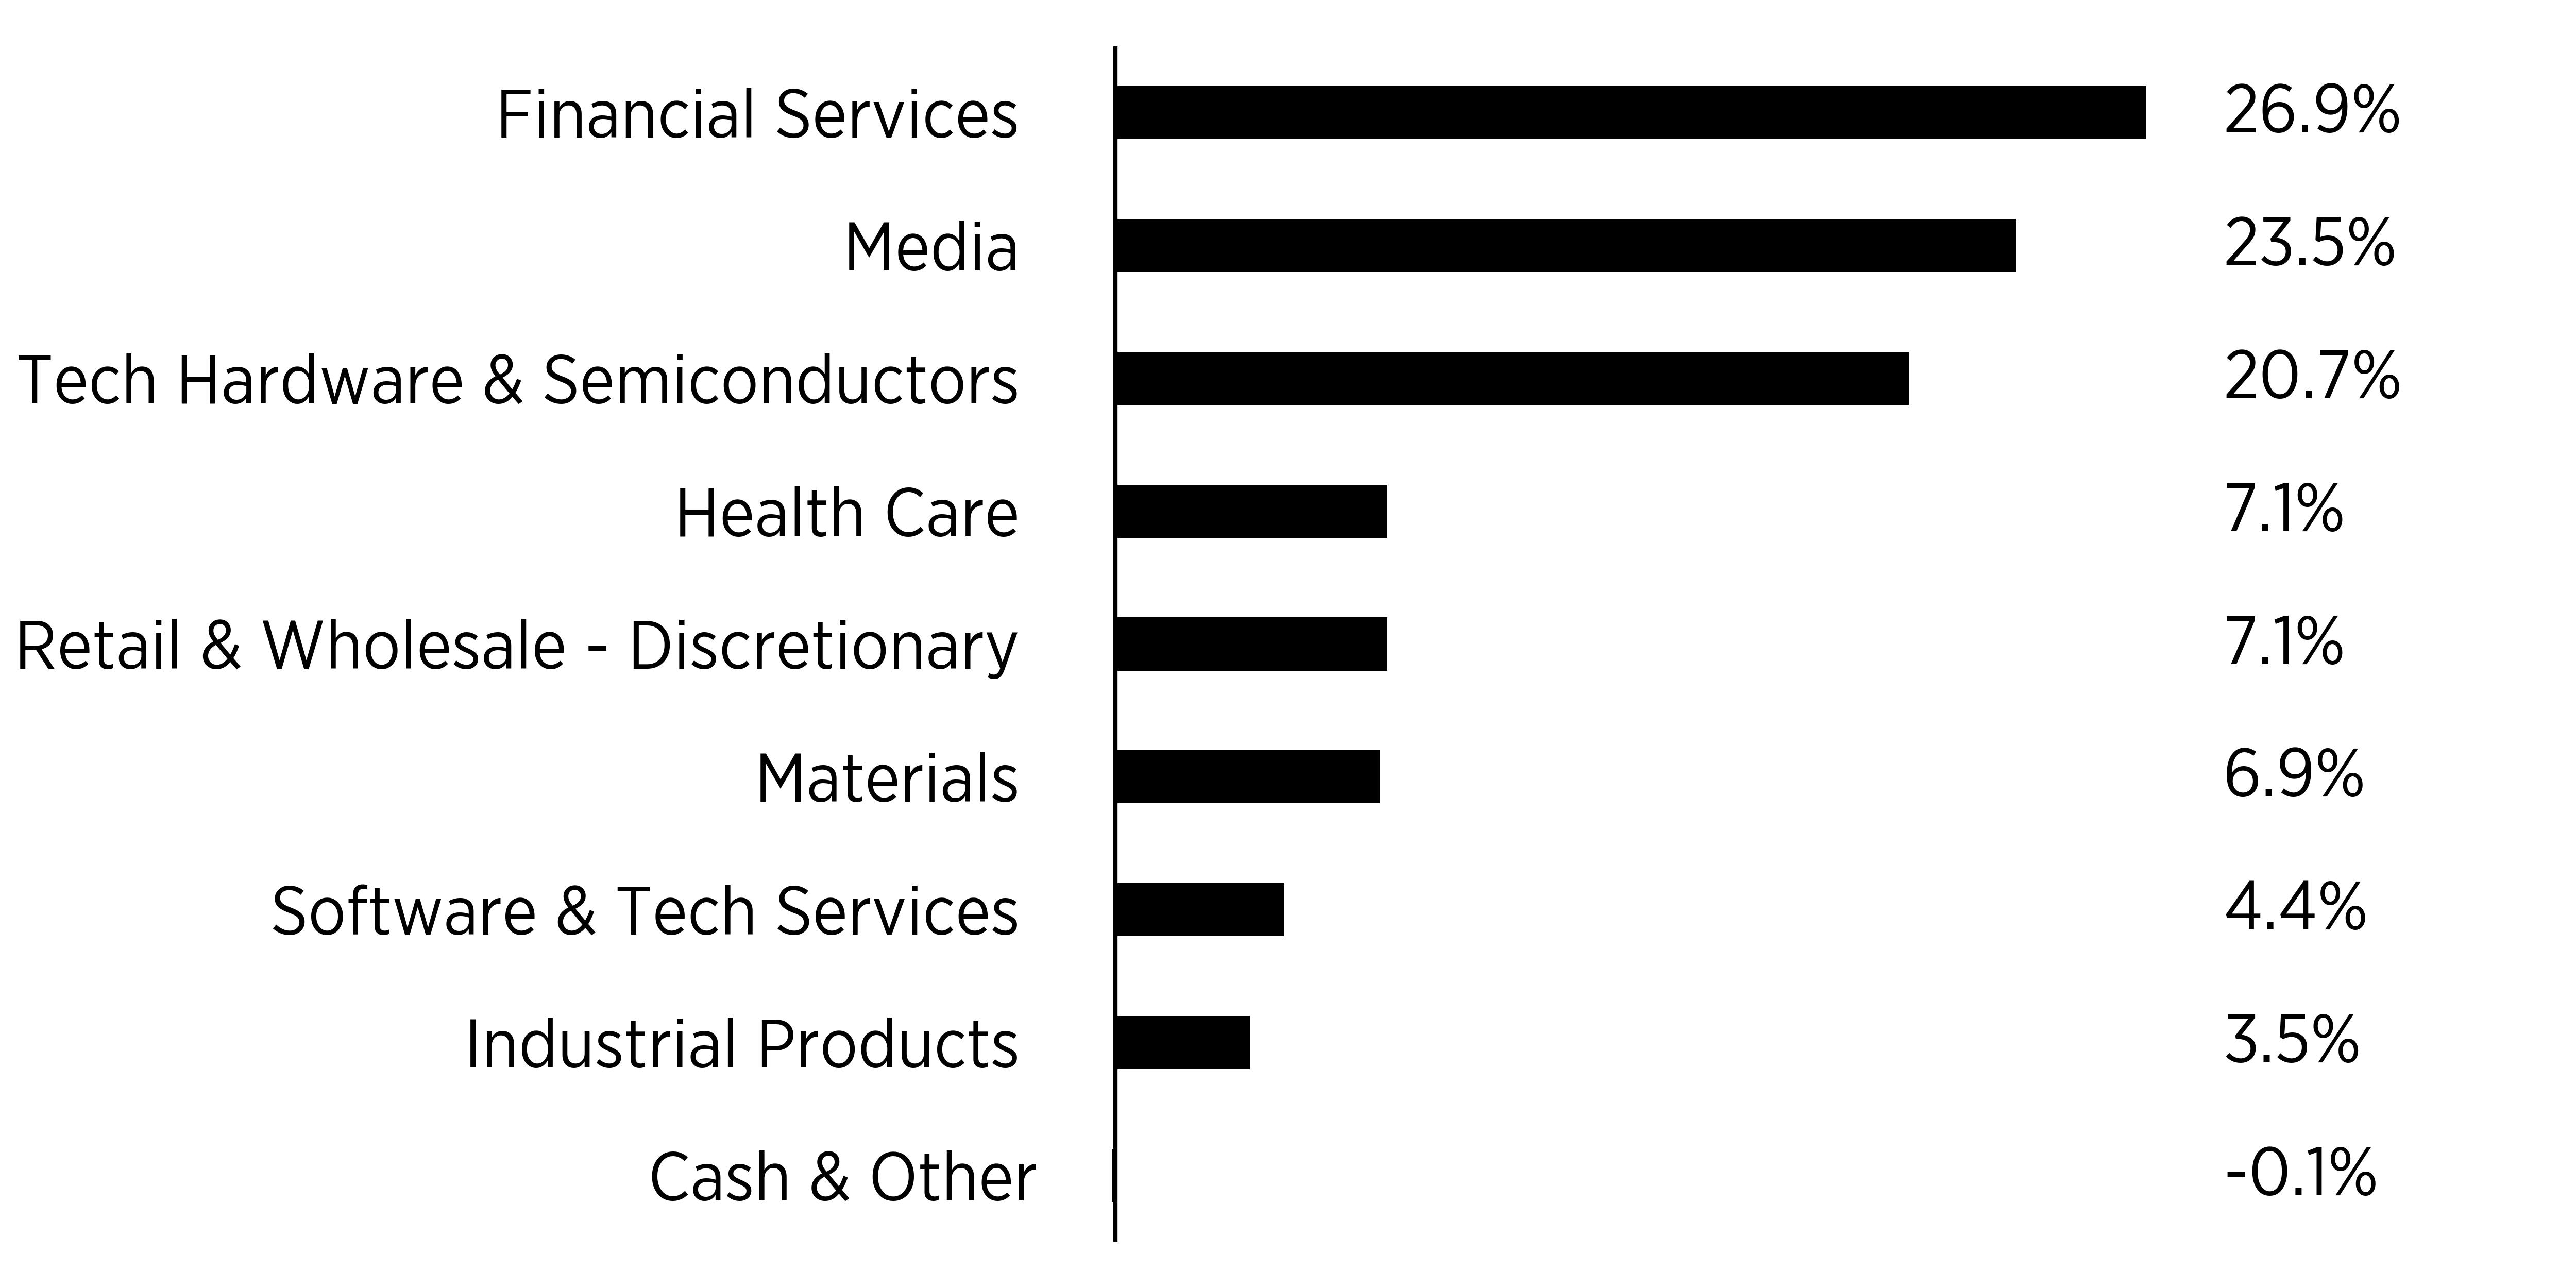
What did the Fund invest in?
(as of December 31, 2025)
Sector Breakdown
(% of total net assets)
Top Ten Holdings | (% of total net assets) |
|---|---|
Alphabet, Inc. - Class C | |
Alphabet, Inc. - Class A | |
Amazon.com, Inc. | |
Eli Lilly & Co. | |
Newmont Corp. | |
Charles Schwab Corp. | |
Capital One Financial Corp. | |
Goldman Sachs Group, Inc. | |
Advanced Micro Devices, Inc. | |
Micron Technology, Inc. |
| [1] | The Fund commenced operations on August 19, 2025. Expenses for a full reporting period would be higher than figures shown. |
| [2] | Cost paid as a percentage of a $10,000 investment is an annualized figure. |
| [3] | The Fund commenced operations on August 19, 2025. Expenses for a full reporting period would be higher than figures shown. |
| [4] | Cost paid as a percentage of a $10,000 investment is an annualized figure. |