Pay vs Performance Disclosure - USD ($)
|
12 Months Ended |
Dec. 31, 2025 |
Dec. 31, 2024 |
Dec. 31, 2023 |
Dec. 31, 2022 |
Dec. 31, 2021 |
| Pay vs Performance Disclosure |
|
|
|
|
|
| Pay vs Performance Disclosure, Table |
| | | | | | | | | | | | | | | | | | | | | | | | | | | | | Value of Initial Fixed $100 Investment Based On | | | Year | Summary Compensation Table Total for PEO | Compensation Actually Paid to PEO (1) | Average Summary Compensation Table Total for non-PEO NEOs (2) | Average Compensation Actually Paid to non-PEO NEOs (2) (3) | Total Shareholder Return | Peer Group Total Shareholder Return (4) | Net Income (5)
(in millions) | Adjusted income before income taxes
(in millions) | | 2025 | $ | 8,421,321 | | $ | 14,802,557 | | $ | 2,018,534 | | $ | 3,075,654 | | $ | 339 | | $ | 243 | | $ | 246.6 | | $ | 343.0 | | | 2024 | $ | 7,581,191 | | $ | 15,672,266 | | $ | 1,805,763 | | $ | 3,159,189 | | $ | 299 | | $ | 226 | | $ | 216.3 | | $ | 271.8 | | | 2023 | $ | 6,869,679 | | $ | 15,037,969 | | $ | 1,694,608 | | $ | 3,120,837 | | $ | 247 | | $ | 192 | | $ | 157.4 | | $ | 204.9 | | | 2022 | $ | 5,651,831 | | $ | 7,494,328 | | $ | 1,380,407 | | $ | 1,714,048 | | $ | 148 | | $ | 139 | | $ | 120.4 | | $ | 150.5 | | | 2021 | $ | 4,672,213 | | $ | 7,323,731 | | $ | 1,158,235 | | $ | 1,611,497 | | $ | 137 | | $ | 145 | | $ | 100.6 | | $ | 128.0 | |
|
|
|
|
|
| Named Executive Officers, Footnote |
The Company’s non-PEO NEOs for 2025 and 2024 were Mr. Weber, Mr. Hudson, Ms. Bonina and Mr. Boeschen. The Company’s non-PEO NEOs for 2023 and 2022 were Mr. Weber, Mr. Hudson, Ms. Bonina and Lauren B. Elting (who served as Vice President, Chief Accounting Officer and Corporate Controller during 2023, 2022, and 2021). For 2021, the Company’s non-PEO NEOs were Mr. Weber, Mr. Hudson, Daniel A. DuPré (Ms. Bonina’s predecessor as Vice President and General Counsel) and Ms. Elting.
|
|
|
|
|
| Peer Group Issuers, Footnote |
This peer group represents the S&P 600 Capital Goods Index.
|
|
|
|
|
| PEO Total Compensation Amount |
$ 8,421,321
|
$ 7,581,191
|
$ 6,869,679
|
$ 5,651,831
|
$ 4,672,213
|
| PEO Actually Paid Compensation Amount |
$ 14,802,557
|
15,672,266
|
15,037,969
|
7,494,328
|
7,323,731
|
| Adjustment To PEO Compensation, Footnote |
The following summarizes the amounts deducted from and added to the Summary Compensation Table total for Ms. Sherman, the Company’s PEO, to arrive at Compensation Actually Paid to PEO: | | | | | | | | | | | | | | | | | | | 2025 | 2024 | 2023 | 2022 | 2021 | | Summary Compensation Table Total | $ | 8,421,321 | | $ | 7,581,191 | | $ | 6,869,679 | | $ | 5,651,831 | | $ | 4,672,213 | | | Amounts reported in the Summary Compensation Table as Stock Awards and Option Awards granted during the applicable year which are based on grant date fair values | $ | (4,847,498) | | $ | (4,199,990) | | $ | (3,599,988) | | $ | (3,199,999) | | $ | (2,899,994) | | | Fair value as of the end of the applicable year of equity awards granted during the applicable year which remain outstanding and unvested as of the end of the applicable year (6) | $ | 6,437,879 | | $ | 4,798,063 | | $ | 5,996,940 | | $ | 4,575,494 | | $ | 2,917,931 | | | Change in fair value during the applicable year of awards granted in prior years that remain outstanding and unvested as of the end of the applicable year (6) | $ | 1,363,043 | | $ | 1,903,037 | | $ | 4,353,841 | | $ | 438,214 | | $ | 1,522,577 | | | | | | | | | Change in fair value from the end of the prior applicable year to the vesting date for awards granted in prior years that vested during the applicable year (6) | $ | 3,458,591 | | $ | 5,592,348 | | $ | 1,454,417 | | $ | 28,788 | | $ | 1,111,004 | | | Aggregate change in actuarial present value of accumulated defined pension benefit | $ | (30,779) | | $ | (2,383) | | $ | (36,920) | | $ | — | | $ | — | | | Compensation Actually Paid Total | $ | 14,802,557 | | $ | 15,672,266 | | $ | 15,037,969 | | $ | 7,494,328 | | $ | 7,323,731 | |
|
|
|
|
|
| Non-PEO NEO Average Total Compensation Amount |
$ 2,018,534
|
1,805,763
|
1,694,608
|
1,380,407
|
1,158,235
|
| Non-PEO NEO Average Compensation Actually Paid Amount |
$ 3,075,654
|
3,159,189
|
3,120,837
|
1,714,048
|
1,611,497
|
| Adjustment to Non-PEO NEO Compensation Footnote |
The following summarizes the amounts deducted from and added to the Average Summary Compensation Table total for our non-PEO NEOs to arrive at Average Compensation Actually Paid to non-PEO NEOs: | | | | | | | | | | | | | | | | | | | 2025 | 2024 | 2023 | 2022 | 2021 | | Summary Compensation Table Total | $ | 2,018,534 | | $ | 1,805,763 | | $ | 1,694,608 | | $ | 1,380,407 | | $ | 1,158,235 | | | Amounts reported in the Summary Compensation Table as Stock Awards and Option Awards granted during the applicable year which are based on grant date fair values | $ | (781,238) | | $ | (677,486) | | $ | (651,244) | | $ | (606,243) | | $ | (520,989) | | | Fair value as of the end of the applicable year of equity awards granted during the applicable year which remain outstanding and unvested as of the end of the applicable year (6) | $ | 1,037,542 | | $ | 773,957 | | $ | 1,084,865 | | $ | 863,724 | | $ | 524,212 | | | Change in fair value during the applicable year of awards granted in prior years that remain outstanding and unvested as of the end of the applicable year (6) | $ | 223,384 | | $ | 325,991 | | $ | 761,118 | | $ | 64,775 | | $ | 269,604 | | | | | | | | | Change in fair value from the end of the prior applicable year to the vesting date for awards granted in prior years that vested during the applicable year (6) | $ | 577,432 | | $ | 930,964 | | $ | 231,490 | | $ | 11,385 | | $ | 180,435 | | | | | | | | | Compensation Actually Paid Total | $ | 3,075,654 | | $ | 3,159,189 | | $ | 3,120,837 | | $ | 1,714,048 | | $ | 1,611,497 | |
|
|
|
|
|
| Equity Valuation Assumption Difference, Footnote |
In recomputing the fair value of equity awards, the Company used the same methodology as that which was used to initially determine fair value for financial reporting purposes. The fair value of stock options was determined using a Black-Scholes option pricing model. The fair value of PSUs was determined using either the Company’s closing stock price as of the applicable date, or a Monte Carlo simulation model, as applicable. The fair value of restricted stock was determined using the Company’s closing stock price as of the applicable date. The primary driver of the current-year increase in fair value of outstanding equity awards from the amounts initially reported in the Summary Compensation Table was the increase in the Company’s stock price. The primary drivers of the current-year increase in fair value of equity awards that vested during 2025 were the increase in the Company’s stock price and the effects of the 2023 PSUs, which vested on December 31, 2025, being earned at 200% of target.
|
|
|
|
|
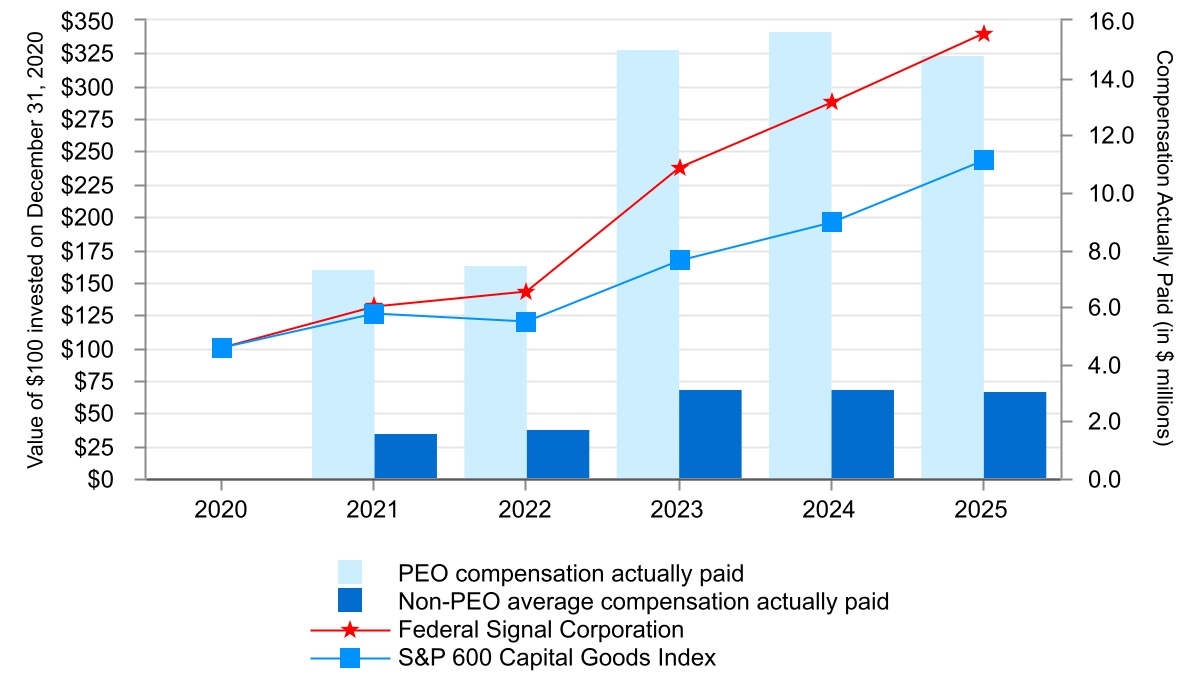
| Compensation Actually Paid vs. Total Shareholder Return |
On an enterprise level, consistent with our pay-for-performance philosophy, we set aggressive performance metrics for performance awards. Since 2022, PSUs awarded to our NEOs have included a TSR modifier to align with the interests of stockholders. For PSUs granted in fiscal year 2023, the performance period was the three-year period ended on December 31, 2025. Based on the achievement against targets over the three-year performance period, 200% of shares were earned under the two performance conditions. Because the Company’s TSR over the performance period was not in the top or bottom quartile of the S&P Capital Goods 600 Index, the TSR modifier did not apply, resulting in 200% of the overall target shares being earned. •The following graph compares the cumulative total return to stockholders of the Company’s common stock relative to the cumulative total return of the S&P 600 Capital Goods Index over the five-year period from 2021 to 2025. The graph assumes that the value of the investment in the Company’s common stock, and in each index, was $100 on December 31, 2020 and assumes reinvestment of all dividends through December 31, 2025:
|
|
|
|
|
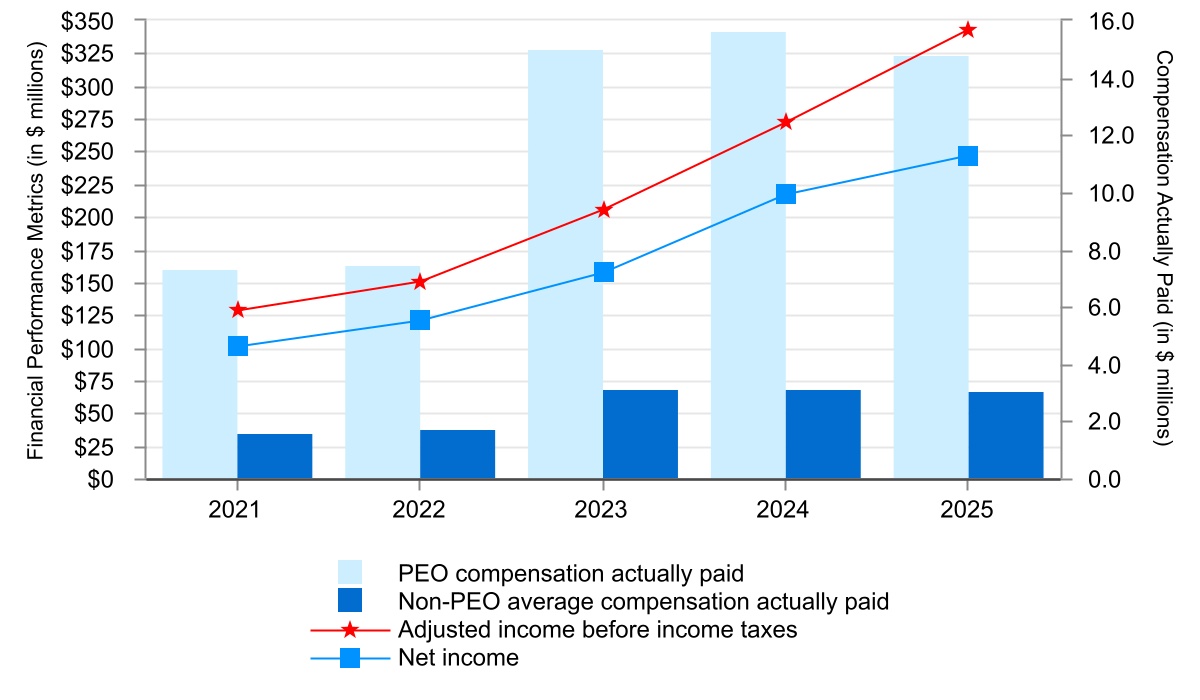
| Compensation Actually Paid vs. Net Income |
Although Net income and the relationship between Net income and compensation actually paid are disclosed herein, we do not use Net income as a financial-based metric in determining compensation levels or incentive plan payouts. Over the five-year period from 2021 to 2025, compensation actually paid to our PEO and the average compensation paid to non-PEO NEOs have generally aligned with the changes in our key financial performance metrics, as indicated in the graph below:
|
|
|
|
|
| Tabular List, Table |
| | | | | | | Adjusted income before income taxes* | Used as a key financial metric in the Company’s STIP program for 2025 (representing 60% of each NEOs’ total bonus opportunity); calculated by taking GAAP income before income taxes and adjusting for any unusual or nonrecurring items that were not contemplated in the annual target setting process (i.e., acquisition and integration-related expenses, net, debt settlement charges, and purchase accounting effects in 2025). | | Adjusted EBITDA margin* | Used as a key financial metric in the Company’s STIP program for 2025 (representing 20% of each NEOs’ total bonus opportunity); calculated by taking the sum of GAAP net income, interest expense, net, depreciation and amortization expense, other expense, net, income tax expense and any unusual or nonrecurring items that were not contemplated in the annual target setting process (i.e., acquisition and integration-related expenses, net, and purchase accounting effects in 2025), and dividing the total by net sales for the applicable period. Important metric when communicating with investors and other key stakeholders. | | Adjusted earnings per share (“EPS”)* | Calculated by taking GAAP net income, adjusted for any unusual or nonrecurring items that were not contemplated in the annual target setting process (i.e., acquisition and integration-related expenses, net, debt settlement charges, purchase accounting effects, and certain special tax items in 2025), and dividing the total by the weighted average diluted shares outstanding for the applicable period. Used as a key financial metric in NEOs’ LTIP awards, where 75% of the financial target is based on cumulative EPS over the applicable three-year performance period. | | Return on invested capital (“ROIC”)* | Calculated as net operating profit after taxes, divided by total invested capital for the applicable period. Used as a key financial metric in NEOs’ LTIP awards, where 25% of the financial target is based on average ROIC over the applicable three-year performance period. |
|
|
|
|
|
| Total Shareholder Return Amount |
$ 339,000,000
|
299,000,000
|
247,000,000
|
148,000,000
|
137,000,000
|
| Peer Group Total Shareholder Return Amount |
243,000,000
|
226,000,000
|
192,000,000
|
139,000,000
|
145,000,000
|
| Net Income (Loss) |
$ 246,600,000
|
$ 216,300,000
|
$ 157,400,000
|
$ 120,400,000
|
$ 100,600,000
|
| Company Selected Measure Amount |
343,000,000.0
|
271,800,000
|
204,900,000
|
150,500,000
|
128,000,000.0
|
| Additional 402(v) Disclosure |
For the year ended December 31, 2025, the Company generated adjusted income before income taxes of $343.0 million, which was $37.5 million, or 12%, ahead of the target for the year set for annual cash-based incentive purposes, and $6.9 million, or 2%, above the maximum payout level. On a year-over-year basis, the adjusted income before income taxes generated by the Company was up $71.2 million, or 26%. As a result, each of our NEOs earned 200% of target under the earnings component of the 2025 STIP. For the year ended December 31, 2025, the Company generated an adjusted EBITDA margin of 20.1%, which was 130 basis points ahead of the target for the year set for annual cash-based incentive purposes, and 10 basis points above the 20.0% required to achieve the maximum payout level. On a year-over-year basis, the adjusted EBITDA margin generated by the Company was up 130 basis points. As a result, each of our NEOs earned 200% of target under the EBITDA margin component of the 2025 STIP. •In recognition for their contributions to the Company during 2025, and performance against their individual objectives for the year, each of our NEOs earned the maximum level of achievement under the individual objective component of the 2025 STIP.
|
|
|
|
|
| Measure:: 1 |
|
|
|
|
|
| Pay vs Performance Disclosure |
|
|
|
|
|
| Name |
Adjusted income before income taxes*
|
|
|
|
|
| Non-GAAP Measure Description |
Used as a key financial metric in the Company’s STIP program for 2025 (representing 60% of each NEOs’ total bonus opportunity); calculated by taking GAAP income before income taxes and adjusting for any unusual or nonrecurring items that were not contemplated in the annual target setting process (i.e., acquisition and integration-related expenses, net, debt settlement charges, and purchase accounting effects in 2025).
|
|
|
|
|
| Measure:: 2 |
|
|
|
|
|
| Pay vs Performance Disclosure |
|
|
|
|
|
| Name |
Adjusted EBITDA margin*
|
|
|
|
|
| Non-GAAP Measure Description |
Used as a key financial metric in the Company’s STIP program for 2025 (representing 20% of each NEOs’ total bonus opportunity); calculated by taking the sum of GAAP net income, interest expense, net, depreciation and amortization expense, other expense, net, income tax expense and any unusual or nonrecurring items that were not contemplated in the annual target setting process (i.e., acquisition and integration-related expenses, net, and purchase accounting effects in 2025), and dividing the total by net sales for the applicable period. Important metric when communicating with investors and other key stakeholders.
|
|
|
|
|
| Measure:: 3 |
|
|
|
|
|
| Pay vs Performance Disclosure |
|
|
|
|
|
| Name |
Adjusted earnings per share (“EPS”)*
|
|
|
|
|
| Non-GAAP Measure Description |
Calculated by taking GAAP net income, adjusted for any unusual or nonrecurring items that were not contemplated in the annual target setting process (i.e., acquisition and integration-related expenses, net, debt settlement charges, purchase accounting effects, and certain special tax items in 2025), and dividing the total by the weighted average diluted shares outstanding for the applicable period. Used as a key financial metric in NEOs’ LTIP awards, where 75% of the financial target is based on cumulative EPS over the applicable three-year performance period.
|
|
|
|
|
| Measure:: 4 |
|
|
|
|
|
| Pay vs Performance Disclosure |
|
|
|
|
|
| Name |
Return on invested capital (“ROIC”)*
|
|
|
|
|
| Non-GAAP Measure Description |
Calculated as net operating profit after taxes, divided by total invested capital for the applicable period. Used as a key financial metric in NEOs’ LTIP awards, where 25% of the financial target is based on average ROIC over the applicable three-year performance period.
|
|
|
|
|
| PEO | Adjustment To The Amounts Reported In The Summary Compensation Table As Stock Awards And Option Awards Granted During The Year Which Are Based On Grant Date Fair Values [Member] |
|
|
|
|
|
| Pay vs Performance Disclosure |
|
|
|
|
|
| Adjustment to Compensation, Amount |
$ (4,847,498)
|
$ (4,199,990)
|
$ (3,599,988)
|
$ (3,199,999)
|
$ (2,899,994)
|
| PEO | Adjustment To Fair Value Of Equity Awards Granted During The Year Which Remain Outstanding And Unvested At The End Of The year [Member] |
|
|
|
|
|
| Pay vs Performance Disclosure |
|
|
|
|
|
| Adjustment to Compensation, Amount |
6,437,879
|
4,798,063
|
5,996,940
|
4,575,494
|
2,917,931
|
| PEO | Adjustment To Awards Granted In Prior Years That Remain Outstanding And Unvested During The Year [Member] |
|
|
|
|
|
| Pay vs Performance Disclosure |
|
|
|
|
|
| Adjustment to Compensation, Amount |
1,363,043
|
1,903,037
|
4,353,841
|
438,214
|
1,522,577
|
| PEO | Adjustment To Awards Granted In Prior Years, Vested During The Year [Member] |
|
|
|
|
|
| Pay vs Performance Disclosure |
|
|
|
|
|
| Adjustment to Compensation, Amount |
3,458,591
|
5,592,348
|
1,454,417
|
28,788
|
1,111,004
|
| PEO | Adjustment To Actuarial Present Value Of Accumulated Defined Pension Benefit [Member] |
|
|
|
|
|
| Pay vs Performance Disclosure |
|
|
|
|
|
| Adjustment to Compensation, Amount |
(30,779)
|
(2,383)
|
(36,920)
|
0
|
0
|
| Non-PEO NEO | Adjustment To Awards Granted In Prior Years That Remain Outstanding And Unvested During The Year [Member] |
|
|
|
|
|
| Pay vs Performance Disclosure |
|
|
|
|
|
| Adjustment to Compensation, Amount |
223,384
|
325,991
|
761,118
|
64,775
|
269,604
|
| Non-PEO NEO | Adjustment To Awards Granted In Prior Years, Vested During The Year [Member] |
|
|
|
|
|
| Pay vs Performance Disclosure |
|
|
|
|
|
| Adjustment to Compensation, Amount |
577,432
|
930,964
|
231,490
|
11,385
|
180,435
|
| Non-PEO NEO | Adjustment To Stock Awards And Option Awards Granted During The Year [Member] |
|
|
|
|
|
| Pay vs Performance Disclosure |
|
|
|
|
|
| Adjustment to Compensation, Amount |
(781,238)
|
(677,486)
|
(651,244)
|
(606,243)
|
(520,989)
|
| Non-PEO NEO | Adjustment To Equity Awards Granted During The Year Which Remain Outstanding And Unvested [Member] |
|
|
|
|
|
| Pay vs Performance Disclosure |
|
|
|
|
|
| Adjustment to Compensation, Amount |
$ 1,037,542
|
$ 773,957
|
$ 1,084,865
|
$ 863,724
|
$ 524,212
|