Shareholder Report
|
6 Months Ended |
|
Dec. 31, 2025
USD ($)
Holding
|
|---|
| Shareholder Report [Line Items] |
|
| Document Type |
N-CSRS
|
| Amendment Flag |
false
|
| Registrant Name |
ASSET MANAGEMENT FUND
|
| Entity Central Index Key |
0000705318
|
| Entity Investment Company Type |
N-1A
|
| Document Period End Date |
Dec. 31, 2025
|
| Shareholder Report Annual or Semi-Annual |
Semi-Annual Shareholder Report
|
| C000189198 |
|
| Shareholder Report [Line Items] |
|
| Fund Name |
AAMA Equity Fund
|
| Trading Symbol |
AMFEX
|
| Annual or Semi-Annual Statement [Text Block] |
This semi-annual shareholder report contains important information about AAMA Equity Fund for the period of July 1, 2025 to December 31, 2025.
|
| Additional Information [Text Block] |
You can find additional information about the Fund at https://www.aamafunds.com/prospectuses-and-reports.html. You can also request this information by contacting us at (800) 701-9502
|
| Additional Information Phone Number |
(800) 701-9502
|
| Additional Information Website |
https://www.aamafunds.com/prospectuses-and-reports.html
|
| Expenses [Text Block] |
What were the Fund’s annualized costs for the last six months?(based on a hypothetical $10,000 investment) Fund Name | Costs of a $10,000 investment | Costs paid as a percentage of a $10,000 investment |
|---|
AAMA Equity Fund | $61 | 1.16% |
|---|
|
| Expenses Paid, Amount |
$ 61
|
| Expense Ratio, Percent |
1.16%
|
| AssetsNet |
$ 380,831,318
|
| Holdings Count | Holding |
39
|
| Advisory Fees Paid, Amount |
$ 1,967,543
|
| InvestmentCompanyPortfolioTurnover |
0.00%
|
| Additional Fund Statistics [Text Block] |
- Net Assets$380,831,318
- Number of Portfolio Holdings39
- Advisory Fee $1,967,543
- Portfolio Turnover0%
|
| Holdings [Text Block] |
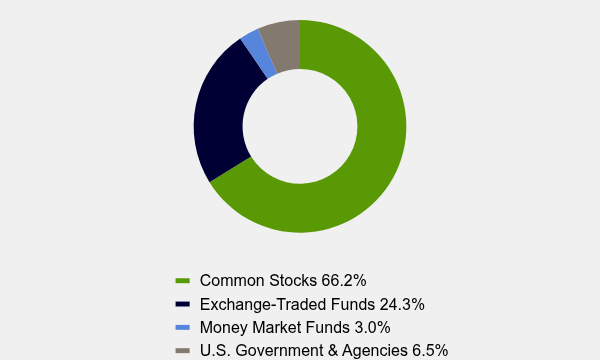
Asset Weighting (% of total investments)Value | Value |
|---|
Common Stocks | 66.2% | Exchange-Traded Funds | 24.3% | Money Market Funds | 3.0% | U.S. Government & Agencies | 6.5% |
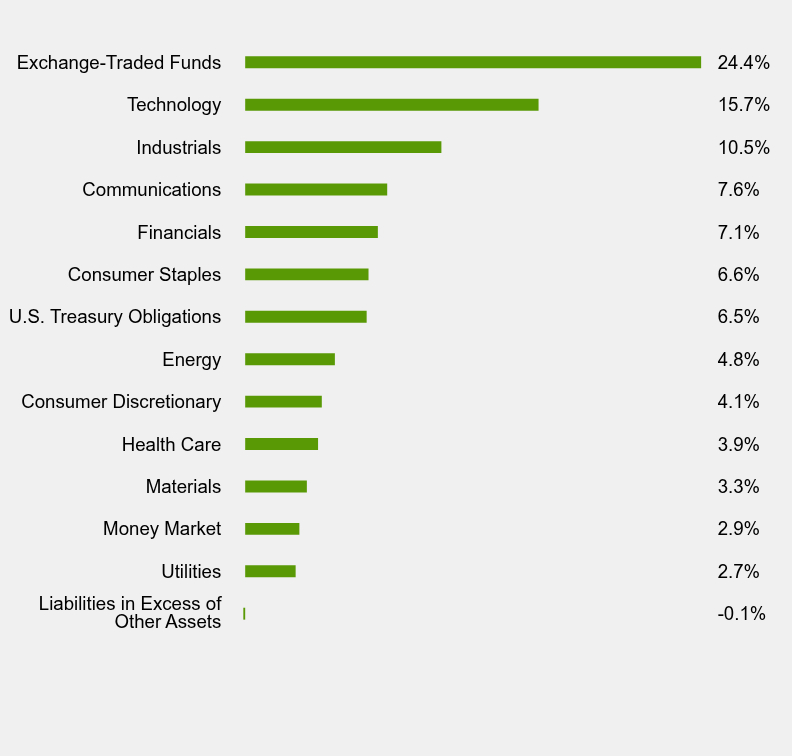
Sector Weighting (% of net assets)Value | Value |
|---|
Liabilities in Excess of Other Assets | -0.1% | Utilities | 2.7% | Money Market | 2.9% | Materials | 3.3% | Health Care | 3.9% | Consumer Discretionary | 4.1% | Energy | 4.8% | U.S. Treasury Obligations | 6.5% | Consumer Staples | 6.6% | Financials | 7.1% | Communications | 7.6% | Industrials | 10.5% | Technology | 15.7% | Exchange-Traded Funds | 24.4% |
|
| Largest Holdings [Text Block] |
Top 10 Holdings (% of net assets)Holding Name | % of Net Assets |
|---|
Vanguard S&P 500 ETF | 14.1% |
|---|
iShares Core S&P 500 ETF | 10.3% |
|---|
U.S. Treasury Bills, 3.771%, due 02/03/26 | 6.5% |
|---|
Freeport-McMoRan, Inc. | 3.3% |
|---|
Alphabet, Inc. - Class A | 3.1% |
|---|
Exxon Mobil Corporation | 2.9% |
|---|
Visa, Inc. - Class A | 2.9% |
|---|
Walmart, Inc. | 2.8% |
|---|
Emerson Electric Company | 2.7% |
|---|
Grainger (W.W.), Inc. | 2.7% |
|---|
|
| Material Fund Change [Text Block] |
No material changes occurred during the period ended December 31, 2025. |
| C000189199 |
|
| Shareholder Report [Line Items] |
|
| Fund Name |
AAMA Income Fund
|
| Trading Symbol |
AMFIX
|
| Annual or Semi-Annual Statement [Text Block] |
This semi-annual shareholder report contains important information about AAMA Income Fund for the period of July 1, 2025 to December 31, 2025.
|
| Additional Information [Text Block] |
You can find additional information about the Fund at https://www.aamafunds.com/prospectuses-and-reports.html. You can also request this information by contacting us at (800) 701-9502
|
| Additional Information Phone Number |
(800) 701-9502
|
| Additional Information Website |
https://www.aamafunds.com/prospectuses-and-reports.html
|
| Expenses [Text Block] |
What were the Fund’s annualized costs for the last six months?(based on a hypothetical $10,000 investment) Fund Name | Costs of a $10,000 investment | Costs paid as a percentage of a $10,000 investment |
|---|
AAMA Income Fund | $42 | 0.83% |
|---|
|
| Expenses Paid, Amount |
$ 42
|
| Expense Ratio, Percent |
0.83%
|
| AssetsNet |
$ 127,152,648
|
| Holdings Count | Holding |
17
|
| Advisory Fees Paid, Amount |
$ 381,458
|
| InvestmentCompanyPortfolioTurnover |
6.00%
|
| Additional Fund Statistics [Text Block] |
- Net Assets$127,152,648
- Number of Portfolio Holdings17
- Advisory Fee (net of waivers)$381,458
- Portfolio Turnover6%
|
| Holdings [Text Block] |
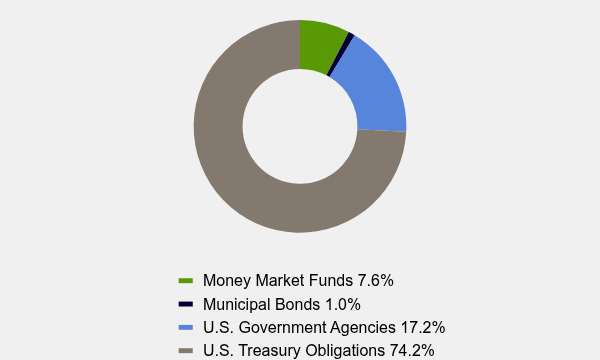
Asset Weighting (% of total investments)Value | Value |
|---|
Money Market Funds | 7.6% | Municipal Bonds | 1.0% | U.S. Government Agencies | 17.2% | U.S. Treasury Obligations | 74.2% |
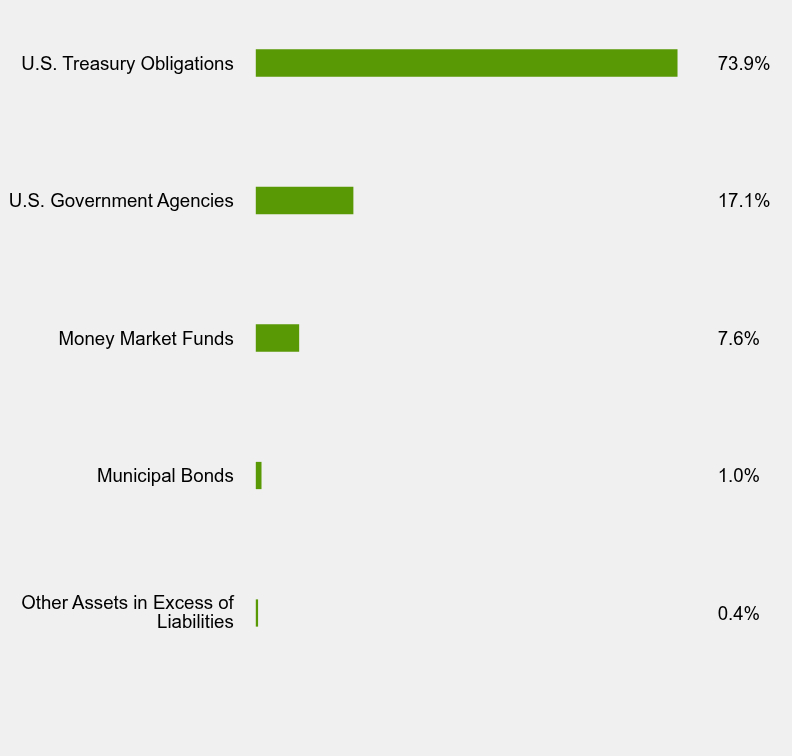
Sector Weighting (% of net assets)Value | Value |
|---|
Other Assets in Excess of Liabilities | 0.4% | Municipal Bonds | 1.0% | Money Market Funds | 7.6% | U.S. Government Agencies | 17.1% | U.S. Treasury Obligations | 73.9% |
Top 10 Holdings (% of net assets)Holding Name | % of Net Assets |
|---|
U.S. Treasury Notes, 4.625%, due 11/15/26 | 11.9% |
|---|
Federal National Mortgage Association, 2.125%, due 04/24/26 | 9.0% |
|---|
U.S. Treasury Bills, 3.600%, due 04/07/26 | 7.8% |
|---|
U.S. Treasury Notes, 3.500%, due 11/30/30 | 7.8% |
|---|
U.S. Treasury Bills, 3.594%, due 06/18/26 | 7.7% |
|---|
U.S. Treasury Notes, 0.500%, due 04/30/27 | 7.6% |
|---|
U.S. Treasury Notes, 1.125%, due 02/29/28 | 7.5% |
|---|
Federal National Mortgage Association, 0.750%, due 10/08/27 | 4.4% |
|---|
U.S. Treasury Notes, 3.875%, due 09/30/29 | 4.0% |
|---|
U.S. Treasury Notes, 3.875%, due 07/15/28 | 4.0% |
|---|
|
| Material Fund Change [Text Block] |
No material changes occurred during the period ended December 31, 2025. |
| C000041028 |
|
| Shareholder Report [Line Items] |
|
| Fund Name |
Large Cap Equity Fund
|
| Trading Symbol |
IICAX
|
| Annual or Semi-Annual Statement [Text Block] |
This semi-annual shareholder report contains important information about Large Cap Equity Fund for the period of July 1, 2025 to December 31, 2025.
|
| Additional Information [Text Block] |
You can find additional information about the Fund at https://www.amffunds.com/html/materials.html. You can also request this information by contacting us at 1-800-247-9780
|
| Additional Information Phone Number |
1-800-247-9780
|
| Additional Information Website |
https://www.amffunds.com/html/materials.html
|
| Expenses [Text Block] |
What were the Fund’s annualized costs for the last six months?(based on a hypothetical $10,000 investment) Fund Name | Costs of a $10,000 investment | Costs paid as a percentage of a $10,000 investment |
|---|
Large Cap Equity Fund - Class AMF | $86 | 1.62% |
|---|
|
| Expenses Paid, Amount |
$ 86
|
| Expense Ratio, Percent |
1.62%
|
| AssetsNet |
$ 51,349,150
|
| Holdings Count | Holding |
54
|
| Advisory Fees Paid, Amount |
$ 143,390
|
| InvestmentCompanyPortfolioTurnover |
4.00%
|
| Additional Fund Statistics [Text Block] |
- Net Assets$51,349,150
- Number of Portfolio Holdings54
- Advisory Fee (net of waivers)$143,390
- Portfolio Turnover4%
|
| Holdings [Text Block] |
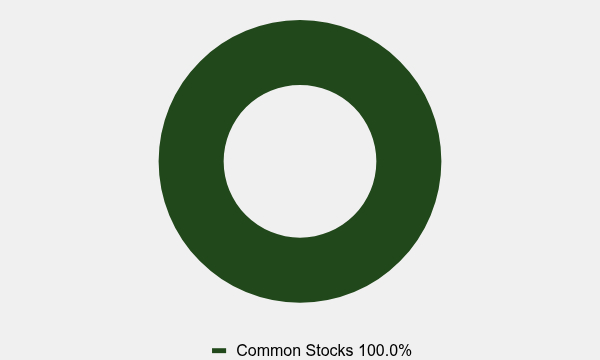
Asset Weighting (% of total investments)Value | Value |
|---|
Common Stocks | 100.0% |
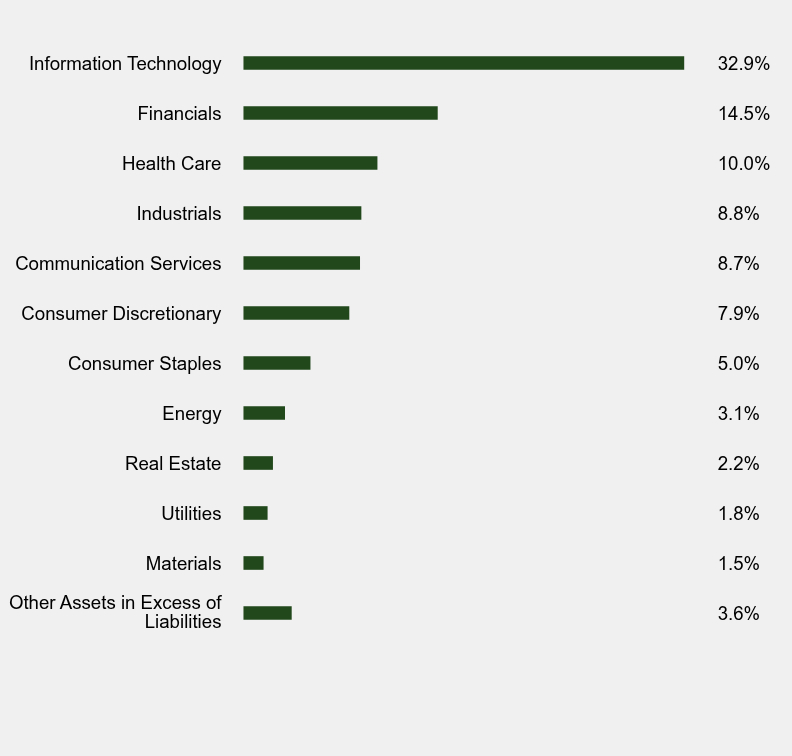
Sector Weighting (% of net assets)Value | Value |
|---|
Other Assets in Excess of Liabilities | 3.6% | Materials | 1.5% | Utilities | 1.8% | Real Estate | 2.2% | Energy | 3.1% | Consumer Staples | 5.0% | Consumer Discretionary | 7.9% | Communication Services | 8.7% | Industrials | 8.8% | Health Care | 10.0% | Financials | 14.5% | Information Technology | 32.9% |
|
| Largest Holdings [Text Block] |
Top 10 Holdings (% of net assets)Holding Name | % of Net Assets |
|---|
Cummins, Inc. | 4.1% |
|---|
Alphabet, Inc. - Class A | 4.0% |
|---|
Mastercard, Inc. - Class A | 3.9% |
|---|
Apple, Inc. | 3.8% |
|---|
Microsoft Corporation | 3.7% |
|---|
Accenture plc - Class A | 3.7% |
|---|
HCA Healthcare, Inc. | 3.6% |
|---|
KLA Corporation | 3.5% |
|---|
Broadcom, Inc. | 3.5% |
|---|
NVIDIA Corporation | 3.5% |
|---|
|
| Material Fund Change [Text Block] |
No material changes occurred during the period ended December 31, 2025. |
| C000072278 |
|
| Shareholder Report [Line Items] |
|
| Fund Name |
Large Cap Equity Fund
|
| Trading Symbol |
IICHX
|
| Annual or Semi-Annual Statement [Text Block] |
This semi-annual shareholder report contains important information about Large Cap Equity Fund for the period of July 1, 2025 to December 31, 2025.
|
| Additional Information [Text Block] |
You can find additional information about the Fund at https://www.amffunds.com/html/materials.html. You can also request this information by contacting us at 1-800-247-9780
|
| Additional Information Phone Number |
1-800-247-9780
|
| Additional Information Website |
https://www.amffunds.com/html/materials.html
|
| Expenses [Text Block] |
What were the Fund’s annualized costs for the last six months?(based on a hypothetical $10,000 investment) Fund Name | Costs of a $10,000 investment | Costs paid as a percentage of a $10,000 investment |
|---|
Large Cap Equity Fund - Class H | $80 | 1.51% |
|---|
|
| Expenses Paid, Amount |
$ 80
|
| Expense Ratio, Percent |
1.51%
|
| AssetsNet |
$ 51,349,150
|
| Holdings Count | Holding |
54
|
| Advisory Fees Paid, Amount |
$ 143,390
|
| InvestmentCompanyPortfolioTurnover |
4.00%
|
| Additional Fund Statistics [Text Block] |
- Net Assets$51,349,150
- Number of Portfolio Holdings54
- Advisory Fee (net of waivers)$143,390
- Portfolio Turnover4%
|
| Holdings [Text Block] |
Asset Weighting (% of total investments)Value | Value |
|---|
Common Stocks | 100.0% |
Sector Weighting (% of net assets)Value | Value |
|---|
Other Assets in Excess of Liabilities | 3.6% | Materials | 1.5% | Utilities | 1.8% | Real Estate | 2.2% | Energy | 3.1% | Consumer Staples | 5.0% | Consumer Discretionary | 7.9% | Communication Services | 8.7% | Industrials | 8.8% | Health Care | 10.0% | Financials | 14.5% | Information Technology | 32.9% |
|
| Largest Holdings [Text Block] |
Top 10 Holdings (% of net assets)Holding Name | % of Net Assets |
|---|
Cummins, Inc. | 4.1% |
|---|
Alphabet, Inc. - Class A | 4.0% |
|---|
Mastercard, Inc. - Class A | 3.9% |
|---|
Apple, Inc. | 3.8% |
|---|
Microsoft Corporation | 3.7% |
|---|
Accenture plc - Class A | 3.7% |
|---|
HCA Healthcare, Inc. | 3.6% |
|---|
KLA Corporation | 3.5% |
|---|
Broadcom, Inc. | 3.5% |
|---|
NVIDIA Corporation | 3.5% |
|---|
|
| Material Fund Change [Text Block] |
No material changes occurred during the period ended December 31, 2025. |