Pay vs Performance Disclosure - USD ($)
|
12 Months Ended |
Dec. 31, 2025 |
Dec. 31, 2024 |
Dec. 31, 2023 |
Dec. 31, 2022 |
Dec. 31, 2021 |
| Pay vs Performance Disclosure |
|
|
|
|
|
| Pay vs Performance Disclosure, Table |
PAY VERSUS PERFORMANCE As discussed in the CD&A above, the Compensation Committee has designed the Company’s executive compensation program to align a substantial portion of total compensation to motivating consistent performance over time in achievement of the Company’s strategic, operational, and financial objectives that result in increased profitability and stockholder returns. The following table sets forth additional compensation information for its named executive officers (“NEOs”), calculated in accordance with SEC regulations, for 2025, 2024, 2023, 2022 and 2021.
|
|
|
|
|
|
|
|
|
|
|
|
|
|
|
|
|
|
|
|
|
|
|
|
|
|
|
|
|
|
|
|
|
|
|
|
|
|
|
|
|
|
|
|
|
|
|
|
|
|
|
|
|
|
|
|
|
|
|
|
|
Value of Initial Fixed
$100 Investment as of
January 1, 2021 Based
On: |
|
|
|
|
|
|
|
|
|
|
|
|
|
|
|
|
|
Average |
|
|
|
|
|
|
|
|
|
|
|
|
|
(In thousands) |
|
|
Year |
|
Summary
Compensation
Table Total
For CEO(1) |
Compensation
Actually Paid
to CEO(2)(3) |
Summary
Compensation
Table Total for
Non-CEO
NEOs(4) |
Average
Compensation
Actually Paid
to Non-CEO
NEOs(2)(4)(5) |
Total
Stockholder
Return |
Peer Group
Total
Stockholder
Return(6) |
Net
Income
(Loss) |
Adjusted
EBITDA(7) |
2025 |
|
|
$ |
6,735,134 |
|
|
|
$ |
7,088,754 |
|
|
|
$ |
2,083,743 |
|
|
|
$ |
2,191,444 |
|
|
|
$ |
212.58 |
|
|
|
$ |
149.32 |
|
|
|
$ |
354,569 |
|
|
|
$ |
781,019 |
|
|
2024 |
|
|
|
7,109,569 |
|
|
|
|
9,436,272 |
|
|
|
|
2,312,999 |
|
|
|
|
3,008,599 |
|
|
|
|
118.17 |
|
|
|
|
156.71 |
|
|
|
|
286,707 |
|
|
|
|
708,328 |
|
|
2023 |
|
|
|
7,799,652 |
|
|
|
|
9,257,534 |
|
|
|
|
2,029,846 |
|
|
|
|
2,030,002 |
|
|
|
|
87.66 |
|
|
|
|
154.31 |
|
|
|
|
222,905 |
|
|
|
|
557,319 |
|
|
2022 |
|
|
|
6,243,919 |
|
|
|
|
6,766,826 |
|
|
|
|
1,869,027 |
|
|
|
|
1,987,378 |
|
|
|
|
71.88 |
|
|
|
|
127.96 |
|
|
|
|
122,761 |
|
|
|
|
410,536 |
|
|
2021 |
|
|
|
5,899,132 |
|
|
|
|
6,887,444 |
|
|
|
|
1,833,167 |
|
|
|
|
2,183,344 |
|
|
|
|
66.37 |
|
|
|
|
155.22 |
|
|
|
|
(246,771 |
) |
|
|
|
306,116 |
|
|
(1)The dollar amounts reported are the amounts of total compensation reported for the Company’s CEO, Mr. Grzebinski, in the Summary Compensation Tables for 2025, 2024, 2023, 2022 and 2021. Mr. Grzebinski served as CEO for each of the years presented. (2)The dollar amounts reported represent the amount of “compensation actually paid”, as computed in accordance with SEC rules. The dollar amounts do not reflect the actual amounts of compensation paid to the Company’s CEO or other NEOs during the applicable year, as they also include (i) the year-end value of equity awards granted during the reported year and (ii) the change in the value of equity awards that were unvested at the end of the prior year, measured through the date the awards vested or were forfeited, or through the end of the reported fiscal year. (3)To calculate Compensation Actually Paid to the Company’s CEO, the grant date fair value of the equity awards to the Company’s CEO, as reported in the “Stock Awards” column in the Summary Compensation Table for each applicable year, were deducted from the CEO’s “Total” compensation as reported in the Summary Compensation Table, and the following equity award adjustments were added to or deducted from (as applicable) the balance: 2025 - $2,603,747, 2024 - $4,479,879, 2023 - $3,905,017, 2022 - $2,773,165, and 2021 - $4,306,800. The equity award adjustments represent the year-over-year change in the fair value of equity awards to the Company’s CEO. (4)For 2021, Messrs. Kumar, O’Neil, William Harvey, and Joseph Reniers and Ms. Husted are included as non-CEO NEOs. For 2022, Messrs. Kumar and O’Neil and Mss. Husted and Kim Clarke are included as non-CEO NEOs. For 2023, Messrs. Kumar, O’Neil and Miller and Mss. Husted and Clarke are included as non-CEO NEOs. For 2024 and 2025, Messrs. Kumar, O’Neil and Miller and Ms. Husted are included as non-CEO NEOs. (5)To calculate Average Compensation Actually Paid to the Company’s non-CEO NEOs, the average of the grant date fair value of the equity awards to the Company’s NEOs (other than the CEO), as reported in the “Stock Awards” column in the Summary Compensation Table for each applicable year, were deducted from the average of the “Total” compensation of the Company’s non-CEO NEOs as reported in the Summary Compensation Table, and the following equity award adjustments were added to or deducted from (as applicable) the balance: 2025 - $801,485, 2024 - $1,503,386, 2023 - $604,525, 2022 - $822,973, and 2021 - $1,332,309. The equity award adjustments represent the average of the year-over-year change in the fair value of equity awards to the Company’s NEOs (other than the CEO). (6)Reflects cumulative total stockholder return of the Dow Jones US Transportation Average index (“DJTA”), as of December 31, 2025. The DJTA is the peer group used by the Company for purposes of Item 201(e) of Regulation S-K under the Exchange Act in the Company’s Annual Report on Form 10-K for the year ended December 31, 2025. The DJTA has been selected by the Company as its peer group based on its inclusion in that index. The DJTA is a price-weighted average of twenty transportation stocks traded in the United States. The index includes railroads, airlines, trucking, marine transportation, delivery services, and logistics companies. While the Company believes the index is useful for providing insight into the state of the U.S. economy, the index does not include the Company’s primary competitors in the KMT segment who are largely private companies. In addition, the Company derived 42% of its revenues in 2025 from its KDS segment whose operations are not typical of other members of the index. Therefore, stock performance of the DJTA may not correlate to the Company’s stock performance due to the inherent variations in operations between those of the Company and the other members of the index. (7)Adjusted EBITDA for 2021 excludes $340.7 million related to impairment of long-lived assets and impairment of goodwill. For 2021, the Compensation Committee determined that this exclusion was appropriate given the Compensation Committee’s opinion that the impairment was primarily due to the impact of the strategic decision to sell the Hawaii assets and retire wire assets, which will benefit the Company long-term. Adjusted EBITDA for 2024 excludes $56.3 million related to an impairment charge associated with conventional diesel fracturing equipment inventory. For 2024, the Compensation Committee determined that this exclusion was appropriate given the Compensation Committee’s opinion that the impairment charge was primarily due to the impact of a rapid paradigm shift in technology from conventional diesel-powered equipment to both dual-fuel and electric-powered hydraulic equipment as certain of the Company’s customers and other pressure pumpers disclosed in the fourth quarter of 2024 retirements and impairments of their conventional diesel hydraulic fracturing equipment. The Compensation Committee also determined that it was appropriate to exclude the 2024 one-time deferred tax credit that the Company received in connection with a change in Louisiana tax law. For compensation payout purposes, no adjustments were made to return on total capital, EBITDA, or earnings per share for 2022, 2023, or 2025. Please refer to Appendix B for a reconciliation to the most directly comparable GAAP financial measures. |
|
|
|
|
| Company Selected Measure Name |
Adjusted EBITDA
|
|
|
|
|
| Named Executive Officers, Footnote |
For 2021, Messrs. Kumar, O’Neil, William Harvey, and Joseph Reniers and Ms. Husted are included as non-CEO NEOs. For 2022, Messrs. Kumar and O’Neil and Mss. Husted and Kim Clarke are included as non-CEO NEOs. For 2023, Messrs. Kumar, O’Neil and Miller and Mss. Husted and Clarke are included as non-CEO NEOs. For 2024 and 2025, Messrs. Kumar, O’Neil and Miller and Ms. Husted are included as non-CEO NEOs.
|
|
|
|
|
| Peer Group Issuers, Footnote |
Reflects cumulative total stockholder return of the Dow Jones US Transportation Average index (“DJTA”), as of December 31, 2025. The DJTA is the peer group used by the Company for purposes of Item 201(e) of Regulation S-K under the Exchange Act in the Company’s Annual Report on Form 10-K for the year ended December 31, 2025. The DJTA has been selected by the Company as its peer group based on its inclusion in that index. The DJTA is a price-weighted average of twenty transportation stocks traded in the United States. The index includes railroads, airlines, trucking, marine transportation, delivery services, and logistics companies. While the Company believes the index is useful for providing insight into the state of the U.S. economy, the index does not include the Company’s primary competitors in the KMT segment who are largely private companies. In addition, the Company derived 42% of its revenues in 2025 from its KDS segment whose operations are not typical of other members of the index. Therefore, stock performance of the DJTA may not correlate to the Company’s stock performance due to the inherent variations in operations between those of the Company and the other members of the index.
|
|
|
|
|
| PEO Total Compensation Amount |
$ 6,735,134
|
$ 7,109,569
|
$ 7,799,652
|
$ 6,243,919
|
$ 5,899,132
|
| PEO Actually Paid Compensation Amount |
$ 7,088,754
|
9,436,272
|
9,257,534
|
6,766,826
|
6,887,444
|
| Adjustment To PEO Compensation, Footnote |
To calculate Compensation Actually Paid to the Company’s CEO, the grant date fair value of the equity awards to the Company’s CEO, as reported in the “Stock Awards” column in the Summary Compensation Table for each applicable year, were deducted from the CEO’s “Total” compensation as reported in the Summary Compensation Table, and the following equity award adjustments were added to or deducted from (as applicable) the balance: 2025 - $2,603,747, 2024 - $4,479,879, 2023 - $3,905,017, 2022 - $2,773,165, and 2021 - $4,306,800. The equity award adjustments represent the year-over-year change in the fair value of equity awards to the Company’s CEO
|
|
|
|
|
| Non-PEO NEO Average Total Compensation Amount |
$ 2,083,743
|
2,312,999
|
2,029,846
|
1,869,027
|
1,833,167
|
| Non-PEO NEO Average Compensation Actually Paid Amount |
$ 2,191,444
|
3,008,599
|
2,030,002
|
1,987,378
|
2,183,344
|
| Adjustment to Non-PEO NEO Compensation Footnote |
(5)To calculate Average Compensation Actually Paid to the Company’s non-CEO NEOs, the average of the grant date fair value of the equity awards to the Company’s NEOs (other than the CEO), as reported in the “Stock Awards” column in the Summary Compensation Table for each applicable year, were deducted from the average of the “Total” compensation of the Company’s non-CEO NEOs as reported in the Summary Compensation Table, and the following equity award adjustments were added to or deducted from (as applicable) the balance: 2025 - $801,485, 2024 - $1,503,386, 2023 - $604,525, 2022 - $822,973, and 2021 - $1,332,309. The equity award adjustments represent the average of the year-over-year change in the fair value of equity awards to the Company’s NEOs (other than the CEO).
|
|
|
|
|
| Compensation Actually Paid vs. Total Shareholder Return |
The following charts reflect that the Compensation Actually Paid over the five-year period ended December 31, 2025 aligns to trends in the Company’s TSR, net income (loss) and adjusted EBITDA results over the same period. 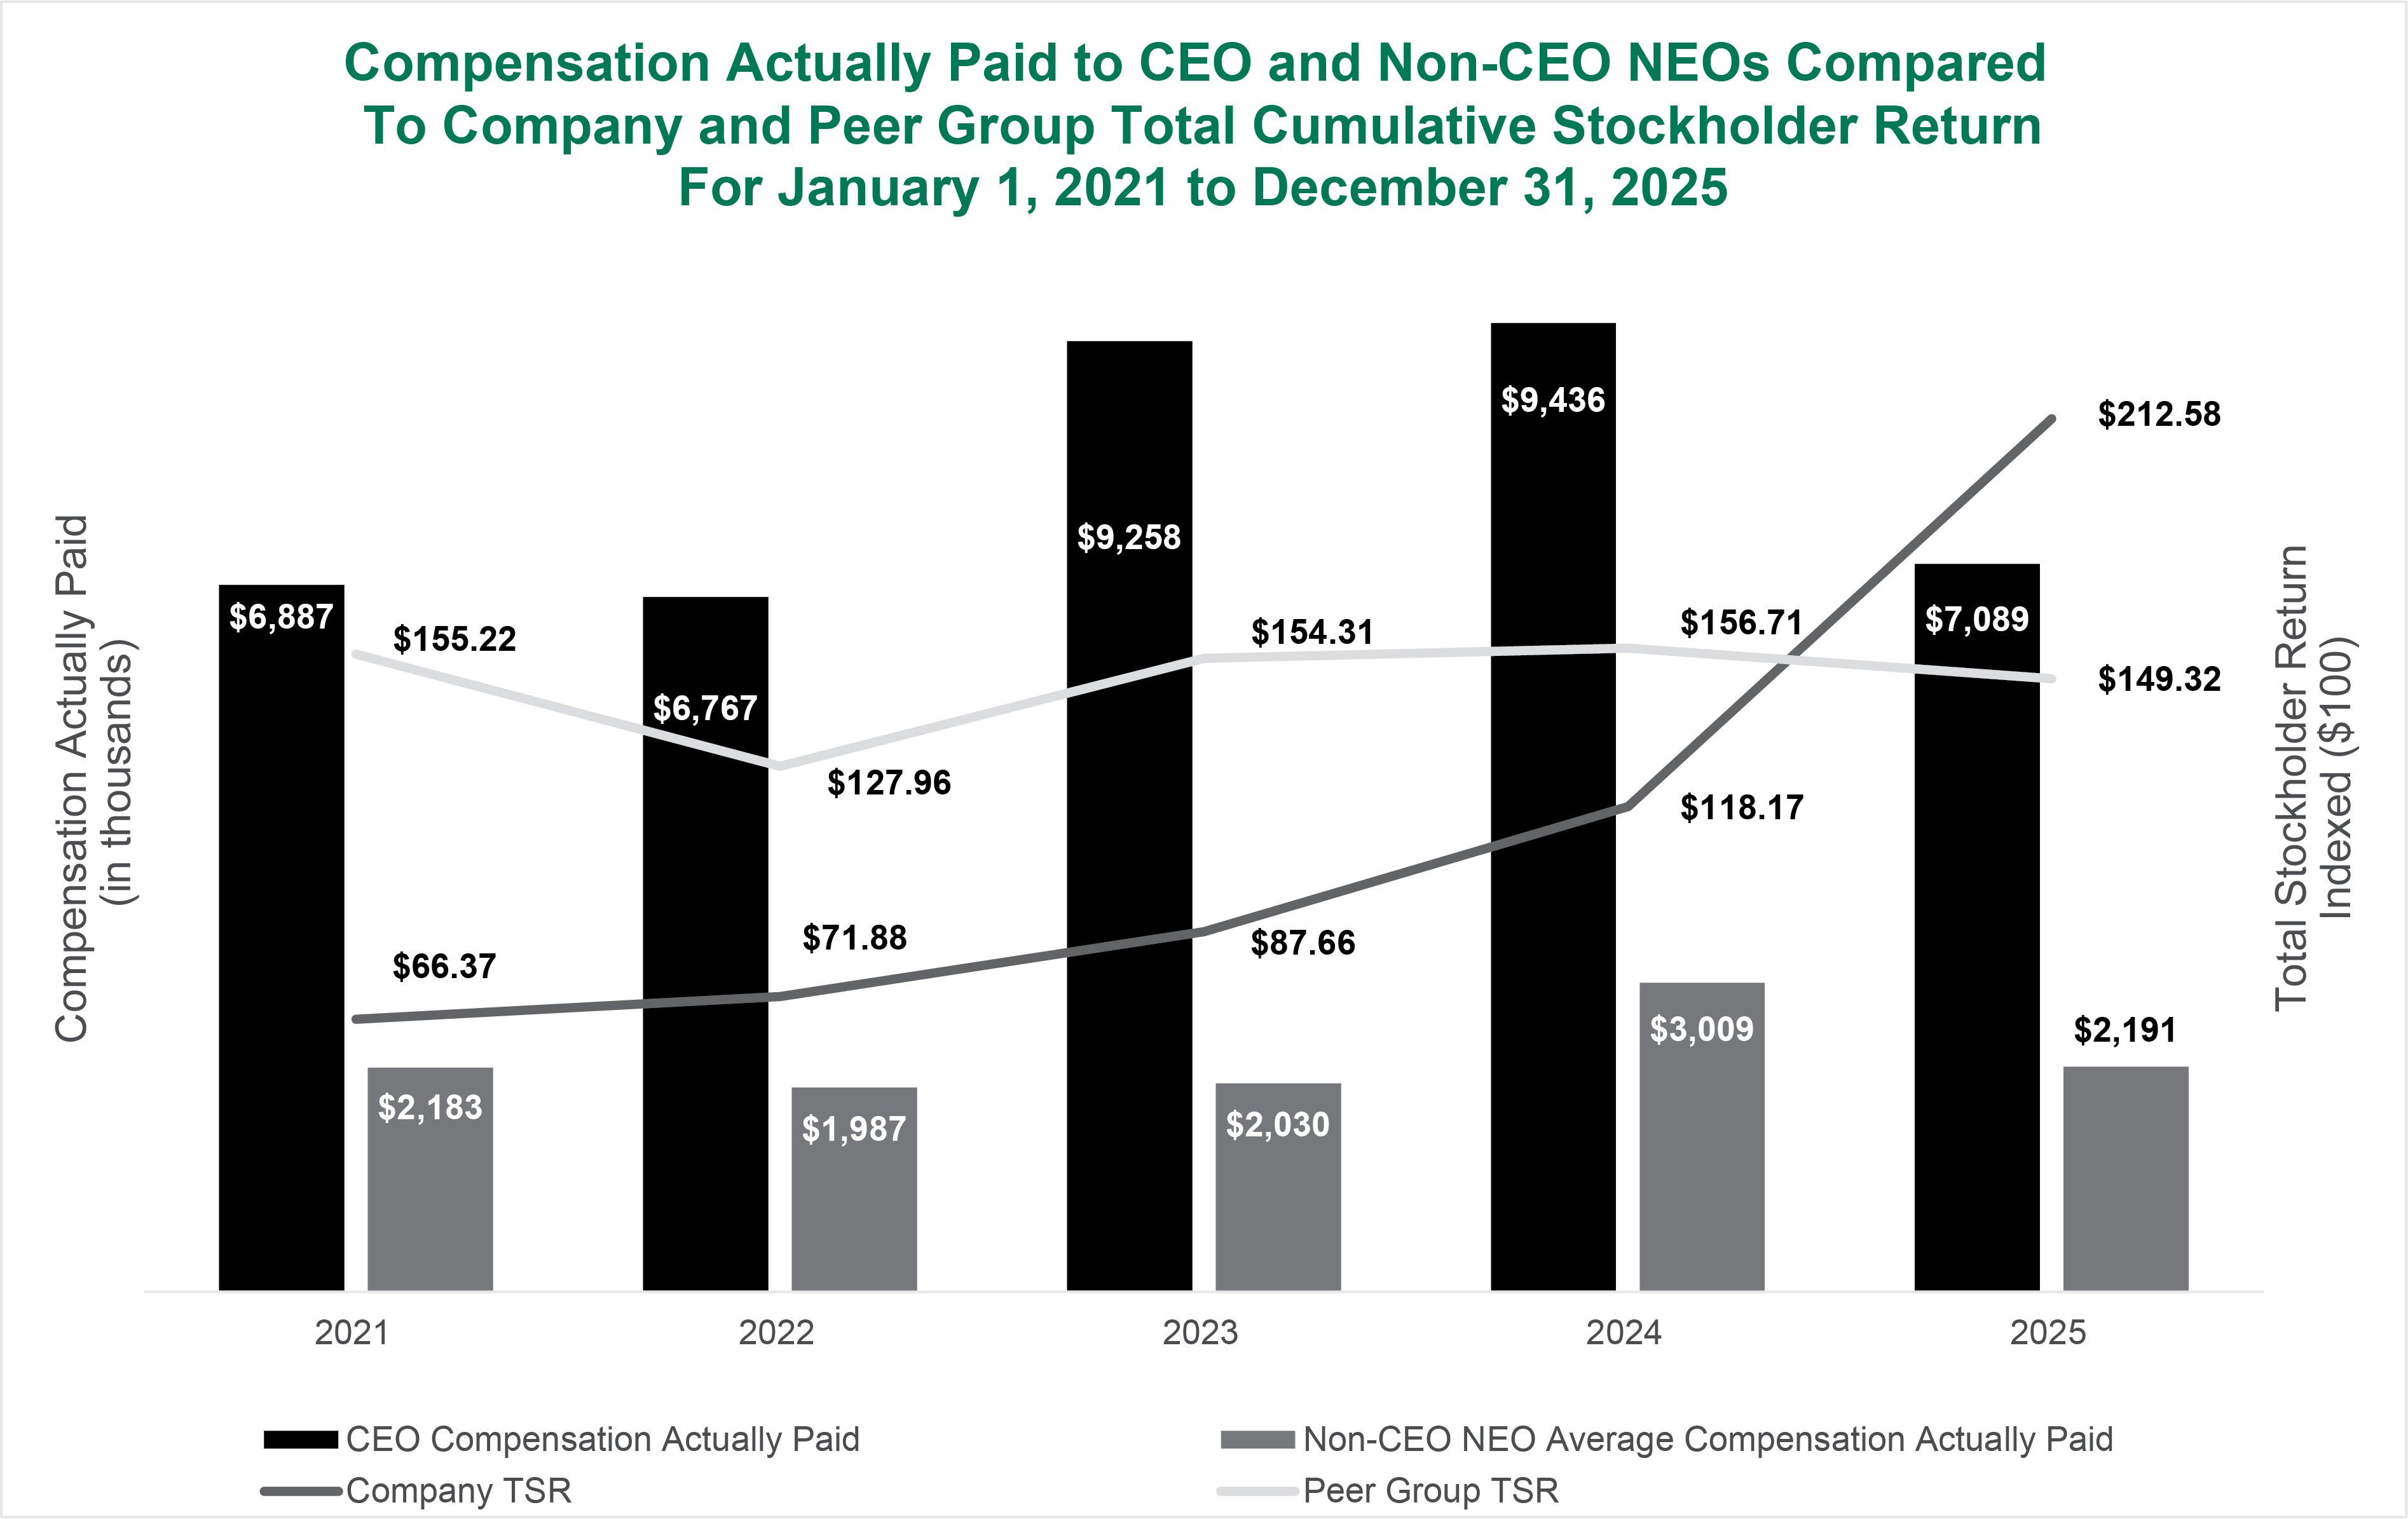
|
|
|
|
|
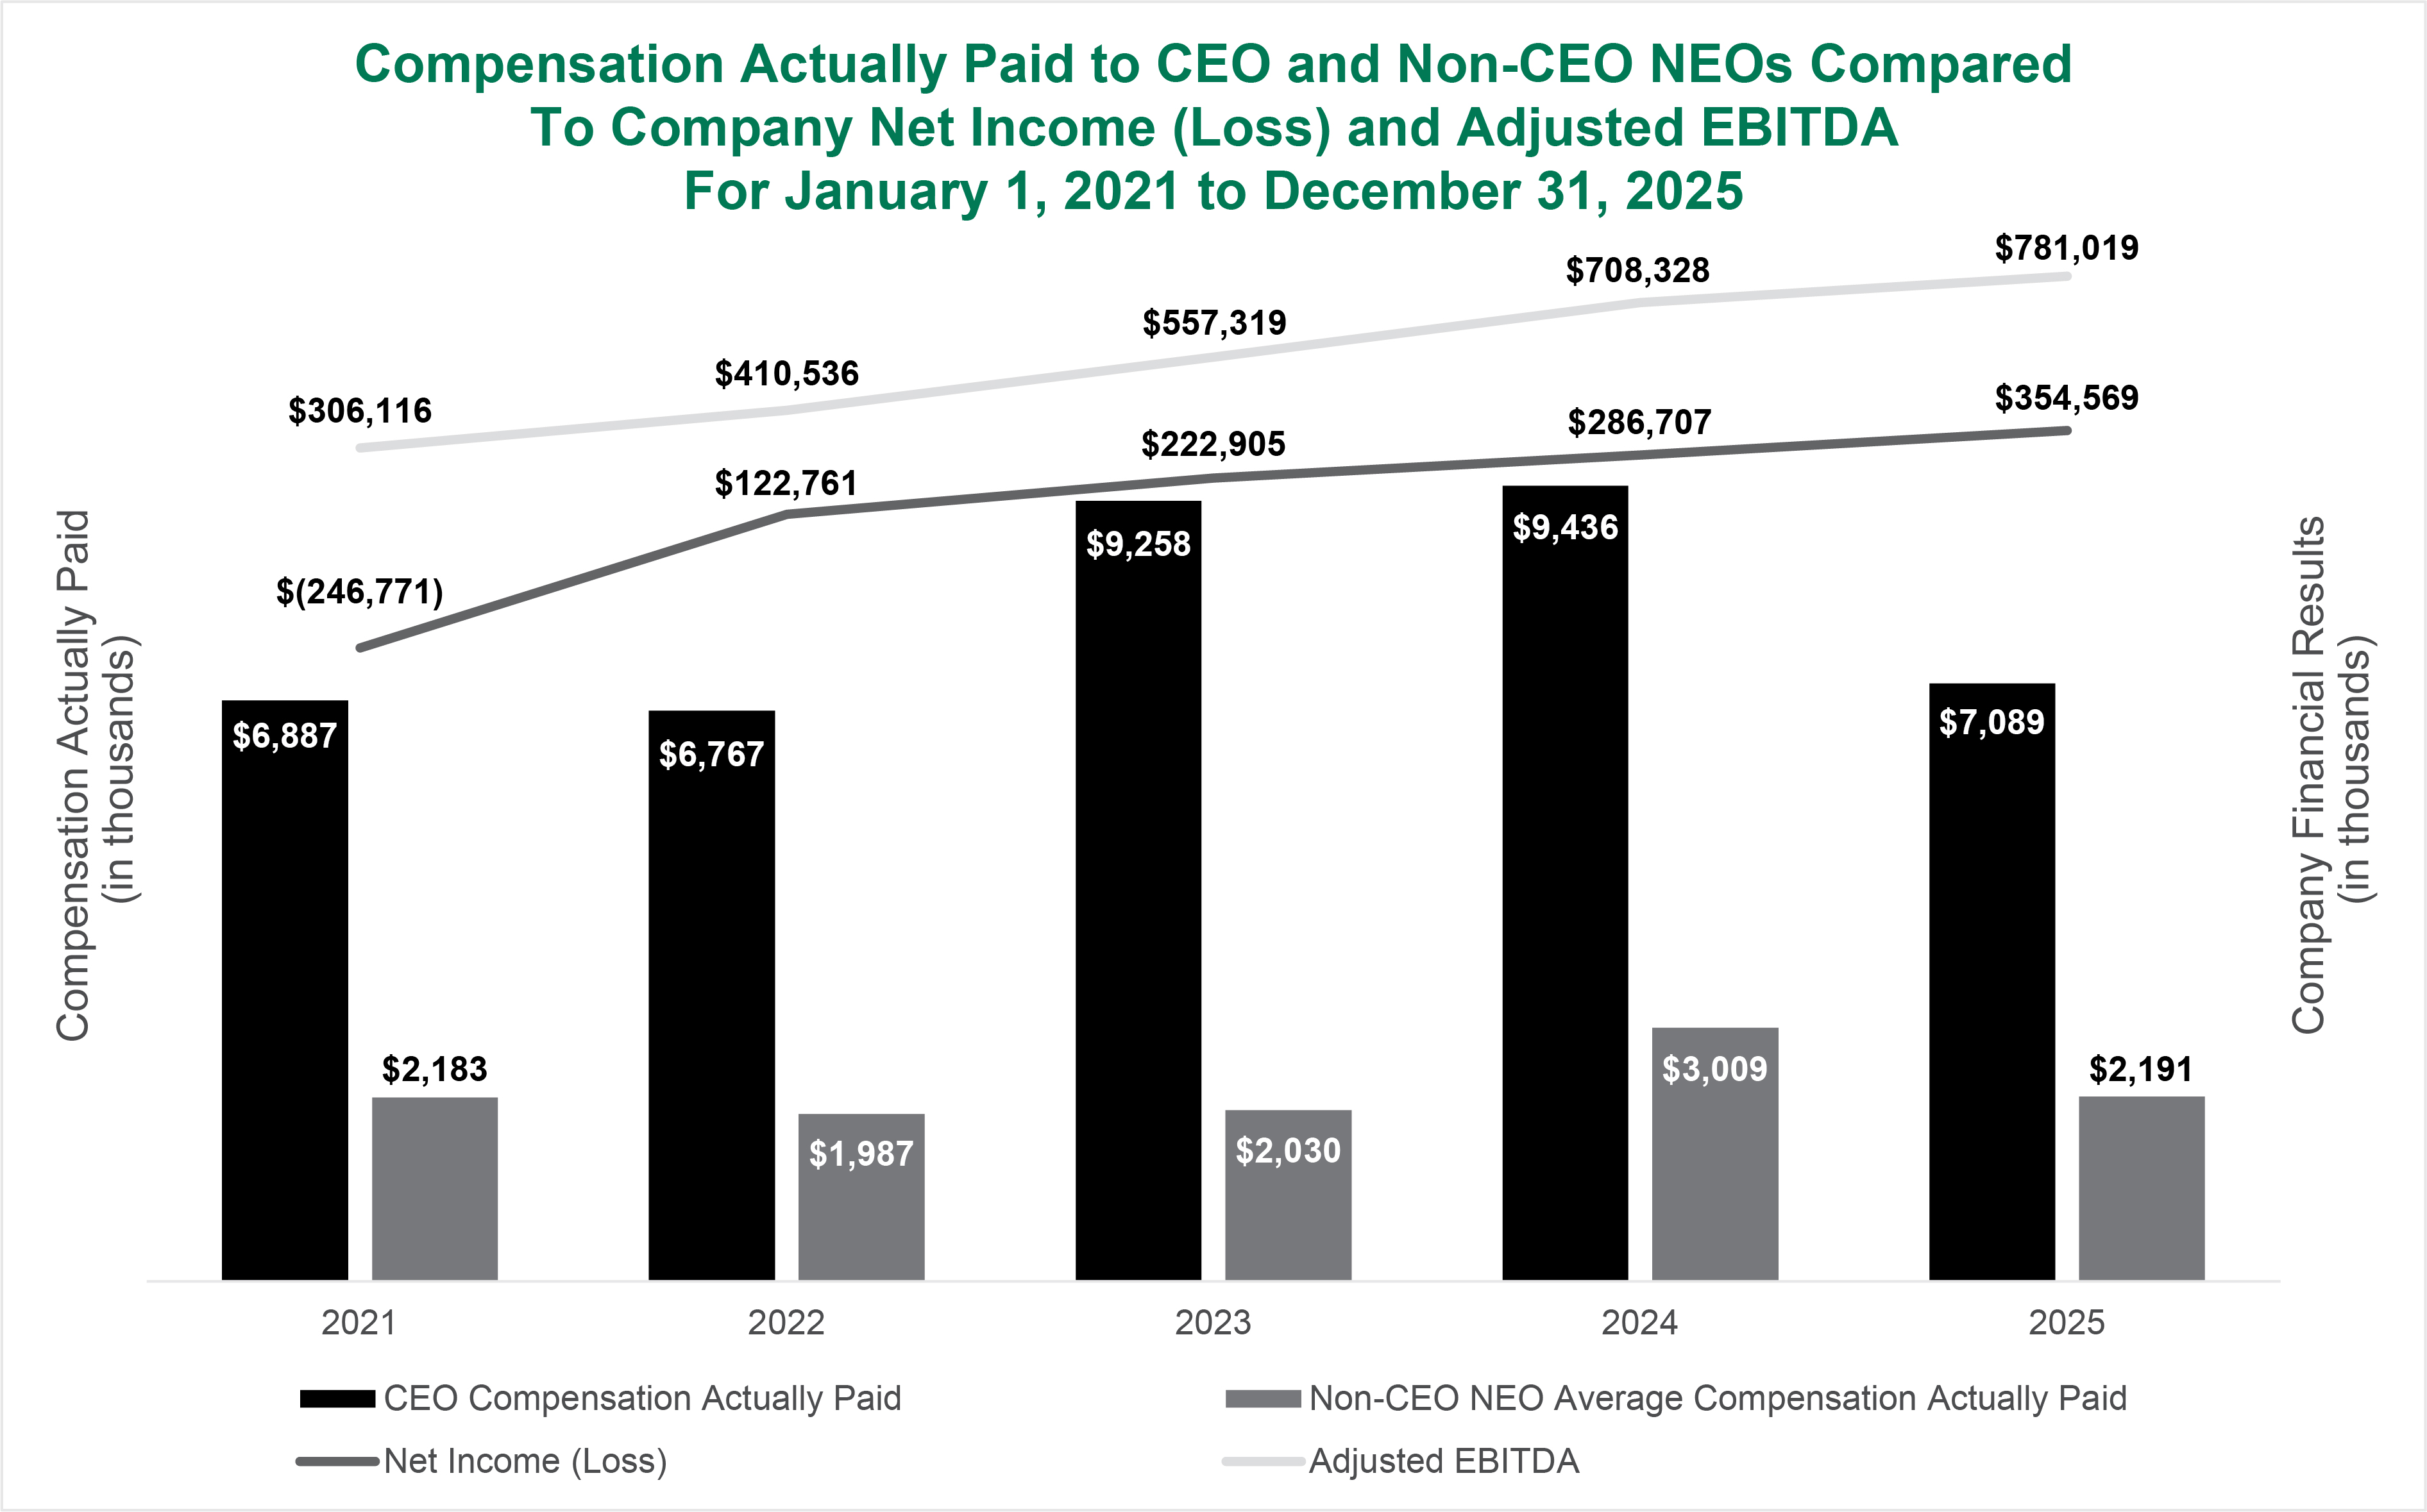
| Compensation Actually Paid vs. Net Income |
|
|
|
|
|
| Compensation Actually Paid vs. Company Selected Measure |
|
|
|
|
|
| Total Shareholder Return Vs Peer Group |
The following charts reflect that the Compensation Actually Paid over the five-year period ended December 31, 2025 aligns to trends in the Company’s TSR, net income (loss) and adjusted EBITDA results over the same period.
|
|
|
|
|
| Tabular List, Table |
The list of items below identifies the three most important financial performance measures used by the Company’s Compensation Committee to link the “compensation actually paid” to the Company’s CEO and other NEOs in 2025, calculated in accordance with SEC regulations, to Company performance. The role of each of these performance measures on NEO compensation is discussed in the Compensation Discussion and Analysis section beginning on page 32. Financial Performance Measures EBITDA Return on Total Capital Earnings per Share
|
|
|
|
|
| Total Shareholder Return Amount |
$ 212.58
|
118.17
|
87.66
|
71.88
|
66.37
|
| Peer Group Total Shareholder Return Amount |
$ 149.32
|
$ 156.71
|
$ 154.31
|
$ 127.96
|
$ 155.22
|
| Company Selected Measure Amount |
781,019,000
|
708,328,000
|
557,319,000
|
410,536,000
|
306,116,000
|
| PEO Name |
Mr. Grzebinski
|
Mr. Grzebinski
|
Mr. Grzebinski
|
Mr. Grzebinski
|
Mr. Grzebinski
|
| Net Income (Loss), Including Portion Attributable to Noncontrolling Interest |
$ 354,569,000
|
$ 286,707,000
|
$ 222,905,000
|
$ 122,761,000
|
$ (246,771,000)
|
| Impairment of Long Lived Assets Including Goodwill |
|
56,300,000
|
|
|
340,700,000
|
| Measure:: 1 |
|
|
|
|
|
| Pay vs Performance Disclosure |
|
|
|
|
|
| Name |
EBITDA
|
|
|
|
|
| Non-GAAP Measure Description |
(7)Adjusted EBITDA for 2021 excludes $340.7 million related to impairment of long-lived assets and impairment of goodwill. For 2021, the Compensation Committee determined that this exclusion was appropriate given the Compensation Committee’s opinion that the impairment was primarily due to the impact of the strategic decision to sell the Hawaii assets and retire wire assets, which will benefit the Company long-term. Adjusted EBITDA for 2024 excludes $56.3 million related to an impairment charge associated with conventional diesel fracturing equipment inventory. For 2024, the Compensation Committee determined that this exclusion was appropriate given the Compensation Committee’s opinion that the impairment charge was primarily due to the impact of a rapid paradigm shift in technology from conventional diesel-powered equipment to both dual-fuel and electric-powered hydraulic equipment as certain of the Company’s customers and other pressure pumpers disclosed in the fourth quarter of 2024 retirements and impairments of their conventional diesel hydraulic fracturing equipment. The Compensation Committee also determined that it was appropriate to exclude the 2024 one-time deferred tax credit that the Company received in connection with a change in Louisiana tax law. For compensation payout purposes, no adjustments were made to return on total capital, EBITDA, or earnings per share for 2022, 2023, or 2025. Please refer to Appendix B for a reconciliation to the most directly comparable GAAP financial measures.
|
|
|
|
|
| Measure:: 2 |
|
|
|
|
|
| Pay vs Performance Disclosure |
|
|
|
|
|
| Name |
Return on Total Capital
|
|
|
|
|
| Measure:: 3 |
|
|
|
|
|
| Pay vs Performance Disclosure |
|
|
|
|
|
| Name |
Earnings per Share
|
|
|
|
|
| PEO |
|
|
|
|
|
| Pay vs Performance Disclosure |
|
|
|
|
|
| Adjustment to Compensation, Amount |
$ 2,603,747
|
4,479,879
|
3,905,017
|
2,773,165
|
4,306,800
|
| Non-PEO NEO |
|
|
|
|
|
| Pay vs Performance Disclosure |
|
|
|
|
|
| Adjustment to Compensation, Amount |
$ 801,485
|
$ 1,503,386
|
$ 604,525
|
$ 822,973
|
$ 1,332,309
|