v3.25.4
Pay vs Performance Disclosure - USD ($)
12 Months Ended
Dec. 31, 2025
Dec. 31, 2024
Dec. 31, 2023
Pay vs Performance Disclosure      
Pay vs Performance Disclosure, Table

Pay Versus Performance Disclosure

In accordance with rules adopted by the Securities and Exchange Commission pursuant to the Dodd-Frank Wall Street Reform and Consumer Protection Act of 2010, we provide the following disclosure regarding executive compensation for our principal executive officers, or PEOs, and our non-PEO named executive officers, or Non-PEO NEOs, and our performance for the fiscal years listed below. This disclosure has been prepared in accordance with Item 402(v) of Regulation S-K under the Exchange Act and does not necessarily reflect value actually realized by the executives or how our compensation committee evaluates compensation decisions in light of company or individual performance.


Year


Summary
Compensation
Table Total
for First PEO ($)(1)


Summary
Compensation
Table Total
for Second PEO ($)(1)


Compensation
Actually Paid
to First PEO ($)(2)(3)


Compensation
Actually Paid
to Second PEO ($)(2)(3)


Average
Summary
Compensation
Table Total for
Non-PEO
NEOs ($)(1)


Average
Compensation
Actually Paid to
Non-PEO
NEOs ($)(2)(3)


Value of
Initial Fixed
$100
Investment
based on:
Total
Shareholder
Return ($)(4)


Net
Income
($ Millions)

2025


1,426,183


1,185,639


1,272,770


538,956


873,270


805,919


10.68


(23)

2024


1,393,921


294,833


1,138,725


528,183


38.25


(41)

2023


3,015,480


1,356,650


1,202,503


117,009


92.63


(51)


(1)
Daniel R. Passeri was our PEO for 2023 and 2024 and our first PEO for 2025 in the table. Usman Azam was our second PEO for 2025. The Non-PEO NEOs were Kerri-Ann Millar and Anish Suri for 2023, Kerri-Ann Millar, Anish Suri and Matteo Levisetti for 2024, and Matteo Levisetti, Lucinda Warren and Colin Sandercock for 2025.
(2)
The amounts shown for Compensation Actually Paid have been calculated in accordance with Item 402(v) of Regulation S-K and do not reflect compensation actually earned, realized, or received by the Company’s named executive officers during the applicable years. These amounts reflect the Summary Compensation Table Total with certain adjustments made in accordance with Item 402(v) and as described in footnote 3 below.
(3)
Compensation Actually Paid reflects the exclusions and inclusions of certain amounts for the PEOs and the Non-PEO NEOs as set forth below. Equity values are calculated in accordance with FASB ASC Topic 718. Amounts in the Exclusion of Option Awards column are the totals from the Option Awards column set forth in the Summary Compensation Table.


Year


Summary
Compensation
Table Total
for First PEO ($)


Exclusion of
Option Awards
for First PEO ($)


Inclusion of
Equity Value
for First PEO ($)


Compensation
Actually Paid
to First PEO ($)

2025


1,426,183


(336,555)


183,142


1,272,770

2024


1,393,921


(711,195)


(387,893)


294,833

2023


3,015,480


(2,407,500)


748,670


1,356,650


Year


Summary
Compensation
Table Total
for Second PEO ($)


Exclusion of
Option Awards
for Second PEO ($)


Inclusion of
Equity Value
for Second PEO ($)


Compensation
Actually Paid
to Second PEO ($)

2025


1,185,639


(1,042,313)


395,630


538,956

2024


2023


Year


Average Summary
Compensation Table
Total for Non-PEO
NEOs ($)


Average Exclusion
of Option Awards
for Non-PEO
NEOs ($)


Average Inclusion of
Equity Values for
Non-PEO NEOs ($)


Average
Compensation
Actually Paid to
Non-PEO
NEOs ($)

2025


873,270


(222,277)


154,926


805,919

2024


1,138,725


(589,023)


(21,519)


528,183

2023


1,202,503


(736,514)


(348,980)


117,009


The amounts in the Inclusion of Equity Values in the tables above are derived from the amounts set forth in the following tables:


Year


Year-End Fair
Value of Equity
Awards Granted
During Year That
Remained
Outstanding and
Unvested as of
Last Day of Year
for First PEO ($)


Change in Fair
Value from Last
Day of Prior Year
to Last Day of
Year of
Outstanding and
Unvested Equity
Awards Granted
in any Prior Year
for First PEO ($)


Vesting-
Date Fair
Value of
Equity
Awards
Granted
During Year
that Vested
During Year
for First PEO ($)


Change in Fair
Value from Last
Day of Prior
Year to Vesting
Date of
Unvested
Equity Awards
Granted in any
Prior Year that
Vested During
Year for First PEO


Fair Value
at Last Day
of Prior
Year Equity
Awards
Forfeited
During Year
for First PEO


Total –
Inclusion of
Equity
Values for
First PEO ($)

2025


110,289


(208,020)


50,326


230,547


183,142

2024


524,484


(543,213)


13,195


(382,359)


(387,893)

2023


1,190,794


(245,681)


247,336


(443,779)


748,670


Year


Year-End Fair
Value of Equity
Awards Granted
During Year That
Remained
Outstanding and
Unvested as of
Last Day of Year
for Second PEO ($)


Change in Fair
Value from Last
Day of Prior Year
to Last Day of
Year of
Outstanding and
Unvested Equity
Awards Granted
in any Prior Year
for Second PEO ($)


Vesting-
Date Fair
Value of
Equity
Awards
Granted
During Year
that Vested
During Year
for Second PEO ($)


Change in Fair
Value from Last
Day of Prior
Year to Vesting
Date of
Unvested
Equity Awards
Granted in any
Prior Year that
Vested During
Year for Second PEO


Fair Value
at Last Day
of Prior
Year Equity
Awards
Forfeited
During Year
for Second PEO


Total –
Inclusion of
Equity
Values for
Second PEO ($)

2025


395,630


395,630

2024


2023


Year


Average Year-
End Fair Value
of Equity
Awards Granted
During Year
That Remained
Outstanding and
Unvested as of
Last Day of
Year for Non-
PEO NEOs ($)


Average Change
in Fair Value
from Last Day of
Prior Year to Last
Day of Year of
Outstanding and
Unvested Equity
Awards Granted
in any Prior Year
for Non-PEO
NEOs ($)


Average
Vesting-
Date Fair
Value of
Equity
Awards
Granted
During Year
that Vested
During Year
for Non-
PEO NEOs
($)


Average
Change in Fair
Value from
Last Day of
Prior Year to
Vesting Date of
Unvested
Equity Awards
Granted in any
Prior Year that
Vested During
Year for Non-
PEO NEOs ($)


Average
Fair Value at
Last Day of
Prior Year
of Equity
Awards
Forfeited
During Year
for Non-
PEO NEOs
($)


Total –
Average
Inclusion of
Equity
Values for
Non-PEO
NEOs ($)

2025


38,404


(32,503)


13


149,012


154,926

2024


226,194


(157,584)


17,572


(107,701)


(21,519)

2023


439,267


(199,605)


88,258


(676,900)


(348,980)


Valuation assumptions used to calculate fair values did not materially differ from those used to calculate fair values at the time of grant as reflected in the amounts set forth in the Summary Compensation Table.

(4) Assumes $100 was invested for the period starting December 31, 2022 through the end of the listed year in our common stock. Historical stock performance is not necessarily indicative of future stock performance.

   
Named Executive Officers, Footnote Daniel R. Passeri was our PEO for 2023 and 2024 and our first PEO for 2025 in the table. Usman Azam was our second PEO for 2025. The Non-PEO NEOs were Kerri-Ann Millar and Anish Suri for 2023, Kerri-Ann Millar, Anish Suri and Matteo Levisetti for 2024, and Matteo Levisetti, Lucinda Warren and Colin Sandercock for 2025.    
Non-PEO NEO Average Total Compensation Amount $ 873,270 $ 1,138,725 $ 1,202,503
Non-PEO NEO Average Compensation Actually Paid Amount $ 805,919 528,183 117,009
Adjustment to Non-PEO NEO Compensation Footnote
(3)
Compensation Actually Paid reflects the exclusions and inclusions of certain amounts for the PEOs and the Non-PEO NEOs as set forth below. Equity values are calculated in accordance with FASB ASC Topic 718. Amounts in the Exclusion of Option Awards column are the totals from the Option Awards column set forth in the Summary Compensation Table.


Year


Summary
Compensation
Table Total
for First PEO ($)


Exclusion of
Option Awards
for First PEO ($)


Inclusion of
Equity Value
for First PEO ($)


Compensation
Actually Paid
to First PEO ($)

2025


1,426,183


(336,555)


183,142


1,272,770

2024


1,393,921


(711,195)


(387,893)


294,833

2023


3,015,480


(2,407,500)


748,670


1,356,650


Year


Summary
Compensation
Table Total
for Second PEO ($)


Exclusion of
Option Awards
for Second PEO ($)


Inclusion of
Equity Value
for Second PEO ($)


Compensation
Actually Paid
to Second PEO ($)

2025


1,185,639


(1,042,313)


395,630


538,956

2024


2023


Year


Average Summary
Compensation Table
Total for Non-PEO
NEOs ($)


Average Exclusion
of Option Awards
for Non-PEO
NEOs ($)


Average Inclusion of
Equity Values for
Non-PEO NEOs ($)


Average
Compensation
Actually Paid to
Non-PEO
NEOs ($)

2025


873,270


(222,277)


154,926


805,919

2024


1,138,725


(589,023)


(21,519)


528,183

2023


1,202,503


(736,514)


(348,980)


117,009


The amounts in the Inclusion of Equity Values in the tables above are derived from the amounts set forth in the following tables:


Year


Year-End Fair
Value of Equity
Awards Granted
During Year That
Remained
Outstanding and
Unvested as of
Last Day of Year
for First PEO ($)


Change in Fair
Value from Last
Day of Prior Year
to Last Day of
Year of
Outstanding and
Unvested Equity
Awards Granted
in any Prior Year
for First PEO ($)


Vesting-
Date Fair
Value of
Equity
Awards
Granted
During Year
that Vested
During Year
for First PEO ($)


Change in Fair
Value from Last
Day of Prior
Year to Vesting
Date of
Unvested
Equity Awards
Granted in any
Prior Year that
Vested During
Year for First PEO


Fair Value
at Last Day
of Prior
Year Equity
Awards
Forfeited
During Year
for First PEO


Total –
Inclusion of
Equity
Values for
First PEO ($)

2025


110,289


(208,020)


50,326


230,547


183,142

2024


524,484


(543,213)


13,195


(382,359)


(387,893)

2023


1,190,794


(245,681)


247,336


(443,779)


748,670


Year


Year-End Fair
Value of Equity
Awards Granted
During Year That
Remained
Outstanding and
Unvested as of
Last Day of Year
for Second PEO ($)


Change in Fair
Value from Last
Day of Prior Year
to Last Day of
Year of
Outstanding and
Unvested Equity
Awards Granted
in any Prior Year
for Second PEO ($)


Vesting-
Date Fair
Value of
Equity
Awards
Granted
During Year
that Vested
During Year
for Second PEO ($)


Change in Fair
Value from Last
Day of Prior
Year to Vesting
Date of
Unvested
Equity Awards
Granted in any
Prior Year that
Vested During
Year for Second PEO


Fair Value
at Last Day
of Prior
Year Equity
Awards
Forfeited
During Year
for Second PEO


Total –
Inclusion of
Equity
Values for
Second PEO ($)

2025


395,630


395,630

2024


2023


Year


Average Year-
End Fair Value
of Equity
Awards Granted
During Year
That Remained
Outstanding and
Unvested as of
Last Day of
Year for Non-
PEO NEOs ($)


Average Change
in Fair Value
from Last Day of
Prior Year to Last
Day of Year of
Outstanding and
Unvested Equity
Awards Granted
in any Prior Year
for Non-PEO
NEOs ($)


Average
Vesting-
Date Fair
Value of
Equity
Awards
Granted
During Year
that Vested
During Year
for Non-
PEO NEOs
($)


Average
Change in Fair
Value from
Last Day of
Prior Year to
Vesting Date of
Unvested
Equity Awards
Granted in any
Prior Year that
Vested During
Year for Non-
PEO NEOs ($)


Average
Fair Value at
Last Day of
Prior Year
of Equity
Awards
Forfeited
During Year
for Non-
PEO NEOs
($)


Total –
Average
Inclusion of
Equity
Values for
Non-PEO
NEOs ($)

2025


38,404


(32,503)


13


149,012


154,926

2024


226,194


(157,584)


17,572


(107,701)


(21,519)

2023


439,267


(199,605)


88,258


(676,900)


(348,980)

   
Compensation Actually Paid vs. Total Shareholder Return

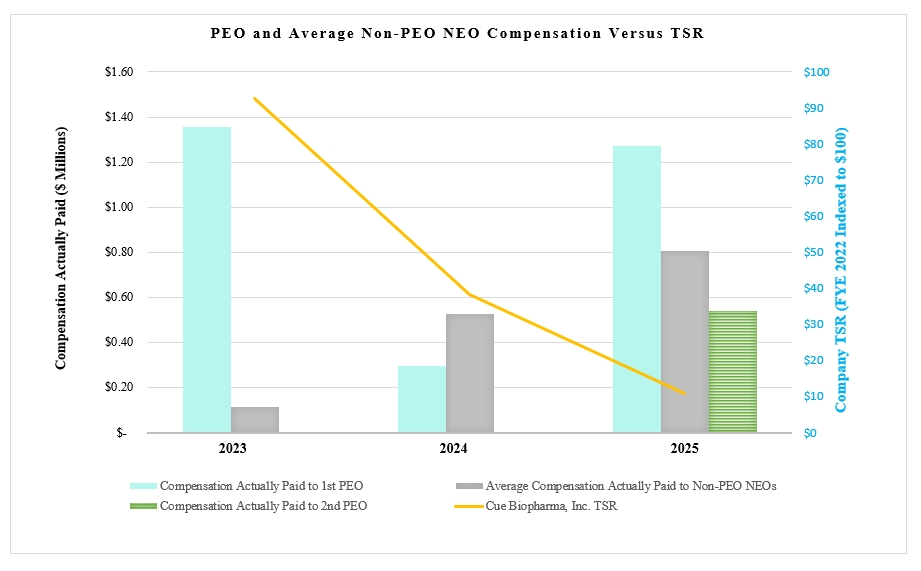
Description of Relationship Between PEOs and Average Non-PEO NEO Compensation Actually Paid and Company Total Shareholder Return (“TSR”)

The following chart sets forth the relationship between Compensation Actually Paid to our PEOs, the average Compensation Actually Paid to our Non-PEO NEOs, and the Company’s cumulative TSR over the three most recently completed fiscal years.


img128100632_2.jpg

   
Compensation Actually Paid vs. Net Income

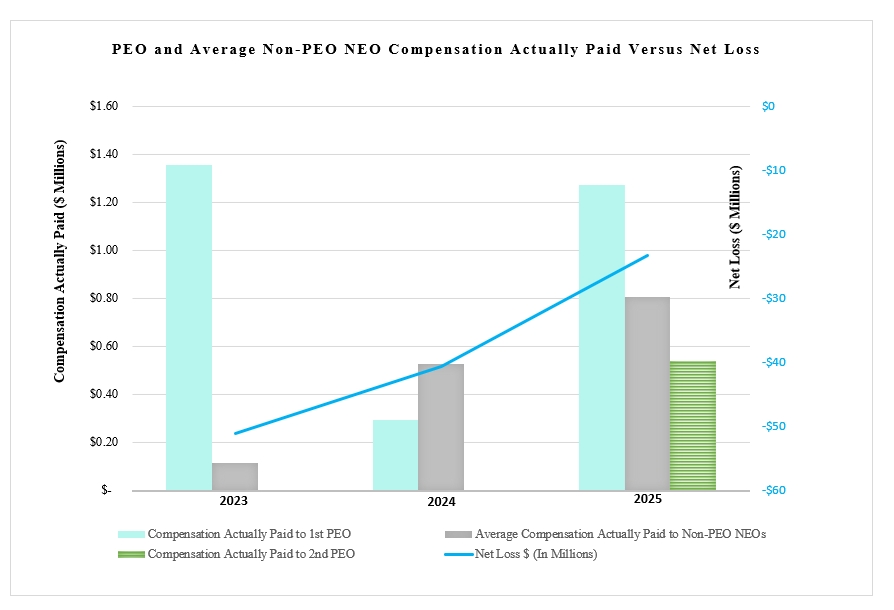
Description of Relationship Between PEOs and Average Non-PEO NEO Compensation Actually Paid and Net Loss

The following chart sets forth the relationship between Compensation Actually Paid to our PEOs, the average Compensation Actually Paid to our Non-PEO NEOs, and our Net Loss during the three most recently completed fiscal years.

img128100632_3.jpg

   
Total Shareholder Return Amount $ 10.68 38.25 92.63
Net Income (Loss) $ (23,000,000) (41,000,000) (51,000,000)
Additional 402(v) Disclosure
(2)
The amounts shown for Compensation Actually Paid have been calculated in accordance with Item 402(v) of Regulation S-K and do not reflect compensation actually earned, realized, or received by the Company’s named executive officers during the applicable years. These amounts reflect the Summary Compensation Table Total with certain adjustments made in accordance with Item 402(v) and as described in footnote 3 below.
   
Daniel R. Passeri [Member]      
Pay vs Performance Disclosure      
PEO Total Compensation Amount $ 1,426,183 1,393,921 3,015,480
PEO Actually Paid Compensation Amount $ 1,272,770 $ 294,833 $ 1,356,650
PEO Name Daniel R. Passeri Daniel R. Passeri Daniel R. Passeri
Usman Azam [Member]      
Pay vs Performance Disclosure      
PEO Total Compensation Amount $ 1,185,639 $ 0 $ 0
PEO Actually Paid Compensation Amount $ 538,956 0 0
PEO Name Usman Azam    
PEO | Daniel R. Passeri [Member]      
Pay vs Performance Disclosure      
Adjustment to Compensation, Amount $ 183,142 (387,893) 748,670
PEO | Daniel R. Passeri [Member] | Year-end Fair Value of Equity Awards Granted in Covered Year that are Outstanding and Unvested      
Pay vs Performance Disclosure      
Adjustment to Compensation, Amount 110,289 524,484 1,190,794
PEO | Daniel R. Passeri [Member] | Year-over-Year Change in Fair Value of Equity Awards Granted in Prior Years That are Outstanding and Unvested      
Pay vs Performance Disclosure      
Adjustment to Compensation, Amount (208,020) (543,213) (245,681)
PEO | Daniel R. Passeri [Member] | Vesting Date Fair Value of Equity Awards Granted and Vested in Covered Year      
Pay vs Performance Disclosure      
Adjustment to Compensation, Amount 50,326 13,195 247,336
PEO | Daniel R. Passeri [Member] | Change in Fair Value as of Vesting Date of Prior Year Equity Awards Vested in Covered Year      
Pay vs Performance Disclosure      
Adjustment to Compensation, Amount 230,547 (382,359) (443,779)
PEO | Daniel R. Passeri [Member] | Prior Year End Fair Value of Equity Awards Granted in Any Prior Year that Fail to Meet Applicable Vesting Conditions During Covered Year      
Pay vs Performance Disclosure      
Adjustment to Compensation, Amount 0 0 0
PEO | Daniel R. Passeri [Member] | Exclusion Of Stock Awards [Member]      
Pay vs Performance Disclosure      
Adjustment to Compensation, Amount (336,555) (711,195) (2,407,500)
PEO | Usman Azam [Member]      
Pay vs Performance Disclosure      
Adjustment to Compensation, Amount 395,630 0 0
PEO | Usman Azam [Member] | Year-end Fair Value of Equity Awards Granted in Covered Year that are Outstanding and Unvested      
Pay vs Performance Disclosure      
Adjustment to Compensation, Amount 395,630 0 0
PEO | Usman Azam [Member] | Year-over-Year Change in Fair Value of Equity Awards Granted in Prior Years That are Outstanding and Unvested      
Pay vs Performance Disclosure      
Adjustment to Compensation, Amount 0 0 0
PEO | Usman Azam [Member] | Vesting Date Fair Value of Equity Awards Granted and Vested in Covered Year      
Pay vs Performance Disclosure      
Adjustment to Compensation, Amount 0 0 0
PEO | Usman Azam [Member] | Change in Fair Value as of Vesting Date of Prior Year Equity Awards Vested in Covered Year      
Pay vs Performance Disclosure      
Adjustment to Compensation, Amount 0 0 0
PEO | Usman Azam [Member] | Prior Year End Fair Value of Equity Awards Granted in Any Prior Year that Fail to Meet Applicable Vesting Conditions During Covered Year      
Pay vs Performance Disclosure      
Adjustment to Compensation, Amount 0 0 0
PEO | Usman Azam [Member] | Exclusion Of Stock Awards [Member]      
Pay vs Performance Disclosure      
Adjustment to Compensation, Amount (1,042,313) 0 0
Non-PEO NEO      
Pay vs Performance Disclosure      
Adjustment to Compensation, Amount 154,926 (21,519) (348,980)
Non-PEO NEO | Year-end Fair Value of Equity Awards Granted in Covered Year that are Outstanding and Unvested      
Pay vs Performance Disclosure      
Adjustment to Compensation, Amount 38,404 226,194 439,267
Non-PEO NEO | Year-over-Year Change in Fair Value of Equity Awards Granted in Prior Years That are Outstanding and Unvested      
Pay vs Performance Disclosure      
Adjustment to Compensation, Amount (32,503) (157,584) (199,605)
Non-PEO NEO | Vesting Date Fair Value of Equity Awards Granted and Vested in Covered Year      
Pay vs Performance Disclosure      
Adjustment to Compensation, Amount 13 17,572 88,258
Non-PEO NEO | Change in Fair Value as of Vesting Date of Prior Year Equity Awards Vested in Covered Year      
Pay vs Performance Disclosure      
Adjustment to Compensation, Amount 149,012 (107,701) (676,900)
Non-PEO NEO | Prior Year End Fair Value of Equity Awards Granted in Any Prior Year that Fail to Meet Applicable Vesting Conditions During Covered Year      
Pay vs Performance Disclosure      
Adjustment to Compensation, Amount 0 0 0
Non-PEO NEO | Exclusion Of Stock Awards [Member]      
Pay vs Performance Disclosure      
Adjustment to Compensation, Amount $ (222,277) $ (589,023) $ (736,514)