Shareholder Report
Dec. 31, 2025
USD ($)
$ / shares
WHAT WERE THE FUND COSTS FOR THE PAST YEAR? (based on a hypothetical $10,000 investment)
|
Class Name
|
Costs of a $10,000 investment
|
Costs paid as a percentage of a $10,000 investment
|
|
Advisor Class A
|
$183
|
1.92%
|
HOW DID THE FUND PERFORM LAST YEAR AND WHAT AFFECTED ITS PERFORMANCE?
For the 12-month period ended December 31, 2025, the Fund’s Advisor Class A posted a 9.27% loss trailing the S&P 500 Index and the NASDAQ Composite Index which posted 17.88% and 21.14%, respectively.
WHAT FACTORS INFLUENCED PERFORMANCE
The Fund’s performance was largely driven by its exposure to blockchain and cryptocurrency. Bitcoin prices reached an all-time high price this year, but declined into the year end. Regardless, Bitcoin continues to distinguish itself from other cryptocurrencies, which is supported by an increasingly supportive regulatory environment. The Fund also experienced losses in various “hard asset” companies, which we believe stand to benefit from rising price levels as well as technological innovations, particularly in the energy sector. These losses were partially offset by gains in defense technology, financial exchange and payments companies.
POSITIONING
The portfolio remains focused on undervalued companies participating in the growth of the internet as well as companies that provide new services or products made possible by internet-related technologies. Guided by our long-term value investment philosophy, the Fund may experience periods of outperformance or underperformance relative to the benchmark, but we believe the Fund is well-positioned to generate above-market returns over the long term.
PERFORMANCE
The Fund’s top contributor: Security selection within financial services (exchanges), specifically Miami International Holdings (Ticker: MIAX).
The Fund’s top detractor: Security selection within the blockchain/crypto, specifically Grayscale Bitcoin Trust (Ticker: GBTC).
The Fund’s top detractor: Security selection within the blockchain/crypto, specifically Grayscale Bitcoin Trust (Ticker: GBTC).
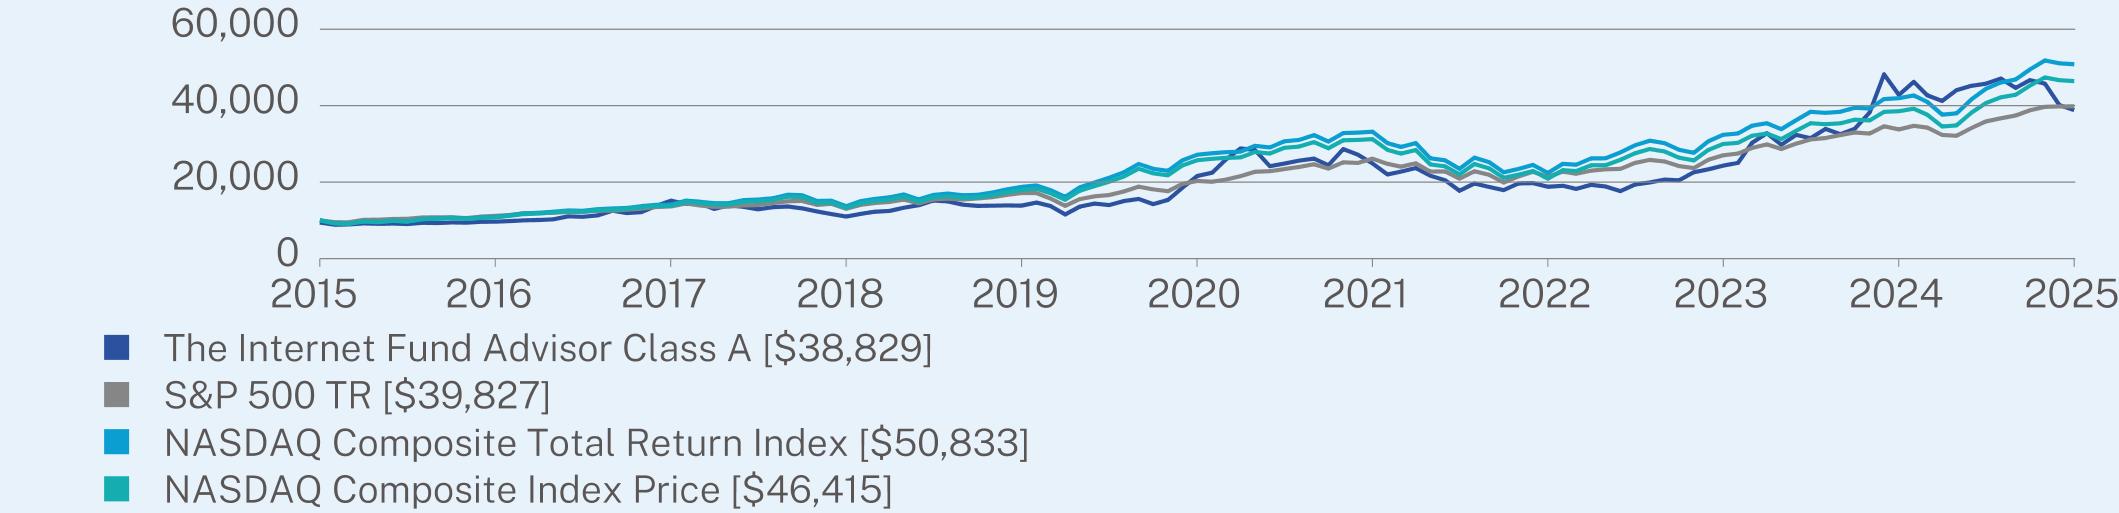
ANNUAL AVERAGE TOTAL RETURN (%)
|
|
1 Year
|
5 Year
|
10 Year
|
|
Advisor Class A (without sales charge)
|
-9.27
|
12.43
|
15.21
|
|
Advisor Class A (with sales charge)
|
-14.49
|
11.11
|
14.53
|
|
S&P 500 TR
|
17.88
|
14.42
|
14.82
|
|
NASDAQ Composite Total Return Index
|
21.14
|
13.35
|
17.66
|
|
NASDAQ Composite Index Price
|
20.36
|
12.52
|
16.59
|
Visit https://kineticsfunds.com/resources/ for more recent performance information.
KEY FUND STATISTICS (as of December 31, 2025)
|
Net Assets
|
$281,748,329
|
|
Number of Holdings
|
42
|
|
Net Advisory Fee
|
$4,229,249
|
|
Portfolio Turnover
|
45%
|
WHAT DID THE FUND INVEST IN? (as of December 31, 2025)
|
Top Sectors
|
(%)
|
|
Finance and Insurance
|
61.4%
|
|
Utilities
|
19.3%
|
|
Professional, Scientific, and Technical Services
|
4.4%
|
|
Real Estate and Rental and Leasing
|
1.3%
|
|
Manufacturing
|
1.2%
|
|
Information
|
1.2%
|
|
Administrative and Support and Waste Management and Remediation Services
|
1.0%
|
|
Management of Companies and Enterprises
|
0.2%
|
|
Arts, Entertainment, and Recreation
|
0.2%
|
|
Cash & Other
|
9.8%
|
|
Top 10 Issuers
|
(%)
|
|
Grayscale Bitcoin Trust ETF
|
52.0%
|
|
Texas Pacific Land Corp.
|
19.3%
|
|
Grayscale Bitcoin Mini Trust ETF
|
5.9%
|
|
CACI International, Inc.
|
3.8%
|
|
Miami International Holdings Inc.
|
2.7%
|
|
OTC Markets Group, Inc. - Class A
|
2.2%
|
|
Bolt Data & Energy Inc.
|
1.4%
|
|
Galaxy Digital, Inc.
|
1.2%
|
|
Landbridge Co. LLC
|
1.2%
|
|
Mastercard, Inc.
|
1.0%
|
WHAT WERE THE FUND COSTS FOR THE PAST YEAR? (based on a hypothetical $10,000 investment)
|
Class Name
|
Costs of a $10,000 investment
|
Costs paid as a percentage of a $10,000 investment
|
|
Advisor Class C
|
$230
|
2.42%
|
HOW DID THE FUND PERFORM LAST YEAR AND WHAT AFFECTED ITS PERFORMANCE?
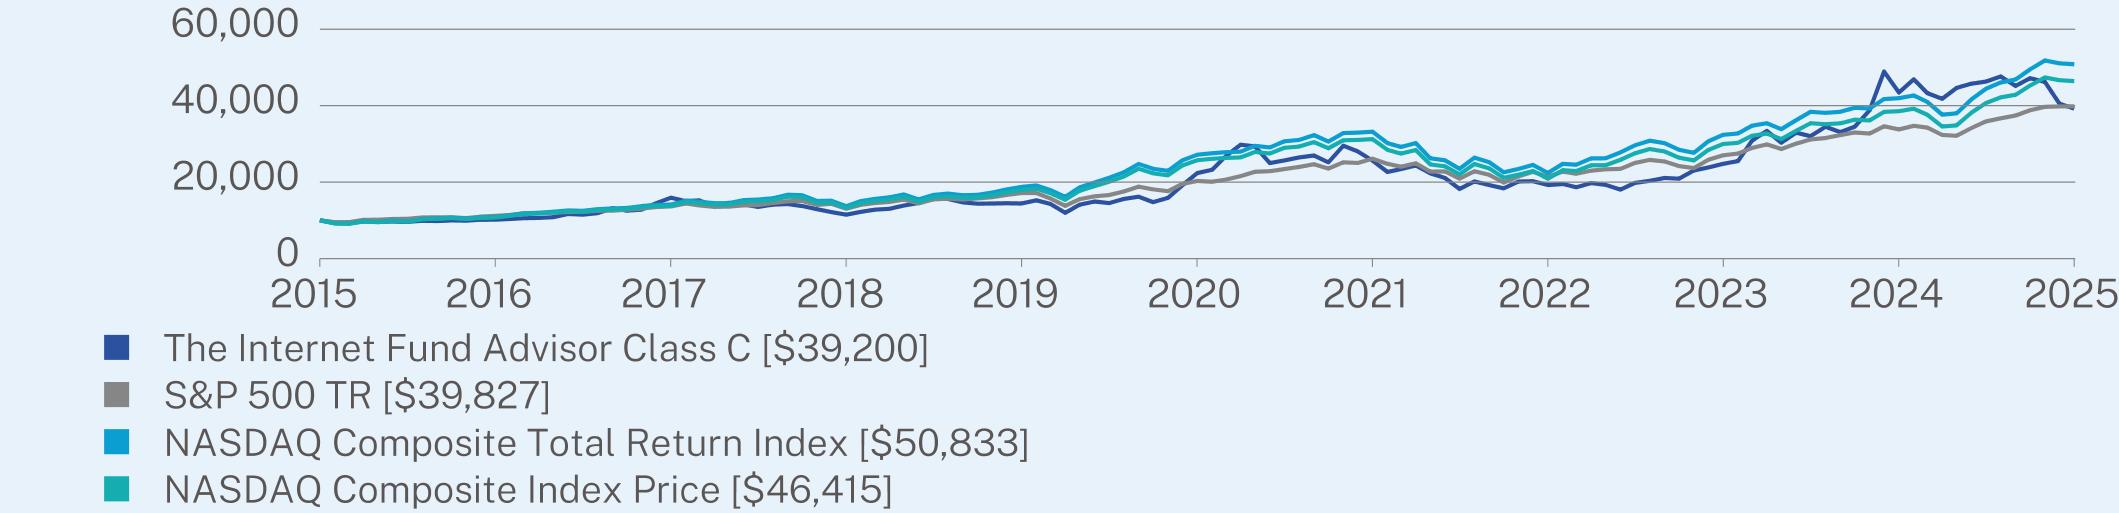
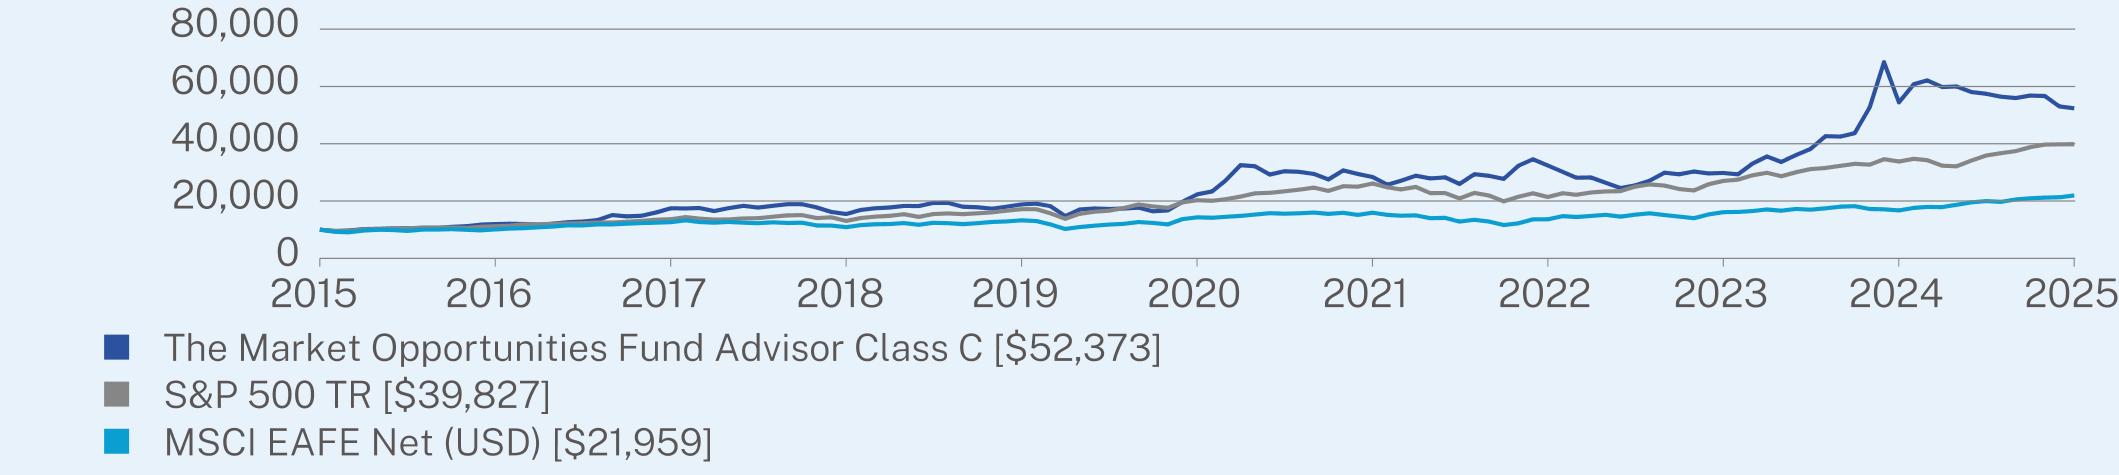
For the 12-month period ended December 31, 2025, the Fund’s Advisor Class C posted a 9.72% loss trailing the S&P 500 Index and the NASDAQ Composite Index which posted 17.88% and 21.14%, respectively.
WHAT FACTORS INFLUENCED PERFORMANCE
The Fund’s performance was largely driven by its exposure to blockchain and cryptocurrency. Bitcoin prices reached an all-time high price this year, but declined into the year end. Regardless, Bitcoin continues to distinguish itself from other cryptocurrencies, which is supported by an increasingly supportive regulatory environment. The Fund also experienced losses in various “hard asset” companies, which we believe stand to benefit from rising price levels as well as technological innovations, particularly in the energy sector. These losses were partially offset by gains in defense technology, financial exchange and payments companies.
POSITIONING
The portfolio remains focused on undervalued companies participating in the growth of the internet as well as companies that provide new services or products made possible by internet-related technologies. Guided by our long-term value investment philosophy, the Fund may experience periods of outperformance or underperformance relative to the benchmark, but we believe the Fund is well-positioned to generate above-market returns over the long term.
PERFORMANCE
The Fund’s top contributor: Security selection within financial services (exchanges), specifically Miami International Holdings (Ticker: MIAX).
The Fund’s top detractor: Security selection within the blockchain/crypto, specifically Grayscale Bitcoin Trust (Ticker: GBTC).
The Fund’s top detractor: Security selection within the blockchain/crypto, specifically Grayscale Bitcoin Trust (Ticker: GBTC).
ANNUAL AVERAGE TOTAL RETURN (%)
|
|
1 Year
|
5 Year
|
10 Year
|
|
Advisor Class C (without sales charge)
|
-9.72
|
11.87
|
14.64
|
|
Advisor Class C (with sales charge)
|
-10.60
|
11.87
|
14.64
|
|
S&P 500 TR
|
17.88
|
14.42
|
14.82
|
|
NASDAQ Composite Total Return Index
|
21.14
|
13.35
|
17.66
|
|
NASDAQ Composite Index Price
|
20.36
|
12.52
|
16.59
|
Visit https://kineticsfunds.com/resources/ for more recent performance information.
KEY FUND STATISTICS (as of December 31, 2025)
|
Net Assets
|
$281,748,329
|
|
Number of Holdings
|
42
|
|
Net Advisory Fee
|
$4,229,249
|
|
Portfolio Turnover
|
45%
|
WHAT DID THE FUND INVEST IN? (as of December 31, 2025)
|
Top Sectors
|
(%)
|
|
Finance and Insurance
|
61.4%
|
|
Utilities
|
19.3%
|
|
Professional, Scientific, and Technical Services
|
4.4%
|
|
Real Estate and Rental and Leasing
|
1.3%
|
|
Manufacturing
|
1.2%
|
|
Information
|
1.2%
|
|
Administrative and Support and Waste Management and Remediation Services
|
1.0%
|
|
Management of Companies and Enterprises
|
0.2%
|
|
Arts, Entertainment, and Recreation
|
0.2%
|
|
Cash & Other
|
9.8%
|
|
Top 10 Issuers
|
(%)
|
|
Grayscale Bitcoin Trust ETF
|
52.0%
|
|
Texas Pacific Land Corp.
|
19.3%
|
|
Grayscale Bitcoin Mini Trust ETF
|
5.9%
|
|
CACI International, Inc.
|
3.8%
|
|
Miami International Holdings Inc.
|
2.7%
|
|
OTC Markets Group, Inc. - Class A
|
2.2%
|
|
Bolt Data & Energy Inc.
|
1.4%
|
|
Galaxy Digital, Inc.
|
1.2%
|
|
Landbridge Co. LLC
|
1.2%
|
|
Mastercard, Inc.
|
1.0%
|
WHAT WERE THE FUND COSTS FOR THE PAST YEAR? (based on a hypothetical $10,000 investment)
|
Class Name
|
Costs of a $10,000 investment
|
Costs paid as a percentage of a $10,000 investment
|
|
No Load Class
|
$159
|
1.67%
|
HOW DID THE FUND PERFORM LAST YEAR AND WHAT AFFECTED ITS PERFORMANCE?
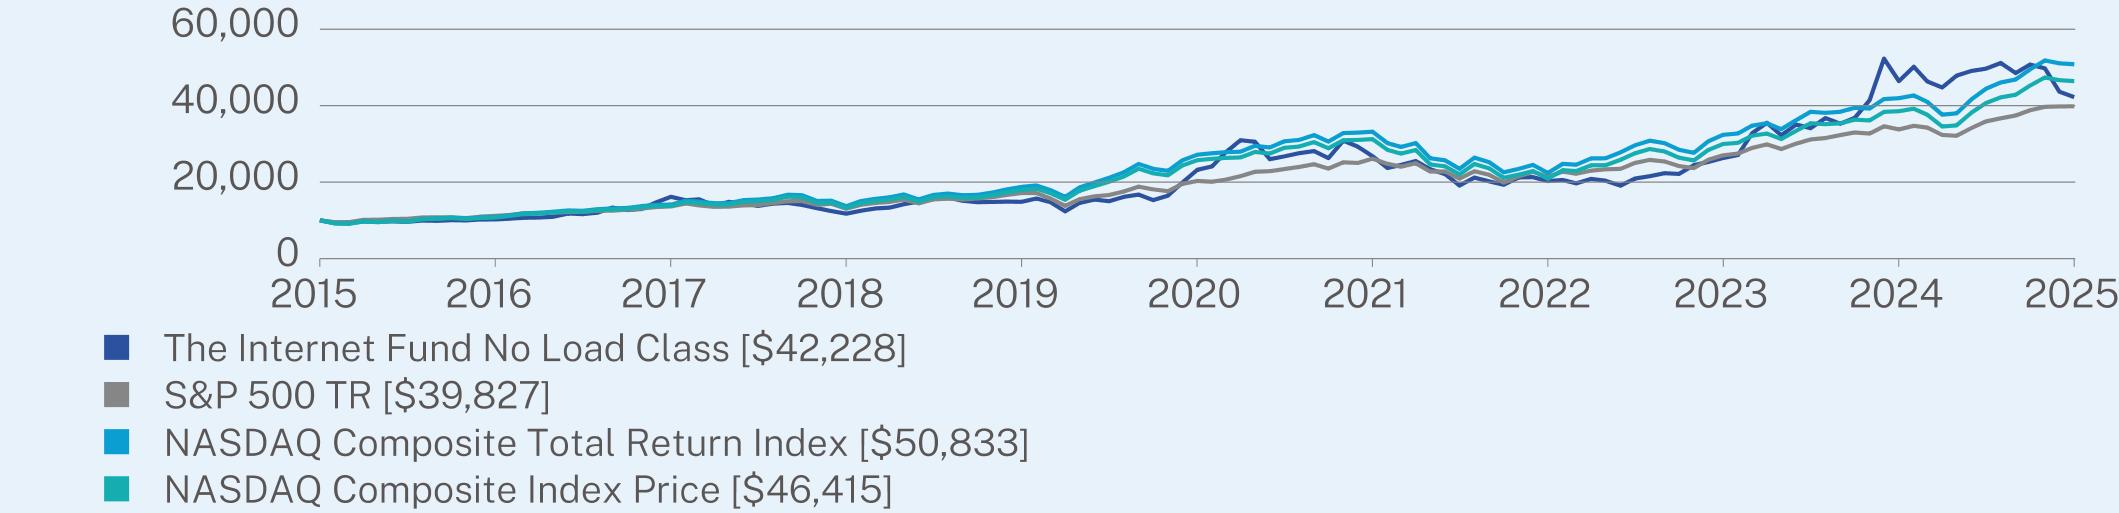
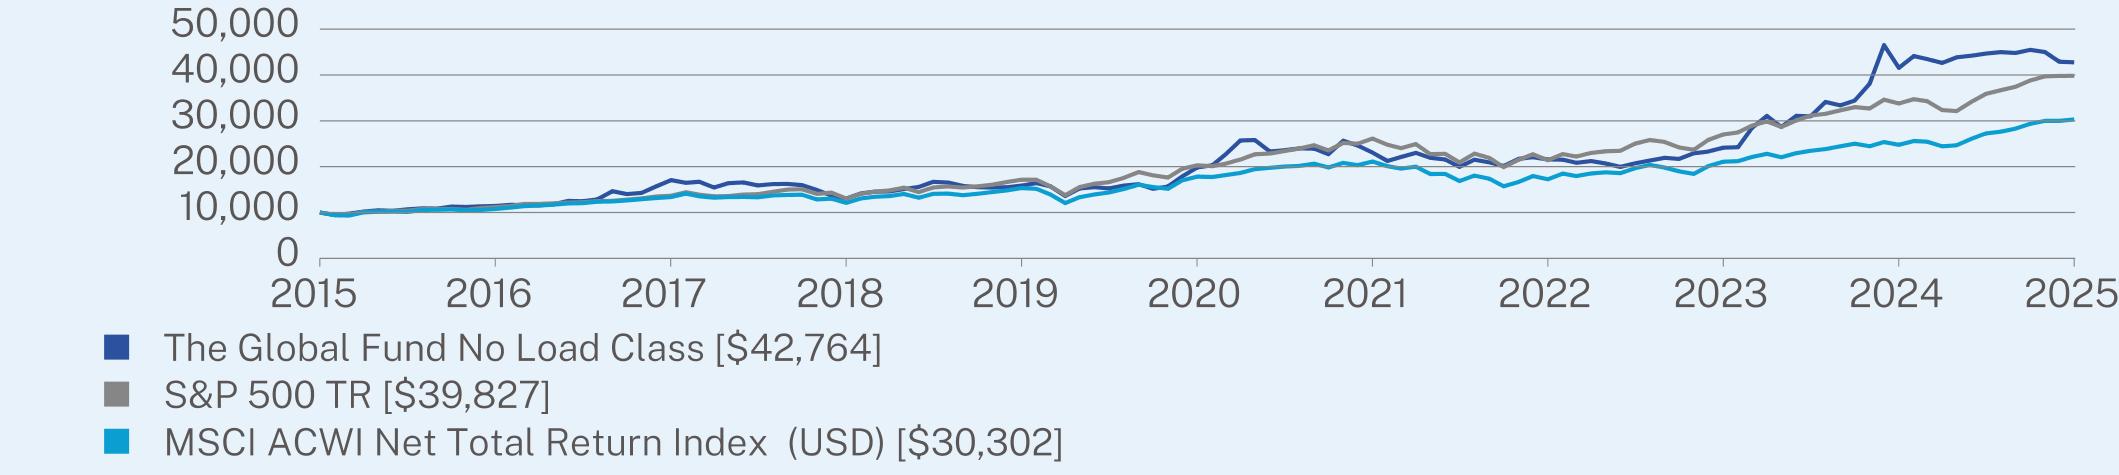
For the 12-month period ended December 31, 2025, the Fund’s No-Load class posted a 9.04% loss trailing the S&P 500 Index and the NASDAQ Composite Index which posted 17.88% and 21.14%, respectively.
WHAT FACTORS INFLUENCED PERFORMANCE
The Fund’s performance was largely driven by its exposure to blockchain and cryptocurrency. Bitcoin prices reached an all-time high price this year, but declined into the year end. Regardless, Bitcoin continues to distinguish itself from other cryptocurrencies, which is supported by an increasingly supportive regulatory environment. The Fund also experienced losses in various “hard asset” companies, which we believe stand to benefit from rising price levels as well as technological innovations, particularly in the energy sector. These losses were partially offset by gains in defense technology, financial exchange and payments companies.
POSITIONING
The portfolio remains focused on undervalued companies participating in the growth of the internet as well as companies that provide new services or products made possible by internet-related technologies. Guided by our long-term value investment philosophy, the Fund may experience periods of outperformance or underperformance relative to the benchmark, but we believe the Fund is well-positioned to generate above-market returns over the long term.
PERFORMANCE
The Fund’s top contributor: Security selection within financial services (exchanges), specifically Miami International Holdings (Ticker: MIAX).
The Fund’s top detractor: Security selection within the blockchain/crypto, specifically Grayscale Bitcoin Trust (Ticker: GBTC).
The Fund’s top detractor: Security selection within the blockchain/crypto, specifically Grayscale Bitcoin Trust (Ticker: GBTC).
ANNUAL AVERAGE TOTAL RETURN (%)
|
|
1 Year
|
5 Year
|
10 Year
|
|
No Load Class (without sales charge)
|
-9.04
|
12.71
|
15.49
|
|
S&P 500 TR
|
17.88
|
14.42
|
14.82
|
|
NASDAQ Composite Total Return Index
|
21.14
|
13.35
|
17.66
|
|
NASDAQ Composite Index Price
|
20.36
|
12.52
|
16.59
|
Visit https://kineticsfunds.com/resources/ for more recent performance information.
KEY FUND STATISTICS (as of December 31, 2025)
|
Net Assets
|
$281,748,329
|
|
Number of Holdings
|
42
|
|
Net Advisory Fee
|
$4,229,249
|
|
Portfolio Turnover
|
45%
|
WHAT DID THE FUND INVEST IN? (as of December 31, 2025)
|
Top Sectors
|
(%)
|
|
Finance and Insurance
|
61.4%
|
|
Utilities
|
19.3%
|
|
Professional, Scientific, and Technical Services
|
4.4%
|
|
Real Estate and Rental and Leasing
|
1.3%
|
|
Manufacturing
|
1.2%
|
|
Information
|
1.2%
|
|
Administrative and Support and Waste Management and Remediation Services
|
1.0%
|
|
Management of Companies and Enterprises
|
0.2%
|
|
Arts, Entertainment, and Recreation
|
0.2%
|
|
Cash & Other
|
9.8%
|
|
Top 10 Issuers
|
(%)
|
|
Grayscale Bitcoin Trust ETF
|
52.0%
|
|
Texas Pacific Land Corp.
|
19.3%
|
|
Grayscale Bitcoin Mini Trust ETF
|
5.9%
|
|
CACI International, Inc.
|
3.8%
|
|
Miami International Holdings Inc.
|
2.7%
|
|
OTC Markets Group, Inc. - Class A
|
2.2%
|
|
Bolt Data & Energy Inc.
|
1.4%
|
|
Galaxy Digital, Inc.
|
1.2%
|
|
Landbridge Co. LLC
|
1.2%
|
|
Mastercard, Inc.
|
1.0%
|
WHAT WERE THE FUND COSTS FOR THE PAST YEAR? (based on a hypothetical $10,000 investment)
|
Class Name
|
Costs of a $10,000 investment
|
Costs paid as a percentage of a $10,000 investment
|
|
Advisor Class A
|
$166
|
1.64%
|
HOW DID THE FUND PERFORM LAST YEAR AND WHAT AFFECTED ITS PERFORMANCE?
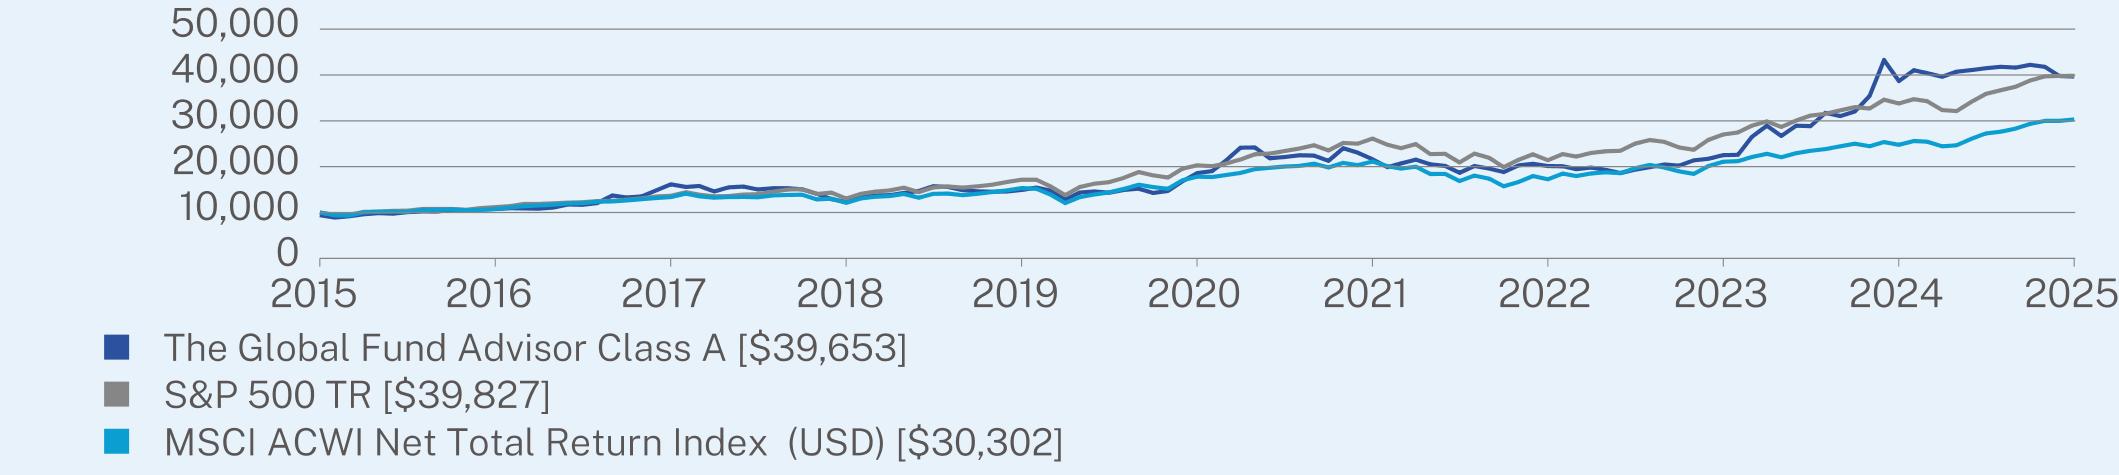
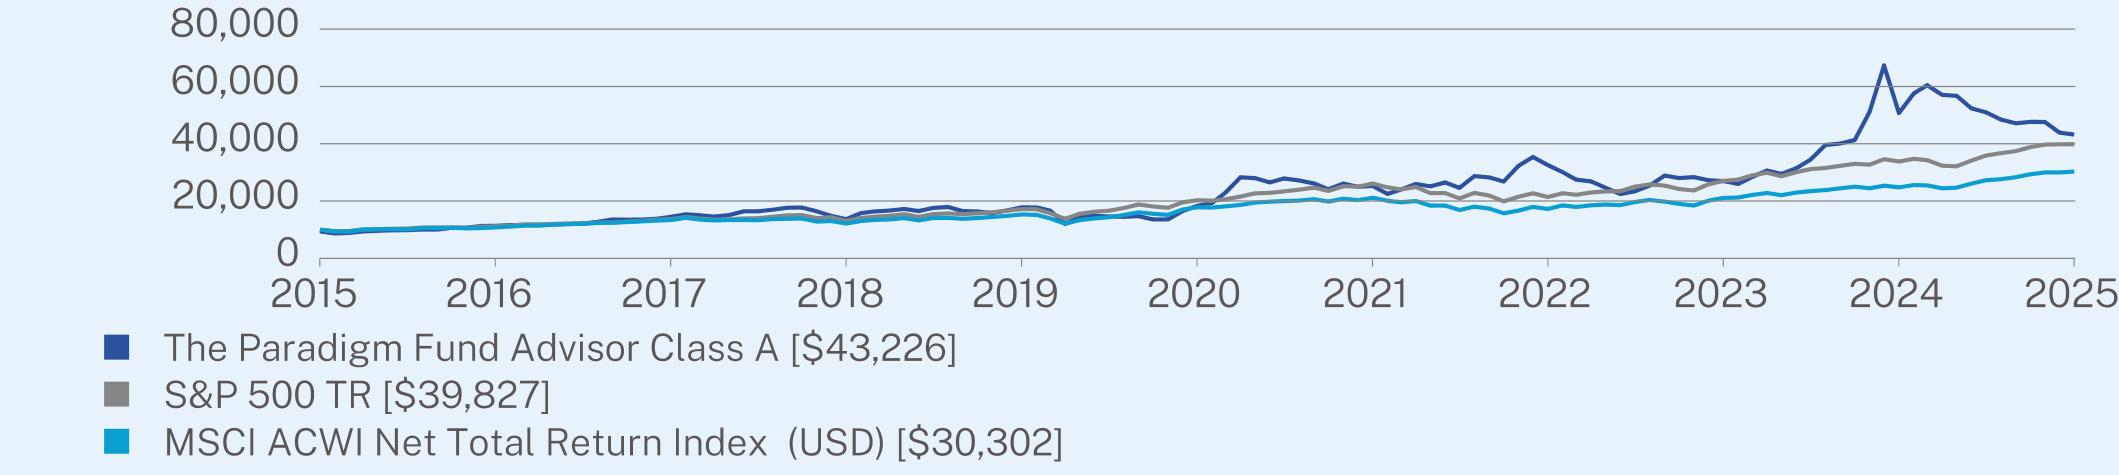
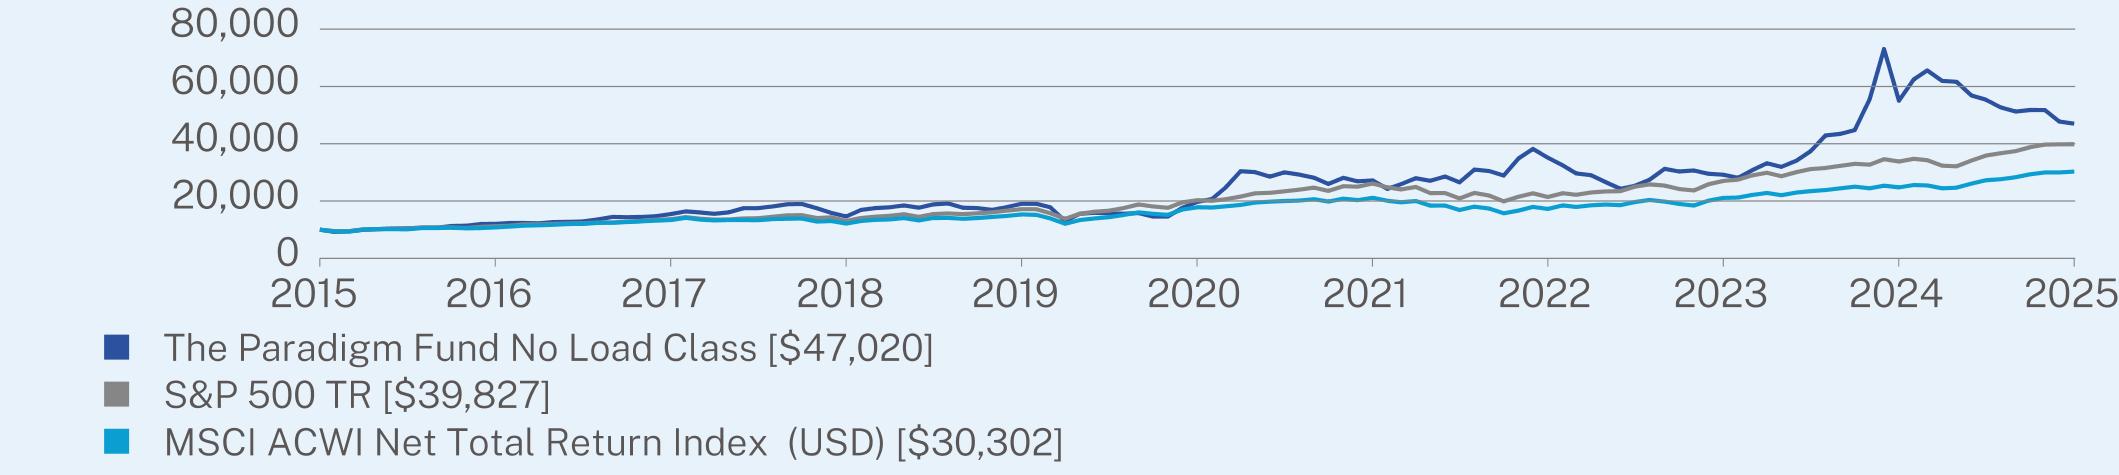
For the 12-month period ended December 31, 2025, the Fund’s Advisor Class A posted a gain of 2.55%, trailing the S&P 500 Index and MSCI All Country World Index which posted 17.88% and 22.34%, respectively.
WHAT FACTORS INFLUENCED PERFORMANCE
The Fund’s performance was driven by negative returns in blockchain/Bitcoin related investments as well as land companies. These investments remain strong long-term investments, despite having mixed performance this year. These losses were partially offset by gains in electric utility, precious metal royalty and insurance holding companies.
POSITIONING
The portfolio remains focused on global companies with unique business models exhibiting market mispricing and dislocation. Guided by our long-term value investment philosophy, the Fund may experience periods of outperformance or underperformance relative to the benchmark, but we believe the Fund is well-positioned to generate above-market returns over the long term.
PERFORMANCE
The Fund’s top contributor: Security selection within precious metals, specifically Wheaton Precious Metals (Ticker: WPM).
The Fund’s top detractor: Security selection within the Energy Sector, specifically Texas Pacific Land Corporation (Ticker: TPL).
The Fund’s top detractor: Security selection within the Energy Sector, specifically Texas Pacific Land Corporation (Ticker: TPL).
ANNUAL AVERAGE TOTAL RETURN (%)
|
|
1 Year
|
5 Year
|
10 Year
|
|
Advisor Class A (without sales charge)
|
2.55
|
16.34
|
15.45
|
|
Advisor Class A (with sales charge)
|
-3.34
|
14.98
|
14.77
|
|
S&P 500 TR
|
17.88
|
14.42
|
14.82
|
|
MSCI ACWI Net Total Return Index (USD)
|
22.34
|
11.19
|
11.72
|
Visit https://kineticsfunds.com/resources/ for more recent performance information.
KEY FUND STATISTICS (as of December 31, 2025)
|
Net Assets
|
$54,795,285
|
|
Number of Holdings
|
79
|
|
Net Advisory Fee
|
$795,857
|
|
Portfolio Turnover
|
5%
|
WHAT DID THE FUND INVEST IN? (as of December 31, 2025)
|
Top Sectors
|
(%)
|
|
Finance and Insurance
|
25.7%
|
|
Management of Companies and Enterprises
|
17.1%
|
|
Utilities
|
13.6%
|
|
Financials
|
11.8%
|
|
Mining, Quarrying, and Oil and Gas Extraction
|
4.5%
|
|
Real Estate and Rental and Leasing
|
4.4%
|
|
Wholesale Trade
|
3.9%
|
|
Communications
|
3.6%
|
|
Manufacturing
|
2.4%
|
|
Cash & Other
|
13.0%
|
|
Top 10 Issuers
|
(%)
|
|
Grayscale Bitcoin Trust ETF
|
19.2%
|
|
Texas Pacific Land Corp.
|
13.6%
|
|
Hawaiian Electric Industries, Inc.
|
5.8%
|
|
White Mountains Insurance Group Ltd.
|
5.6%
|
|
Fairfax India Holdings Corp.
|
5.0%
|
|
Euronext N.V.
|
4.6%
|
|
Investor AB
|
4.4%
|
|
Wheaton Precious Metals Corp.
|
3.9%
|
|
Landbridge Co. LLC
|
3.2%
|
|
Royal Gold, Inc.
|
2.3%
|
|
Top Ten Countries
|
(%)
|
|
United States
|
63.9%
|
|
Canada
|
14.6%
|
|
Sweden
|
4.4%
|
|
Greece
|
4.2%
|
|
Japan
|
3.8%
|
|
United Kingdom
|
0.9%
|
|
Cayman Islands
|
0.5%
|
|
Netherlands
|
0.3%
|
|
Germany
|
0.3%
|
|
Cash & Other
|
7.1%
|
WHAT WERE THE FUND COSTS FOR THE PAST YEAR? (based on a hypothetical $10,000 investment)
|
Class Name
|
Costs of a $10,000 investment
|
Costs paid as a percentage of a $10,000 investment
|
|
Advisor Class C
|
$216
|
2.14%
|
HOW DID THE FUND PERFORM LAST YEAR AND WHAT AFFECTED ITS PERFORMANCE?
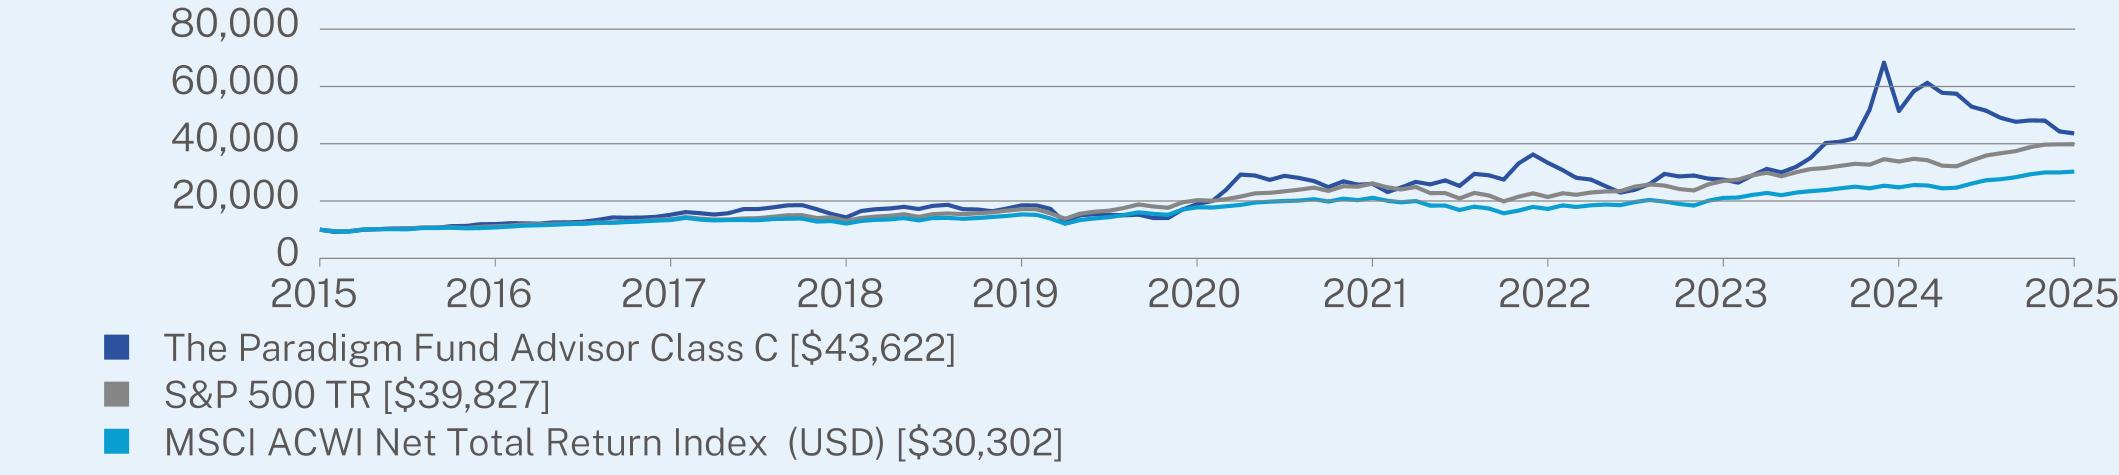
For the 12-month period ended December 31, 2025, the Fund’s Advisor Class C posted a gain of 2.06%, trailing the S&P 500 Index and MSCI All Country World Index which posted 17.88% and 22.34%, respectively.
WHAT FACTORS INFLUENCED PERFORMANCE
The Fund’s performance was driven by negative returns in blockchain/Bitcoin related investments as well as land companies. These investments remain strong long-term investments, despite having mixed performance this year. These losses were partially offset by gains in electric utility, precious metal royalty and insurance holding companies.
POSITIONING
The portfolio remains focused on global companies with unique business models exhibiting market mispricing and dislocation. Guided by our long-term value investment philosophy, the Fund may experience periods of outperformance or underperformance relative to the benchmark, but we believe the Fund is well-positioned to generate above-market returns over the long term.
PERFORMANCE
The Fund’s top contributor: Security selection within precious metals, specifically Wheaton Precious Metals (Ticker: WPM).
The Fund’s top detractor: Security selection within the Energy Sector, specifically Texas Pacific Land Corporation (Ticker: TPL).
The Fund’s top detractor: Security selection within the Energy Sector, specifically Texas Pacific Land Corporation (Ticker: TPL).

ANNUAL AVERAGE TOTAL RETURN (%)
|
|
1 Year
|
5 Year
|
10 Year
|
|
Advisor Class C (without sales charge)
|
2.06
|
15.75
|
14.78
|
|
Advisor Class C (with sales charge)
|
1.06
|
15.75
|
14.78
|
|
S&P 500 TR
|
17.88
|
14.42
|
14.82
|
|
MSCI ACWI Net Total Return Index (USD)
|
22.34
|
11.19
|
11.72
|
Visit https://kineticsfunds.com/resources/ for more recent performance information.
KEY FUND STATISTICS (as of December 31, 2025)
|
Net Assets
|
$54,795,285
|
|
Number of Holdings
|
79
|
|
Net Advisory Fee
|
$795,857
|
|
Portfolio Turnover
|
5%
|
WHAT DID THE FUND INVEST IN? (as of December 31, 2025)
|
Top Sectors
|
(%)
|
|
Finance and Insurance
|
25.7%
|
|
Management of Companies and Enterprises
|
17.1%
|
|
Utilities
|
13.6%
|
|
Financials
|
11.8%
|
|
Mining, Quarrying, and Oil and Gas Extraction
|
4.5%
|
|
Real Estate and Rental and Leasing
|
4.4%
|
|
Wholesale Trade
|
3.9%
|
|
Communications
|
3.6%
|
|
Manufacturing
|
2.4%
|
|
Cash & Other
|
13.0%
|
|
Top 10 Issuers
|
(%)
|
|
Grayscale Bitcoin Trust ETF
|
19.2%
|
|
Texas Pacific Land Corp.
|
13.6%
|
|
Hawaiian Electric Industries, Inc.
|
5.8%
|
|
White Mountains Insurance Group Ltd.
|
5.6%
|
|
Fairfax India Holdings Corp.
|
5.0%
|
|
Euronext N.V.
|
4.6%
|
|
Investor AB
|
4.4%
|
|
Wheaton Precious Metals Corp.
|
3.9%
|
|
Landbridge Co. LLC
|
3.2%
|
|
Royal Gold, Inc.
|
2.3%
|
|
Top Ten Countries
|
(%)
|
|
United States
|
63.9%
|
|
Canada
|
14.6%
|
|
Sweden
|
4.4%
|
|
Greece
|
4.2%
|
|
Japan
|
3.8%
|
|
United Kingdom
|
0.9%
|
|
Cayman Islands
|
0.5%
|
|
Netherlands
|
0.3%
|
|
Germany
|
0.3%
|
|
Cash & Other
|
7.1%
|
WHAT WERE THE FUND COSTS FOR THE PAST YEAR? (based on a hypothetical $10,000 investment)
|
Class Name
|
Costs of a $10,000 investment
|
Costs paid as a percentage of a $10,000 investment
|
|
No Load Class
|
$141
|
1.39%
|
HOW DID THE FUND PERFORM LAST YEAR AND WHAT AFFECTED ITS PERFORMANCE?
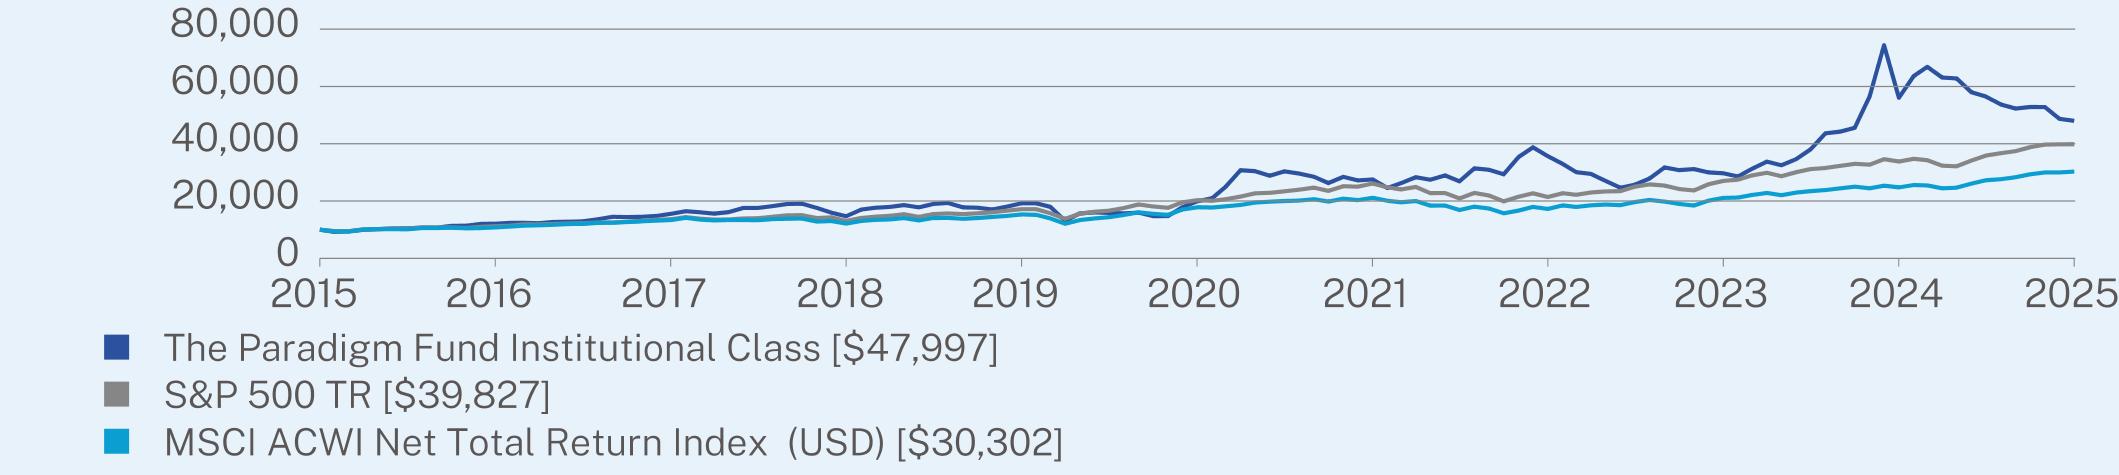
For the 12-month period ended December 31, 2025, the Fund’s No-Load class posted a gain of 2.89%, trailing the S&P 500 Index and MSCI All Country World Index which posted 17.88% and 22.34%, respectively.
WHAT FACTORS INFLUENCED PERFORMANCE
The Fund’s performance was driven by negative returns in blockchain/Bitcoin related investments as well as land companies. These investments remain strong long-term investments, despite having mixed performance this year. These losses were partially offset by gains in electric utility, precious metal royalty and insurance holding companies.
POSITIONING
The portfolio remains focused on global companies with unique business models exhibiting market mispricing and dislocation. Guided by our long-term value investment philosophy, the Fund may experience periods of outperformance or underperformance relative to the benchmark, but we believe the Fund is well-positioned to generate above-market returns over the long term.
PERFORMANCE
The Fund’s top contributor: Security selection within precious metals, specifically Wheaton Precious Metals (Ticker: WPM).
The Fund’s top detractor: Security selection within the Energy Sector, specifically Texas Pacific Land Corporation (Ticker: TPL).
The Fund’s top detractor: Security selection within the Energy Sector, specifically Texas Pacific Land Corporation (Ticker: TPL).
ANNUAL AVERAGE TOTAL RETURN (%)
|
|
1 Year
|
5 Year
|
10 Year
|
|
No Load Class (without sales charge)
|
2.89
|
16.61
|
15.64
|
|
S&P 500 TR
|
17.88
|
14.42
|
14.82
|
|
MSCI ACWI Net Total Return Index (USD)
|
22.34
|
11.19
|
11.72
|
Visit https://kineticsfunds.com/resources/ for more recent performance information.
KEY FUND STATISTICS (as of December 31, 2025)
|
Net Assets
|
$54,795,285
|
|
Number of Holdings
|
79
|
|
Net Advisory Fee
|
$795,857
|
|
Portfolio Turnover
|
5%
|
WHAT DID THE FUND INVEST IN? (as of December 31, 2025)
|
Top Sectors
|
(%)
|
|
Finance and Insurance
|
25.7%
|
|
Management of Companies and Enterprises
|
17.1%
|
|
Utilities
|
13.6%
|
|
Financials
|
11.8%
|
|
Mining, Quarrying, and Oil and Gas Extraction
|
4.5%
|
|
Real Estate and Rental and Leasing
|
4.4%
|
|
Wholesale Trade
|
3.9%
|
|
Communications
|
3.6%
|
|
Manufacturing
|
2.4%
|
|
Cash & Other
|
13.0%
|
|
Top 10 Issuers
|
(%)
|
|
Grayscale Bitcoin Trust ETF
|
19.2%
|
|
Texas Pacific Land Corp.
|
13.6%
|
|
Hawaiian Electric Industries, Inc.
|
5.8%
|
|
White Mountains Insurance Group Ltd.
|
5.6%
|
|
Fairfax India Holdings Corp.
|
5.0%
|
|
Euronext N.V.
|
4.6%
|
|
Investor AB
|
4.4%
|
|
Wheaton Precious Metals Corp.
|
3.9%
|
|
Landbridge Co. LLC
|
3.2%
|
|
Royal Gold, Inc.
|
2.3%
|
|
Top Ten Countries
|
(%)
|
|
United States
|
63.9%
|
|
Canada
|
14.6%
|
|
Sweden
|
4.4%
|
|
Greece
|
4.2%
|
|
Japan
|
3.8%
|
|
United Kingdom
|
0.9%
|
|
Cayman Islands
|
0.5%
|
|
Netherlands
|
0.3%
|
|
Germany
|
0.3%
|
|
Cash & Other
|
7.1%
|
WHAT WERE THE FUND COSTS FOR THE PAST YEAR? (based on a hypothetical $10,000 investment)
|
Class Name
|
Costs of a $10,000 investment
|
Costs paid as a percentage of a $10,000 investment
|
|
Advisor Class A
|
$175
|
1.89%
|
HOW DID THE FUND PERFORM LAST YEAR AND WHAT AFFECTED ITS PERFORMANCE?
For the 12-month period ended December 31, 2025, the Fund’s Advisor Class A posted a loss of 14.80% trailing the S&P 500 Index and MSCI All Country World Index which rose 17.88% and 22.34%, respectively.
WHAT FACTORS INFLUENCED PERFORMANCE
The Fund’s performance was driven by negative returns in specific land companies, which we believe are well-positioned to benefit from infrastructure development related to energy, water and power transmission. However, these companies have legacy energy businesses, which were negatively impacted by materially lower oil prices. The energy exposure is limited to royalties and infrastructure but proved vulnerable to macroeconomic factors. Blockchain and cryptocurrency also detracted modestly from returns, with Bitcoin prices ultimately ending the year lower after making all-time highs in October. These losses were partially offset by exposure to precious metal royalty companies, and to a lesser extent, power utilities and financial exchanges.
POSITIONING
The portfolio remains focused on high-quality, durable businesses with exposure to hard assets, which we believe are well-positioned to perform across various macroeconomic conditions, particularly in a sustained inflationary environment. Guided by our long-term value investment philosophy, the Fund may experience periods of outperformance or underperformance relative to the benchmark, but we believe the Fund is well-positioned to generate above-market returns over the long term.
PERFORMANCE
The Fund’s top contributor: Security selection within precious metal royalties, specifically Franco Nevada Corporation (Ticker: FNV).
The Fund’s top detractor: Security selection within the Energy Sector, specifically Texas Pacific Land Corporation (Ticker: TPL).
The Fund’s top detractor: Security selection within the Energy Sector, specifically Texas Pacific Land Corporation (Ticker: TPL).
ANNUAL AVERAGE TOTAL RETURN (%)
|
|
1 Year
|
5 Year
|
10 Year
|
|
Advisor Class A (without sales charge)
|
-14.80
|
18.72
|
16.45
|
|
Advisor Class A (with sales charge)
|
-19.70
|
17.32
|
15.76
|
|
S&P 500 TR
|
17.88
|
14.42
|
14.82
|
|
MSCI ACWI Net Total Return Index (USD)
|
22.34
|
11.19
|
11.72
|
Visit https://kineticsfunds.com/resources/ for more recent performance information.
KEY FUND STATISTICS (as of December 31, 2025)
|
Net Assets
|
$1,039,852,697
|
|
Number of Holdings
|
48
|
|
Net Advisory Fee
|
$16,999,547
|
|
Portfolio Turnover
|
3%
|
WHAT DID THE FUND INVEST IN? (as of December 31, 2025)
|
Top Sectors
|
(%)
|
|
Utilities
|
61.5%
|
|
Finance and Insurance
|
21.4%
|
|
Real Estate and Rental and Leasing
|
4.3%
|
|
Management of Companies and Enterprises
|
3.9%
|
|
Mining, Quarrying, and Oil and Gas Extraction
|
2.1%
|
|
Administrative and Support and Waste Management and Remediation Services
|
1.7%
|
|
Professional, Scientific, and Technical Services
|
1.4%
|
|
Construction
|
1.1%
|
|
Transportation and Warehousing
|
0.6%
|
|
Cash & Other
|
2.0%
|
|
Top 10 Issuers
|
(%)
|
|
Texas Pacific Land Corp.
|
61.5%
|
|
Grayscale Bitcoin Trust ETF
|
12.8%
|
|
Landbridge Co. LLC
|
4.3%
|
|
Brookfield Corp.
|
3.7%
|
|
Hawaiian Electric Industries, Inc.
|
3.4%
|
|
Franco-Nevada Corp.
|
2.0%
|
|
Cboe Global Markets, Inc.
|
1.4%
|
|
Grayscale Bitcoin Mini Trust ETF
|
1.4%
|
|
Live Nation Entertainment, Inc.
|
1.4%
|
|
CACI International, Inc.
|
1.3%
|
WHAT WERE THE FUND COSTS FOR THE PAST YEAR? (based on a hypothetical $10,000 investment)
|
Class Name
|
Costs of a $10,000 investment
|
Costs paid as a percentage of a $10,000 investment
|
|
Advisor Class C
|
$221
|
2.39%
|
HOW DID THE FUND PERFORM LAST YEAR AND WHAT AFFECTED ITS PERFORMANCE?
For the 12-month period ended December 31, 2025, the Fund’s Advisor Class C posted a loss of 15.22% trailing the S&P 500 Index and MSCI All Country World Index which rose 17.88% and 22.34%, respectively.
WHAT FACTORS INFLUENCED PERFORMANCE
The Fund’s performance was driven by negative returns in specific land companies, which we believe are well-positioned to benefit from infrastructure development related to energy, water and power transmission. However, these companies have legacy energy businesses, which were negatively impacted by materially lower oil prices. The energy exposure is limited to royalties and infrastructure but proved vulnerable to macroeconomic factors. Blockchain and cryptocurrency also detracted modestly from returns, with Bitcoin prices ultimately ending the year lower after making all-time highs in October. These losses were partially offset by exposure to precious metal royalty companies, and to a lesser extent, power utilities and financial exchanges.
POSITIONING
The portfolio remains focused on high-quality, durable businesses with exposure to hard assets, which we believe are well-positioned to perform across various macroeconomic conditions, particularly in a sustained inflationary environment. Guided by our long-term value investment philosophy, the Fund may experience periods of outperformance or underperformance relative to the benchmark, but we believe the Fund is well-positioned to generate above-market returns over the long term.
PERFORMANCE
The Fund’s top contributor: Security selection within precious metal royalties, specifically Franco Nevada Corporation (Ticker: FNV).
The Fund’s top detractor: Security selection within the Energy Sector, specifically Texas Pacific Land Corporation (Ticker: TPL).
The Fund’s top detractor: Security selection within the Energy Sector, specifically Texas Pacific Land Corporation (Ticker: TPL).
ANNUAL AVERAGE TOTAL RETURN (%)
|
|
1 Year
|
5 Year
|
10 Year
|
|
Advisor Class C (without sales charge)
|
-15.22
|
18.12
|
15.87
|
|
Advisor Class C (with sales charge)
|
-15.99
|
18.12
|
15.87
|
|
S&P 500 TR
|
17.88
|
14.42
|
14.82
|
|
MSCI ACWI Net Total Return Index (USD)
|
22.34
|
11.19
|
11.72
|
Visit https://kineticsfunds.com/resources/ for more recent performance information.
KEY FUND STATISTICS (as of December 31, 2025)
|
Net Assets
|
$1,039,852,697
|
|
Number of Holdings
|
48
|
|
Net Advisory Fee
|
$16,999,547
|
|
Portfolio Turnover
|
3%
|
WHAT DID THE FUND INVEST IN? (as of December 31, 2025)
|
Top Sectors
|
(%)
|
|
Utilities
|
61.5%
|
|
Finance and Insurance
|
21.4%
|
|
Real Estate and Rental and Leasing
|
4.3%
|
|
Management of Companies and Enterprises
|
3.9%
|
|
Mining, Quarrying, and Oil and Gas Extraction
|
2.1%
|
|
Administrative and Support and Waste Management and Remediation Services
|
1.7%
|
|
Professional, Scientific, and Technical Services
|
1.4%
|
|
Construction
|
1.1%
|
|
Transportation and Warehousing
|
0.6%
|
|
Cash & Other
|
2.0%
|
|
Top 10 Issuers
|
(%)
|
|
Texas Pacific Land Corp.
|
61.5%
|
|
Grayscale Bitcoin Trust ETF
|
12.8%
|
|
Landbridge Co. LLC
|
4.3%
|
|
Brookfield Corp.
|
3.7%
|
|
Hawaiian Electric Industries, Inc.
|
3.4%
|
|
Franco-Nevada Corp.
|
2.0%
|
|
Cboe Global Markets, Inc.
|
1.4%
|
|
Grayscale Bitcoin Mini Trust ETF
|
1.4%
|
|
Live Nation Entertainment, Inc.
|
1.4%
|
|
CACI International, Inc.
|
1.3%
|
WHAT WERE THE FUND COSTS FOR THE PAST YEAR? (based on a hypothetical $10,000 investment)
|
Class Name
|
Costs of a $10,000 investment
|
Costs paid as a percentage of a $10,000 investment
|
|
Institutional Class
|
$133
|
1.44%
|
HOW DID THE FUND PERFORM LAST YEAR AND WHAT AFFECTED ITS PERFORMANCE?
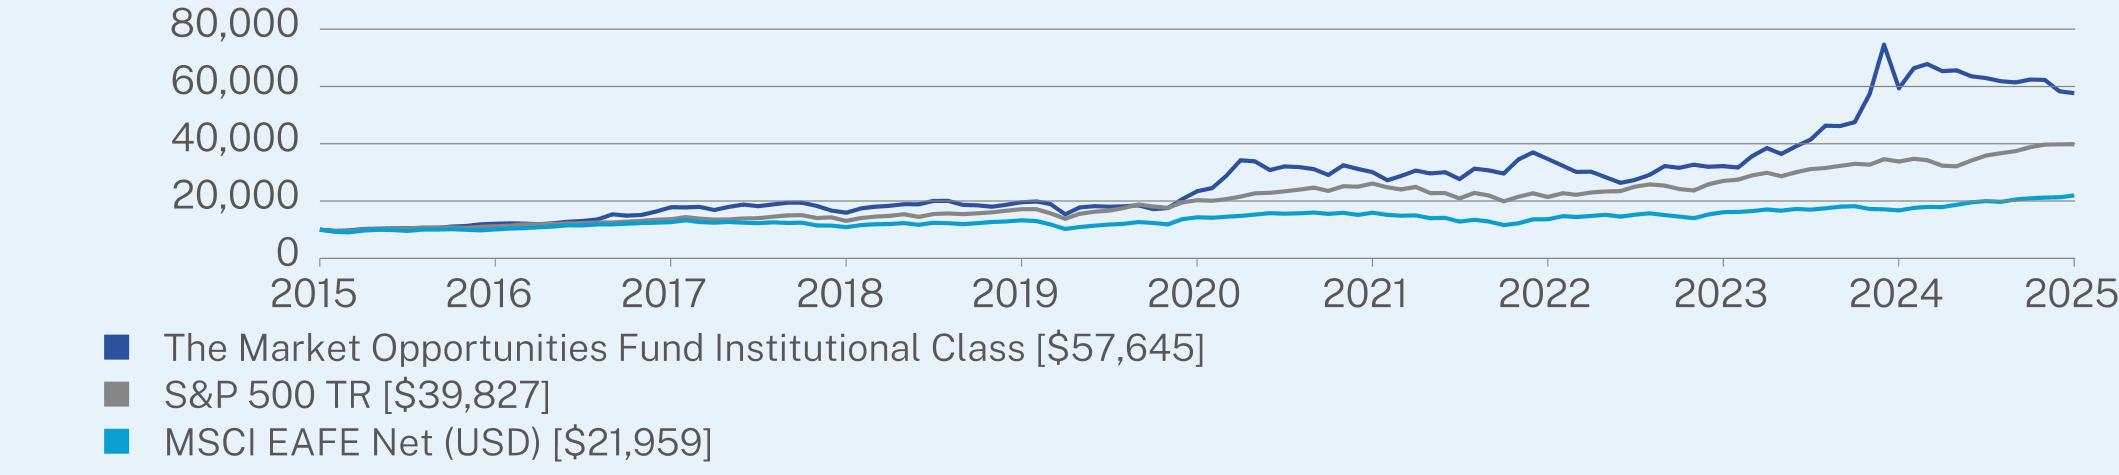
For the 12-month period ended December 31, 2025, the Fund’s Institutional share class posted a loss of 14.41% trailing the S&P 500 Index and MSCI All Country World Index which rose 17.88% and 22.34%, respectively.
WHAT FACTORS INFLUENCED PERFORMANCE
The Fund’s performance was driven by negative returns in specific land companies, which we believe are well-positioned to benefit from infrastructure development related to energy, water and power transmission. However, these companies have legacy energy businesses, which were negatively impacted by materially lower oil prices. The energy exposure is limited to royalties and infrastructure but proved vulnerable to macroeconomic factors. Blockchain and cryptocurrency also detracted modestly from returns, with Bitcoin prices ultimately ending the year lower after making all-time highs in October. These losses were partially offset by exposure to precious metal royalty companies, and to a lesser extent, power utilities and financial exchanges.
POSITIONING
The portfolio remains focused on high-quality, durable businesses with exposure to hard assets, which we believe are well-positioned to perform across various macroeconomic conditions, particularly in a sustained inflationary environment. Guided by our long-term value investment philosophy, the Fund may experience periods of outperformance or underperformance relative to the benchmark, but we believe the Fund is well-positioned to generate above-market returns over the long term.
PERFORMANCE
The Fund’s top contributor: Security selection within precious metal royalties, specifically Franco Nevada Corporation (Ticker: FNV).
The Fund’s top detractor: Security selection within the Energy Sector, specifically Texas Pacific Land Corporation (Ticker: TPL).
The Fund’s top detractor: Security selection within the Energy Sector, specifically Texas Pacific Land Corporation (Ticker: TPL).
ANNUAL AVERAGE TOTAL RETURN (%)
|
|
1 Year
|
5 Year
|
10 Year
|
|
Institutional Class (without sales charge)
|
-14.41
|
19.25
|
16.98
|
|
S&P 500 TR
|
17.88
|
14.42
|
14.82
|
|
MSCI ACWI Net Total Return Index (USD)
|
22.34
|
11.19
|
11.72
|
Visit https://kineticsfunds.com/resources/ for more recent performance information.
KEY FUND STATISTICS (as of December 31, 2025)
|
Net Assets
|
$1,039,852,697
|
|
Number of Holdings
|
48
|
|
Net Advisory Fee
|
$16,999,547
|
|
Portfolio Turnover
|
3%
|
WHAT DID THE FUND INVEST IN? (as of December 31, 2025)
|
Top Sectors
|
(%)
|
|
Utilities
|
61.5%
|
|
Finance and Insurance
|
21.4%
|
|
Real Estate and Rental and Leasing
|
4.3%
|
|
Management of Companies and Enterprises
|
3.9%
|
|
Mining, Quarrying, and Oil and Gas Extraction
|
2.1%
|
|
Administrative and Support and Waste Management and Remediation Services
|
1.7%
|
|
Professional, Scientific, and Technical Services
|
1.4%
|
|
Construction
|
1.1%
|
|
Transportation and Warehousing
|
0.6%
|
|
Cash & Other
|
2.0%
|
|
Top 10 Issuers
|
(%)
|
|
Texas Pacific Land Corp.
|
61.5%
|
|
Grayscale Bitcoin Trust ETF
|
12.8%
|
|
Landbridge Co. LLC
|
4.3%
|
|
Brookfield Corp.
|
3.7%
|
|
Hawaiian Electric Industries, Inc.
|
3.4%
|
|
Franco-Nevada Corp.
|
2.0%
|
|
Cboe Global Markets, Inc.
|
1.4%
|
|
Grayscale Bitcoin Mini Trust ETF
|
1.4%
|
|
Live Nation Entertainment, Inc.
|
1.4%
|
|
CACI International, Inc.
|
1.3%
|
WHAT WERE THE FUND COSTS FOR THE PAST YEAR? (based on a hypothetical $10,000 investment)
|
Class Name
|
Costs of a $10,000 investment
|
Costs paid as a percentage of a $10,000 investment
|
|
No Load Class
|
$152
|
1.64%
|
HOW DID THE FUND PERFORM LAST YEAR AND WHAT AFFECTED ITS PERFORMANCE?
For the 12-month period ended December 31, 2025, the Fund’s No-Load share class posted a loss of 14.59% trailing the S&P 500 Index and MSCI All Country World Index which rose 17.88% and 22.34%, respectively.
WHAT FACTORS INFLUENCED PERFORMANCE
The Fund’s performance was driven by negative returns in specific land companies, which we believe are well-positioned to benefit from infrastructure development related to energy, water and power transmission. However, these companies have legacy energy businesses, which were negatively impacted by materially lower oil prices. The energy exposure is limited to royalties and infrastructure but proved vulnerable to macroeconomic factors. Blockchain and cryptocurrency also detracted modestly from returns, with Bitcoin prices ultimately ending the year lower after making all-time highs in October. These losses were partially offset by exposure to precious metal royalty companies, and to a lesser extent, power utilities and financial exchanges.
POSITIONING
The portfolio remains focused on high-quality, durable businesses with exposure to hard assets, which we believe are well-positioned to perform across various macroeconomic conditions, particularly in a sustained inflationary environment. Guided by our long-term value investment philosophy, the Fund may experience periods of outperformance or underperformance relative to the benchmark, but we believe the Fund is well-positioned to generate above-market returns over the long term.
PERFORMANCE
The Fund’s top contributor: Security selection within precious metal royalties, specifically Franco Nevada Corporation (Ticker: FNV).
The Fund’s top detractor: Security selection within the Energy Sector, specifically Texas Pacific Land Corporation (Ticker: TPL).
The Fund’s top detractor: Security selection within the Energy Sector, specifically Texas Pacific Land Corporation (Ticker: TPL).
ANNUAL AVERAGE TOTAL RETURN (%)
|
|
1 Year
|
5 Year
|
10 Year
|
|
No Load Class (without sales charge)
|
-14.59
|
19.01
|
16.74
|
|
S&P 500 TR
|
17.88
|
14.42
|
14.82
|
|
MSCI ACWI Net Total Return Index (USD)
|
22.34
|
11.19
|
11.72
|
Visit https://kineticsfunds.com/resources/ for more recent performance information.
KEY FUND STATISTICS (as of December 31, 2025)
|
Net Assets
|
$1,039,852,697
|
|
Number of Holdings
|
48
|
|
Net Advisory Fee
|
$16,999,547
|
|
Portfolio Turnover
|
3%
|
WHAT DID THE FUND INVEST IN? (as of December 31, 2025)
|
Top Sectors
|
(%)
|
|
Utilities
|
61.5%
|
|
Finance and Insurance
|
21.4%
|
|
Real Estate and Rental and Leasing
|
4.3%
|
|
Management of Companies and Enterprises
|
3.9%
|
|
Mining, Quarrying, and Oil and Gas Extraction
|
2.1%
|
|
Administrative and Support and Waste Management and Remediation Services
|
1.7%
|
|
Professional, Scientific, and Technical Services
|
1.4%
|
|
Construction
|
1.1%
|
|
Transportation and Warehousing
|
0.6%
|
|
Cash & Other
|
2.0%
|
|
Top 10 Issuers
|
(%)
|
|
Texas Pacific Land Corp.
|
61.5%
|
|
Grayscale Bitcoin Trust ETF
|
12.8%
|
|
Landbridge Co. LLC
|
4.3%
|
|
Brookfield Corp.
|
3.7%
|
|
Hawaiian Electric Industries, Inc.
|
3.4%
|
|
Franco-Nevada Corp.
|
2.0%
|
|
Cboe Global Markets, Inc.
|
1.4%
|
|
Grayscale Bitcoin Mini Trust ETF
|
1.4%
|
|
Live Nation Entertainment, Inc.
|
1.4%
|
|
CACI International, Inc.
|
1.3%
|
WHAT WERE THE FUND COSTS FOR THE PAST YEAR? (based on a hypothetical $10,000 investment)
|
Class Name
|
Costs of a $10,000 investment
|
Costs paid as a percentage of a $10,000 investment
|
|
Advisor Class A
|
$181
|
1.89%
|
HOW DID THE FUND PERFORM LAST YEAR AND WHAT AFFECTED ITS PERFORMANCE?
For the 12-month period ended December 31, 2025, the Fund’s Advisor Class A posted a 8.89% loss trailing the S&P 600 Small Cap Index and S&P 500 Index which rose 6.02% and 17.88%, respectively.
WHAT FACTORS INFLUENCED PERFORMANCE
The Fund’s performance was driven by negative returns in specific land companies, which we believe are well-positioned to benefit from infrastructure development related to energy, water and power transmission. However, these companies have legacy energy businesses, which were negatively impacted by materially lower oil prices. The energy exposure is limited to royalties and infrastructure but proved vulnerable to macroeconomic factors. Blockchain and cryptocurrency also detracted modestly from returns, with Bitcoin prices ultimately ending the year lower after making all-time highs in October. These losses were partially offset by exposure to defense and electric utility businesses.
POSITIONING
The portfolio remains focused on companies within the broader universe of high quality, real asset companies within the small capitalization universe. These companies should be resilient to the myriad of potential macroeconomic factors that influence smaller companies. Guided by long-term our value investment philosophy, the Fund may experience periods of outperformance or underperformance relative to the benchmark, but we believe the Fund is well-positioned to generate above-market returns over the long term.
PERFORMANCE
The Fund’s top contributor: Security selection within defense, specifically CACI International (Ticker: CACI).
The Fund’s top detractor: Security selection within the Energy Sector, specifically Texas Pacific Land Corporation (Ticker: TPL).
The Fund’s top detractor: Security selection within the Energy Sector, specifically Texas Pacific Land Corporation (Ticker: TPL).

ANNUAL AVERAGE TOTAL RETURN (%)
|
|
1 Year
|
5 Year
|
10 Year
|
|
Advisor Class A (without sales charge)
|
-8.89
|
20.80
|
17.92
|
|
Advisor Class A (with sales charge)
|
-14.13
|
19.38
|
17.22
|
|
S&P 500 TR
|
17.88
|
14.42
|
14.82
|
|
S&P SmallCap 600 TR
|
6.02
|
7.31
|
9.81
|
Visit https://kineticsfunds.com/resources/ for more recent performance information.
KEY FUND STATISTICS (as of December 31, 2025)
|
Net Assets
|
$446,432,817
|
|
Number of Holdings
|
70
|
|
Net Advisory Fee
|
$6,421,711
|
|
Portfolio Turnover
|
0%
|
WHAT DID THE FUND INVEST IN? (as of December 31, 2025)
|
Top Sectors
|
(%)
|
|
Utilities
|
43.4%
|
|
Professional, Scientific, and Technical Services
|
7.4%
|
|
Finance and Insurance
|
7.2%
|
|
Management of Companies and Enterprises
|
7.2%
|
|
Real Estate and Rental and Leasing
|
4.7%
|
|
Mining, Quarrying, and Oil and Gas Extraction
|
3.8%
|
|
Accommodation and Food Services
|
3.2%
|
|
Financials
|
2.5%
|
|
Real Estate
|
2.1%
|
|
Cash & Other
|
18.5%
|
|
Top 10 Issuers
|
(%)
|
|
Texas Pacific Land Corp.
|
43.3%
|
|
CACI International, Inc.
|
6.0%
|
|
Hawaiian Electric Industries, Inc.
|
5.5%
|
|
Grayscale Bitcoin Trust ETF
|
4.6%
|
|
Landbridge Co. LLC
|
4.3%
|
|
WaterBridge Infrastructure LLC
|
3.3%
|
|
Civeo Corp.
|
2.9%
|
|
DREAM Unlimited Corp.
|
2.1%
|
|
Carnival Corp.
|
2.0%
|
|
Urbana Corp.
|
1.7%
|
WHAT WERE THE FUND COSTS FOR THE PAST YEAR? (based on a hypothetical $10,000 investment)
|
Class Name
|
Costs of a $10,000 investment
|
Costs paid as a percentage of a $10,000 investment
|
|
Advisor Class C
|
$228
|
2.39%
|
HOW DID THE FUND PERFORM LAST YEAR AND WHAT AFFECTED ITS PERFORMANCE?
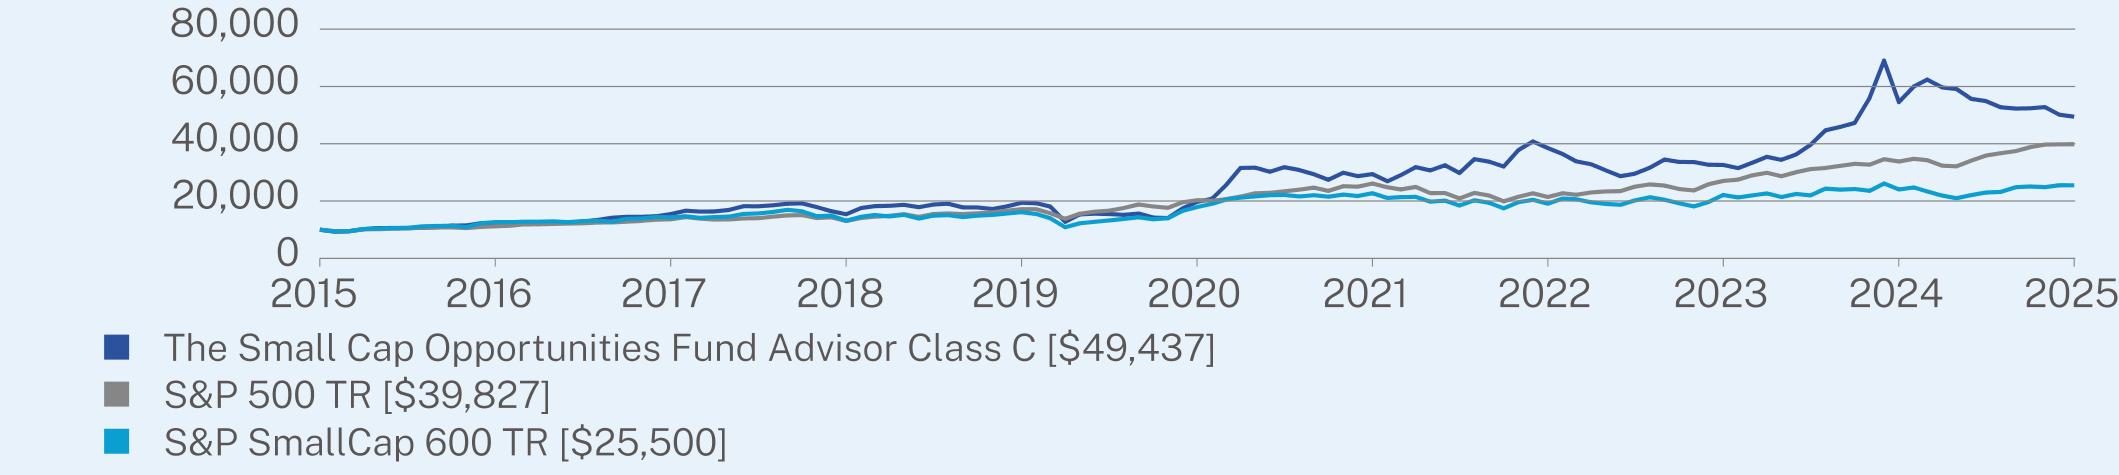
For the 12-month period ended December 31, 2025, the Fund’s Advisor Class C posted a 9.34% loss trailing the S&P 600 Small Cap Index and S&P 500 Index which rose 6.02% and 17.88%, respectively.
WHAT FACTORS INFLUENCED PERFORMANCE
The Fund’s performance was driven by negative returns in specific land companies, which we believe are well-positioned to benefit from infrastructure development related to energy, water and power transmission. However, these companies have legacy energy businesses, which were negatively impacted by materially lower oil prices. The energy exposure is limited to royalties and infrastructure but proved vulnerable to macroeconomic factors. Blockchain and cryptocurrency also detracted modestly from returns, with Bitcoin prices ultimately ending the year lower after making all-time highs in October. These losses were partially offset by exposure to defense and electric utility businesses.
POSITIONING
The portfolio remains focused on companies within the broader universe of high quality, real asset companies within the small capitalization universe. These companies should be resilient to the myriad of potential macroeconomic factors that influence smaller companies. Guided by long-term our value investment philosophy, the Fund may experience periods of outperformance or underperformance relative to the benchmark, but we believe the Fund is well-positioned to generate above-market returns over the long term.
PERFORMANCE
The Fund’s top contributor: Security selection within defense, specifically CACI International (Ticker: CACI).
The Fund’s top detractor: Security selection within the Energy Sector, specifically Texas Pacific Land Corporation (Ticker: TPL).
The Fund’s top detractor: Security selection within the Energy Sector, specifically Texas Pacific Land Corporation (Ticker: TPL).
ANNUAL AVERAGE TOTAL RETURN (%)
|
|
1 Year
|
5 Year
|
10 Year
|
|
Advisor Class C (without sales charge)
|
-9.34
|
20.20
|
17.33
|
|
Advisor Class C (with sales charge)
|
-10.25
|
20.20
|
17.33
|
|
S&P 500 TR
|
17.88
|
14.42
|
14.82
|
|
S&P SmallCap 600 TR
|
6.02
|
7.31
|
9.81
|
Visit https://kineticsfunds.com/resources/ for more recent performance information.
KEY FUND STATISTICS (as of December 31, 2025)
|
Net Assets
|
$446,432,817
|
|
Number of Holdings
|
70
|
|
Net Advisory Fee
|
$6,421,711
|
|
Portfolio Turnover
|
0%
|
WHAT DID THE FUND INVEST IN? (as of December 31, 2025)
|
Top Sectors
|
(%)
|
|
Utilities
|
43.4%
|
|
Professional, Scientific, and Technical Services
|
7.4%
|
|
Finance and Insurance
|
7.2%
|
|
Management of Companies and Enterprises
|
7.2%
|
|
Real Estate and Rental and Leasing
|
4.7%
|
|
Mining, Quarrying, and Oil and Gas Extraction
|
3.8%
|
|
Accommodation and Food Services
|
3.2%
|
|
Financials
|
2.5%
|
|
Real Estate
|
2.1%
|
|
Cash & Other
|
18.5%
|
|
Top 10 Issuers
|
(%)
|
|
Texas Pacific Land Corp.
|
43.3%
|
|
CACI International, Inc.
|
6.0%
|
|
Hawaiian Electric Industries, Inc.
|
5.5%
|
|
Grayscale Bitcoin Trust ETF
|
4.6%
|
|
Landbridge Co. LLC
|
4.3%
|
|
WaterBridge Infrastructure LLC
|
3.3%
|
|
Civeo Corp.
|
2.9%
|
|
DREAM Unlimited Corp.
|
2.1%
|
|
Carnival Corp.
|
2.0%
|
|
Urbana Corp.
|
1.7%
|
WHAT WERE THE FUND COSTS FOR THE PAST YEAR? (based on a hypothetical $10,000 investment)
|
Class Name
|
Costs of a $10,000 investment
|
Costs paid as a percentage of a $10,000 investment
|
|
Institutional Class
|
$138
|
1.44%
|
HOW DID THE FUND PERFORM LAST YEAR AND WHAT AFFECTED ITS PERFORMANCE?
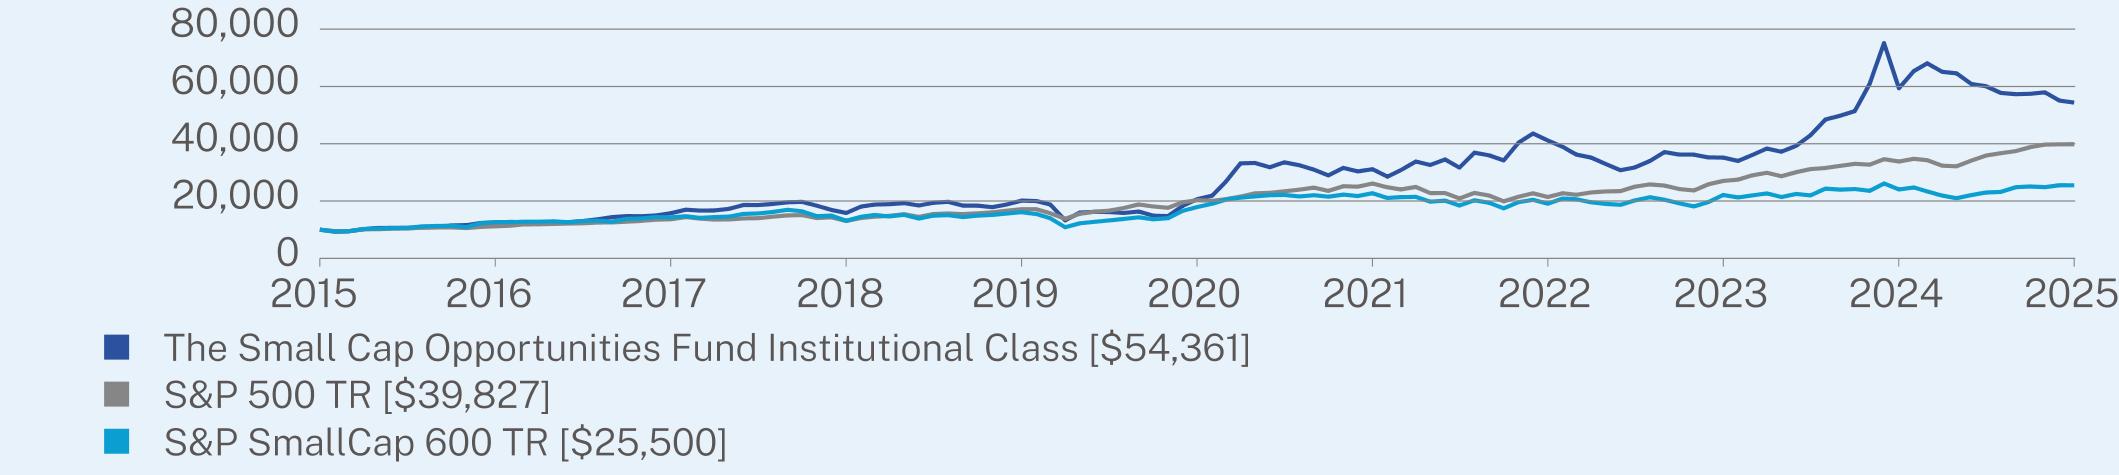
For the 12-month period ended December 31, 2025, the Fund’s Institutional class posted a 8.47% loss trailing the S&P 600 Small Cap Index and S&P 500 Index which rose 6.02% and 17.88%, respectively.
WHAT FACTORS INFLUENCED PERFORMANCE
The Fund’s performance was driven by negative returns in specific land companies, which we believe are well-positioned to benefit from infrastructure development related to energy, water and power transmission. However, these companies have legacy energy businesses, which were negatively impacted by materially lower oil prices. The energy exposure is limited to royalties and infrastructure but proved vulnerable to macroeconomic factors. Blockchain and cryptocurrency also detracted modestly from returns, with Bitcoin prices ultimately ending the year lower after making all-time highs in October. These losses were partially offset by exposure to defense and electric utility businesses.
POSITIONING
The portfolio remains focused on companies within the broader universe of high quality, real asset companies within the small capitalization universe. These companies should be resilient to the myriad of potential macroeconomic factors that influence smaller companies. Guided by long-term our value investment philosophy, the Fund may experience periods of outperformance or underperformance relative to the benchmark, but we believe the Fund is well-positioned to generate above-market returns over the long term.
PERFORMANCE
The Fund’s top contributor: Security selection within defense, specifically CACI International (Ticker: CACI).
The Fund’s top detractor: Security selection within the Energy Sector, specifically Texas Pacific Land Corporation (Ticker: TPL).
The Fund’s top detractor: Security selection within the Energy Sector, specifically Texas Pacific Land Corporation (Ticker: TPL).
ANNUAL AVERAGE TOTAL RETURN (%)
|
|
1 Year
|
5 Year
|
10 Year
|
|
Institutional Class (without sales charge)
|
-8.47
|
21.34
|
18.45
|
|
S&P 500 TR
|
17.88
|
14.42
|
14.82
|
|
S&P SmallCap 600 TR
|
6.02
|
7.31
|
9.81
|
Visit https://kineticsfunds.com/resources/ for more recent performance information.
KEY FUND STATISTICS (as of December 31, 2025)
|
Net Assets
|
$446,432,817
|
|
Number of Holdings
|
70
|
|
Net Advisory Fee
|
$6,421,711
|
|
Portfolio Turnover
|
0%
|
WHAT DID THE FUND INVEST IN? (as of December 31, 2025)
|
Top Sectors
|
(%)
|
|
Utilities
|
43.4%
|
|
Professional, Scientific, and Technical Services
|
7.4%
|
|
Finance and Insurance
|
7.2%
|
|
Management of Companies and Enterprises
|
7.2%
|
|
Real Estate and Rental and Leasing
|
4.7%
|
|
Mining, Quarrying, and Oil and Gas Extraction
|
3.8%
|
|
Accommodation and Food Services
|
3.2%
|
|
Financials
|
2.5%
|
|
Real Estate
|
2.1%
|
|
Cash & Other
|
18.5%
|
|
Top 10 Issuers
|
(%)
|
|
Texas Pacific Land Corp.
|
43.3%
|
|
CACI International, Inc.
|
6.0%
|
|
Hawaiian Electric Industries, Inc.
|
5.5%
|
|
Grayscale Bitcoin Trust ETF
|
4.6%
|
|
Landbridge Co. LLC
|
4.3%
|
|
WaterBridge Infrastructure LLC
|
3.3%
|
|
Civeo Corp.
|
2.9%
|
|
DREAM Unlimited Corp.
|
2.1%
|
|
Carnival Corp.
|
2.0%
|
|
Urbana Corp.
|
1.7%
|
WHAT WERE THE FUND COSTS FOR THE PAST YEAR? (based on a hypothetical $10,000 investment)
|
Class Name
|
Costs of a $10,000 investment
|
Costs paid as a percentage of a $10,000 investment
|
|
No Load Class
|
$157
|
1.64%
|
HOW DID THE FUND PERFORM LAST YEAR AND WHAT AFFECTED ITS PERFORMANCE?
For the 12-month period ended December 31, 2025, the Fund’s No-Load class posted a 8.66% loss trailing the S&P 600 Small Cap Index and S&P 500 Index which rose 6.02% and 17.88%, respectively.
WHAT FACTORS INFLUENCED PERFORMANCE
The Fund’s performance was driven by negative returns in specific land companies, which we believe are well-positioned to benefit from infrastructure development related to energy, water and power transmission. However, these companies have legacy energy businesses, which were negatively impacted by materially lower oil prices. The energy exposure is limited to royalties and infrastructure but proved vulnerable to macroeconomic factors. Blockchain and cryptocurrency also detracted modestly from returns, with Bitcoin prices ultimately ending the year lower after making all-time highs in October. These losses were partially offset by exposure to defense and electric utility businesses.
POSITIONING
The portfolio remains focused on companies within the broader universe of high quality, real asset companies within the small capitalization universe. These companies should be resilient to the myriad of potential macroeconomic factors that influence smaller companies. Guided by long-term our value investment philosophy, the Fund may experience periods of outperformance or underperformance relative to the benchmark, but we believe the Fund is well-positioned to generate above-market returns over the long term.
PERFORMANCE
The Fund’s top contributor: Security selection within defense, specifically CACI International (Ticker: CACI).
The Fund’s top detractor: Security selection within the Energy Sector, specifically Texas Pacific Land Corporation (Ticker: TPL).
The Fund’s top detractor: Security selection within the Energy Sector, specifically Texas Pacific Land Corporation (Ticker: TPL).

ANNUAL AVERAGE TOTAL RETURN (%)
|
|
1 Year
|
5 Year
|
10 Year
|
|
No Load Class (without sales charge)
|
-8.66
|
21.10
|
18.22
|
|
S&P 500 TR
|
17.88
|
14.42
|
14.82
|
|
S&P SmallCap 600 TR
|
6.02
|
7.31
|
9.81
|
Visit https://kineticsfunds.com/resources/ for more recent performance information.
KEY FUND STATISTICS (as of December 31, 2025)
|
Net Assets
|
$446,432,817
|
|
Number of Holdings
|
70
|
|
Net Advisory Fee
|
$6,421,711
|
|
Portfolio Turnover
|
0%
|
WHAT DID THE FUND INVEST IN? (as of December 31, 2025)
|
Top Sectors
|
(%)
|
|
Utilities
|
43.4%
|
|
Professional, Scientific, and Technical Services
|
7.4%
|
|
Finance and Insurance
|
7.2%
|
|
Management of Companies and Enterprises
|
7.2%
|
|
Real Estate and Rental and Leasing
|
4.7%
|
|
Mining, Quarrying, and Oil and Gas Extraction
|
3.8%
|
|
Accommodation and Food Services
|
3.2%
|
|
Financials
|
2.5%
|
|
Real Estate
|
2.1%
|
|
Cash & Other
|
18.5%
|
|
Top 10 Issuers
|
(%)
|
|
Texas Pacific Land Corp.
|
43.3%
|
|
CACI International, Inc.
|
6.0%
|
|
Hawaiian Electric Industries, Inc.
|
5.5%
|
|
Grayscale Bitcoin Trust ETF
|
4.6%
|
|
Landbridge Co. LLC
|
4.3%
|
|
WaterBridge Infrastructure LLC
|
3.3%
|
|
Civeo Corp.
|
2.9%
|
|
DREAM Unlimited Corp.
|
2.1%
|
|
Carnival Corp.
|
2.0%
|
|
Urbana Corp.
|
1.7%
|
WHAT WERE THE FUND COSTS FOR THE PAST YEAR? (based on a hypothetical $10,000 investment)
|
Class Name
|
Costs of a $10,000 investment
|
Costs paid as a percentage of a $10,000 investment
|
|
Advisor Class A
|
$162
|
1.65%
|
HOW DID THE FUND PERFORM LAST YEAR AND WHAT AFFECTED ITS PERFORMANCE?
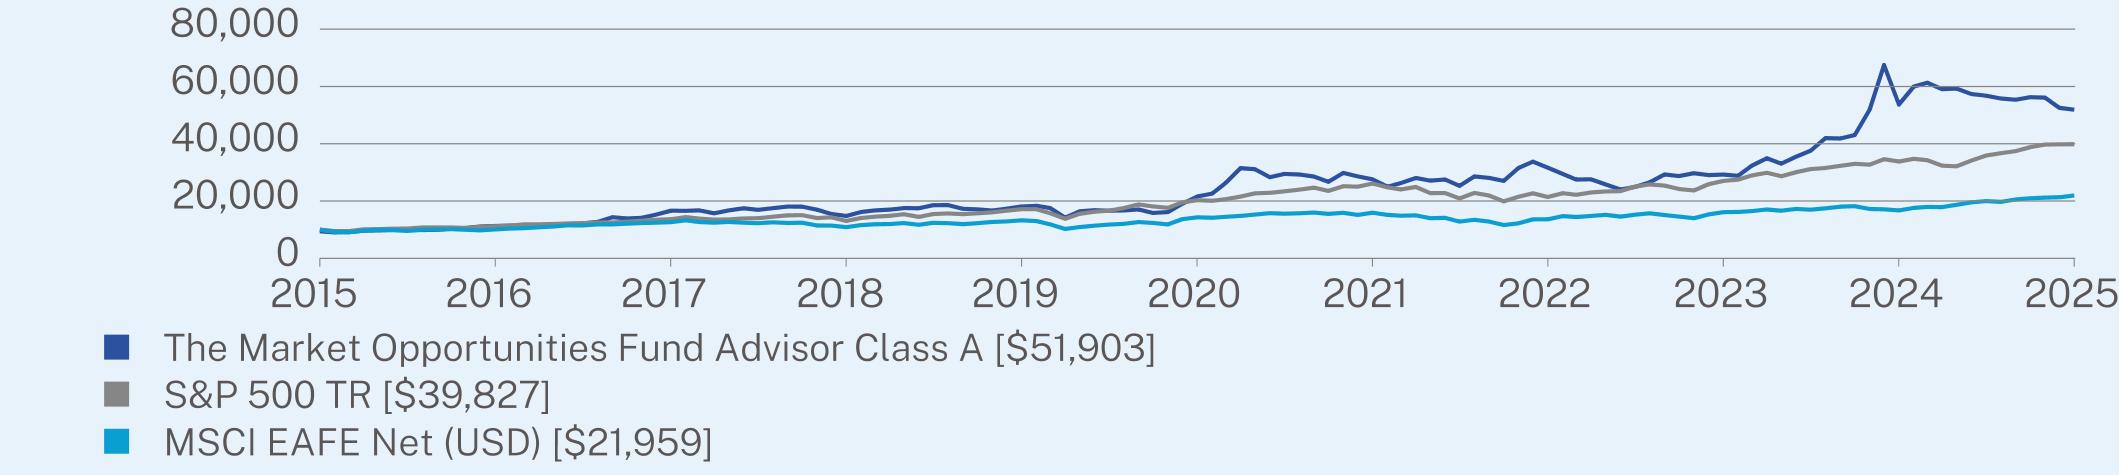
For the 12-month period ended December 31, 2025, the Fund’s Advisor Class A posted a loss of 3.31% trailing the S&P 500 Index and MSCI EAFE Index which posted gains of 17.88% and 31.22%, respectively.
WHAT FACTORS INFLUENCED PERFORMANCE
The Fund’s performance was driven by negative returns in specific land companies and blockchain/Bitcoin related investments. These investments remain strong long-term investments, despite having mixed performance this year. These losses were partially offset by gains in electric utility, precious metal royalty and asset management holding companies.
POSITIONING
The portfolio remains focused on high-quality, durable businesses with exposure to hard assets, which we believe are well-positioned to perform across various macroeconomic conditions. These businesses often have exposure to dynamic end markets in capital markets related industries that have unique growth potential. Guided by our long-term value investment philosophy, the Fund may experience periods of outperformance or underperformance relative to the benchmark, but we believe the Fund is well-positioned to generate above-market returns over the long term.
PERFORMANCE
The Fund’s top contributor: Security selection within precious metals, specifically Wheaton Precious Metals (Ticker: HEI).
The Fund’s top detractor: Security selection within the blockchain/crypto, specifically Grayscale Bitcoin Trust (Ticker: GBTC).
The Fund’s top detractor: Security selection within the blockchain/crypto, specifically Grayscale Bitcoin Trust (Ticker: GBTC).
ANNUAL AVERAGE TOTAL RETURN (%)
|
|
1 Year
|
5 Year
|
10 Year
|
|
Advisor Class A (without sales charge)
|
-3.31
|
19.17
|
18.60
|
|
Advisor Class A (with sales charge)
|
-8.88
|
17.77
|
17.90
|
|
S&P 500 TR
|
17.88
|
14.42
|
14.82
|
|
MSCI EAFE Net (USD)
|
31.22
|
8.92
|
8.18
|
Visit https://kineticsfunds.com/resources/ for more recent performance information.
KEY FUND STATISTICS (as of December 31, 2025)
|
Net Assets
|
$267,487,159
|
|
Number of Holdings
|
83
|
|
Net Advisory Fee
|
$3,861,598
|
|
Portfolio Turnover
|
4%
|
WHAT DID THE FUND INVEST IN? (as of December 31, 2025)
|
Top Sectors
|
(%)
|
|
Utilities
|
35.1%
|
|
Finance and Insurance
|
22.0%
|
|
Management of Companies and Enterprises
|
9.4%
|
|
Financials
|
5.1%
|
|
Mining, Quarrying, and Oil and Gas Extraction
|
4.9%
|
|
Real Estate and Rental and Leasing
|
3.8%
|
|
Professional, Scientific, and Technical Services
|
1.8%
|
|
Wholesale Trade
|
1.5%
|
|
Manufacturing
|
0.9%
|
|
Cash & Other
|
15.5%
|
|
Top 10 Issuers
|
(%)
|
|
Texas Pacific Land Corp.
|
35.1%
|
|
Grayscale Bitcoin Trust ETF
|
15.3%
|
|
Hawaiian Electric Industries, Inc.
|
7.4%
|
|
WaterBridge Infrastructure LLC
|
3.1%
|
|
Landbridge Co. LLC
|
3.0%
|
|
Partners Value Investments LP
|
2.5%
|
|
Miami International Holdings, Inc.
|
2.4%
|
|
Bolt Data & Energy Inc.
|
2.2%
|
|
Grayscale Bitcoin Mini Trust ETF
|
1.7%
|
|
White Mountains Insurance Group Ltd.
|
1.5%
|
WHAT WERE THE FUND COSTS FOR THE PAST YEAR? (based on a hypothetical $10,000 investment)
|
Class Name
|
Costs of a $10,000 investment
|
Costs paid as a percentage of a $10,000 investment
|
|
Advisor Class C
|
$211
|
2.15%
|
HOW DID THE FUND PERFORM LAST YEAR AND WHAT AFFECTED ITS PERFORMANCE?
For the 12-month period ended December 31, 2025, the Fund’s Advisor Class C posted a loss of 3.80% trailing the S&P 500 Index and MSCI EAFE Index which posted gains of 17.88% and 31.22%, respectively.
WHAT FACTORS INFLUENCED PERFORMANCE
The Fund’s performance was driven by negative returns in specific land companies and blockchain/Bitcoin related investments. These investments remain strong long-term investments, despite having mixed performance this year. These losses were partially offset by gains in electric utility, precious metal royalty and asset management holding companies.
POSITIONING
The portfolio remains focused on high-quality, durable businesses with exposure to hard assets, which we believe are well-positioned to perform across various macroeconomic conditions. These businesses often have exposure to dynamic end markets in capital markets related industries that have unique growth potential. Guided by our long-term value investment philosophy, the Fund may experience periods of outperformance or underperformance relative to the benchmark, but we believe the Fund is well-positioned to generate above-market returns over the long term.
PERFORMANCE
The Fund’s top contributor: Security selection within precious metals, specifically Wheaton Precious Metals (Ticker: HEI).
The Fund’s top detractor: Security selection within the blockchain/crypto, specifically Grayscale Bitcoin Trust (Ticker: GBTC).
The Fund’s top detractor: Security selection within the blockchain/crypto, specifically Grayscale Bitcoin Trust (Ticker: GBTC).
ANNUAL AVERAGE TOTAL RETURN (%)
|
|
1 Year
|
5 Year
|
10 Year
|
|
Advisor Class C (without sales charge)
|
-3.80
|
18.57
|
18.01
|
|
Advisor Class C (with sales charge)
|
-4.76
|
18.57
|
18.01
|
|
S&P 500 TR
|
17.88
|
14.42
|
14.82
|
|
MSCI EAFE Net (USD)
|
31.22
|
8.92
|
8.18
|
Visit https://kineticsfunds.com/resources/ for more recent performance information.
KEY FUND STATISTICS (as of December 31, 2025)
|
Net Assets
|
$267,487,159
|
|
Number of Holdings
|
83
|
|
Net Advisory Fee
|
$3,861,598
|
|
Portfolio Turnover
|
4%
|
WHAT DID THE FUND INVEST IN? (as of December 31, 2025)
|
Top Sectors
|
(%)
|
|
Utilities
|
35.1%
|
|
Finance and Insurance
|
22.0%
|
|
Management of Companies and Enterprises
|
9.4%
|
|
Financials
|
5.1%
|
|
Mining, Quarrying, and Oil and Gas Extraction
|
4.9%
|
|
Real Estate and Rental and Leasing
|
3.8%
|
|
Professional, Scientific, and Technical Services
|
1.8%
|
|
Wholesale Trade
|
1.5%
|
|
Manufacturing
|
0.9%
|
|
Cash & Other
|
15.5%
|
|
Top 10 Issuers
|
(%)
|
|
Texas Pacific Land Corp.
|
35.1%
|
|
Grayscale Bitcoin Trust ETF
|
15.3%
|
|
Hawaiian Electric Industries, Inc.
|
7.4%
|
|
WaterBridge Infrastructure LLC
|
3.1%
|
|
Landbridge Co. LLC
|
3.0%
|
|
Partners Value Investments LP
|
2.5%
|
|
Miami International Holdings, Inc.
|
2.4%
|
|
Bolt Data & Energy Inc.
|
2.2%
|
|
Grayscale Bitcoin Mini Trust ETF
|
1.7%
|
|
White Mountains Insurance Group Ltd.
|
1.5%
|
WHAT WERE THE FUND COSTS FOR THE PAST YEAR? (based on a hypothetical $10,000 investment)
|
Class Name
|
Costs of a $10,000 investment
|
Costs paid as a percentage of a $10,000 investment
|
|
Institutional Class
|
$118
|
1.20%
|
HOW DID THE FUND PERFORM LAST YEAR AND WHAT AFFECTED ITS PERFORMANCE?
For the 12-month period ended December 31, 2025, the Fund’s Institutional class posted a loss of 2.89% trailing the S&P 500 Index and MSCI EAFE Index which posted gains of 17.88% and 31.22%, respectively.
WHAT FACTORS INFLUENCED PERFORMANCE
The Fund’s performance was driven by negative returns in specific land companies and blockchain/Bitcoin related investments. These investments remain strong long-term investments, despite having mixed performance this year. These losses were partially offset by gains in electric utility, precious metal royalty and asset management holding companies.
POSITIONING
The portfolio remains focused on high-quality, durable businesses with exposure to hard assets, which we believe are well-positioned to perform across various macroeconomic conditions. These businesses often have exposure to dynamic end markets in capital markets related industries that have unique growth potential. Guided by our long-term value investment philosophy, the Fund may experience periods of outperformance or underperformance relative to the benchmark, but we believe the Fund is well-positioned to generate above-market returns over the long term.
PERFORMANCE
The Fund’s top contributor: Security selection within precious metals, specifically Wheaton Precious Metals (Ticker: HEI).
The Fund’s top detractor: Security selection within the blockchain/crypto, specifically Grayscale Bitcoin Trust (Ticker: GBTC).
The Fund’s top detractor: Security selection within the blockchain/crypto, specifically Grayscale Bitcoin Trust (Ticker: GBTC).
ANNUAL AVERAGE TOTAL RETURN (%)
|
|
1 Year
|
5 Year
|
10 Year
|
|
Institutional Class (without sales charge)
|
-2.89
|
19.71
|
19.15
|
|
S&P 500 TR
|
17.88
|
14.42
|
14.82
|
|
MSCI EAFE Net (USD)
|
31.22
|
8.92
|
8.18
|
Visit https://kineticsfunds.com/resources/ for more recent performance information.
KEY FUND STATISTICS (as of December 31, 2025)
|
Net Assets
|
$267,487,159
|
|
Number of Holdings
|
83
|
|
Net Advisory Fee
|
$3,861,598
|
|
Portfolio Turnover
|
4%
|
WHAT DID THE FUND INVEST IN? (as of December 31, 2025)
|
Top Sectors
|
(%)
|
|
Utilities
|
35.1%
|
|
Finance and Insurance
|
22.0%
|
|
Management of Companies and Enterprises
|
9.4%
|
|
Financials
|
5.1%
|
|
Mining, Quarrying, and Oil and Gas Extraction
|
4.9%
|
|
Real Estate and Rental and Leasing
|
3.8%
|
|
Professional, Scientific, and Technical Services
|
1.8%
|
|
Wholesale Trade
|
1.5%
|
|
Manufacturing
|
0.9%
|
|
Cash & Other
|
15.5%
|
|
Top 10 Issuers
|
(%)
|
|
Texas Pacific Land Corp.
|
35.1%
|
|
Grayscale Bitcoin Trust ETF
|
15.3%
|
|
Hawaiian Electric Industries, Inc.
|
7.4%
|
|
WaterBridge Infrastructure LLC
|
3.1%
|
|
Landbridge Co. LLC
|
3.0%
|
|
Partners Value Investments LP
|
2.5%
|
|
Miami International Holdings, Inc.
|
2.4%
|
|
Bolt Data & Energy Inc.
|
2.2%
|
|
Grayscale Bitcoin Mini Trust ETF
|
1.7%
|
|
White Mountains Insurance Group Ltd.
|
1.5%
|
WHAT WERE THE FUND COSTS FOR THE PAST YEAR? (based on a hypothetical $10,000 investment)
|
Class Name
|
Costs of a $10,000 investment
|
Costs paid as a percentage of a $10,000 investment
|
|
No Load Class
|
$138
|
1.40%
|
HOW DID THE FUND PERFORM LAST YEAR AND WHAT AFFECTED ITS PERFORMANCE?
For the 12-month period ended December 31, 2025, the Fund’s No-Load class posted a loss of 3.09% trailing the S&P 500 Index and MSCI EAFE Index which posted gains of 17.88% and 31.22%, respectively.
WHAT FACTORS INFLUENCED PERFORMANCE
The Fund’s performance was driven by negative returns in specific land companies and blockchain/Bitcoin related investments. These investments remain strong long-term investments, despite having mixed performance this year. These losses were partially offset by gains in electric utility, precious metal royalty and asset management holding companies.
POSITIONING
The portfolio remains focused on high-quality, durable businesses with exposure to hard assets, which we believe are well-positioned to perform across various macroeconomic conditions. These businesses often have exposure to dynamic end markets in capital markets related industries that have unique growth potential. Guided by our long-term value investment philosophy, the Fund may experience periods of outperformance or underperformance relative to the benchmark, but we believe the Fund is well-positioned to generate above-market returns over the long term.
PERFORMANCE
The Fund’s top contributor: Security selection within precious metals, specifically Wheaton Precious Metals (Ticker: HEI).
The Fund’s top detractor: Security selection within the blockchain/crypto, specifically Grayscale Bitcoin Trust (Ticker: GBTC).
The Fund’s top detractor: Security selection within the blockchain/crypto, specifically Grayscale Bitcoin Trust (Ticker: GBTC).
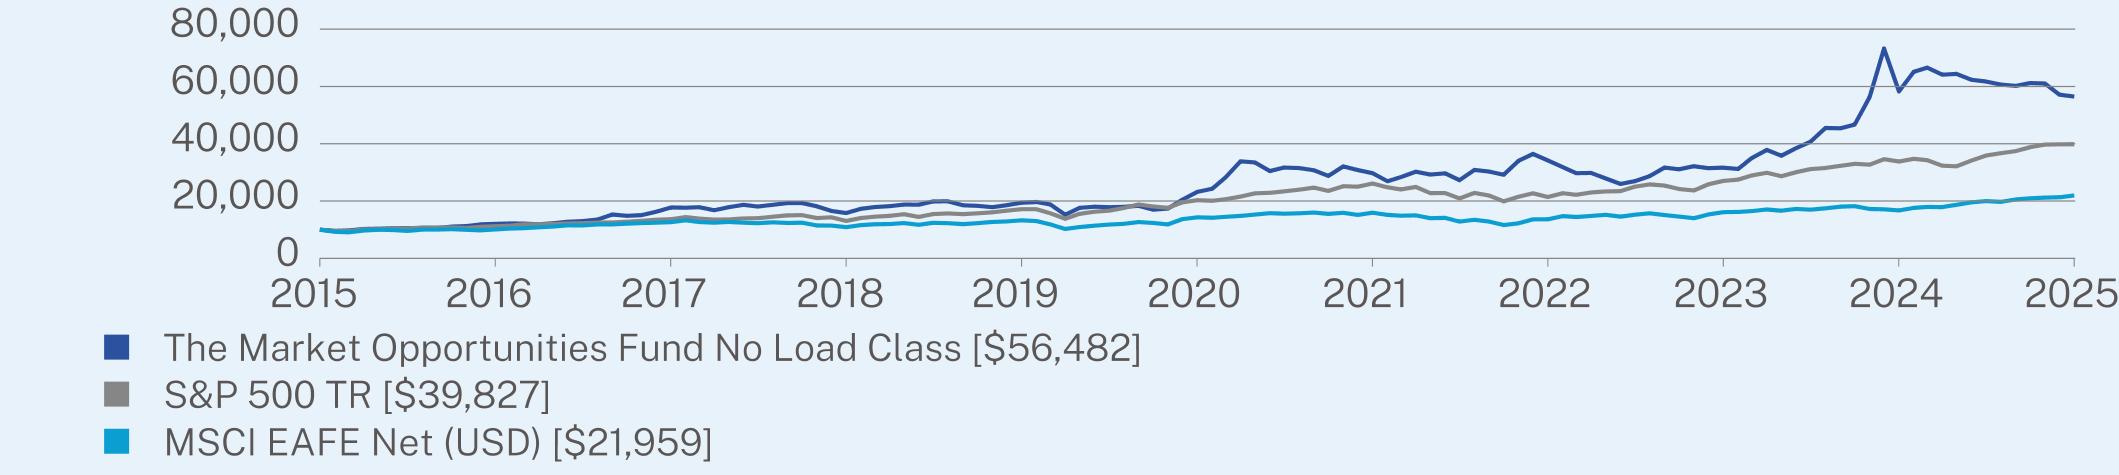
ANNUAL AVERAGE TOTAL RETURN (%)
|
|
1 Year
|
5 Year
|
10 Year
|
|
No Load Class (without sales charge)
|
-3.09
|
19.47
|
18.90
|
|
S&P 500 TR
|
17.88
|
14.42
|
14.82
|
|
MSCI EAFE Net (USD)
|
31.22
|
8.92
|
8.18
|
Visit https://kineticsfunds.com/resources/ for more recent performance information.
KEY FUND STATISTICS (as of December 31, 2025)
|
Net Assets
|
$267,487,159
|
|
Number of Holdings
|
83
|
|
Net Advisory Fee
|
$3,861,598
|
|
Portfolio Turnover
|
4%
|
WHAT DID THE FUND INVEST IN? (as of December 31, 2025)
|
Top Sectors
|
(%)
|
|
Utilities
|
35.1%
|
|
Finance and Insurance
|
22.0%
|
|
Management of Companies and Enterprises
|
9.4%
|
|
Financials
|
5.1%
|
|
Mining, Quarrying, and Oil and Gas Extraction
|
4.9%
|
|
Real Estate and Rental and Leasing
|
3.8%
|
|
Professional, Scientific, and Technical Services
|
1.8%
|
|
Wholesale Trade
|
1.5%
|
|
Manufacturing
|
0.9%
|
|
Cash & Other
|
15.5%
|
|
Top 10 Issuers
|
(%)
|
|
Texas Pacific Land Corp.
|
35.1%
|
|
Grayscale Bitcoin Trust ETF
|
15.3%
|
|
Hawaiian Electric Industries, Inc.
|
7.4%
|
|
WaterBridge Infrastructure LLC
|
3.1%
|
|
Landbridge Co. LLC
|
3.0%
|
|
Partners Value Investments LP
|
2.5%
|
|
Miami International Holdings, Inc.
|
2.4%
|
|
Bolt Data & Energy Inc.
|
2.2%
|
|
Grayscale Bitcoin Mini Trust ETF
|
1.7%
|
|
White Mountains Insurance Group Ltd.
|
1.5%
|
WHAT WERE THE FUND COSTS FOR THE PAST YEAR? (based on a hypothetical $10,000 investment)
|
Class Name
|
Costs of a $10,000 investment
|
Costs paid as a percentage of a $10,000 investment
|
|
No Load Class
|
$76
|
0.74%
|
HOW DID THE FUND PERFORM LAST YEAR AND WHAT AFFECTED ITS PERFORMANCE?
For the 12-month period ended December 31, 2025, the Fund’s No-Load class posted a return of 5.13% (net of expenses), driven by its re-positioning of its portfolio investment mix (during 2023) to include only high-quality collateralized loan obligation (“CLO”) debt tranche investments.
WHAT FACTORS INFLUENCED PERFORMANCE
The CLO debt tranches held by the Fund generated current cash income and avoided significant interest rate risks inherent in more traditional fixed income investment strategies. The Fund also benefited from fewer than anticipated interest rate cuts by the Federal Reserve in 2025.
POSITIONING
The Fund’s investments include only AAA and AA rated CLO debt tranches. During 2025, the Fund increased its portfolio weighing of AA rated CLO debt given the higher yields and the minimal incremental credit risk relative to AAA rated CLO debt.
PERFORMANCE
The Fund’s top contributor: Security selection collectively contributed positively to performance, specifically due to the increase in the Funds weighing of AA debt investments during 2025 and the overall credit performance of the Fund’s investments.
The Fund’s top detractor: The Fund suffered no impairment related losses in any investment during the year due to any credit event.
The Fund’s top detractor: The Fund suffered no impairment related losses in any investment during the year due to any credit event.
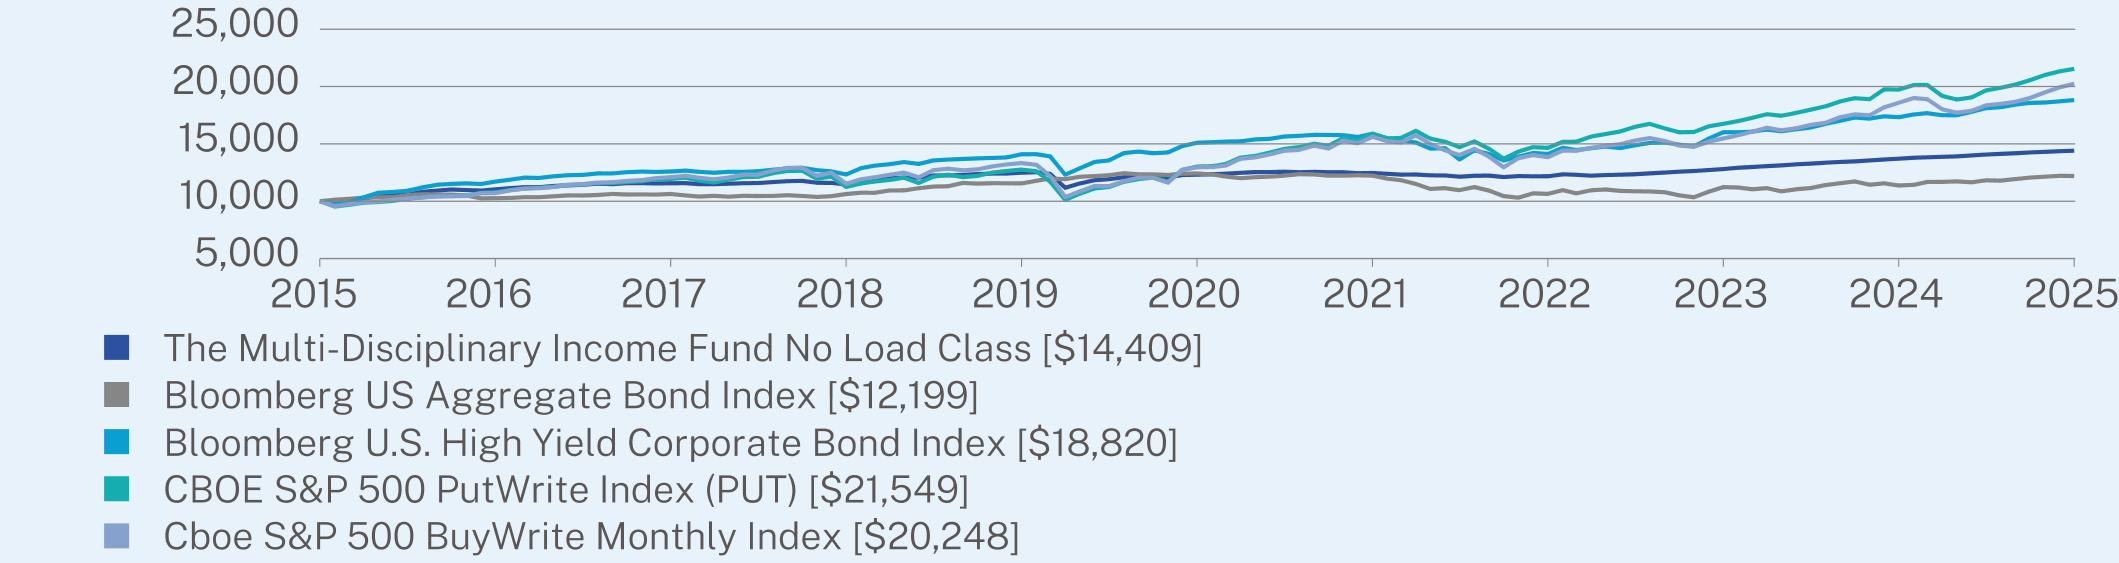
ANNUAL AVERAGE TOTAL RETURN (%)
|
|
1 Year
|
5 Year
|
10 Year
|
|
No Load Class (without sales charge)
|
5.23
|
3.19
|
3.72
|
|
Bloomberg US Aggregate Bond Index
|
7.30
|
-0.36
|
2.01
|
|
Bloomberg U.S. High Yield Corporate Bond Index
|
8.62
|
4.51
|
6.53
|
|
CBOE S&P 500 PutWrite Index (PUT)
|
9.19
|
10.59
|
7.98
|
|
Cboe S&P 500 BuyWrite Monthly Index
|
8.91
|
9.33
|
7.31
|
Visit https://kineticsfunds.com/resources/ for more recent performance information.
KEY FUND STATISTICS (as of December 31, 2025)
|
Net Assets
|
$17,431,820
|
|
Number of Holdings
|
28
|
|
Net Advisory Fee
|
$39,162
|
|
Portfolio Turnover
|
74%
|
|
Average Credit Quality
|
AAA
|
|
Effective Duration
|
2 Yrs
|
|
30-Day SEC Yield
|
4.92%
|
|
30-Day SEC Yield Unsubsidized
|
4.74%
|
WHAT DID THE FUND INVEST IN? (as of December 31, 2025)
|
Top Sectors
|
(%)
|
|
Asset Backed Securities
|
90.4%
|
|
Cash & Other
|
9.6%
|
|
Top 10 Issuers
|
(%)
|
|
Brant Point Clo 2024-6 Ltd.
|
12.1%
|
|
Sound Point CLO XXXIII Ltd.
|
8.9%
|
|
BlueMountain CLO XXXV Ltd.
|
7.2%
|
|
Post CLO 2023-1 Ltd.
|
6.7%
|
|
Apex Credit Clo 2021 Ltd.
|
4.6%
|
|
Eaton Vance CLO 2013-1 Ltd.
|
4.3%
|
|
Elevation CLO 2013-1 Ltd.
|
4.3%
|
|
Atlantic Avenue 2023-1 Ltd.
|
4.3%
|
|
Abry Liquid Credit CLO 2025-1 Ltd.
|
3.0%
|
|
Battery Park CLO II Ltd.
|
2.9%
|
WHAT WERE THE FUND COSTS FOR THE PAST YEAR? (based on a hypothetical $10,000 investment)
|
Class Name
|
Costs of a $10,000 investment
|
Costs paid as a percentage of a $10,000 investment
|
|
Advisor Class A
|
$139
|
1.54%
|
HOW DID THE FUND PERFORM LAST YEAR AND WHAT AFFECTED ITS PERFORMANCE?
For the 12-month period ended December 31, 2025, the Fund’s Advisor Class A posted a loss of 19.50%, trailing the S&P 500 Index, which posted a gain of 17.88% for the same period.
WHAT FACTORS INFLUENCED PERFORMANCE
The Fund’s performance was driven by negative returns in specific land companies, which we believe are well-positioned to benefit from infrastructure development related to energy, water and power transmission. However, these companies have legacy energy businesses, which were negatively impacted by materially lower oil prices. The energy exposure is limited to royalties and infrastructure but proved vulnerable to macroeconomic factors. Blockchain and cryptocurrency also detracted modestly from returns, with Bitcoin prices ultimately ending the year lower after making all-time highs in October. These losses were partially offset by exposure to power utilities.
POSITIONING
The portfolio remains focused on companies that are actively seeking to maximize shareholder value through spin-offs and subject to restructuring activity. These types of activities have been limited by volatile interest rates and economic policies, which should both prove to be temporary. Guided by our long-term value investment philosophy, the Fund may experience periods of outperformance or underperformance relative to the benchmark, but we believe the Fund is well-positioned to generate above-market returns over the long term.
PERFORMANCE
The Fund’s top contributor: Security selection within financial services, specifically Associated Capital Group (Ticker: ACGP).
The Fund’s top detractor: Security selection within the Energy Sector, specifically Texas Pacific Land Corporation (Ticker: TPL).
The Fund’s top detractor: Security selection within the Energy Sector, specifically Texas Pacific Land Corporation (Ticker: TPL).
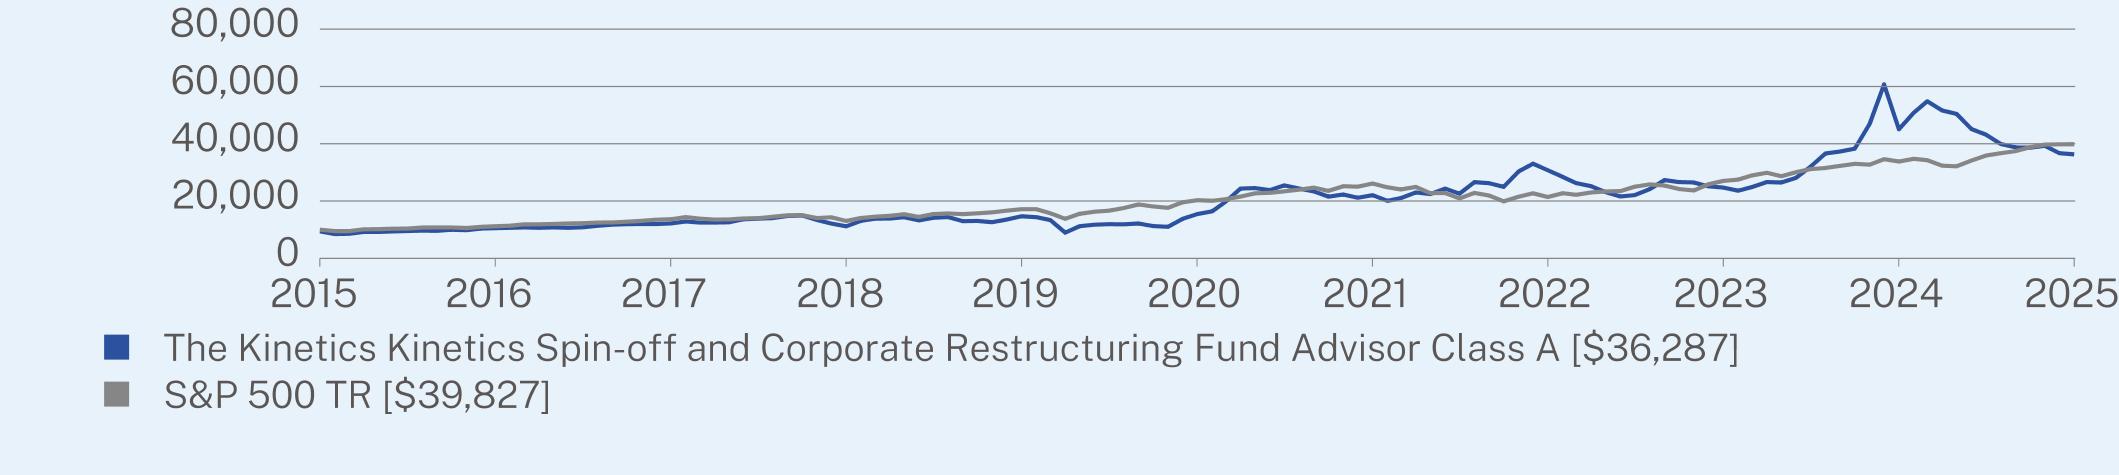
ANNUAL AVERAGE TOTAL RETURN (%)
|
|
1 Year
|
5 Year
|
10 Year
|
|
Advisor Class A (without sales charge)
|
-19.50
|
18.62
|
14.43
|
|
Advisor Class A (with sales charge)
|
-24.13
|
17.23
|
13.76
|
|
S&P 500 TR
|
17.88
|
14.42
|
14.82
|
Visit https://kineticsfunds.com/resources/ for more recent performance information.
KEY FUND STATISTICS (as of December 31, 2025)
|
Net Assets
|
$26,148,867
|
|
Number of Holdings
|
35
|
|
Net Advisory Fee
|
$348,840
|
|
Portfolio Turnover
|
4%
|
WHAT DID THE FUND INVEST IN? (as of December 31, 2025)
|
Top Sectors
|
(%)
|
|
Utilities
|
76.3%
|
|
Finance and Insurance
|
7.6%
|
|
Real Estate and Rental and Leasing
|
5.4%
|
|
Management of Companies and Enterprises
|
4.3%
|
|
Mining, Quarrying, and Oil and Gas Extraction
|
1.2%
|
|
Energy
|
0.9%
|
|
Accommodation and Food Services
|
0.8%
|
|
Manufacturing
|
0.7%
|
|
Professional, Scientific, and Technical Services
|
0.4%
|
|
Cash & Other
|
2.4%
|
|
Top 10 Issuers
|
(%)
|
|
Texas Pacific Land Corp.
|
76.2%
|
|
Landbridge Co. LLC
|
5.4%
|
|
Associated Capital Group, Inc.
|
5.0%
|
|
Hawaiian Electric Industries, Inc.
|
3.3%
|
|
GAMCO Investors, Inc.
|
1.8%
|
|
WaterBridge Infrastructure LLC
|
1.1%
|
|
PrairieSky Royalty Ltd.
|
0.9%
|
|
Civeo Corp.
|
0.8%
|
|
Grayscale Bitcoin Mini Trust ETF
|
0.7%
|
|
White Mountains Insurance Group Ltd.
|
0.5%
|
WHAT WERE THE FUND COSTS FOR THE PAST YEAR? (based on a hypothetical $10,000 investment)
|
Class Name
|
Costs of a $10,000 investment
|
Costs paid as a percentage of a $10,000 investment
|
|
Advisor Class C
|
$203
|
2.25%
|
HOW DID THE FUND PERFORM LAST YEAR AND WHAT AFFECTED ITS PERFORMANCE?
For the 12-month period ended December 31, 2025, the Fund’s Advisor Class C posted a loss of 20.09%, trailing the S&P 500 Index, which posted a gain of 17.88% for the same period.
WHAT FACTORS INFLUENCED PERFORMANCE
The Fund’s performance was driven by negative returns in specific land companies, which we believe are well-positioned to benefit from infrastructure development related to energy, water and power transmission. However, these companies have legacy energy businesses, which were negatively impacted by materially lower oil prices. The energy exposure is limited to royalties and infrastructure but proved vulnerable to macroeconomic factors. Blockchain and cryptocurrency also detracted modestly from returns, with Bitcoin prices ultimately ending the year lower after making all-time highs in October. These losses were partially offset by exposure to power utilities.
POSITIONING
The portfolio remains focused on companies that are actively seeking to maximize shareholder value through spin-offs and subject to restructuring activity. These types of activities have been limited by volatile interest rates and economic policies, which should both prove to be temporary. Guided by our long-term value investment philosophy, the Fund may experience periods of outperformance or underperformance relative to the benchmark, but we believe the Fund is well-positioned to generate above-market returns over the long term.
PERFORMANCE
The Fund’s top contributor: Security selection within financial services, specifically Associated Capital Group (Ticker: ACGP).
The Fund’s top detractor: Security selection within the Energy Sector, specifically Texas Pacific Land Corporation (Ticker: TPL).
The Fund’s top detractor: Security selection within the Energy Sector, specifically Texas Pacific Land Corporation (Ticker: TPL).
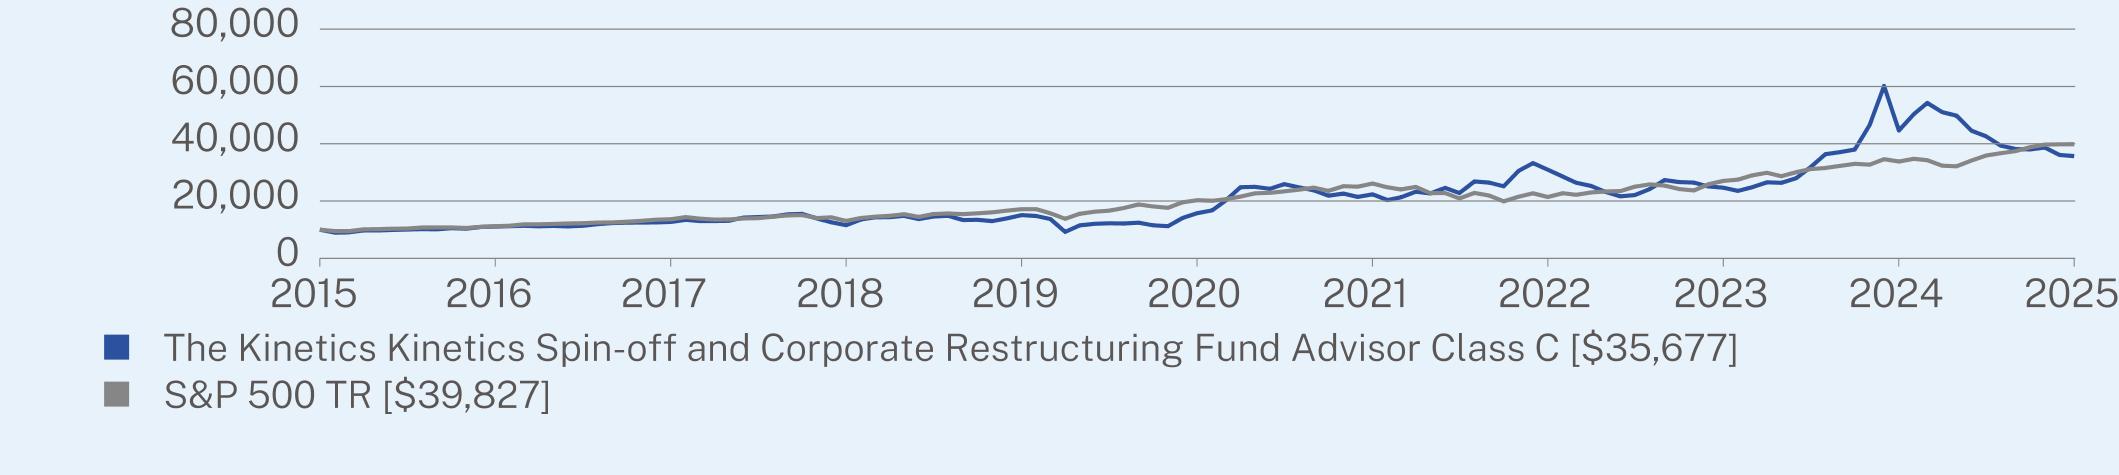
ANNUAL AVERAGE TOTAL RETURN (%)
|
|
1 Year
|
5 Year
|
10 Year
|
|
Advisor Class C (without sales charge)
|
-20.12
|
17.74
|
13.56
|
|
Advisor Class C (with sales charge)
|
-20.79
|
17.74
|
13.56
|
|
S&P 500 TR
|
17.88
|
14.42
|
14.82
|
Visit https://kineticsfunds.com/resources/ for more recent performance information.
KEY FUND STATISTICS (as of December 31, 2025)
|
Net Assets
|
$26,148,867
|
|
Number of Holdings
|
35
|
|
Net Advisory Fee
|
$348,840
|
|
Portfolio Turnover
|
4%
|
WHAT DID THE FUND INVEST IN? (as of December 31, 2025)
|
Top Sectors
|
(%)
|
|
Utilities
|
76.3%
|
|
Finance and Insurance
|
7.6%
|
|
Real Estate and Rental and Leasing
|
5.4%
|
|
Management of Companies and Enterprises
|
4.3%
|
|
Mining, Quarrying, and Oil and Gas Extraction
|
1.2%
|
|
Energy
|
0.9%
|
|
Accommodation and Food Services
|
0.8%
|
|
Manufacturing
|
0.7%
|
|
Professional, Scientific, and Technical Services
|
0.4%
|
|
Cash & Other
|
2.4%
|
|
Top 10 Issuers
|
(%)
|
|
Texas Pacific Land Corp.
|
76.2%
|
|
Landbridge Co. LLC
|
5.4%
|
|
Associated Capital Group, Inc.
|
5.0%
|
|
Hawaiian Electric Industries, Inc.
|
3.3%
|
|
GAMCO Investors, Inc.
|
1.8%
|
|
WaterBridge Infrastructure LLC
|
1.1%
|
|
PrairieSky Royalty Ltd.
|
0.9%
|
|
Civeo Corp.
|
0.8%
|
|
Grayscale Bitcoin Mini Trust ETF
|
0.7%
|
|
White Mountains Insurance Group Ltd.
|
0.5%
|
WHAT WERE THE FUND COSTS FOR THE PAST YEAR? (based on a hypothetical $10,000 investment)
|
Class Name
|
Costs of a $10,000 investment
|
Costs paid as a percentage of a $10,000 investment
|
|
Institutional Class
|
$111
|
1.23%
|
HOW DID THE FUND PERFORM LAST YEAR AND WHAT AFFECTED ITS PERFORMANCE?
For the 12-month period ended December 31, 2025, the Fund’s Institutional class posted a loss of 19.28%, trailing the S&P 500 Index, which posted a gain of 17.88% for the same period.
WHAT FACTORS INFLUENCED PERFORMANCE
The Fund’s performance was driven by negative returns in specific land companies, which we believe are well-positioned to benefit from infrastructure development related to energy, water and power transmission. However, these companies have legacy energy businesses, which were negatively impacted by materially lower oil prices. The energy exposure is limited to royalties and infrastructure but proved vulnerable to macroeconomic factors. Blockchain and cryptocurrency also detracted modestly from returns, with Bitcoin prices ultimately ending the year lower after making all-time highs in October. These losses were partially offset by exposure to power utilities.
POSITIONING
The portfolio remains focused on companies that are actively seeking to maximize shareholder value through spin-offs and subject to restructuring activity. These types of activities have been limited by volatile interest rates and economic policies, which should both prove to be temporary. Guided by our long-term value investment philosophy, the Fund may experience periods of outperformance or underperformance relative to the benchmark, but we believe the Fund is well-positioned to generate above-market returns over the long term.
PERFORMANCE
The Fund’s top contributor: Security selection within financial services, specifically Associated Capital Group (Ticker: ACGP).
The Fund’s top detractor: Security selection within the Energy Sector, specifically Texas Pacific Land Corporation (Ticker: TPL).
The Fund’s top detractor: Security selection within the Energy Sector, specifically Texas Pacific Land Corporation (Ticker: TPL).
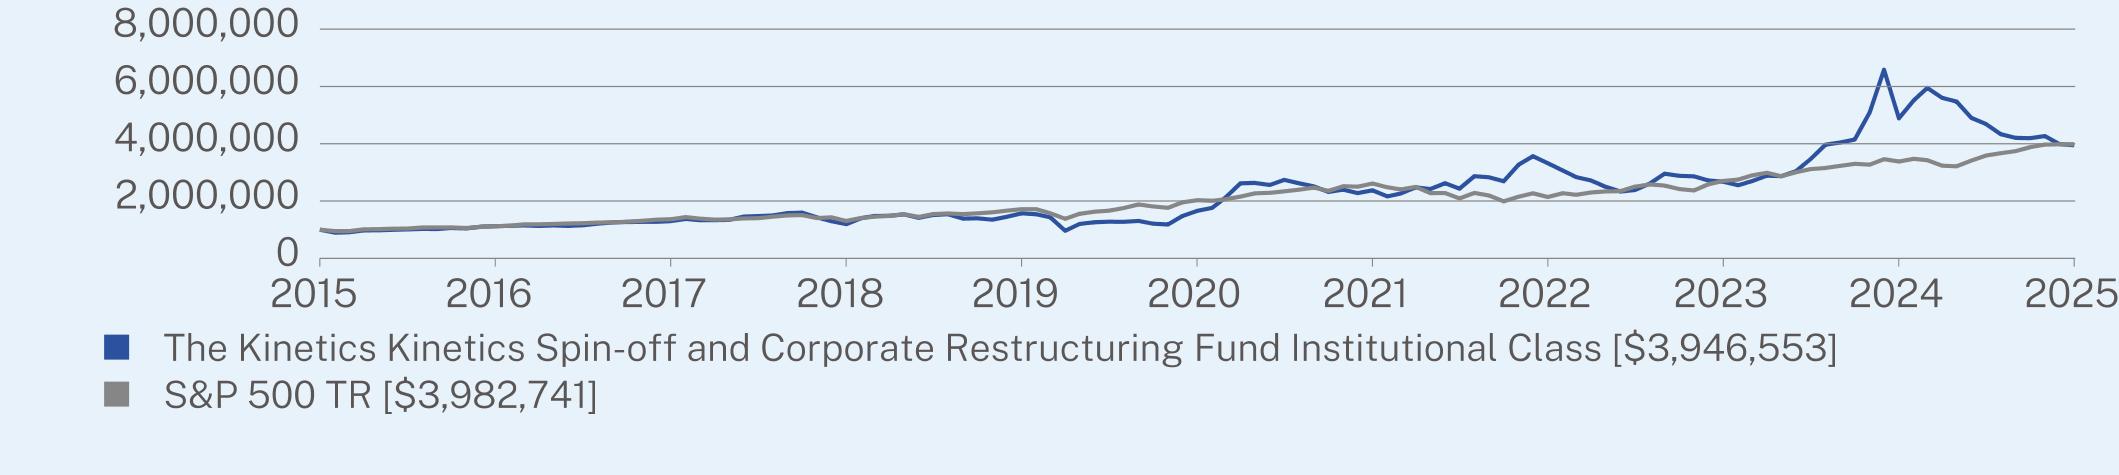
ANNUAL AVERAGE TOTAL RETURN (%)
|
|
1 Year
|
5 Year
|
10 Year
|
|
Institutional Class (without sales charge)
|
-19.28
|
18.93
|
14.72
|
|
S&P 500 TR
|
17.88
|
14.42
|
14.82
|
Visit https://kineticsfunds.com/resources/ for more recent performance information.
KEY FUND STATISTICS (as of December 31, 2025)
|
Net Assets
|
$26,148,867
|
|
Number of Holdings
|
35
|
|
Net Advisory Fee
|
$348,840
|
|
Portfolio Turnover
|
4%
|
WHAT DID THE FUND INVEST IN? (as of December 31, 2025)
|
Top Sectors
|
(%)
|
|
Utilities
|
76.3%
|
|
Finance and Insurance
|
7.6%
|
|
Real Estate and Rental and Leasing
|
5.4%
|
|
Management of Companies and Enterprises
|
4.3%
|
|
Mining, Quarrying, and Oil and Gas Extraction
|
1.2%
|
|
Energy
|
0.9%
|
|
Accommodation and Food Services
|
0.8%
|
|
Manufacturing
|
0.7%
|
|
Professional, Scientific, and Technical Services
|
0.4%
|
|
Cash & Other
|
2.4%
|
|
Top 10 Issuers
|
(%)
|
|
Texas Pacific Land Corp.
|
76.2%
|
|
Landbridge Co. LLC
|
5.4%
|
|
Associated Capital Group, Inc.
|
5.0%
|
|
Hawaiian Electric Industries, Inc.
|
3.3%
|
|
GAMCO Investors, Inc.
|
1.8%
|
|
WaterBridge Infrastructure LLC
|
1.1%
|
|
PrairieSky Royalty Ltd.
|
0.9%
|
|
Civeo Corp.
|
0.8%
|
|
Grayscale Bitcoin Mini Trust ETF
|
0.7%
|
|
White Mountains Insurance Group Ltd.
|
0.5%
|
WHAT WERE THE FUND COSTS FOR THE PAST YEAR? (based on a hypothetical $10,000 investment)
|
Class Name
|
Costs of a $10,000 investment
|
Costs paid as a percentage of a $10,000 investment
|
|
No Load Class
|
$133
|
1.47%
|
HOW DID THE FUND PERFORM LAST YEAR AND WHAT AFFECTED ITS PERFORMANCE?
For the 12-month period ended December 31, 2025, the Fund’s No-Load class posted a loss of 19.45%, trailing the S&P 500 Index, which posted a gain of 17.88% for the same period.
WHAT FACTORS INFLUENCED PERFORMANCE
The Fund’s performance was driven by negative returns in specific land companies, which we believe are well-positioned to benefit from infrastructure development related to energy, water and power transmission. However, these companies have legacy energy businesses, which were negatively impacted by materially lower oil prices. The energy exposure is limited to royalties and infrastructure but proved vulnerable to macroeconomic factors. Blockchain and cryptocurrency also detracted modestly from returns, with Bitcoin prices ultimately ending the year lower after making all-time highs in October. These losses were partially offset by exposure to power utilities.
POSITIONING
The portfolio remains focused on companies that are actively seeking to maximize shareholder value through spin-offs and subject to restructuring activity. These types of activities have been limited by volatile interest rates and economic policies, which should both prove to be temporary. Guided by our long-term value investment philosophy, the Fund may experience periods of outperformance or underperformance relative to the benchmark, but we believe the Fund is well-positioned to generate above-market returns over the long term.
PERFORMANCE
The Fund’s top contributor: Security selection within financial services, specifically Associated Capital Group (Ticker: ACGP).
The Fund’s top detractor: Security selection within the Energy Sector, specifically Texas Pacific Land Corporation (Ticker: TPL).
The Fund’s top detractor: Security selection within the Energy Sector, specifically Texas Pacific Land Corporation (Ticker: TPL).
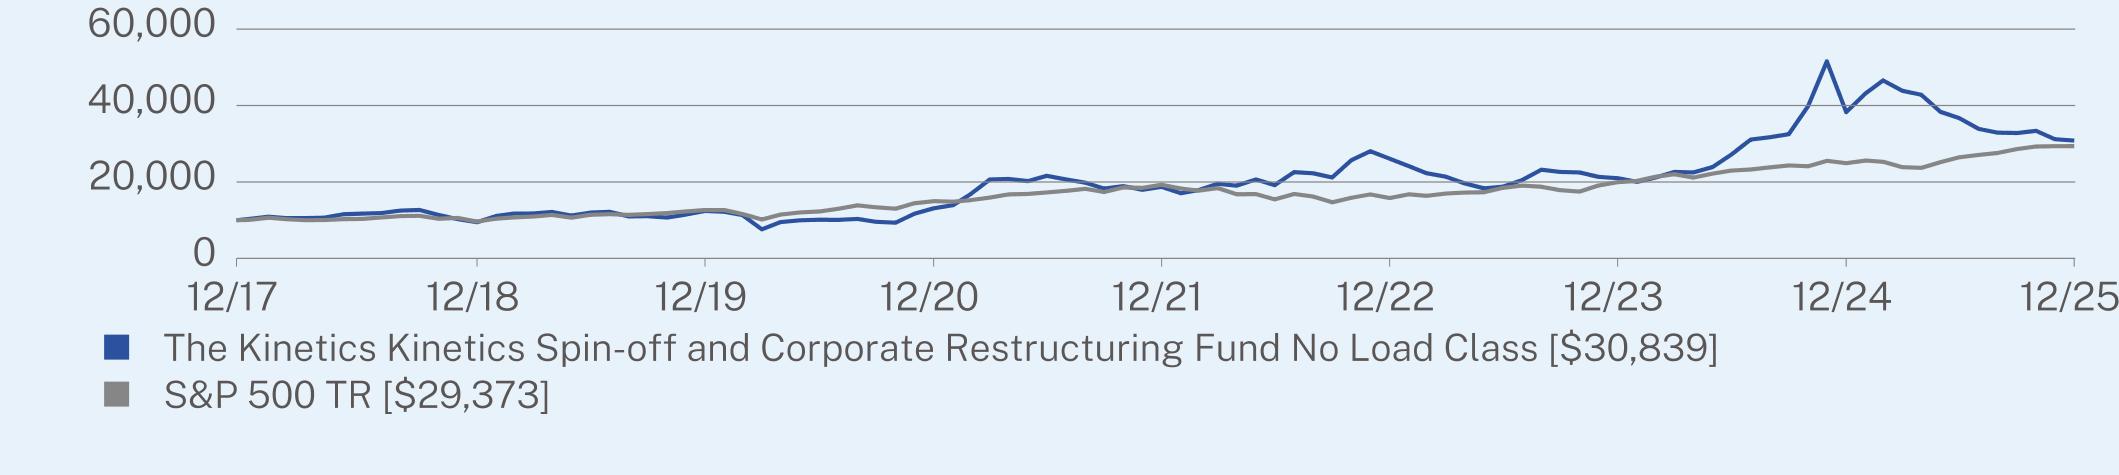
ANNUAL AVERAGE TOTAL RETURN (%)
|
|
1 Year
|
5 Year
|
Since Inception
(12/11/2017) |
|
No Load Class (without sales charge)
|
-19.45
|
18.68
|
15.01
|
|
S&P 500 TR
|
17.88
|
14.42
|
14.31
|
Visit https://kineticsfunds.com/resources/ for more recent performance information.
KEY FUND STATISTICS (as of December 31, 2025)
|
Net Assets
|
$26,148,867
|
|
Number of Holdings
|
35
|
|
Net Advisory Fee
|
$348,840
|
|
Portfolio Turnover
|
4%
|
WHAT DID THE FUND INVEST IN? (as of December 31, 2025)
|
Top Sectors
|
(%)
|
|
Utilities
|
76.3%
|
|
Finance and Insurance
|
7.6%
|
|
Real Estate and Rental and Leasing
|
5.4%
|
|
Management of Companies and Enterprises
|
4.3%
|
|
Mining, Quarrying, and Oil and Gas Extraction
|
1.2%
|
|
Energy
|
0.9%
|
|
Accommodation and Food Services
|
0.8%
|
|
Manufacturing
|
0.7%
|
|
Professional, Scientific, and Technical Services
|
0.4%
|
|
Cash & Other
|
2.4%
|
|
Top 10 Issuers
|
(%)
|
|
Texas Pacific Land Corp.
|
76.2%
|
|
Landbridge Co. LLC
|
5.4%
|
|
Associated Capital Group, Inc.
|
5.0%
|
|
Hawaiian Electric Industries, Inc.
|
3.3%
|
|
GAMCO Investors, Inc.
|
1.8%
|
|
WaterBridge Infrastructure LLC
|
1.1%
|
|
PrairieSky Royalty Ltd.
|
0.9%
|
|
Civeo Corp.
|
0.8%
|
|
Grayscale Bitcoin Mini Trust ETF
|
0.7%
|
|
White Mountains Insurance Group Ltd.
|
0.5%
|