Shareholder Report
Dec. 31, 2025
USD ($)
Holding
Shareholder Report |
12 Months Ended |
|---|---|
|
Dec. 31, 2025
USD ($)
Holding
| |
| Shareholder Report [Line Items] | |
| Document Type | N-CSR |
| Amendment Flag | false |
| Registrant Name | Texas Capital Funds Trust |
| Entity Central Index Key | 0001972459 |
| Entity Investment Company Type | N-1A |
| Document Period End Date | Dec. 31, 2025 |
| Shareholder Report Annual or Semi-Annual | Annual Shareholder Report |
| C000252068 | |
| Shareholder Report [Line Items] | |
| Fund Name | Texas Capital Government Money Market ETF |
| Trading Symbol | MMKT |
| Annual or Semi-Annual Statement [Text Block] | This annual shareholder report contains important information about Texas Capital Government Money Market ETF (the "Fund") for the period of January 1, 2025 to December 31, 2025. |
| Additional Information [Text Block] | You can find additional information about the Fund at https://fundsmanagement.texascapital.com/funds/mmkt/. You can also request this information by contacting us at (844) 822-3837. |
| Additional Information Phone Number | (844) 822-3837 |
| Additional Information Website | https://fundsmanagement.texascapital.com/funds/mmkt/ |
| Expenses [Text Block] | |
| Expenses Paid, Amount | $ 20 |
| Expense Ratio, Percent | 0.20% |
| Performance Inception Date | Sep. 24, 2024 |
| AssetsNet | $ 70,128,708 |
| Holdings Count | Holding | 36 |
| Additional Fund Statistics [Text Block] | |
| Largest Holdings [Text Block] | |
| C000245603 | |
| Shareholder Report [Line Items] | |
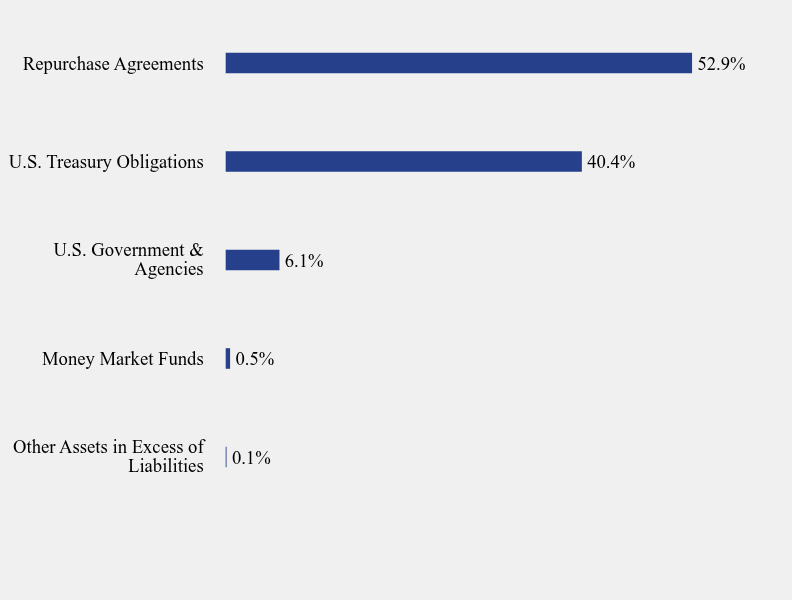
| Fund Name | Texas Capital Government Money Market Fund |
| Trading Symbol | TXGXX |
| Annual or Semi-Annual Statement [Text Block] | This annual shareholder report contains important information about Texas Capital Government Money Market Fund (the "Fund") for the period of January 1, 2025 to December 31, 2025. |
| Additional Information [Text Block] | You can find additional information about the Fund at https://www.texascapitalbank.com/etf-funds-management/txgxx?&. You can also request this information by contacting us at (844) 822-3837. |
| Material Fund Change Notice [Text Block] | This report describes changes to the Fund that occurred during the reporting period. |
| Additional Information Phone Number | (844) 822-3837 |
| Additional Information Website | https://www.texascapitalbank.com/etf-funds-management/txgxx?& |
| Expenses [Text Block] | |
| Expenses Paid, Amount | $ 24 |
| Expense Ratio, Percent | 0.24% |
| Performance Inception Date | Jul. 17, 2024 |
| AssetsNet | $ 128,547,878 |
| Holdings Count | Holding | 39 |
| Additional Fund Statistics [Text Block] | |
| Holdings [Text Block] | |
| Largest Holdings [Text Block] | |
| C000243202 | |
| Shareholder Report [Line Items] | |
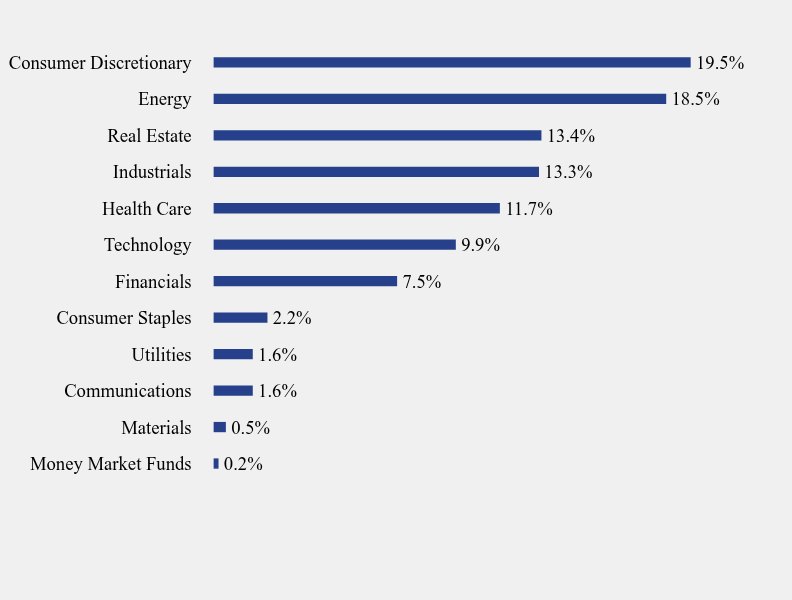
| Fund Name | Texas Capital Texas Equity Index ETF |
| Trading Symbol | TXS |
| Annual or Semi-Annual Statement [Text Block] | This annual shareholder report contains important information about Texas Capital Texas Equity Index ETF (the "Fund") for the period of January 1, 2025 to December 31, 2025. |
| Additional Information [Text Block] | You can find additional information about the Fund at https://www.texascapitalbank.com/etf-funds-management/txs?&. You can also request this information by contacting us at (844) 822-3837. |
| Additional Information Phone Number | (844) 822-3837 |
| Additional Information Website | https://www.texascapitalbank.com/etf-funds-management/txs?& |
| Expenses [Text Block] | |
| Expenses Paid, Amount | $ 52 |
| Expense Ratio, Percent | 0.49% |
| Performance Inception Date | Jul. 12, 2023 |
| AssetsNet | $ 31,407,434 |
| Holdings Count | Holding | 218 |
| Advisory Fees Paid, Amount | $ 152,542 |
| InvestmentCompanyPortfolioTurnover | 18.00% |
| Additional Fund Statistics [Text Block] | |
| Holdings [Text Block] | |
| Largest Holdings [Text Block] | |
| C000247107 | |
| Shareholder Report [Line Items] | |
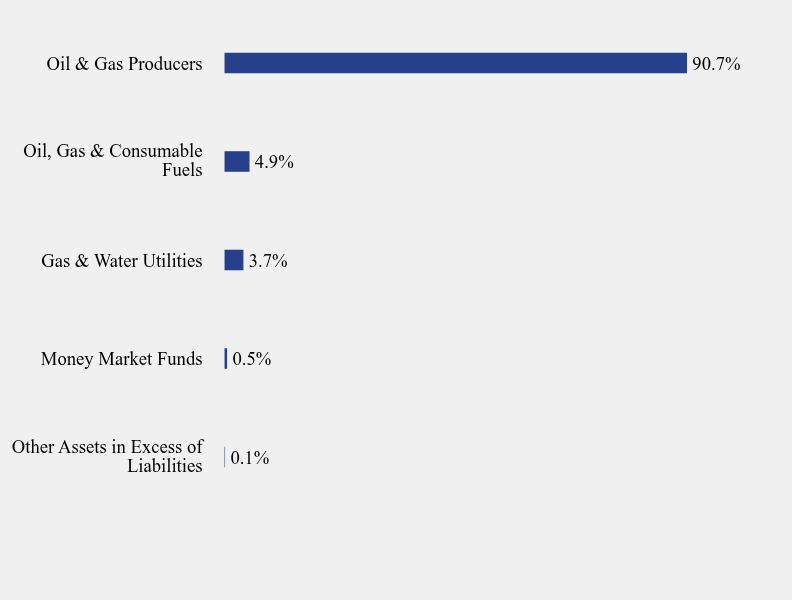
| Fund Name | Texas Capital Texas Oil Index ETF |
| Trading Symbol | OILT |
| Annual or Semi-Annual Statement [Text Block] | This annual shareholder report contains important information about Texas Capital Texas Oil Index ETF (the "Fund") for the period of January 1, 2025 to December 31, 2025. |
| Additional Information [Text Block] | You can find additional information about the Fund at https://www.texascapitalbank.com/etf-funds-management/oilt?&. You can also request this information by contacting us at (844) 822-3837. |
| Additional Information Phone Number | (844) 822-3837 |
| Additional Information Website | https://www.texascapitalbank.com/etf-funds-management/oilt?& |
| Expenses [Text Block] | |
| Expenses Paid, Amount | $ 34 |
| Expense Ratio, Percent | 0.35% |
| Performance Inception Date | Dec. 20, 2023 |
| AssetsNet | $ 10,000,012 |
| Holdings Count | Holding | 28 |
| Advisory Fees Paid, Amount | $ 41,379 |
| InvestmentCompanyPortfolioTurnover | 13.00% |
| Additional Fund Statistics [Text Block] | |
| Holdings [Text Block] | |
| Largest Holdings [Text Block] |