| Line Graph [Table Text Block] |
|
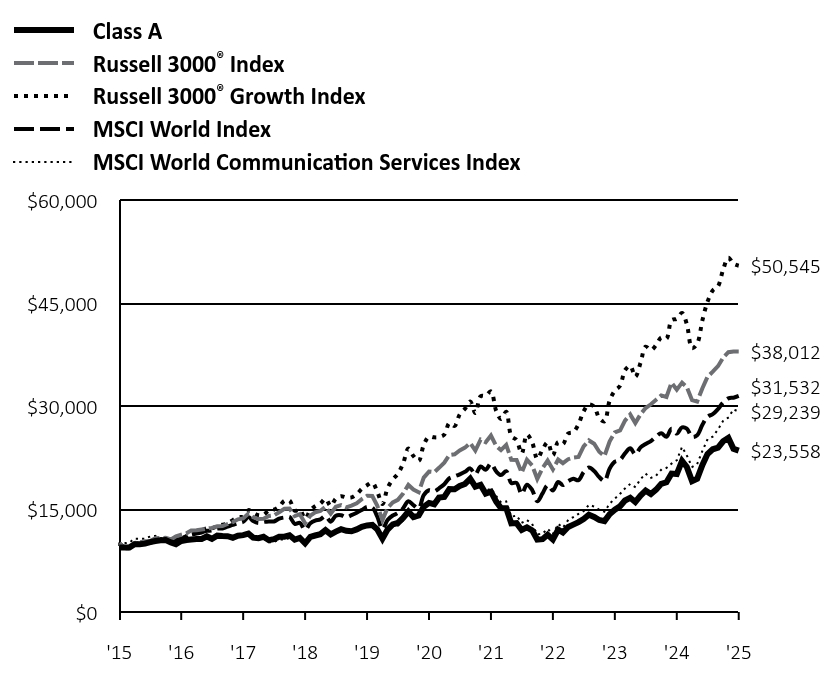 | Class A | Russell 3000® Index | Russell 3000® Growth Index | MSCI World Index | MSCI World Communication Services Index |
|---|
'15 | $9,425 | $10,000 | $10,000 | $10,000 | $10,000 |
|---|
'16 | $9,413 | $9,436 | $9,403 | $9,402 | $10,033 |
|---|
'16 | $9,425 | $9,433 | $9,394 | $9,332 | $10,149 |
|---|
'16 | $9,882 | $10,097 | $10,034 | $9,965 | $10,685 |
|---|
'16 | $9,886 | $10,159 | $9,956 | $10,123 | $10,672 |
|---|
'16 | $9,973 | $10,341 | $10,154 | $10,180 | $10,703 |
|---|
'16 | $10,209 | $10,362 | $10,114 | $10,066 | $11,006 |
|---|
'16 | $10,367 | $10,774 | $10,605 | $10,491 | $11,107 |
|---|
'16 | $10,469 | $10,801 | $10,565 | $10,499 | $10,774 |
|---|
'16 | $10,512 | $10,818 | $10,612 | $10,555 | $10,733 |
|---|
'16 | $10,162 | $10,584 | $10,332 | $10,351 | $10,244 |
|---|
'16 | $9,898 | $11,058 | $10,607 | $10,500 | $9,972 |
|---|
'16 | $10,357 | $11,274 | $10,739 | $10,751 | $10,566 |
|---|
'17 | $10,504 | $11,486 | $11,087 | $11,011 | $10,626 |
|---|
'17 | $10,582 | $11,913 | $11,533 | $11,316 | $10,622 |
|---|
'17 | $10,664 | $11,921 | $11,667 | $11,437 | $10,681 |
|---|
'17 | $10,656 | $12,047 | $11,930 | $11,606 | $10,533 |
|---|
'17 | $11,029 | $12,171 | $12,209 | $11,851 | $10,918 |
|---|
'17 | $10,681 | $12,280 | $12,209 | $11,897 | $10,590 |
|---|
'17 | $11,144 | $12,512 | $12,517 | $12,182 | $11,082 |
|---|
'17 | $11,078 | $12,536 | $12,727 | $12,199 | $10,888 |
|---|
'17 | $11,058 | $12,842 | $12,933 | $12,473 | $10,991 |
|---|
'17 | $10,840 | $13,122 | $13,411 | $12,708 | $10,654 |
|---|
'17 | $11,144 | $13,521 | $13,816 | $12,984 | $11,047 |
|---|
'17 | $11,219 | $13,656 | $13,917 | $13,159 | $11,181 |
|---|
'18 | $11,440 | $14,375 | $14,868 | $13,854 | $11,338 |
|---|
'18 | $10,857 | $13,846 | $14,476 | $13,280 | $10,680 |
|---|
'18 | $10,766 | $13,568 | $14,123 | $12,991 | $10,527 |
|---|
'18 | $10,979 | $13,619 | $14,170 | $13,140 | $10,742 |
|---|
'18 | $10,486 | $14,004 | $14,812 | $13,222 | $10,159 |
|---|
'18 | $10,632 | $14,095 | $14,953 | $13,216 | $10,222 |
|---|
'18 | $10,970 | $14,563 | $15,377 | $13,629 | $10,569 |
|---|
'18 | $10,991 | $15,074 | $16,227 | $13,797 | $10,564 |
|---|
'18 | $11,196 | $15,099 | $16,281 | $13,874 | $10,791 |
|---|
'18 | $10,573 | $13,988 | $14,778 | $12,856 | $10,403 |
|---|
'18 | $10,803 | $14,268 | $14,941 | $13,002 | $10,815 |
|---|
'18 | $10,027 | $12,940 | $13,622 | $12,013 | $10,060 |
|---|
'19 | $10,958 | $14,051 | $14,872 | $12,948 | $10,920 |
|---|
'19 | $11,164 | $14,545 | $15,436 | $13,337 | $11,012 |
|---|
'19 | $11,360 | $14,757 | $15,826 | $13,512 | $11,220 |
|---|
'19 | $11,948 | $15,346 | $16,524 | $13,991 | $11,839 |
|---|
'19 | $11,330 | $14,353 | $15,467 | $13,184 | $11,272 |
|---|
'19 | $11,727 | $15,361 | $16,538 | $14,053 | $11,718 |
|---|
'19 | $12,085 | $15,590 | $16,897 | $14,122 | $12,036 |
|---|
'19 | $11,850 | $15,272 | $16,728 | $13,833 | $11,858 |
|---|
'19 | $11,776 | $15,540 | $16,721 | $14,128 | $11,877 |
|---|
'19 | $12,051 | $15,875 | $17,193 | $14,487 | $12,206 |
|---|
'19 | $12,433 | $16,478 | $17,971 | $14,891 | $12,570 |
|---|
'19 | $12,641 | $16,954 | $18,505 | $15,337 | $12,816 |
|---|
'20 | $12,705 | $16,935 | $18,879 | $15,244 | $12,839 |
|---|
'20 | $12,058 | $15,549 | $17,588 | $13,955 | $12,007 |
|---|
'20 | $10,695 | $13,410 | $15,757 | $12,108 | $10,577 |
|---|
'20 | $12,023 | $15,187 | $18,089 | $13,431 | $11,860 |
|---|
'20 | $12,783 | $15,999 | $19,332 | $14,080 | $12,503 |
|---|
'20 | $12,989 | $16,364 | $20,168 | $14,452 | $12,589 |
|---|
'20 | $13,734 | $17,294 | $21,670 | $15,144 | $13,371 |
|---|
'20 | $14,670 | $18,546 | $23,852 | $16,156 | $14,411 |
|---|
'20 | $13,847 | $17,871 | $22,761 | $15,598 | $13,635 |
|---|
'20 | $14,072 | $17,485 | $22,041 | $15,120 | $13,785 |
|---|
'20 | $15,361 | $19,613 | $24,393 | $17,053 | $15,199 |
|---|
'20 | $15,920 | $20,495 | $25,585 | $17,776 | $15,761 |
|---|
'21 | $15,729 | $20,404 | $25,489 | $17,599 | $15,586 |
|---|
'21 | $16,689 | $21,042 | $25,541 | $18,050 | $16,542 |
|---|
'21 | $16,802 | $21,796 | $25,890 | $18,651 | $16,837 |
|---|
'21 | $17,944 | $22,919 | $27,570 | $19,519 | $17,998 |
|---|
'21 | $17,905 | $23,024 | $27,162 | $19,800 | $17,964 |
|---|
'21 | $18,385 | $23,592 | $28,837 | $20,095 | $18,388 |
|---|
'21 | $18,684 | $23,991 | $29,651 | $20,455 | $18,744 |
|---|
'21 | $19,454 | $24,675 | $30,723 | $20,964 | $19,478 |
|---|
'21 | $18,302 | $23,568 | $29,037 | $20,094 | $18,337 |
|---|
'21 | $18,547 | $25,161 | $31,478 | $21,232 | $18,575 |
|---|
'21 | $17,292 | $24,778 | $31,563 | $20,767 | $17,682 |
|---|
'21 | $17,568 | $25,754 | $32,199 | $21,654 | $18,023 |
|---|
'22 | $16,118 | $24,239 | $29,345 | $20,508 | $16,929 |
|---|
'22 | $15,181 | $23,628 | $28,175 | $19,990 | $16,015 |
|---|
'22 | $15,154 | $24,395 | $29,220 | $20,538 | $16,135 |
|---|
'22 | $12,921 | $22,206 | $25,688 | $18,832 | $13,900 |
|---|
'22 | $12,974 | $22,176 | $25,097 | $18,846 | $14,074 |
|---|
'22 | $11,973 | $20,321 | $23,134 | $17,214 | $13,005 |
|---|
'22 | $12,360 | $22,227 | $25,900 | $18,581 | $13,418 |
|---|
'22 | $11,920 | $21,397 | $24,750 | $17,804 | $12,834 |
|---|
'22 | $10,571 | $19,413 | $22,355 | $16,149 | $11,318 |
|---|
'22 | $10,629 | $21,005 | $23,711 | $17,308 | $11,444 |
|---|
'22 | $11,285 | $22,102 | $24,748 | $18,512 | $12,141 |
|---|
'22 | $10,590 | $20,808 | $22,872 | $17,726 | $11,367 |
|---|
'23 | $12,019 | $22,241 | $24,801 | $18,980 | $12,850 |
|---|
'23 | $11,617 | $21,721 | $24,509 | $18,524 | $12,312 |
|---|
'23 | $12,406 | $22,302 | $26,040 | $19,096 | $13,419 |
|---|
'23 | $12,750 | $22,539 | $26,265 | $19,431 | $13,838 |
|---|
'23 | $13,115 | $22,627 | $27,394 | $19,237 | $14,325 |
|---|
'23 | $13,571 | $24,172 | $29,288 | $20,400 | $14,713 |
|---|
'23 | $14,195 | $25,039 | $30,295 | $21,086 | $15,634 |
|---|
'23 | $13,862 | $24,555 | $29,955 | $20,582 | $15,397 |
|---|
'23 | $13,422 | $23,386 | $28,309 | $19,694 | $14,934 |
|---|
'23 | $13,263 | $22,766 | $27,818 | $19,123 | $14,627 |
|---|
'23 | $14,275 | $24,888 | $30,827 | $20,915 | $15,794 |
|---|
'23 | $14,926 | $26,209 | $32,298 | $21,942 | $16,546 |
|---|
'24 | $15,445 | $26,499 | $33,013 | $22,206 | $17,249 |
|---|
'24 | $16,276 | $27,933 | $35,285 | $23,147 | $18,035 |
|---|
'24 | $16,679 | $28,835 | $35,923 | $23,891 | $18,684 |
|---|
'24 | $16,059 | $27,566 | $34,340 | $23,003 | $18,229 |
|---|
'24 | $16,991 | $28,868 | $36,386 | $24,031 | $19,392 |
|---|
'24 | $17,711 | $29,762 | $38,724 | $24,520 | $20,190 |
|---|
'24 | $17,213 | $30,315 | $38,233 | $24,952 | $19,562 |
|---|
'24 | $17,859 | $30,975 | $38,971 | $25,611 | $19,912 |
|---|
'24 | $18,701 | $31,616 | $40,048 | $26,080 | $20,759 |
|---|
'24 | $18,929 | $31,384 | $39,897 | $25,563 | $21,038 |
|---|
'24 | $20,200 | $33,471 | $42,590 | $26,736 | $21,661 |
|---|
'24 | $20,131 | $32,448 | $42,781 | $26,039 | $22,145 |
|---|
'25 | $22,042 | $33,473 | $43,649 | $26,958 | $24,090 |
|---|
'25 | $21,169 | $32,831 | $42,019 | $26,764 | $22,859 |
|---|
'25 | $19,104 | $30,916 | $38,504 | $25,572 | $21,162 |
|---|
'25 | $19,443 | $30,709 | $39,171 | $25,800 | $21,587 |
|---|
'25 | $21,467 | $32,655 | $42,585 | $27,327 | $23,518 |
|---|
'25 | $23,048 | $34,314 | $45,262 | $28,506 | $25,195 |
|---|
'25 | $23,747 | $35,070 | $46,932 | $28,873 | $25,588 |
|---|
'25 | $23,982 | $35,881 | $47,549 | $29,626 | $26,652 |
|---|
'25 | $24,916 | $37,120 | $49,976 | $30,578 | $27,904 |
|---|
'25 | $25,404 | $37,915 | $51,703 | $31,191 | $28,381 |
|---|
'25 | $23,831 | $38,019 | $50,836 | $31,279 | $29,572 |
|---|
'25 | $23,558 | $38,012 | $50,545 | $31,532 | $29,239 |
|---|
|
| Line Graph [Table Text Block] |
|
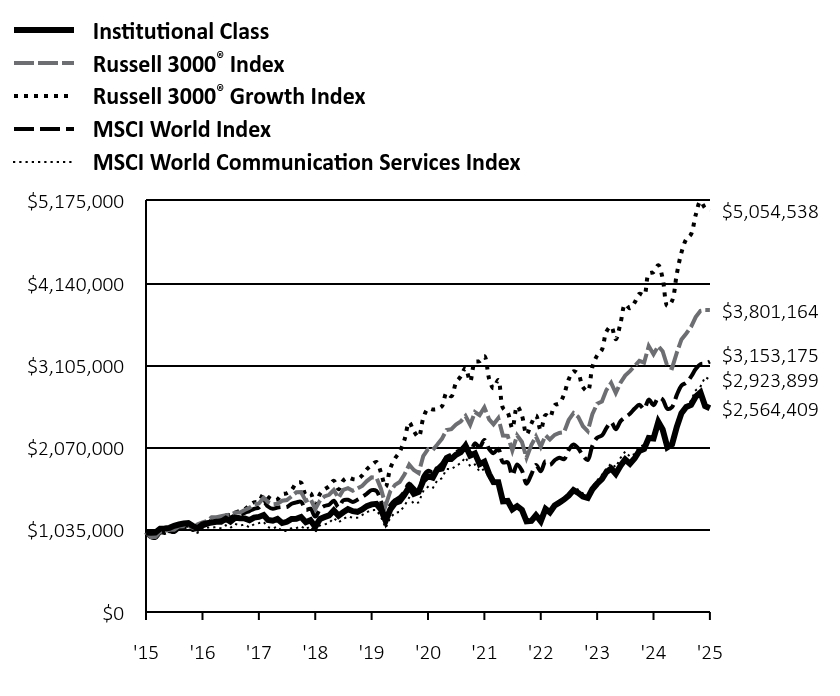 | Institutional Class | Russell 3000® Index | Russell 3000® Growth Index | MSCI World Index | MSCI World Communication Services Index |
|---|
'15 | $1,000,000 | $1,000,000 | $1,000,000 | $1,000,000 | $1,000,000 |
|---|
'16 | $999,183 | $943,575 | $940,257 | $940,176 | $1,003,282 |
|---|
'16 | $1,000,817 | $943,271 | $939,416 | $933,179 | $1,014,903 |
|---|
'16 | $1,049,555 | $1,009,683 | $1,003,371 | $996,504 | $1,068,546 |
|---|
'16 | $1,050,374 | $1,015,941 | $995,567 | $1,012,272 | $1,067,196 |
|---|
'16 | $1,059,387 | $1,034,117 | $1,015,443 | $1,017,958 | $1,070,315 |
|---|
'16 | $1,084,786 | $1,036,243 | $1,011,395 | $1,006,551 | $1,100,618 |
|---|
'16 | $1,101,582 | $1,077,368 | $1,060,502 | $1,049,076 | $1,110,671 |
|---|
'16 | $1,113,052 | $1,080,116 | $1,056,470 | $1,049,948 | $1,077,438 |
|---|
'16 | $1,117,968 | $1,081,814 | $1,061,190 | $1,055,525 | $1,073,278 |
|---|
'16 | $1,080,689 | $1,058,408 | $1,033,153 | $1,035,098 | $1,024,374 |
|---|
'16 | $1,052,832 | $1,105,774 | $1,060,708 | $1,049,982 | $997,243 |
|---|
'16 | $1,102,247 | $1,127,351 | $1,073,938 | $1,075,106 | $1,056,602 |
|---|
'17 | $1,118,055 | $1,148,570 | $1,108,676 | $1,101,054 | $1,062,644 |
|---|
'17 | $1,126,599 | $1,191,287 | $1,153,297 | $1,131,601 | $1,062,197 |
|---|
'17 | $1,135,144 | $1,192,097 | $1,166,655 | $1,143,655 | $1,068,110 |
|---|
'17 | $1,134,717 | $1,204,733 | $1,192,950 | $1,160,589 | $1,053,349 |
|---|
'17 | $1,174,449 | $1,217,062 | $1,220,887 | $1,185,141 | $1,091,831 |
|---|
'17 | $1,137,707 | $1,228,045 | $1,220,942 | $1,189,701 | $1,058,964 |
|---|
'17 | $1,187,693 | $1,251,200 | $1,251,652 | $1,218,173 | $1,108,214 |
|---|
'17 | $1,180,857 | $1,253,611 | $1,272,699 | $1,219,888 | $1,088,779 |
|---|
'17 | $1,178,721 | $1,284,184 | $1,293,307 | $1,247,267 | $1,099,076 |
|---|
'17 | $1,156,078 | $1,312,208 | $1,341,053 | $1,270,838 | $1,065,400 |
|---|
'17 | $1,188,120 | $1,352,053 | $1,381,621 | $1,298,374 | $1,104,684 |
|---|
'17 | $1,196,812 | $1,365,567 | $1,391,686 | $1,315,933 | $1,118,067 |
|---|
'18 | $1,220,296 | $1,437,547 | $1,486,808 | $1,385,415 | $1,133,790 |
|---|
'18 | $1,158,542 | $1,384,560 | $1,447,576 | $1,328,021 | $1,067,987 |
|---|
'18 | $1,149,005 | $1,356,766 | $1,412,327 | $1,299,075 | $1,052,681 |
|---|
'18 | $1,171,706 | $1,361,923 | $1,416,982 | $1,314,003 | $1,074,155 |
|---|
'18 | $1,119,756 | $1,400,371 | $1,481,211 | $1,322,237 | $1,015,945 |
|---|
'18 | $1,135,472 | $1,409,529 | $1,495,271 | $1,321,606 | $1,022,160 |
|---|
'18 | $1,172,142 | $1,456,305 | $1,537,735 | $1,362,884 | $1,056,942 |
|---|
'18 | $1,174,325 | $1,507,447 | $1,622,717 | $1,379,747 | $1,056,416 |
|---|
'18 | $1,196,589 | $1,509,942 | $1,628,097 | $1,387,430 | $1,079,136 |
|---|
'18 | $1,130,233 | $1,398,761 | $1,477,821 | $1,285,554 | $1,040,327 |
|---|
'18 | $1,155,117 | $1,426,776 | $1,494,074 | $1,300,158 | $1,081,513 |
|---|
'18 | $1,072,283 | $1,293,987 | $1,362,197 | $1,201,297 | $1,006,014 |
|---|
'19 | $1,172,042 | $1,405,055 | $1,487,182 | $1,294,765 | $1,091,971 |
|---|
'19 | $1,194,040 | $1,454,470 | $1,543,560 | $1,333,698 | $1,101,159 |
|---|
'19 | $1,215,527 | $1,475,708 | $1,582,592 | $1,351,215 | $1,122,012 |
|---|
'19 | $1,278,452 | $1,534,636 | $1,652,398 | $1,399,128 | $1,183,869 |
|---|
'19 | $1,212,969 | $1,435,327 | $1,546,701 | $1,318,397 | $1,127,174 |
|---|
'19 | $1,255,431 | $1,536,140 | $1,653,840 | $1,405,273 | $1,171,793 |
|---|
'19 | $1,294,311 | $1,558,975 | $1,689,741 | $1,412,234 | $1,203,586 |
|---|
'19 | $1,269,243 | $1,527,195 | $1,672,813 | $1,383,347 | $1,185,826 |
|---|
'19 | $1,261,058 | $1,553,999 | $1,672,094 | $1,412,786 | $1,187,672 |
|---|
'19 | $1,291,242 | $1,587,452 | $1,719,257 | $1,448,738 | $1,220,583 |
|---|
'19 | $1,332,680 | $1,647,794 | $1,797,125 | $1,489,086 | $1,256,950 |
|---|
'19 | $1,355,273 | $1,695,372 | $1,850,494 | $1,533,696 | $1,281,553 |
|---|
'20 | $1,361,944 | $1,693,520 | $1,887,861 | $1,524,361 | $1,283,851 |
|---|
'20 | $1,292,667 | $1,554,866 | $1,758,810 | $1,395,514 | $1,200,704 |
|---|
'20 | $1,146,927 | $1,341,044 | $1,575,665 | $1,210,828 | $1,057,731 |
|---|
'20 | $1,289,588 | $1,518,652 | $1,808,890 | $1,343,104 | $1,185,985 |
|---|
'20 | $1,371,694 | $1,599,867 | $1,933,159 | $1,407,987 | $1,250,331 |
|---|
'20 | $1,394,274 | $1,636,443 | $2,016,750 | $1,445,230 | $1,258,928 |
|---|
'20 | $1,474,328 | $1,729,366 | $2,166,956 | $1,514,372 | $1,337,096 |
|---|
'20 | $1,574,908 | $1,854,649 | $2,385,205 | $1,615,554 | $1,441,068 |
|---|
'20 | $1,487,157 | $1,787,119 | $2,276,088 | $1,559,819 | $1,363,506 |
|---|
'20 | $1,511,276 | $1,748,547 | $2,204,099 | $1,511,972 | $1,378,482 |
|---|
'20 | $1,650,344 | $1,961,263 | $2,439,273 | $1,705,295 | $1,519,855 |
|---|
'20 | $1,710,384 | $2,049,496 | $2,558,532 | $1,777,594 | $1,576,069 |
|---|
'21 | $1,690,371 | $2,040,380 | $2,548,860 | $1,759,927 | $1,558,612 |
|---|
'21 | $1,794,030 | $2,104,157 | $2,554,082 | $1,805,024 | $1,654,231 |
|---|
'21 | $1,806,346 | $2,179,576 | $2,589,039 | $1,865,081 | $1,683,672 |
|---|
'21 | $1,929,506 | $2,291,931 | $2,756,986 | $1,951,882 | $1,799,816 |
|---|
'21 | $1,925,914 | $2,302,394 | $2,716,187 | $1,980,000 | $1,796,394 |
|---|
'21 | $1,978,257 | $2,359,169 | $2,883,667 | $2,009,512 | $1,838,829 |
|---|
'21 | $2,010,587 | $2,399,064 | $2,965,094 | $2,045,508 | $1,874,431 |
|---|
'21 | $2,093,720 | $2,467,480 | $3,072,327 | $2,096,417 | $1,947,751 |
|---|
'21 | $1,970,047 | $2,356,769 | $2,903,696 | $2,009,373 | $1,833,679 |
|---|
'21 | $1,996,218 | $2,516,144 | $3,147,755 | $2,123,185 | $1,857,526 |
|---|
'21 | $1,861,768 | $2,477,845 | $3,156,259 | $2,076,660 | $1,768,197 |
|---|
'21 | $1,892,032 | $2,575,419 | $3,219,883 | $2,165,417 | $1,802,273 |
|---|
'22 | $1,735,611 | $2,423,891 | $2,934,450 | $2,050,843 | $1,692,853 |
|---|
'22 | $1,635,213 | $2,362,835 | $2,817,452 | $1,998,975 | $1,601,452 |
|---|
'22 | $1,632,994 | $2,439,476 | $2,921,965 | $2,053,834 | $1,613,509 |
|---|
'22 | $1,392,815 | $2,220,552 | $2,568,782 | $1,883,215 | $1,390,042 |
|---|
'22 | $1,398,362 | $2,217,575 | $2,509,703 | $1,884,641 | $1,407,358 |
|---|
'22 | $1,291,308 | $2,032,056 | $2,313,415 | $1,721,390 | $1,300,535 |
|---|
'22 | $1,332,909 | $2,222,699 | $2,589,975 | $1,858,062 | $1,341,756 |
|---|
'22 | $1,285,761 | $2,139,749 | $2,474,989 | $1,780,381 | $1,283,426 |
|---|
'22 | $1,140,433 | $1,941,332 | $2,235,471 | $1,614,877 | $1,131,839 |
|---|
'22 | $1,146,535 | $2,100,533 | $2,371,098 | $1,730,846 | $1,144,419 |
|---|
'22 | $1,218,089 | $2,210,173 | $2,474,781 | $1,851,192 | $1,214,068 |
|---|
'22 | $1,142,991 | $2,080,760 | $2,287,211 | $1,772,577 | $1,136,748 |
|---|
'23 | $1,297,794 | $2,224,068 | $2,480,149 | $1,897,998 | $1,285,046 |
|---|
'23 | $1,254,516 | $2,172,085 | $2,450,850 | $1,852,373 | $1,231,230 |
|---|
'23 | $1,339,963 | $2,230,165 | $2,604,018 | $1,909,611 | $1,341,936 |
|---|
'23 | $1,377,138 | $2,253,926 | $2,626,463 | $1,943,086 | $1,383,806 |
|---|
'23 | $1,417,087 | $2,262,696 | $2,739,430 | $1,923,687 | $1,432,538 |
|---|
'23 | $1,466,469 | $2,417,205 | $2,928,813 | $2,040,027 | $1,471,301 |
|---|
'23 | $1,534,715 | $2,503,854 | $3,029,462 | $2,108,557 | $1,563,363 |
|---|
'23 | $1,498,650 | $2,455,520 | $2,995,476 | $2,058,193 | $1,539,693 |
|---|
'23 | $1,452,043 | $2,338,553 | $2,830,856 | $1,969,406 | $1,493,402 |
|---|
'23 | $1,434,842 | $2,276,561 | $2,781,764 | $1,912,262 | $1,462,713 |
|---|
'23 | $1,544,703 | $2,488,846 | $3,082,689 | $2,091,541 | $1,579,422 |
|---|
'23 | $1,615,169 | $2,620,859 | $3,229,762 | $2,194,224 | $1,654,569 |
|---|
'24 | $1,672,318 | $2,649,905 | $3,301,261 | $2,220,556 | $1,724,897 |
|---|
'24 | $1,762,204 | $2,793,346 | $3,528,485 | $2,314,702 | $1,803,541 |
|---|
'24 | $1,806,592 | $2,883,452 | $3,592,339 | $2,389,085 | $1,868,424 |
|---|
'24 | $1,739,455 | $2,756,575 | $3,434,004 | $2,300,343 | $1,822,941 |
|---|
'24 | $1,840,992 | $2,886,815 | $3,638,582 | $2,403,058 | $1,939,159 |
|---|
'24 | $1,919,226 | $2,976,183 | $3,872,382 | $2,451,955 | $2,019,032 |
|---|
'24 | $1,865,406 | $3,031,507 | $3,823,315 | $2,495,164 | $1,956,240 |
|---|
'24 | $1,936,427 | $3,097,499 | $3,897,085 | $2,561,112 | $1,991,218 |
|---|
'24 | $2,027,977 | $3,161,573 | $4,004,752 | $2,608,016 | $2,075,932 |
|---|
'24 | $2,052,390 | $3,138,356 | $3,989,659 | $2,556,281 | $2,103,783 |
|---|
'24 | $2,191,103 | $3,347,132 | $4,258,971 | $2,673,580 | $2,166,096 |
|---|
'24 | $2,184,445 | $3,244,826 | $4,278,059 | $2,603,905 | $2,214,503 |
|---|
'25 | $2,392,513 | $3,347,259 | $4,364,923 | $2,695,793 | $2,408,996 |
|---|
'25 | $2,297,634 | $3,283,112 | $4,201,908 | $2,676,391 | $2,285,922 |
|---|
'25 | $2,074,030 | $3,091,606 | $3,850,436 | $2,557,237 | $2,116,241 |
|---|
'25 | $2,111,204 | $3,070,864 | $3,917,147 | $2,579,963 | $2,158,684 |
|---|
'25 | $2,331,605 | $3,265,514 | $4,258,549 | $2,732,676 | $2,351,807 |
|---|
'25 | $2,503,453 | $3,431,411 | $4,526,246 | $2,850,599 | $2,519,463 |
|---|
'25 | $2,581,173 | $3,506,980 | $4,693,188 | $2,887,294 | $2,558,773 |
|---|
'25 | $2,607,080 | $3,588,138 | $4,754,934 | $2,962,610 | $2,665,212 |
|---|
'25 | $2,709,843 | $3,711,970 | $4,997,573 | $3,057,846 | $2,790,364 |
|---|
'25 | $2,763,384 | $3,791,525 | $5,170,264 | $3,119,080 | $2,838,071 |
|---|
'25 | $2,592,399 | $3,801,938 | $5,083,563 | $3,127,891 | $2,957,200 |
|---|
'25 | $2,564,409 | $3,801,164 | $5,054,538 | $3,153,175 | $2,923,899 |
|---|
|