Shareholder Report
|
|
12 Months Ended |
Jan. 01, 2025 |
Dec. 31, 2025
USD ($)
Holding
|
| Shareholder Report [Line Items] |
|
|
| Document Type |
|
N-CSR
|
| Amendment Flag |
|
false
|
| Registrant Name |
|
DEUTSCHE DWS SECURITIES TRUST
|
| Entity Central Index Key |
|
0000088048
|
| Entity Investment Company Type |
|
N-1A
|
| Document Period End Date |
|
Dec. 31, 2025
|
| Shareholder Report Annual or Semi-Annual |
|
Annual Shareholder Report
|
| C000099785 |
|
|
| Shareholder Report [Line Items] |
|
|
| Fund Name |
|
DWS RREEF Real Estate Securities Fund
|
| Class Name |
|
Class A
|
| Trading Symbol |
|
RRRAX
|
| Annual or Semi-Annual Statement [Text Block] |
|
This annual shareholder report contains important information about DWS RREEF Real Estate Securities Fund (the "Fund") for the period January 1, 2025 to December 31, 2025.
|
| Additional Information [Text Block] |
|
You can find additional information about the Fund on the Fund's website at dws.com/mutualreports. You can also request this information by contacting us at (800) 728-3337.
|
| Material Fund Change Notice [Text Block] |
|
This report describes changes to the Fund that occurred during the reporting period.
|
| Additional Information Phone Number |
|
(800) 728-3337
|
| Additional Information Website |
|
<span style="box-sizing: border-box; color: rgb(0, 0, 0); display: inline; flex-wrap: nowrap; font-size: 14.6667px; font-weight: 300; grid-area: auto; line-height: 17.6px; margin: 0px; overflow: visible; text-align: left; text-align-last: auto; white-space-collapse: preserve-breaks;">dws.com/mutualreports</span>
|
| Expenses [Text Block] |
|
What were the Fund costs for the last year?(Based on a hypothetical $10,000 investment) Fund | Costs of a $10,000 investment | Costs paid as a percentage of a $10,000 investment |
|---|
Class A | $99 | 0.99% |
|---|
Gross expense ratio as of the latest prospectus: 1.00%. See prospectus for any contractual or voluntary waivers; without a waiver, costs would have been higher. |
| Expenses Paid, Amount |
|
$ 99
|
| Expense Ratio, Percent |
|
0.99%
|
| Factors Affecting Performance [Text Block] |
|
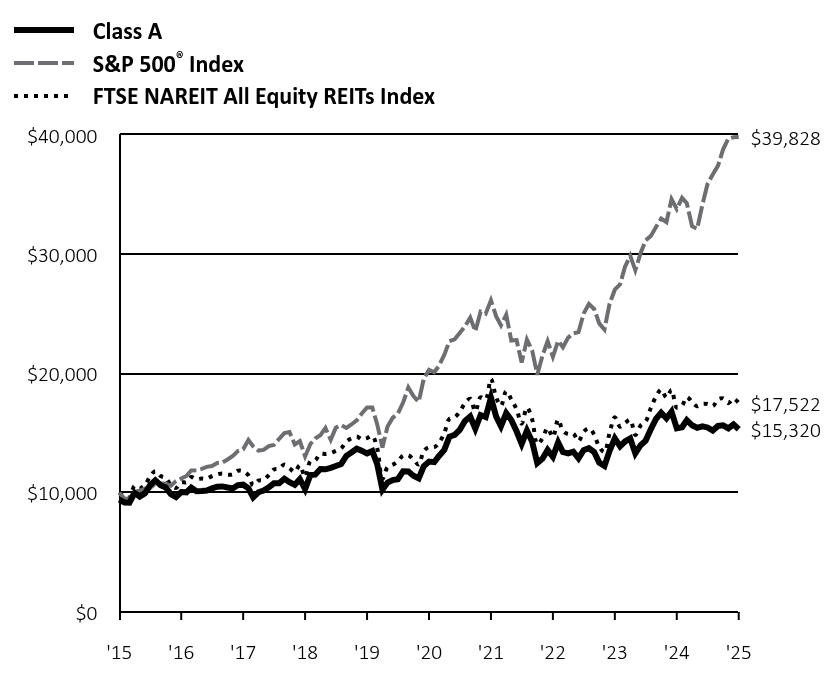
How did the Fund perform last year and what affected its performance? Class A shares of the Fund returned -0.53% (unadjusted for sales charges) for the period ended December 31, 2025. The Fund's broad-based index, the S&P 500® Index, returned 17.88% for the same period, while the Fund's additional, more narrowly based index, the FTSE NAREIT All Equity REITs Index, returned 2.27%. Individual stock selection and broader sector allocations each played a role in the Fund’s underperformance relative to the FTSE NAREIT All Equity REITs Index. With respect to the former, the Fund’s holdings lagged the corresponding index components by the widest margin in the net lease category. The shortfall was largely a result of weakness in Essential Properties Real Estate Trust, Inc. (2.3%) and Vinci Properties, Inc.* The Fund also underperformed in specialty REITs, where Iron Mountain, Inc.* was the largest detractor, and in apartments, where overweights in Avalon Bay Communities, Inc.* and Independence Realty Trust, Inc.* hurt results. On the positive side, the Fund outperformed in the lab/outpatient category thanks to an overweight in Healthcare Realty Trust, Inc. (0.9%) and a zero weighting in Alexandria Real Estate Equities, Inc., one of the worst performing stocks in the FTSE NAREIT All Equity REITs Index in 2025. The industrials category was a further area of strength, primarily due to zero weightings or underweights in several stocks that lagged. Stock selection in manufactured housing, hotels, and senior housing also contributed positively to the Fund's relative performance. In terms of allocation, the Fund was hurt by its average underweight in offices, which continued to recover from COVID-era weakness. Overweights in regional malls, apartments, and data centers, together with an underweight in net lease, further detracted from the Fund's performance. An average overweight in senior housing helped results, as did an underweight in the lab/outpatient category. Percentages in parentheses are based on the Fund’s net assets as of December 31, 2025. * Not held at December 31, 2025. |
| Performance Past Does Not Indicate Future [Text] |
|
The Fund's past performance is not a good predictor or guarantee of the Fund's future performance.
|
| Line Graph [Table Text Block] |
|
 | Class A | S&P 500® Index | FTSE NAREIT All Equity REITs Index |
|---|
'15 | $9,425 | $10,000 | $10,000 |
|---|
'16 | $9,185 | $9,504 | $9,648 |
|---|
'16 | $9,163 | $9,491 | $9,607 |
|---|
'16 | $9,994 | $10,135 | $10,584 |
|---|
'16 | $9,677 | $10,174 | $10,392 |
|---|
'16 | $9,954 | $10,357 | $10,632 |
|---|
'16 | $10,632 | $10,384 | $11,368 |
|---|
'16 | $11,036 | $10,766 | $11,810 |
|---|
'16 | $10,623 | $10,782 | $11,400 |
|---|
'16 | $10,450 | $10,784 | $11,231 |
|---|
'16 | $9,881 | $10,587 | $10,657 |
|---|
'16 | $9,633 | $10,979 | $10,399 |
|---|
'16 | $10,062 | $11,196 | $10,863 |
|---|
'17 | $10,032 | $11,408 | $10,881 |
|---|
'17 | $10,422 | $11,861 | $11,318 |
|---|
'17 | $10,131 | $11,875 | $11,140 |
|---|
'17 | $10,146 | $11,997 | $11,188 |
|---|
'17 | $10,192 | $12,166 | $11,174 |
|---|
'17 | $10,371 | $12,242 | $11,393 |
|---|
'17 | $10,508 | $12,494 | $11,537 |
|---|
'17 | $10,528 | $12,532 | $11,611 |
|---|
'17 | $10,436 | $12,790 | $11,519 |
|---|
'17 | $10,360 | $13,089 | $11,534 |
|---|
'17 | $10,643 | $13,490 | $11,840 |
|---|
'17 | $10,676 | $13,640 | $11,805 |
|---|
'18 | $10,373 | $14,421 | $11,457 |
|---|
'18 | $9,619 | $13,890 | $10,624 |
|---|
'18 | $10,038 | $13,537 | $11,019 |
|---|
'18 | $10,191 | $13,589 | $11,076 |
|---|
'18 | $10,459 | $13,916 | $11,475 |
|---|
'18 | $10,793 | $14,002 | $11,955 |
|---|
'18 | $10,793 | $14,523 | $12,028 |
|---|
'18 | $11,170 | $14,996 | $12,362 |
|---|
'18 | $10,885 | $15,081 | $12,059 |
|---|
'18 | $10,667 | $14,050 | $11,740 |
|---|
'18 | $11,136 | $14,337 | $12,298 |
|---|
'18 | $10,304 | $13,042 | $11,328 |
|---|
'19 | $11,481 | $14,087 | $12,639 |
|---|
'19 | $11,514 | $14,540 | $12,708 |
|---|
'19 | $11,987 | $14,822 | $13,273 |
|---|
'19 | $11,965 | $15,422 | $13,242 |
|---|
'19 | $12,091 | $14,442 | $13,328 |
|---|
'19 | $12,241 | $15,460 | $13,511 |
|---|
'19 | $12,401 | $15,682 | $13,719 |
|---|
'19 | $13,095 | $15,434 | $14,287 |
|---|
'19 | $13,373 | $15,723 | $14,555 |
|---|
'19 | $13,694 | $16,063 | $14,713 |
|---|
'19 | $13,512 | $16,646 | $14,486 |
|---|
'19 | $13,303 | $17,149 | $14,575 |
|---|
'20 | $13,492 | $17,142 | $14,759 |
|---|
'20 | $12,393 | $15,731 | $13,722 |
|---|
'20 | $10,256 | $13,788 | $11,158 |
|---|
'20 | $10,853 | $15,556 | $12,143 |
|---|
'20 | $11,060 | $16,296 | $12,351 |
|---|
'20 | $11,135 | $16,620 | $12,636 |
|---|
'20 | $11,793 | $17,558 | $13,119 |
|---|
'20 | $11,775 | $18,820 | $13,136 |
|---|
'20 | $11,422 | $18,105 | $12,787 |
|---|
'20 | $11,209 | $17,623 | $12,358 |
|---|
'20 | $12,223 | $19,552 | $13,497 |
|---|
'20 | $12,612 | $20,304 | $13,828 |
|---|
'21 | $12,563 | $20,099 | $13,818 |
|---|
'21 | $13,081 | $20,653 | $14,194 |
|---|
'21 | $13,590 | $21,558 | $14,979 |
|---|
'21 | $14,689 | $22,708 | $16,195 |
|---|
'21 | $14,853 | $22,867 | $16,328 |
|---|
'21 | $15,272 | $23,401 | $16,780 |
|---|
'21 | $16,013 | $23,957 | $17,513 |
|---|
'21 | $16,387 | $24,685 | $17,878 |
|---|
'21 | $15,366 | $23,537 | $16,819 |
|---|
'21 | $16,514 | $25,186 | $18,009 |
|---|
'21 | $16,343 | $25,011 | $17,827 |
|---|
'21 | $17,975 | $26,132 | $19,539 |
|---|
'22 | $16,373 | $24,780 | $17,989 |
|---|
'22 | $15,585 | $24,038 | $17,289 |
|---|
'22 | $16,678 | $24,931 | $18,511 |
|---|
'22 | $16,099 | $22,757 | $17,834 |
|---|
'22 | $15,151 | $22,798 | $16,999 |
|---|
'22 | $14,089 | $20,917 | $15,792 |
|---|
'22 | $15,210 | $22,845 | $17,142 |
|---|
'22 | $14,271 | $21,913 | $16,134 |
|---|
'22 | $12,483 | $19,895 | $14,082 |
|---|
'22 | $12,863 | $21,506 | $14,558 |
|---|
'22 | $13,589 | $22,708 | $15,431 |
|---|
'22 | $13,009 | $21,400 | $14,664 |
|---|
'23 | $14,215 | $22,744 | $16,141 |
|---|
'23 | $13,411 | $22,189 | $15,184 |
|---|
'23 | $13,295 | $23,004 | $14,920 |
|---|
'23 | $13,438 | $23,363 | $14,964 |
|---|
'23 | $12,878 | $23,464 | $14,332 |
|---|
'23 | $13,561 | $25,015 | $15,100 |
|---|
'23 | $13,732 | $25,819 | $15,402 |
|---|
'23 | $13,410 | $25,407 | $14,889 |
|---|
'23 | $12,521 | $24,196 | $13,841 |
|---|
'23 | $12,252 | $23,687 | $13,410 |
|---|
'23 | $13,507 | $25,851 | $15,000 |
|---|
'23 | $14,558 | $27,025 | $16,330 |
|---|
'24 | $13,893 | $27,479 | $15,536 |
|---|
'24 | $14,295 | $28,946 | $15,835 |
|---|
'24 | $14,555 | $29,878 | $16,116 |
|---|
'24 | $13,295 | $28,657 | $14,841 |
|---|
'24 | $13,984 | $30,078 | $15,626 |
|---|
'24 | $14,371 | $31,158 | $15,972 |
|---|
'24 | $15,343 | $31,537 | $17,118 |
|---|
'24 | $16,203 | $32,302 | $18,081 |
|---|
'24 | $16,706 | $32,992 | $18,654 |
|---|
'24 | $16,242 | $32,693 | $17,980 |
|---|
'24 | $16,797 | $34,612 | $18,623 |
|---|
'24 | $15,401 | $33,787 | $17,133 |
|---|
'25 | $15,493 | $34,727 | $17,309 |
|---|
'25 | $16,089 | $34,274 | $18,030 |
|---|
'25 | $15,652 | $32,343 | $17,605 |
|---|
'25 | $15,446 | $32,124 | $17,256 |
|---|
'25 | $15,574 | $34,146 | $17,455 |
|---|
'25 | $15,474 | $35,882 | $17,441 |
|---|
'25 | $15,209 | $36,688 | $17,252 |
|---|
'25 | $15,602 | $37,431 | $17,829 |
|---|
'25 | $15,650 | $38,797 | $17,907 |
|---|
'25 | $15,398 | $39,706 | $17,512 |
|---|
'25 | $15,729 | $39,803 | $17,905 |
|---|
'25 | $15,320 | $39,828 | $17,522 |
|---|
|
| Average Annual Return [Table Text Block] |
|
Class/Index
| 1-Year | 5-Year | 10-Year |
|---|
Class A Unadjusted for Sales Charge | -0.53% | 3.97% | 4.98% |
|---|
Class A Adjusted for the Maximum Sales Charge (max 5.75% load) | -6.25% | 2.74% | 4.36% |
|---|
S&P 500® Index | 17.88% | 14.42% | 14.82% |
|---|
FTSE NAREIT All Equity REITs Index | 2.27% | 4.85% | 5.77% |
|---|
|
| No Deduction of Taxes [Text Block] |
|
The performance graph and returns table do not reflect the deduction of taxes that a shareholder would pay on Fund distributions or the redemption of Fund shares.
|
| Material Change Date |
Jan. 01, 2025
|
|
| AssetsNet |
|
$ 935,017,923
|
| Holdings Count | Holding |
|
37
|
| Advisory Fees Paid, Amount |
|
$ 4,080,213
|
| InvestmentCompanyPortfolioTurnover |
|
100.00%
|
| Additional Fund Statistics [Text Block] |
|
Net Assets ($) | 935,017,923 |
|---|
Number of Portfolio Holdings | 37 |
|---|
Portfolio Turnover Rate (%) | 100 |
|---|
Total Net Advisory Fees Paid ($) | 4,080,213 |
|---|
|
| Holdings [Text Block] |
|
Asset Type | % of Net Assets |
|---|
Common Stocks | 99% |
|---|
Cash Equivalents | 1% |
|---|
Other Assets and Liabilities, Net | 0% |
|---|
Total | 100% |
|---|
Sector | % of Net Assets |
|---|
Specialized REITs | 31% |
|---|
Health Care REITs | 18% |
|---|
Retail REITs | 17% |
|---|
Industrial REITs | 13% |
|---|
Residential REITs | 12% |
|---|
Hotel & Resort REITs | 3% |
|---|
Diversified REITs | 3% |
|---|
Office REITs | 2% |
|---|
Ten Largest Equity HoldingsHoldings | 54.8% of Net Assets |
|---|
Prologis, Inc. | 9.7% | Welltower, Inc. | 8.6% | Simon Property Group, Inc. | 6.0% | Equinix, Inc. | 5.9% | SBA Communications Corp. | 5.2% | Crown Castle, Inc. | 4.8% | Realty Income Corp. | 3.9% | Equity Residential | 3.7% | Ventas, Inc. | 3.6% | Extra Space Storage, Inc. | 3.4% |
|
| Material Fund Change [Text Block] |
|
This is a summary of certain changes of the Fund since January 1, 2025. For more information, review the Fund's current prospectus at dws.com/mutualreports, or call (800) 728-3337. Effective October 1, 2025, the Fund’s contractual cap on total annual operating expense for Class A shares changed from 1.24% to 1.20%. The cap excludes certain expenses such as extraordinary expenses, taxes, brokerage, interest expense and acquired fund fees and expenses. |
| Material Fund Change Expenses [Text Block] |
|
Effective October 1, 2025, the Fund’s contractual cap on total annual operating expense for Class A shares changed from 1.24% to 1.20%. The cap excludes certain expenses such as extraordinary expenses, taxes, brokerage, interest expense and acquired fund fees and expenses.
|
| Summary of Change Legend [Text Block] |
|
This is a summary of certain changes of the Fund since January 1, 2025. For more information, review the Fund's current prospectus at dws.com/mutualreports, or call (800) 728-3337.
|
| C000099787 |
|
|
| Shareholder Report [Line Items] |
|
|
| Fund Name |
|
DWS RREEF Real Estate Securities Fund
|
| Class Name |
|
Class C
|
| Trading Symbol |
|
RRRCX
|
| Annual or Semi-Annual Statement [Text Block] |
|
This annual shareholder report contains important information about DWS RREEF Real Estate Securities Fund (the "Fund") for the period January 1, 2025 to December 31, 2025.
|
| Additional Information [Text Block] |
|
You can find additional information about the Fund on the Fund's website at dws.com/mutualreports. You can also request this information by contacting us at (800) 728-3337.
|
| Material Fund Change Notice [Text Block] |
|
This report describes changes to the Fund that occurred during the reporting period.
|
| Additional Information Phone Number |
|
(800) 728-3337
|
| Additional Information Website |
|
<span style="box-sizing: border-box; color: rgb(0, 0, 0); display: inline; flex-wrap: nowrap; font-size: 14.6667px; font-weight: 300; grid-area: auto; line-height: 17.6px; margin: 0px; overflow: visible; text-align: left; text-align-last: auto; white-space-collapse: preserve-breaks;">dws.com/mutualreports</span>
|
| Expenses [Text Block] |
|
What were the Fund costs for the last year?(Based on a hypothetical $10,000 investment) Fund | Costs of a $10,000 investment | Costs paid as a percentage of a $10,000 investment |
|---|
Class C | $170 | 1.71% |
|---|
Gross expense ratio as of the latest prospectus: 1.73%. See prospectus for any contractual or voluntary waivers; without a waiver, costs would have been higher. |
| Expenses Paid, Amount |
|
$ 170
|
| Expense Ratio, Percent |
|
1.71%
|
| Factors Affecting Performance [Text Block] |
|
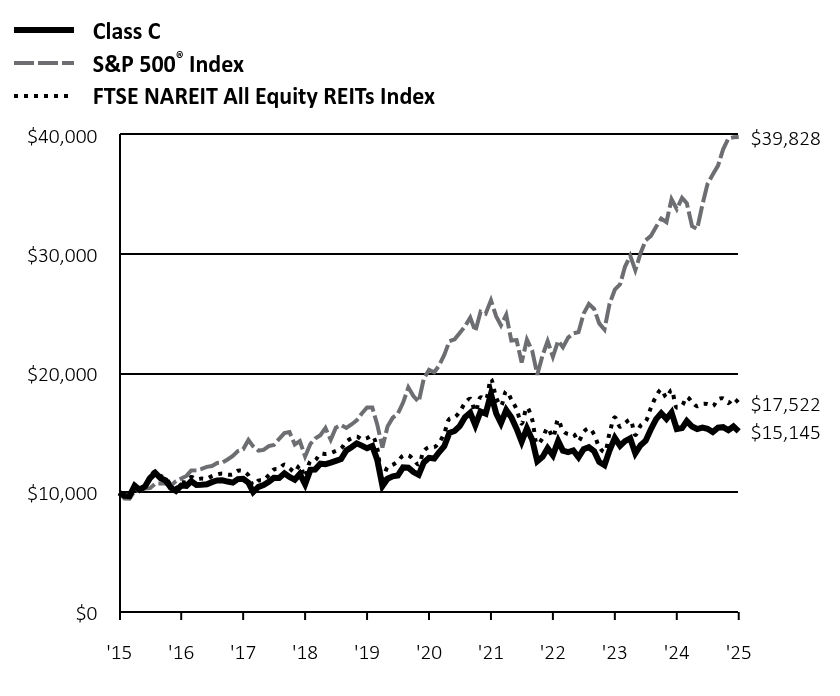
How did the Fund perform last year and what affected its performance? Class C shares of the Fund returned -1.23% (unadjusted for sales charges) for the period ended December 31, 2025. The Fund's broad-based index, the S&P 500® Index, returned 17.88% for the same period, while the Fund's additional, more narrowly based index, the FTSE NAREIT All Equity REITs Index, returned 2.27%. Individual stock selection and broader sector allocations each played a role in the Fund’s underperformance relative to the FTSE NAREIT All Equity REITs Index. With respect to the former, the Fund’s holdings lagged the corresponding index components by the widest margin in the net lease category. The shortfall was largely a result of weakness in Essential Properties Real Estate Trust, Inc. (2.3%) and Vinci Properties, Inc.* The Fund also underperformed in specialty REITs, where Iron Mountain, Inc.* was the largest detractor, and in apartments, where overweights in Avalon Bay Communities, Inc.* and Independence Realty Trust, Inc.* hurt results. On the positive side, the Fund outperformed in the lab/outpatient category thanks to an overweight in Healthcare Realty Trust, Inc. (0.9%) and a zero weighting in Alexandria Real Estate Equities, Inc., one of the worst performing stocks in the FTSE NAREIT All Equity REITs Index in 2025. The industrials category was a further area of strength, primarily due to zero weightings or underweights in several stocks that lagged. Stock selection in manufactured housing, hotels, and senior housing also contributed positively to the Fund's relative performance. In terms of allocation, the Fund was hurt by its average underweight in offices, which continued to recover from COVID-era weakness. Overweights in regional malls, apartments, and data centers, together with an underweight in net lease, further detracted from the Fund's performance. An average overweight in senior housing helped results, as did an underweight in the lab/outpatient category. Percentages in parentheses are based on the Fund’s net assets as of December 31, 2025. * Not held at December 31, 2025. |
| Performance Past Does Not Indicate Future [Text] |
|
The Fund's past performance is not a good predictor or guarantee of the Fund's future performance.
|
| Line Graph [Table Text Block] |
|
 | Class C | S&P 500® Index | FTSE NAREIT All Equity REITs Index |
|---|
'15 | $10,000 | $10,000 | $10,000 |
|---|
'16 | $9,734 | $9,504 | $9,648 |
|---|
'16 | $9,711 | $9,491 | $9,607 |
|---|
'16 | $10,584 | $10,135 | $10,584 |
|---|
'16 | $10,243 | $10,174 | $10,392 |
|---|
'16 | $10,528 | $10,357 | $10,632 |
|---|
'16 | $11,238 | $10,384 | $11,368 |
|---|
'16 | $11,661 | $10,766 | $11,810 |
|---|
'16 | $11,219 | $10,782 | $11,400 |
|---|
'16 | $11,029 | $10,784 | $11,231 |
|---|
'16 | $10,422 | $10,587 | $10,657 |
|---|
'16 | $10,158 | $10,979 | $10,399 |
|---|
'16 | $10,598 | $11,196 | $10,863 |
|---|
'17 | $10,566 | $11,408 | $10,881 |
|---|
'17 | $10,967 | $11,861 | $11,318 |
|---|
'17 | $10,653 | $11,875 | $11,140 |
|---|
'17 | $10,669 | $11,997 | $11,188 |
|---|
'17 | $10,710 | $12,166 | $11,174 |
|---|
'17 | $10,890 | $12,242 | $11,393 |
|---|
'17 | $11,026 | $12,494 | $11,537 |
|---|
'17 | $11,041 | $12,532 | $11,611 |
|---|
'17 | $10,938 | $12,790 | $11,519 |
|---|
'17 | $10,848 | $13,089 | $11,534 |
|---|
'17 | $11,142 | $13,490 | $11,840 |
|---|
'17 | $11,173 | $13,640 | $11,805 |
|---|
'18 | $10,848 | $14,421 | $11,457 |
|---|
'18 | $10,053 | $13,890 | $10,624 |
|---|
'18 | $10,485 | $13,537 | $11,019 |
|---|
'18 | $10,642 | $13,589 | $11,076 |
|---|
'18 | $10,908 | $13,916 | $11,475 |
|---|
'18 | $11,250 | $14,002 | $11,955 |
|---|
'18 | $11,245 | $14,523 | $12,028 |
|---|
'18 | $11,633 | $14,996 | $12,362 |
|---|
'18 | $11,332 | $15,081 | $12,059 |
|---|
'18 | $11,096 | $14,050 | $11,740 |
|---|
'18 | $11,578 | $14,337 | $12,298 |
|---|
'18 | $10,705 | $13,042 | $11,328 |
|---|
'19 | $11,918 | $14,087 | $12,639 |
|---|
'19 | $11,946 | $14,540 | $12,708 |
|---|
'19 | $12,433 | $14,822 | $13,273 |
|---|
'19 | $12,399 | $15,422 | $13,242 |
|---|
'19 | $12,528 | $14,442 | $13,328 |
|---|
'19 | $12,676 | $15,460 | $13,511 |
|---|
'19 | $12,828 | $15,682 | $13,719 |
|---|
'19 | $13,543 | $15,434 | $14,287 |
|---|
'19 | $13,821 | $15,723 | $14,555 |
|---|
'19 | $14,142 | $16,063 | $14,713 |
|---|
'19 | $13,950 | $16,646 | $14,486 |
|---|
'19 | $13,725 | $17,149 | $14,575 |
|---|
'20 | $13,911 | $17,142 | $14,759 |
|---|
'20 | $12,774 | $15,731 | $13,722 |
|---|
'20 | $10,560 | $13,788 | $11,158 |
|---|
'20 | $11,173 | $15,556 | $12,143 |
|---|
'20 | $11,377 | $16,296 | $12,351 |
|---|
'20 | $11,452 | $16,620 | $12,636 |
|---|
'20 | $12,120 | $17,558 | $13,119 |
|---|
'20 | $12,096 | $18,820 | $13,136 |
|---|
'20 | $11,729 | $18,105 | $12,787 |
|---|
'20 | $11,502 | $17,623 | $12,358 |
|---|
'20 | $12,528 | $19,552 | $13,497 |
|---|
'20 | $12,924 | $20,304 | $13,828 |
|---|
'21 | $12,863 | $20,099 | $13,818 |
|---|
'21 | $13,392 | $20,653 | $14,194 |
|---|
'21 | $13,901 | $21,558 | $14,979 |
|---|
'21 | $15,016 | $22,708 | $16,195 |
|---|
'21 | $15,176 | $22,867 | $16,328 |
|---|
'21 | $15,591 | $23,401 | $16,780 |
|---|
'21 | $16,337 | $23,957 | $17,513 |
|---|
'21 | $16,707 | $24,685 | $17,878 |
|---|
'21 | $15,657 | $23,537 | $16,819 |
|---|
'21 | $16,817 | $25,186 | $18,009 |
|---|
'21 | $16,632 | $25,011 | $17,827 |
|---|
'21 | $18,283 | $26,132 | $19,539 |
|---|
'22 | $16,644 | $24,780 | $17,989 |
|---|
'22 | $15,834 | $24,038 | $17,289 |
|---|
'22 | $16,933 | $24,931 | $18,511 |
|---|
'22 | $16,334 | $22,757 | $17,834 |
|---|
'22 | $15,367 | $22,798 | $16,999 |
|---|
'22 | $14,279 | $20,917 | $15,792 |
|---|
'22 | $15,405 | $22,845 | $17,142 |
|---|
'22 | $14,454 | $21,913 | $16,134 |
|---|
'22 | $12,633 | $19,895 | $14,082 |
|---|
'22 | $13,005 | $21,506 | $14,558 |
|---|
'22 | $13,735 | $22,708 | $15,431 |
|---|
'22 | $13,141 | $21,400 | $14,664 |
|---|
'23 | $14,348 | $22,744 | $16,141 |
|---|
'23 | $13,528 | $22,189 | $15,184 |
|---|
'23 | $13,410 | $23,004 | $14,920 |
|---|
'23 | $13,546 | $23,363 | $14,964 |
|---|
'23 | $12,969 | $23,464 | $14,332 |
|---|
'23 | $13,651 | $25,015 | $15,100 |
|---|
'23 | $13,814 | $25,819 | $15,402 |
|---|
'23 | $13,481 | $25,407 | $14,889 |
|---|
'23 | $12,577 | $24,196 | $13,841 |
|---|
'23 | $12,304 | $23,687 | $13,410 |
|---|
'23 | $13,553 | $25,851 | $15,000 |
|---|
'23 | $14,601 | $27,025 | $16,330 |
|---|
'24 | $13,924 | $27,479 | $15,536 |
|---|
'24 | $14,321 | $28,946 | $15,835 |
|---|
'24 | $14,566 | $29,878 | $16,116 |
|---|
'24 | $13,303 | $28,657 | $14,841 |
|---|
'24 | $13,983 | $30,078 | $15,626 |
|---|
'24 | $14,360 | $31,158 | $15,972 |
|---|
'24 | $15,324 | $31,537 | $17,118 |
|---|
'24 | $16,171 | $32,302 | $18,081 |
|---|
'24 | $16,664 | $32,992 | $18,654 |
|---|
'24 | $16,195 | $32,693 | $17,980 |
|---|
'24 | $16,733 | $34,612 | $18,623 |
|---|
'24 | $15,334 | $33,787 | $17,133 |
|---|
'25 | $15,417 | $34,727 | $17,309 |
|---|
'25 | $16,008 | $34,274 | $18,030 |
|---|
'25 | $15,556 | $32,343 | $17,605 |
|---|
'25 | $15,340 | $32,124 | $17,256 |
|---|
'25 | $15,465 | $34,146 | $17,455 |
|---|
'25 | $15,360 | $35,882 | $17,441 |
|---|
'25 | $15,080 | $36,688 | $17,252 |
|---|
'25 | $15,458 | $37,431 | $17,829 |
|---|
'25 | $15,499 | $38,797 | $17,907 |
|---|
'25 | $15,239 | $39,706 | $17,512 |
|---|
'25 | $15,555 | $39,803 | $17,905 |
|---|
'25 | $15,145 | $39,828 | $17,522 |
|---|
|
| Average Annual Return [Table Text Block] |
|
Class/Index
| 1-Year | 5-Year | 10-Year |
|---|
Class C Unadjusted for Sales Charge | -1.23% | 3.22% | 4.24% |
|---|
Class C Adjusted for the Maximum Sales Charge (max 1.00% CDSC) | -2.21% | 3.22% | 4.24% |
|---|
S&P 500® Index | 17.88% | 14.42% | 14.82% |
|---|
FTSE NAREIT All Equity REITs Index | 2.27% | 4.85% | 5.77% |
|---|
|
| No Deduction of Taxes [Text Block] |
|
The performance graph and returns table do not reflect the deduction of taxes that a shareholder would pay on Fund distributions or the redemption of Fund shares.
|
| Material Change Date |
Jan. 01, 2025
|
|
| AssetsNet |
|
$ 935,017,923
|
| Holdings Count | Holding |
|
37
|
| Advisory Fees Paid, Amount |
|
$ 4,080,213
|
| InvestmentCompanyPortfolioTurnover |
|
100.00%
|
| Additional Fund Statistics [Text Block] |
|
Net Assets ($) | 935,017,923 |
|---|
Number of Portfolio Holdings | 37 |
|---|
Portfolio Turnover Rate (%) | 100 |
|---|
Total Net Advisory Fees Paid ($) | 4,080,213 |
|---|
|
| Holdings [Text Block] |
|
Asset Type | % of Net Assets |
|---|
Common Stocks | 99% |
|---|
Cash Equivalents | 1% |
|---|
Other Assets and Liabilities, Net | 0% |
|---|
Total | 100% |
|---|
Sector | % of Net Assets |
|---|
Specialized REITs | 31% |
|---|
Health Care REITs | 18% |
|---|
Retail REITs | 17% |
|---|
Industrial REITs | 13% |
|---|
Residential REITs | 12% |
|---|
Hotel & Resort REITs | 3% |
|---|
Diversified REITs | 3% |
|---|
Office REITs | 2% |
|---|
Ten Largest Equity HoldingsHoldings | 54.8% of Net Assets |
|---|
Prologis, Inc. | 9.7% | Welltower, Inc. | 8.6% | Simon Property Group, Inc. | 6.0% | Equinix, Inc. | 5.9% | SBA Communications Corp. | 5.2% | Crown Castle, Inc. | 4.8% | Realty Income Corp. | 3.9% | Equity Residential | 3.7% | Ventas, Inc. | 3.6% | Extra Space Storage, Inc. | 3.4% |
|
| Material Fund Change [Text Block] |
|
This is a summary of certain changes of the Fund since January 1, 2025. For more information, review the Fund's current prospectus at dws.com/mutualreports, or call (800) 728-3337. Effective October 1, 2025, the Fund’s contractual cap on total annual operating expense for Class C shares changed from 1.99% to 1.95%. The cap excludes certain expenses such as extraordinary expenses, taxes, brokerage, interest expense and acquired fund fees and expenses. |
| Material Fund Change Expenses [Text Block] |
|
Effective October 1, 2025, the Fund’s contractual cap on total annual operating expense for Class C shares changed from 1.99% to 1.95%. The cap excludes certain expenses such as extraordinary expenses, taxes, brokerage, interest expense and acquired fund fees and expenses.
|
| Summary of Change Legend [Text Block] |
|
This is a summary of certain changes of the Fund since January 1, 2025. For more information, review the Fund's current prospectus at dws.com/mutualreports, or call (800) 728-3337.
|
| C000099788 |
|
|
| Shareholder Report [Line Items] |
|
|
| Fund Name |
|
DWS RREEF Real Estate Securities Fund
|
| Class Name |
|
Class R
|
| Trading Symbol |
|
RRRSX
|
| Annual or Semi-Annual Statement [Text Block] |
|
This annual shareholder report contains important information about DWS RREEF Real Estate Securities Fund (the "Fund") for the period January 1, 2025 to December 31, 2025.
|
| Additional Information [Text Block] |
|
You can find additional information about the Fund on the Fund's website at dws.com/mutualreports. You can also request this information by contacting us at (800) 728-3337.
|
| Material Fund Change Notice [Text Block] |
|
This report describes changes to the Fund that occurred during the reporting period.
|
| Additional Information Phone Number |
|
(800) 728-3337
|
| Additional Information Website |
|
<span style="box-sizing: border-box; color: rgb(0, 0, 0); display: inline; flex-wrap: nowrap; font-size: 14.6667px; font-weight: 300; grid-area: auto; line-height: 17.6px; margin: 0px; overflow: visible; text-align: left; text-align-last: auto; white-space-collapse: preserve-breaks;">dws.com/mutualreports</span>
|
| Expenses [Text Block] |
|
What were the Fund costs for the last year?(Based on a hypothetical $10,000 investment) Fund | Costs of a $10,000 investment | Costs paid as a percentage of a $10,000 investment |
|---|
Class R | $129 | 1.30% |
|---|
Gross expense ratio as of the latest prospectus: 1.30%. See prospectus for any contractual or voluntary waivers; without a waiver, costs would have been higher. |
| Expenses Paid, Amount |
|
$ 129
|
| Expense Ratio, Percent |
|
1.30%
|
| Factors Affecting Performance [Text Block] |
|
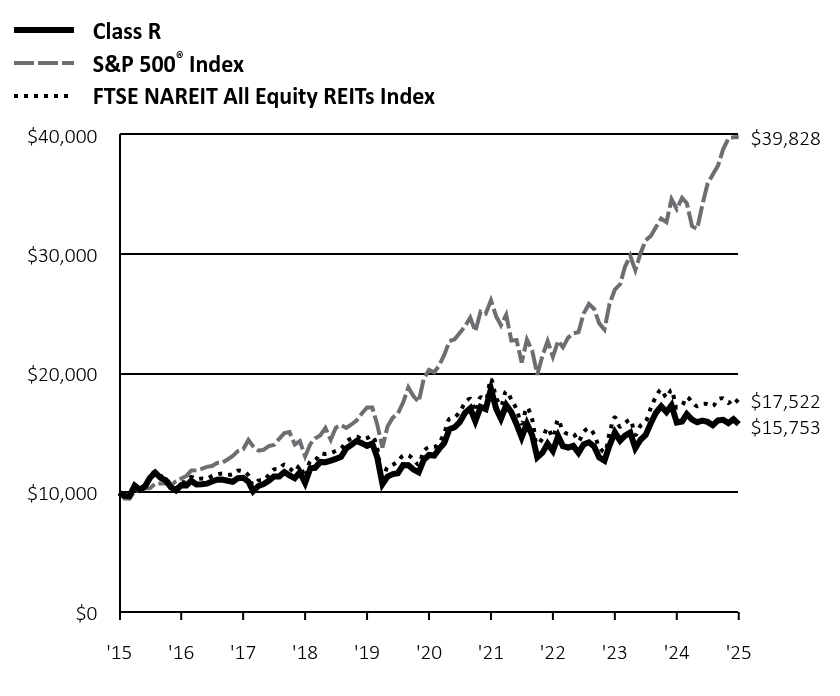
How did the Fund perform last year and what affected its performance? Class R shares of the Fund returned -0.86% for the period ended December 31, 2025. The Fund's broad-based index, the S&P 500® Index, returned 17.88% for the same period, while the Fund's additional, more narrowly based index, the FTSE NAREIT All Equity REITs Index, returned 2.27%. Individual stock selection and broader sector allocations each played a role in the Fund’s underperformance relative to the FTSE NAREIT All Equity REITs Index. With respect to the former, the Fund’s holdings lagged the corresponding index components by the widest margin in the net lease category. The shortfall was largely a result of weakness in Essential Properties Real Estate Trust, Inc. (2.3%) and Vinci Properties, Inc.* The Fund also underperformed in specialty REITs, where Iron Mountain, Inc.* was the largest detractor, and in apartments, where overweights in Avalon Bay Communities, Inc.* and Independence Realty Trust, Inc.* hurt results. On the positive side, the Fund outperformed in the lab/outpatient category thanks to an overweight in Healthcare Realty Trust, Inc. (0.9%) and a zero weighting in Alexandria Real Estate Equities, Inc., one of the worst performing stocks in the FTSE NAREIT All Equity REITs Index in 2025. The industrials category was a further area of strength, primarily due to zero weightings or underweights in several stocks that lagged. Stock selection in manufactured housing, hotels, and senior housing also contributed positively to the Fund's relative performance. In terms of allocation, the Fund was hurt by its average underweight in offices, which continued to recover from COVID-era weakness. Overweights in regional malls, apartments, and data centers, together with an underweight in net lease, further detracted from the Fund's performance. An average overweight in senior housing helped results, as did an underweight in the lab/outpatient category. Percentages in parentheses are based on the Fund’s net assets as of December 31, 2025. * Not held at December 31, 2025. |
| Performance Past Does Not Indicate Future [Text] |
|
The Fund's past performance is not a good predictor or guarantee of the Fund's future performance.
|
| Line Graph [Table Text Block] |
|
 | Class R | S&P 500® Index | FTSE NAREIT All Equity REITs Index |
|---|
'15 | $10,000 | $10,000 | $10,000 |
|---|
'16 | $9,736 | $9,504 | $9,648 |
|---|
'16 | $9,712 | $9,491 | $9,607 |
|---|
'16 | $10,590 | $10,135 | $10,584 |
|---|
'16 | $10,254 | $10,174 | $10,392 |
|---|
'16 | $10,543 | $10,357 | $10,632 |
|---|
'16 | $11,261 | $10,384 | $11,368 |
|---|
'16 | $11,685 | $10,766 | $11,810 |
|---|
'16 | $11,247 | $10,782 | $11,400 |
|---|
'16 | $11,055 | $10,784 | $11,231 |
|---|
'16 | $10,454 | $10,587 | $10,657 |
|---|
'16 | $10,191 | $10,979 | $10,399 |
|---|
'16 | $10,636 | $11,196 | $10,863 |
|---|
'17 | $10,604 | $11,408 | $10,881 |
|---|
'17 | $11,011 | $11,861 | $11,318 |
|---|
'17 | $10,701 | $11,875 | $11,140 |
|---|
'17 | $10,717 | $11,997 | $11,188 |
|---|
'17 | $10,759 | $12,166 | $11,174 |
|---|
'17 | $10,946 | $12,242 | $11,393 |
|---|
'17 | $11,089 | $12,494 | $11,537 |
|---|
'17 | $11,111 | $12,532 | $11,611 |
|---|
'17 | $11,004 | $12,790 | $11,519 |
|---|
'17 | $10,924 | $13,089 | $11,534 |
|---|
'17 | $11,223 | $13,490 | $11,840 |
|---|
'17 | $11,249 | $13,640 | $11,805 |
|---|
'18 | $10,929 | $14,421 | $11,457 |
|---|
'18 | $10,135 | $13,890 | $10,624 |
|---|
'18 | $10,568 | $13,537 | $11,019 |
|---|
'18 | $10,729 | $13,589 | $11,076 |
|---|
'18 | $11,000 | $13,916 | $11,475 |
|---|
'18 | $11,354 | $14,002 | $11,955 |
|---|
'18 | $11,354 | $14,523 | $12,028 |
|---|
'18 | $11,744 | $14,996 | $12,362 |
|---|
'18 | $11,448 | $15,081 | $12,059 |
|---|
'18 | $11,213 | $14,050 | $11,740 |
|---|
'18 | $11,706 | $14,337 | $12,298 |
|---|
'18 | $10,823 | $13,042 | $11,328 |
|---|
'19 | $12,054 | $14,087 | $12,639 |
|---|
'19 | $12,088 | $14,540 | $12,708 |
|---|
'19 | $12,582 | $14,822 | $13,273 |
|---|
'19 | $12,559 | $15,422 | $13,242 |
|---|
'19 | $12,691 | $14,442 | $13,328 |
|---|
'19 | $12,845 | $15,460 | $13,511 |
|---|
'19 | $13,006 | $15,682 | $13,719 |
|---|
'19 | $13,728 | $15,434 | $14,287 |
|---|
'19 | $14,021 | $15,723 | $14,555 |
|---|
'19 | $14,346 | $16,063 | $14,713 |
|---|
'19 | $14,155 | $16,646 | $14,486 |
|---|
'19 | $13,932 | $17,149 | $14,575 |
|---|
'20 | $14,123 | $17,142 | $14,759 |
|---|
'20 | $12,972 | $15,731 | $13,722 |
|---|
'20 | $10,727 | $13,788 | $11,158 |
|---|
'20 | $11,351 | $15,556 | $12,143 |
|---|
'20 | $11,568 | $16,296 | $12,351 |
|---|
'20 | $11,642 | $16,620 | $12,636 |
|---|
'20 | $12,325 | $17,558 | $13,119 |
|---|
'20 | $12,306 | $18,820 | $13,136 |
|---|
'20 | $11,939 | $18,105 | $12,787 |
|---|
'20 | $11,711 | $17,623 | $12,358 |
|---|
'20 | $12,763 | $19,552 | $13,497 |
|---|
'20 | $13,166 | $20,304 | $13,828 |
|---|
'21 | $13,115 | $20,099 | $13,818 |
|---|
'21 | $13,655 | $20,653 | $14,194 |
|---|
'21 | $14,176 | $21,558 | $14,979 |
|---|
'21 | $15,322 | $22,708 | $16,195 |
|---|
'21 | $15,488 | $22,867 | $16,328 |
|---|
'21 | $15,919 | $23,401 | $16,780 |
|---|
'21 | $16,692 | $23,957 | $17,513 |
|---|
'21 | $17,075 | $24,685 | $17,878 |
|---|
'21 | $16,004 | $23,537 | $16,819 |
|---|
'21 | $17,194 | $25,186 | $18,009 |
|---|
'21 | $17,015 | $25,011 | $17,827 |
|---|
'21 | $18,707 | $26,132 | $19,539 |
|---|
'22 | $17,033 | $24,780 | $17,989 |
|---|
'22 | $16,212 | $24,038 | $17,289 |
|---|
'22 | $17,344 | $24,931 | $18,511 |
|---|
'22 | $16,741 | $22,757 | $17,834 |
|---|
'22 | $15,749 | $22,798 | $16,999 |
|---|
'22 | $14,640 | $20,917 | $15,792 |
|---|
'22 | $15,805 | $22,845 | $17,142 |
|---|
'22 | $14,823 | $21,913 | $16,134 |
|---|
'22 | $12,961 | $19,895 | $14,082 |
|---|
'22 | $13,356 | $21,506 | $14,558 |
|---|
'22 | $14,110 | $22,708 | $15,431 |
|---|
'22 | $13,505 | $21,400 | $14,664 |
|---|
'23 | $14,749 | $22,744 | $16,141 |
|---|
'23 | $13,908 | $22,189 | $15,184 |
|---|
'23 | $13,791 | $23,004 | $14,920 |
|---|
'23 | $13,932 | $23,363 | $14,964 |
|---|
'23 | $13,345 | $23,464 | $14,332 |
|---|
'23 | $14,049 | $25,015 | $15,100 |
|---|
'23 | $14,227 | $25,819 | $15,402 |
|---|
'23 | $13,885 | $25,407 | $14,889 |
|---|
'23 | $12,962 | $24,196 | $13,841 |
|---|
'23 | $12,683 | $23,687 | $13,410 |
|---|
'23 | $13,975 | $25,851 | $15,000 |
|---|
'23 | $15,065 | $27,025 | $16,330 |
|---|
'24 | $14,363 | $27,479 | $15,536 |
|---|
'24 | $14,786 | $28,946 | $15,835 |
|---|
'24 | $15,043 | $29,878 | $16,116 |
|---|
'24 | $13,741 | $28,657 | $14,841 |
|---|
'24 | $14,446 | $30,078 | $15,626 |
|---|
'24 | $14,849 | $31,158 | $15,972 |
|---|
'24 | $15,846 | $31,537 | $17,118 |
|---|
'24 | $16,727 | $32,302 | $18,081 |
|---|
'24 | $17,248 | $32,992 | $18,654 |
|---|
'24 | $16,763 | $32,693 | $17,980 |
|---|
'24 | $17,335 | $34,612 | $18,623 |
|---|
'24 | $15,889 | $33,787 | $17,133 |
|---|
'25 | $15,977 | $34,727 | $17,309 |
|---|
'25 | $16,592 | $34,274 | $18,030 |
|---|
'25 | $16,134 | $32,343 | $17,605 |
|---|
'25 | $15,913 | $32,124 | $17,256 |
|---|
'25 | $16,046 | $34,146 | $17,455 |
|---|
'25 | $15,939 | $35,882 | $17,441 |
|---|
'25 | $15,659 | $36,688 | $17,252 |
|---|
'25 | $16,064 | $37,431 | $17,829 |
|---|
'25 | $16,108 | $38,797 | $17,907 |
|---|
'25 | $15,841 | $39,706 | $17,512 |
|---|
'25 | $16,175 | $39,803 | $17,905 |
|---|
'25 | $15,753 | $39,828 | $17,522 |
|---|
|
| Average Annual Return [Table Text Block] |
|
Class/Index
| 1-Year | 5-Year | 10-Year |
|---|
Class R No Sales Charge | -0.86% | 3.65% | 4.65% |
|---|
S&P 500® Index | 17.88% | 14.42% | 14.82% |
|---|
FTSE NAREIT All Equity REITs Index | 2.27% | 4.85% | 5.77% |
|---|
|
| No Deduction of Taxes [Text Block] |
|
The performance graph and returns table do not reflect the deduction of taxes that a shareholder would pay on Fund distributions or the redemption of Fund shares.
|
| Material Change Date |
Jan. 01, 2025
|
|
| AssetsNet |
|
$ 935,017,923
|
| Holdings Count | Holding |
|
37
|
| Advisory Fees Paid, Amount |
|
$ 4,080,213
|
| InvestmentCompanyPortfolioTurnover |
|
100.00%
|
| Additional Fund Statistics [Text Block] |
|
Net Assets ($) | 935,017,923 |
|---|
Number of Portfolio Holdings | 37 |
|---|
Portfolio Turnover Rate (%) | 100 |
|---|
Total Net Advisory Fees Paid ($) | 4,080,213 |
|---|
|
| Holdings [Text Block] |
|
Asset Type | % of Net Assets |
|---|
Common Stocks | 99% |
|---|
Cash Equivalents | 1% |
|---|
Other Assets and Liabilities, Net | 0% |
|---|
Total | 100% |
|---|
Sector | % of Net Assets |
|---|
Specialized REITs | 31% |
|---|
Health Care REITs | 18% |
|---|
Retail REITs | 17% |
|---|
Industrial REITs | 13% |
|---|
Residential REITs | 12% |
|---|
Hotel & Resort REITs | 3% |
|---|
Diversified REITs | 3% |
|---|
Office REITs | 2% |
|---|
Ten Largest Equity HoldingsHoldings | 54.8% of Net Assets |
|---|
Prologis, Inc. | 9.7% | Welltower, Inc. | 8.6% | Simon Property Group, Inc. | 6.0% | Equinix, Inc. | 5.9% | SBA Communications Corp. | 5.2% | Crown Castle, Inc. | 4.8% | Realty Income Corp. | 3.9% | Equity Residential | 3.7% | Ventas, Inc. | 3.6% | Extra Space Storage, Inc. | 3.4% |
|
| Material Fund Change [Text Block] |
|
This is a summary of certain changes of the Fund since January 1, 2025. For more information, review the Fund's current prospectus at dws.com/mutualreports, or call (800) 728-3337. Effective October 1, 2025, the Fund’s contractual cap on total annual operating expense for Class R shares changed from 1.49% to 1.45%. The cap excludes certain expenses such as extraordinary expenses, taxes, brokerage, interest expense and acquired fund fees and expenses. |
| Material Fund Change Expenses [Text Block] |
|
Effective October 1, 2025, the Fund’s contractual cap on total annual operating expense for Class R shares changed from 1.49% to 1.45%. The cap excludes certain expenses such as extraordinary expenses, taxes, brokerage, interest expense and acquired fund fees and expenses.
|
| Summary of Change Legend [Text Block] |
|
This is a summary of certain changes of the Fund since January 1, 2025. For more information, review the Fund's current prospectus at dws.com/mutualreports, or call (800) 728-3337.
|
| C000148175 |
|
|
| Shareholder Report [Line Items] |
|
|
| Fund Name |
|
DWS RREEF Real Estate Securities Fund
|
| Class Name |
|
Class R6
|
| Trading Symbol |
|
RRRZX
|
| Annual or Semi-Annual Statement [Text Block] |
|
This annual shareholder report contains important information about DWS RREEF Real Estate Securities Fund (the "Fund") for the period January 1, 2025 to December 31, 2025.
|
| Additional Information [Text Block] |
|
You can find additional information about the Fund on the Fund's website at dws.com/mutualreports. You can also request this information by contacting us at (800) 728-3337.
|
| Material Fund Change Notice [Text Block] |
|
This report describes changes to the Fund that occurred during the reporting period.
|
| Additional Information Phone Number |
|
(800) 728-3337
|
| Additional Information Website |
|
<span style="box-sizing: border-box; color: rgb(0, 0, 0); display: inline; flex-wrap: nowrap; font-size: 14.6667px; font-weight: 300; grid-area: auto; line-height: 17.6px; margin: 0px; overflow: visible; text-align: left; text-align-last: auto; white-space-collapse: preserve-breaks;">dws.com/mutualreports</span>
|
| Expenses [Text Block] |
|
What were the Fund costs for the last year?(Based on a hypothetical $10,000 investment) Fund | Costs of a $10,000 investment | Costs paid as a percentage of a $10,000 investment |
|---|
Class R6 | $54 | 0.54% |
|---|
Gross expense ratio as of the latest prospectus: 0.54%. See prospectus for any contractual or voluntary waivers; without a waiver, costs would have been higher. |
| Expenses Paid, Amount |
|
$ 54
|
| Expense Ratio, Percent |
|
0.54%
|
| Factors Affecting Performance [Text Block] |
|
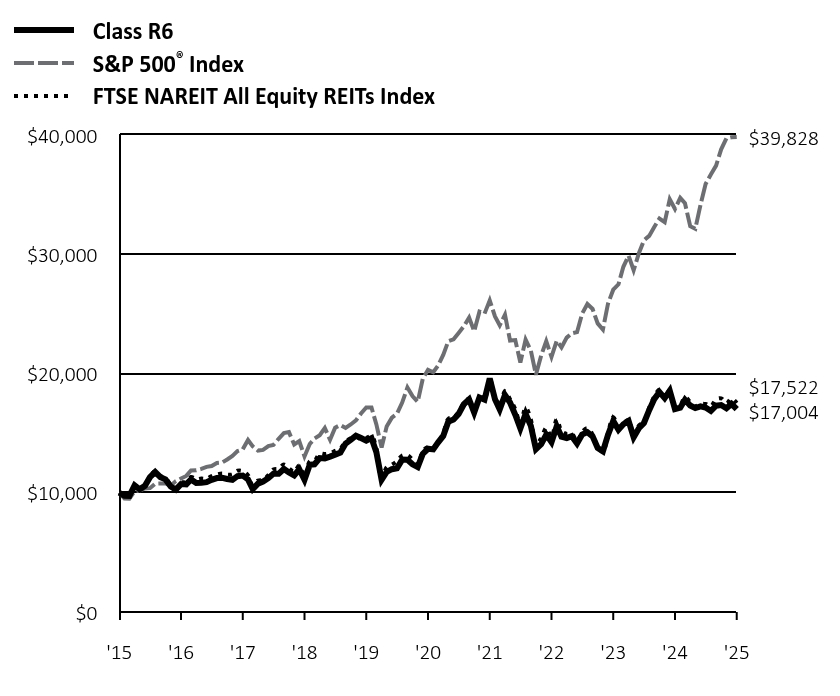
How did the Fund perform last year and what affected its performance? Class R6 shares of the Fund returned -0.08% for the period ended December 31, 2025. The Fund's broad-based index, the S&P 500® Index, returned 17.88% for the same period, while the Fund's additional, more narrowly based index, the FTSE NAREIT All Equity REITs Index, returned 2.27%. Individual stock selection and broader sector allocations each played a role in the Fund’s underperformance relative to the FTSE NAREIT All Equity REITs Index. With respect to the former, the Fund’s holdings lagged the corresponding index components by the widest margin in the net lease category. The shortfall was largely a result of weakness in Essential Properties Real Estate Trust, Inc. (2.3%) and Vinci Properties, Inc.* The Fund also underperformed in specialty REITs, where Iron Mountain, Inc.* was the largest detractor, and in apartments, where overweights in Avalon Bay Communities, Inc.* and Independence Realty Trust, Inc.* hurt results. On the positive side, the Fund outperformed in the lab/outpatient category thanks to an overweight in Healthcare Realty Trust, Inc. (0.9%) and a zero weighting in Alexandria Real Estate Equities, Inc., one of the worst performing stocks in the FTSE NAREIT All Equity REITs Index in 2025. The industrials category was a further area of strength, primarily due to zero weightings or underweights in several stocks that lagged. Stock selection in manufactured housing, hotels, and senior housing also contributed positively to the Fund's relative performance. In terms of allocation, the Fund was hurt by its average underweight in offices, which continued to recover from COVID-era weakness. Overweights in regional malls, apartments, and data centers, together with an underweight in net lease, further detracted from the Fund's performance. An average overweight in senior housing helped results, as did an underweight in the lab/outpatient category. Percentages in parentheses are based on the Fund’s net assets as of December 31, 2025. * Not held at December 31, 2025. |
| Performance Past Does Not Indicate Future [Text] |
|
The Fund's past performance is not a good predictor or guarantee of the Fund's future performance.
|
| Line Graph [Table Text Block] |
|
 | Class R6 | S&P 500® Index | FTSE NAREIT All Equity REITs Index |
|---|
'15 | $10,000 | $10,000 | $10,000 |
|---|
'16 | $9,745 | $9,504 | $9,648 |
|---|
'16 | $9,731 | $9,491 | $9,607 |
|---|
'16 | $10,616 | $10,135 | $10,584 |
|---|
'16 | $10,284 | $10,174 | $10,392 |
|---|
'16 | $10,578 | $10,357 | $10,632 |
|---|
'16 | $11,307 | $10,384 | $11,368 |
|---|
'16 | $11,738 | $10,766 | $11,810 |
|---|
'16 | $11,307 | $10,782 | $11,400 |
|---|
'16 | $11,121 | $10,784 | $11,231 |
|---|
'16 | $10,525 | $10,587 | $10,657 |
|---|
'16 | $10,265 | $10,979 | $10,399 |
|---|
'16 | $10,724 | $11,196 | $10,863 |
|---|
'17 | $10,697 | $11,408 | $10,881 |
|---|
'17 | $11,114 | $11,861 | $11,318 |
|---|
'17 | $10,811 | $11,875 | $11,140 |
|---|
'17 | $10,832 | $11,997 | $11,188 |
|---|
'17 | $10,886 | $12,166 | $11,174 |
|---|
'17 | $11,079 | $12,242 | $11,393 |
|---|
'17 | $11,230 | $12,494 | $11,537 |
|---|
'17 | $11,257 | $12,532 | $11,611 |
|---|
'17 | $11,156 | $12,790 | $11,519 |
|---|
'17 | $11,080 | $13,089 | $11,534 |
|---|
'17 | $11,389 | $13,490 | $11,840 |
|---|
'17 | $11,434 | $13,640 | $11,805 |
|---|
'18 | $11,114 | $14,421 | $11,457 |
|---|
'18 | $10,305 | $13,890 | $10,624 |
|---|
'18 | $10,761 | $13,537 | $11,019 |
|---|
'18 | $10,931 | $13,589 | $11,076 |
|---|
'18 | $11,218 | $13,916 | $11,475 |
|---|
'18 | $11,584 | $14,002 | $11,955 |
|---|
'18 | $11,584 | $14,523 | $12,028 |
|---|
'18 | $11,995 | $14,996 | $12,362 |
|---|
'18 | $11,698 | $15,081 | $12,059 |
|---|
'18 | $11,457 | $14,050 | $11,740 |
|---|
'18 | $11,968 | $14,337 | $12,298 |
|---|
'18 | $11,081 | $13,042 | $11,328 |
|---|
'19 | $12,349 | $14,087 | $12,639 |
|---|
'19 | $12,384 | $14,540 | $12,708 |
|---|
'19 | $12,902 | $14,822 | $13,273 |
|---|
'19 | $12,879 | $15,422 | $13,242 |
|---|
'19 | $13,026 | $14,442 | $13,328 |
|---|
'19 | $13,197 | $15,460 | $13,511 |
|---|
'19 | $13,369 | $15,682 | $13,719 |
|---|
'19 | $14,124 | $15,434 | $14,287 |
|---|
'19 | $14,428 | $15,723 | $14,555 |
|---|
'19 | $14,781 | $16,063 | $14,713 |
|---|
'19 | $14,589 | $16,646 | $14,486 |
|---|
'19 | $14,368 | $17,149 | $14,575 |
|---|
'20 | $14,578 | $17,142 | $14,759 |
|---|
'20 | $13,395 | $15,731 | $13,722 |
|---|
'20 | $11,089 | $13,788 | $11,158 |
|---|
'20 | $11,742 | $15,556 | $12,143 |
|---|
'20 | $11,972 | $16,296 | $12,351 |
|---|
'20 | $12,053 | $16,620 | $12,636 |
|---|
'20 | $12,774 | $17,558 | $13,119 |
|---|
'20 | $12,761 | $18,820 | $13,136 |
|---|
'20 | $12,380 | $18,105 | $12,787 |
|---|
'20 | $12,156 | $17,623 | $12,358 |
|---|
'20 | $13,256 | $19,552 | $13,497 |
|---|
'20 | $13,687 | $20,304 | $13,828 |
|---|
'21 | $13,634 | $20,099 | $13,818 |
|---|
'21 | $14,204 | $20,653 | $14,194 |
|---|
'21 | $14,760 | $21,558 | $14,979 |
|---|
'21 | $15,962 | $22,708 | $16,195 |
|---|
'21 | $16,142 | $22,867 | $16,328 |
|---|
'21 | $16,610 | $23,401 | $16,780 |
|---|
'21 | $17,423 | $23,957 | $17,513 |
|---|
'21 | $17,830 | $24,685 | $17,878 |
|---|
'21 | $16,730 | $23,537 | $16,819 |
|---|
'21 | $17,982 | $25,186 | $18,009 |
|---|
'21 | $17,802 | $25,011 | $17,827 |
|---|
'21 | $19,590 | $26,132 | $19,539 |
|---|
'22 | $17,847 | $24,780 | $17,989 |
|---|
'22 | $16,994 | $24,038 | $17,289 |
|---|
'22 | $18,193 | $24,931 | $18,511 |
|---|
'22 | $17,567 | $22,757 | $17,834 |
|---|
'22 | $16,539 | $22,798 | $16,999 |
|---|
'22 | $15,388 | $20,917 | $15,792 |
|---|
'22 | $16,622 | $22,845 | $17,142 |
|---|
'22 | $15,602 | $21,913 | $16,134 |
|---|
'22 | $13,654 | $19,895 | $14,082 |
|---|
'22 | $14,070 | $21,506 | $14,558 |
|---|
'22 | $14,872 | $22,708 | $15,431 |
|---|
'22 | $14,247 | $21,400 | $14,664 |
|---|
'23 | $15,570 | $22,744 | $16,141 |
|---|
'23 | $14,695 | $22,189 | $15,184 |
|---|
'23 | $14,576 | $23,004 | $14,920 |
|---|
'23 | $14,741 | $23,363 | $14,964 |
|---|
'23 | $14,126 | $23,464 | $14,332 |
|---|
'23 | $14,886 | $25,015 | $15,100 |
|---|
'23 | $15,082 | $25,819 | $15,402 |
|---|
'23 | $14,727 | $25,407 | $14,889 |
|---|
'23 | $13,759 | $24,196 | $13,841 |
|---|
'23 | $13,470 | $23,687 | $13,410 |
|---|
'23 | $14,851 | $25,851 | $15,000 |
|---|
'23 | $16,019 | $27,025 | $16,330 |
|---|
'24 | $15,286 | $27,479 | $15,536 |
|---|
'24 | $15,736 | $28,946 | $15,835 |
|---|
'24 | $16,025 | $29,878 | $16,116 |
|---|
'24 | $14,643 | $28,657 | $14,841 |
|---|
'24 | $15,411 | $30,078 | $15,626 |
|---|
'24 | $15,848 | $31,158 | $15,972 |
|---|
'24 | $16,921 | $31,537 | $17,118 |
|---|
'24 | $17,871 | $32,302 | $18,081 |
|---|
'24 | $18,440 | $32,992 | $18,654 |
|---|
'24 | $17,935 | $32,693 | $17,980 |
|---|
'24 | $18,557 | $34,612 | $18,623 |
|---|
'24 | $17,018 | $33,787 | $17,133 |
|---|
'25 | $17,128 | $34,727 | $17,309 |
|---|
'25 | $17,795 | $34,274 | $18,030 |
|---|
'25 | $17,317 | $32,343 | $17,605 |
|---|
'25 | $17,095 | $32,124 | $17,256 |
|---|
'25 | $17,245 | $34,146 | $17,455 |
|---|
'25 | $17,139 | $35,882 | $17,441 |
|---|
'25 | $16,853 | $36,688 | $17,252 |
|---|
'25 | $17,298 | $37,431 | $17,829 |
|---|
'25 | $17,354 | $38,797 | $17,907 |
|---|
'25 | $17,082 | $39,706 | $17,512 |
|---|
'25 | $17,450 | $39,803 | $17,905 |
|---|
'25 | $17,004 | $39,828 | $17,522 |
|---|
|
| Average Annual Return [Table Text Block] |
|
Class/Index
| 1-Year | 5-Year | 10-Year |
|---|
Class R6 No Sales Charge | -0.08% | 4.44% | 5.45% |
|---|
S&P 500® Index | 17.88% | 14.42% | 14.82% |
|---|
FTSE NAREIT All Equity REITs Index | 2.27% | 4.85% | 5.77% |
|---|
|
| No Deduction of Taxes [Text Block] |
|
The performance graph and returns table do not reflect the deduction of taxes that a shareholder would pay on Fund distributions or the redemption of Fund shares.
|
| Material Change Date |
Jan. 01, 2025
|
|
| AssetsNet |
|
$ 935,017,923
|
| Holdings Count | Holding |
|
37
|
| Advisory Fees Paid, Amount |
|
$ 4,080,213
|
| InvestmentCompanyPortfolioTurnover |
|
100.00%
|
| Additional Fund Statistics [Text Block] |
|
Net Assets ($) | 935,017,923 |
|---|
Number of Portfolio Holdings | 37 |
|---|
Portfolio Turnover Rate (%) | 100 |
|---|
Total Net Advisory Fees Paid ($) | 4,080,213 |
|---|
|
| Holdings [Text Block] |
|
Asset Type | % of Net Assets |
|---|
Common Stocks | 99% |
|---|
Cash Equivalents | 1% |
|---|
Other Assets and Liabilities, Net | 0% |
|---|
Total | 100% |
|---|
Sector | % of Net Assets |
|---|
Specialized REITs | 31% |
|---|
Health Care REITs | 18% |
|---|
Retail REITs | 17% |
|---|
Industrial REITs | 13% |
|---|
Residential REITs | 12% |
|---|
Hotel & Resort REITs | 3% |
|---|
Diversified REITs | 3% |
|---|
Office REITs | 2% |
|---|
Ten Largest Equity HoldingsHoldings | 54.8% of Net Assets |
|---|
Prologis, Inc. | 9.7% | Welltower, Inc. | 8.6% | Simon Property Group, Inc. | 6.0% | Equinix, Inc. | 5.9% | SBA Communications Corp. | 5.2% | Crown Castle, Inc. | 4.8% | Realty Income Corp. | 3.9% | Equity Residential | 3.7% | Ventas, Inc. | 3.6% | Extra Space Storage, Inc. | 3.4% |
|
| Material Fund Change [Text Block] |
|
This is a summary of certain changes of the Fund since January 1, 2025. For more information, review the Fund's current prospectus at dws.com/mutualreports, or call (800) 728-3337. Effective October 1, 2025, the Fund’s contractual cap on total annual operating expense for Class R6 shares changed from 0.99% to 0.95%. The cap excludes certain expenses such as extraordinary expenses, taxes, brokerage, interest expense and acquired fund fees and expenses. |
| Material Fund Change Expenses [Text Block] |
|
Effective October 1, 2025, the Fund’s contractual cap on total annual operating expense for Class R6 shares changed from 0.99% to 0.95%. The cap excludes certain expenses such as extraordinary expenses, taxes, brokerage, interest expense and acquired fund fees and expenses.
|
| Summary of Change Legend [Text Block] |
|
This is a summary of certain changes of the Fund since January 1, 2025. For more information, review the Fund's current prospectus at dws.com/mutualreports, or call (800) 728-3337.
|
| C000099789 |
|
|
| Shareholder Report [Line Items] |
|
|
| Fund Name |
|
DWS RREEF Real Estate Securities Fund
|
| Class Name |
|
Class S
|
| Trading Symbol |
|
RRREX
|
| Annual or Semi-Annual Statement [Text Block] |
|
This annual shareholder report contains important information about DWS RREEF Real Estate Securities Fund (the "Fund") for the period January 1, 2025 to December 31, 2025.
|
| Additional Information [Text Block] |
|
You can find additional information about the Fund on the Fund's website at dws.com/mutualreports. You can also request this information by contacting us at (800) 728-3337.
|
| Material Fund Change Notice [Text Block] |
|
This report describes changes to the Fund that occurred during the reporting period.
|
| Additional Information Phone Number |
|
(800) 728-3337
|
| Additional Information Website |
|
<span style="box-sizing: border-box; color: rgb(0, 0, 0); display: inline; flex-wrap: nowrap; font-size: 14.6667px; font-weight: 300; grid-area: auto; line-height: 17.6px; margin: 0px; overflow: visible; text-align: left; text-align-last: auto; white-space-collapse: preserve-breaks;">dws.com/mutualreports</span>
|
| Expenses [Text Block] |
|
What were the Fund costs for the last year?(Based on a hypothetical $10,000 investment) Fund | Costs of a $10,000 investment | Costs paid as a percentage of a $10,000 investment |
|---|
Class S | $76 | 0.76% |
|---|
Gross expense ratio as of the latest prospectus: 0.76%. See prospectus for any contractual or voluntary waivers; without a waiver, costs would have been higher. |
| Expenses Paid, Amount |
|
$ 76
|
| Expense Ratio, Percent |
|
0.76%
|
| Factors Affecting Performance [Text Block] |
|
How did the Fund perform last year and what affected its performance? Class S shares of the Fund returned -0.28% for the period ended December 31, 2025. The Fund's broad-based index, the S&P 500® Index, returned 17.88% for the same period, while the Fund's additional, more narrowly based index, the FTSE NAREIT All Equity REITs Index, returned 2.27%. Individual stock selection and broader sector allocations each played a role in the Fund’s underperformance relative to the FTSE NAREIT All Equity REITs Index. With respect to the former, the Fund’s holdings lagged the corresponding index components by the widest margin in the net lease category. The shortfall was largely a result of weakness in Essential Properties Real Estate Trust, Inc. (2.3%) and Vinci Properties, Inc.* The Fund also underperformed in specialty REITs, where Iron Mountain, Inc.* was the largest detractor, and in apartments, where overweights in Avalon Bay Communities, Inc.* and Independence Realty Trust, Inc.* hurt results. On the positive side, the Fund outperformed in the lab/outpatient category thanks to an overweight in Healthcare Realty Trust, Inc. (0.9%) and a zero weighting in Alexandria Real Estate Equities, Inc., one of the worst performing stocks in the FTSE NAREIT All Equity REITs Index in 2025. The industrials category was a further area of strength, primarily due to zero weightings or underweights in several stocks that lagged. Stock selection in manufactured housing, hotels, and senior housing also contributed positively to the Fund's relative performance. In terms of allocation, the Fund was hurt by its average underweight in offices, which continued to recover from COVID-era weakness. Overweights in regional malls, apartments, and data centers, together with an underweight in net lease, further detracted from the Fund's performance. An average overweight in senior housing helped results, as did an underweight in the lab/outpatient category. Percentages in parentheses are based on the Fund’s net assets as of December 31, 2025. * Not held at December 31, 2025. |
| Performance Past Does Not Indicate Future [Text] |
|
The Fund's past performance is not a good predictor or guarantee of the Fund's future performance.
|
| Line Graph [Table Text Block] |
|
 | Class S | S&P 500® Index | FTSE NAREIT All Equity REITs Index |
|---|
'15 | $10,000 | $10,000 | $10,000 |
|---|
'16 | $9,747 | $9,504 | $9,648 |
|---|
'16 | $9,728 | $9,491 | $9,607 |
|---|
'16 | $10,613 | $10,135 | $10,584 |
|---|
'16 | $10,279 | $10,174 | $10,392 |
|---|
'16 | $10,575 | $10,357 | $10,632 |
|---|
'16 | $11,300 | $10,384 | $11,368 |
|---|
'16 | $11,727 | $10,766 | $11,810 |
|---|
'16 | $11,295 | $10,782 | $11,400 |
|---|
'16 | $11,110 | $10,784 | $11,231 |
|---|
'16 | $10,509 | $10,587 | $10,657 |
|---|
'16 | $10,247 | $10,979 | $10,399 |
|---|
'16 | $10,704 | $11,196 | $10,863 |
|---|
'17 | $10,678 | $11,408 | $10,881 |
|---|
'17 | $11,090 | $11,861 | $11,318 |
|---|
'17 | $10,785 | $11,875 | $11,140 |
|---|
'17 | $10,807 | $11,997 | $11,188 |
|---|
'17 | $10,854 | $12,166 | $11,174 |
|---|
'17 | $11,047 | $12,242 | $11,393 |
|---|
'17 | $11,196 | $12,494 | $11,537 |
|---|
'17 | $11,223 | $12,532 | $11,611 |
|---|
'17 | $11,123 | $12,790 | $11,519 |
|---|
'17 | $11,048 | $13,089 | $11,534 |
|---|
'17 | $11,354 | $13,490 | $11,840 |
|---|
'17 | $11,392 | $13,640 | $11,805 |
|---|
'18 | $11,070 | $14,421 | $11,457 |
|---|
'18 | $10,265 | $13,890 | $10,624 |
|---|
'18 | $10,717 | $13,537 | $11,019 |
|---|
'18 | $10,879 | $13,589 | $11,076 |
|---|
'18 | $11,169 | $13,916 | $11,475 |
|---|
'18 | $11,526 | $14,002 | $11,955 |
|---|
'18 | $11,532 | $14,523 | $12,028 |
|---|
'18 | $11,938 | $14,996 | $12,362 |
|---|
'18 | $11,639 | $15,081 | $12,059 |
|---|
'18 | $11,401 | $14,050 | $11,740 |
|---|
'18 | $11,910 | $14,337 | $12,298 |
|---|
'18 | $11,018 | $13,042 | $11,328 |
|---|
'19 | $12,275 | $14,087 | $12,639 |
|---|
'19 | $12,316 | $14,540 | $12,708 |
|---|
'19 | $12,822 | $14,822 | $13,273 |
|---|
'19 | $12,798 | $15,422 | $13,242 |
|---|
'19 | $12,944 | $14,442 | $13,328 |
|---|
'19 | $13,107 | $15,460 | $13,511 |
|---|
'19 | $13,277 | $15,682 | $13,719 |
|---|
'19 | $14,027 | $15,434 | $14,287 |
|---|
'19 | $14,325 | $15,723 | $14,555 |
|---|
'19 | $14,667 | $16,063 | $14,713 |
|---|
'19 | $14,478 | $16,646 | $14,486 |
|---|
'19 | $14,259 | $17,149 | $14,575 |
|---|
'20 | $14,459 | $17,142 | $14,759 |
|---|
'20 | $13,289 | $15,731 | $13,722 |
|---|
'20 | $10,994 | $13,788 | $11,158 |
|---|
'20 | $11,637 | $15,556 | $12,143 |
|---|
'20 | $11,863 | $16,296 | $12,351 |
|---|
'20 | $11,943 | $16,620 | $12,636 |
|---|
'20 | $12,652 | $17,558 | $13,119 |
|---|
'20 | $12,639 | $18,820 | $13,136 |
|---|
'20 | $12,263 | $18,105 | $12,787 |
|---|
'20 | $12,036 | $17,623 | $12,358 |
|---|
'20 | $13,124 | $19,552 | $13,497 |
|---|
'20 | $13,546 | $20,304 | $13,828 |
|---|
'21 | $13,494 | $20,099 | $13,818 |
|---|
'21 | $14,060 | $20,653 | $14,194 |
|---|
'21 | $14,605 | $21,558 | $14,979 |
|---|
'21 | $15,785 | $22,708 | $16,195 |
|---|
'21 | $15,968 | $22,867 | $16,328 |
|---|
'21 | $16,425 | $23,401 | $16,780 |
|---|
'21 | $17,223 | $23,957 | $17,513 |
|---|
'21 | $17,629 | $24,685 | $17,878 |
|---|
'21 | $16,528 | $23,537 | $16,819 |
|---|
'21 | $17,762 | $25,186 | $18,009 |
|---|
'21 | $17,585 | $25,011 | $17,827 |
|---|
'21 | $19,341 | $26,132 | $19,539 |
|---|
'22 | $17,621 | $24,780 | $17,989 |
|---|
'22 | $16,778 | $24,038 | $17,289 |
|---|
'22 | $17,956 | $24,931 | $18,511 |
|---|
'22 | $17,336 | $22,757 | $17,834 |
|---|
'22 | $16,316 | $22,798 | $16,999 |
|---|
'22 | $15,180 | $20,917 | $15,792 |
|---|
'22 | $16,387 | $22,845 | $17,142 |
|---|
'22 | $15,382 | $21,913 | $16,134 |
|---|
'22 | $13,454 | $19,895 | $14,082 |
|---|
'22 | $13,868 | $21,506 | $14,558 |
|---|
'22 | $14,653 | $22,708 | $15,431 |
|---|
'22 | $14,040 | $21,400 | $14,664 |
|---|
'23 | $15,340 | $22,744 | $16,141 |
|---|
'23 | $14,471 | $22,189 | $15,184 |
|---|
'23 | $14,355 | $23,004 | $14,920 |
|---|
'23 | $14,508 | $23,363 | $14,964 |
|---|
'23 | $13,901 | $23,464 | $14,332 |
|---|
'23 | $14,649 | $25,015 | $15,100 |
|---|
'23 | $14,841 | $25,819 | $15,402 |
|---|
'23 | $14,488 | $25,407 | $14,889 |
|---|
'23 | $13,528 | $24,196 | $13,841 |
|---|
'23 | $13,247 | $23,687 | $13,410 |
|---|
'23 | $14,609 | $25,851 | $15,000 |
|---|
'23 | $15,746 | $27,025 | $16,330 |
|---|
'24 | $15,025 | $27,479 | $15,536 |
|---|
'24 | $15,464 | $28,946 | $15,835 |
|---|
'24 | $15,745 | $29,878 | $16,116 |
|---|
'24 | $14,391 | $28,657 | $14,841 |
|---|
'24 | $15,139 | $30,078 | $15,626 |
|---|
'24 | $15,565 | $31,158 | $15,972 |
|---|
'24 | $16,618 | $31,537 | $17,118 |
|---|
'24 | $17,550 | $32,302 | $18,081 |
|---|
'24 | $18,102 | $32,992 | $18,654 |
|---|
'24 | $17,604 | $32,693 | $17,980 |
|---|
'24 | $18,208 | $34,612 | $18,623 |
|---|
'24 | $16,695 | $33,787 | $17,133 |
|---|
'25 | $16,802 | $34,727 | $17,309 |
|---|
'25 | $17,451 | $34,274 | $18,030 |
|---|
'25 | $16,981 | $32,343 | $17,605 |
|---|
'25 | $16,758 | $32,124 | $17,256 |
|---|
'25 | $16,904 | $34,146 | $17,455 |
|---|
'25 | $16,798 | $35,882 | $17,441 |
|---|
'25 | $16,513 | $36,688 | $17,252 |
|---|
'25 | $16,937 | $37,431 | $17,829 |
|---|
'25 | $16,997 | $38,797 | $17,907 |
|---|
'25 | $16,725 | $39,706 | $17,512 |
|---|
'25 | $17,090 | $39,803 | $17,905 |
|---|
'25 | $16,647 | $39,828 | $17,522 |
|---|
|
| Average Annual Return [Table Text Block] |
|
Class/Index
| 1-Year | 5-Year | 10-Year |
|---|
Class S No Sales Charge | -0.28% | 4.21% | 5.23% |
|---|
S&P 500® Index | 17.88% | 14.42% | 14.82% |
|---|
FTSE NAREIT All Equity REITs Index | 2.27% | 4.85% | 5.77% |
|---|
|
| No Deduction of Taxes [Text Block] |
|
The performance graph and returns table do not reflect the deduction of taxes that a shareholder would pay on Fund distributions or the redemption of Fund shares.
|
| Material Change Date |
Jan. 01, 2025
|
|
| AssetsNet |
|
$ 935,017,923
|
| Holdings Count | Holding |
|
37
|
| Advisory Fees Paid, Amount |
|
$ 4,080,213
|
| InvestmentCompanyPortfolioTurnover |
|
100.00%
|
| Additional Fund Statistics [Text Block] |
|
Net Assets ($) | 935,017,923 |
|---|
Number of Portfolio Holdings | 37 |
|---|
Portfolio Turnover Rate (%) | 100 |
|---|
Total Net Advisory Fees Paid ($) | 4,080,213 |
|---|
|
| Holdings [Text Block] |
|
Asset Type | % of Net Assets |
|---|
Common Stocks | 99% |
|---|
Cash Equivalents | 1% |
|---|
Other Assets and Liabilities, Net | 0% |
|---|
Total | 100% |
|---|
Sector | % of Net Assets |
|---|
Specialized REITs | 31% |
|---|
Health Care REITs | 18% |
|---|
Retail REITs | 17% |
|---|
Industrial REITs | 13% |
|---|
Residential REITs | 12% |
|---|
Hotel & Resort REITs | 3% |
|---|
Diversified REITs | 3% |
|---|
Office REITs | 2% |
|---|
Ten Largest Equity HoldingsHoldings | 54.8% of Net Assets |
|---|
Prologis, Inc. | 9.7% | Welltower, Inc. | 8.6% | Simon Property Group, Inc. | 6.0% | Equinix, Inc. | 5.9% | SBA Communications Corp. | 5.2% | Crown Castle, Inc. | 4.8% | Realty Income Corp. | 3.9% | Equity Residential | 3.7% | Ventas, Inc. | 3.6% | Extra Space Storage, Inc. | 3.4% |
|
| Material Fund Change [Text Block] |
|
This is a summary of certain changes of the Fund since January 1, 2025. For more information, review the Fund's current prospectus at dws.com/mutualreports, or call (800) 728-3337. Effective October 1, 2025, the Fund’s contractual cap on total annual operating expense for Class S shares changed from 0.99% to 0.95%. The cap excludes certain expenses such as extraordinary expenses, taxes, brokerage, interest expense and acquired fund fees and expenses. |
| Material Fund Change Expenses [Text Block] |
|
Effective October 1, 2025, the Fund’s contractual cap on total annual operating expense for Class S shares changed from 0.99% to 0.95%. The cap excludes certain expenses such as extraordinary expenses, taxes, brokerage, interest expense and acquired fund fees and expenses.
|
| Summary of Change Legend [Text Block] |
|
This is a summary of certain changes of the Fund since January 1, 2025. For more information, review the Fund's current prospectus at dws.com/mutualreports, or call (800) 728-3337.
|
| C000099790 |
|
|
| Shareholder Report [Line Items] |
|
|
| Fund Name |
|
DWS RREEF Real Estate Securities Fund
|
| Class Name |
|
Institutional Class
|
| Trading Symbol |
|
RRRRX
|
| Annual or Semi-Annual Statement [Text Block] |
|
This annual shareholder report contains important information about DWS RREEF Real Estate Securities Fund (the "Fund") for the period January 1, 2025 to December 31, 2025.
|
| Additional Information [Text Block] |
|
You can find additional information about the Fund on the Fund's website at dws.com/mutualreports. You can also request this information by contacting us at (800) 728-3337.
|
| Material Fund Change Notice [Text Block] |
|
This report describes changes to the Fund that occurred during the reporting period.
|
| Additional Information Phone Number |
|
(800) 728-3337
|
| Additional Information Website |
|
<span style="box-sizing: border-box; color: rgb(0, 0, 0); display: inline; flex-wrap: nowrap; font-size: 14.6667px; font-weight: 300; grid-area: auto; line-height: 17.6px; margin: 0px; overflow: visible; text-align: left; text-align-last: auto; white-space-collapse: preserve-breaks;">dws.com/mutualreports</span>
|
| Expenses [Text Block] |
|
What were the Fund costs for the last year?(Based on a hypothetical $10,000 investment) Fund | Costs of a $10,000 investment | Costs paid as a percentage of a $10,000 investment |
|---|
Institutional Class | $63 | 0.63% |
|---|
Gross expense ratio as of the latest prospectus: 0.63%. See prospectus for any contractual or voluntary waivers; without a waiver, costs would have been higher. |
| Expenses Paid, Amount |
|
$ 63
|
| Expense Ratio, Percent |
|
0.63%
|
| Factors Affecting Performance [Text Block] |
|
How did the Fund perform last year and what affected its performance? Institutional Class shares of the Fund returned -0.13% for the period ended December 31, 2025. The Fund's broad-based index, the S&P 500® Index, returned 17.88% for the same period, while the Fund's additional, more narrowly based index, the FTSE NAREIT All Equity REITs Index, returned 2.27%. Individual stock selection and broader sector allocations each played a role in the Fund’s underperformance relative to the FTSE NAREIT All Equity REITs Index. With respect to the former, the Fund’s holdings lagged the corresponding index components by the widest margin in the net lease category. The shortfall was largely a result of weakness in Essential Properties Real Estate Trust, Inc. (2.3%) and Vinci Properties, Inc.* The Fund also underperformed in specialty REITs, where Iron Mountain, Inc.* was the largest detractor, and in apartments, where overweights in Avalon Bay Communities, Inc.* and Independence Realty Trust, Inc.* hurt results. On the positive side, the Fund outperformed in the lab/outpatient category thanks to an overweight in Healthcare Realty Trust, Inc. (0.9%) and a zero weighting in Alexandria Real Estate Equities, Inc., one of the worst performing stocks in the FTSE NAREIT All Equity REITs Index in 2025. The industrials category was a further area of strength, primarily due to zero weightings or underweights in several stocks that lagged. Stock selection in manufactured housing, hotels, and senior housing also contributed positively to the Fund's relative performance. In terms of allocation, the Fund was hurt by its average underweight in offices, which continued to recover from COVID-era weakness. Overweights in regional malls, apartments, and data centers, together with an underweight in net lease, further detracted from the Fund's performance. An average overweight in senior housing helped results, as did an underweight in the lab/outpatient category. Percentages in parentheses are based on the Fund’s net assets as of December 31, 2025. * Not held at December 31, 2025. |
| Performance Past Does Not Indicate Future [Text] |
|
The Fund's past performance is not a good predictor or guarantee of the Fund's future performance.
|
| Line Graph [Table Text Block] |
|
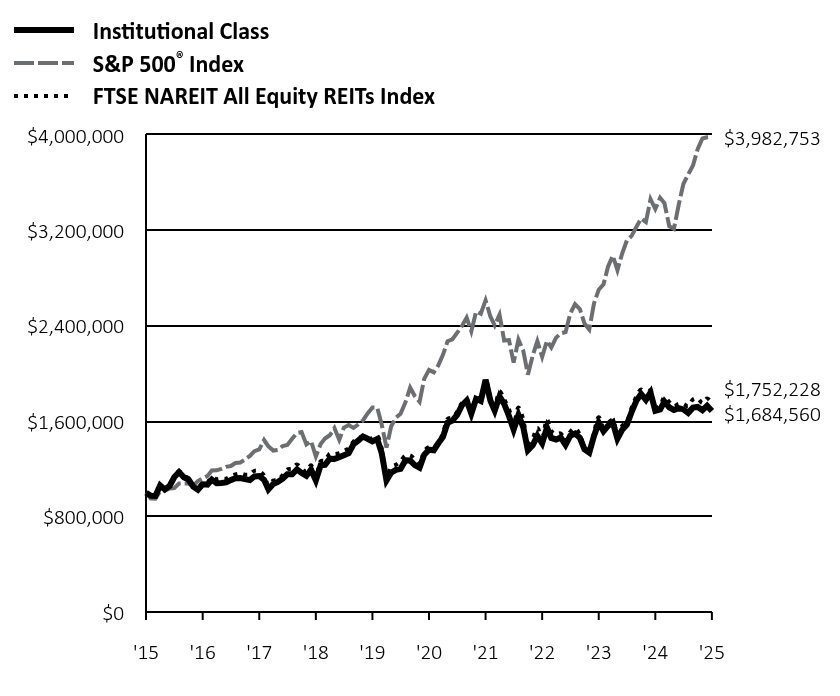 | Institutional Class | S&P 500® Index | FTSE NAREIT All Equity REITs Index |
|---|
'15 | $1,000,000 | $1,000,000 | $1,000,000 |
|---|
'16 | $974,504 | $950,376 | $964,804 |
|---|
'16 | $972,616 | $949,094 | $960,676 |
|---|
'16 | $1,060,917 | $1,013,479 | $1,058,388 |
|---|
'16 | $1,027,719 | $1,017,408 | $1,039,192 |
|---|
'16 | $1,057,597 | $1,035,679 | $1,063,235 |
|---|
'16 | $1,129,722 | $1,038,363 | $1,136,800 |
|---|
'16 | $1,173,247 | $1,076,646 | $1,181,011 |
|---|
'16 | $1,129,722 | $1,078,158 | $1,139,972 |
|---|
'16 | $1,111,301 | $1,078,362 | $1,123,089 |
|---|
'16 | $1,051,243 | $1,058,691 | $1,065,698 |
|---|
'16 | $1,025,299 | $1,097,900 | $1,039,883 |
|---|
'16 | $1,070,904 | $1,119,601 | $1,086,292 |
|---|
'17 | $1,068,237 | $1,140,836 | $1,088,094 |
|---|
'17 | $1,109,836 | $1,186,134 | $1,131,772 |
|---|
'17 | $1,079,276 | $1,187,518 | $1,113,961 |
|---|
'17 | $1,081,419 | $1,199,714 | $1,118,787 |
|---|
'17 | $1,086,778 | $1,216,597 | $1,117,363 |
|---|
'17 | $1,105,824 | $1,224,190 | $1,139,296 |
|---|
'17 | $1,120,906 | $1,249,363 | $1,153,709 |
|---|
'17 | $1,123,599 | $1,253,188 | $1,161,117 |
|---|
'17 | $1,113,706 | $1,279,039 | $1,151,906 |
|---|
'17 | $1,106,126 | $1,308,886 | $1,153,374 |
|---|
'17 | $1,136,987 | $1,349,029 | $1,183,988 |
|---|
'17 | $1,140,504 | $1,364,028 | $1,180,516 |
|---|
'18 | $1,108,575 | $1,442,124 | $1,145,748 |
|---|
'18 | $1,028,471 | $1,388,971 | $1,062,438 |
|---|
'18 | $1,073,138 | $1,353,673 | $1,101,853 |
|---|
'18 | $1,090,029 | $1,358,867 | $1,107,592 |
|---|
'18 | $1,118,744 | $1,391,591 | $1,147,487 |
|---|
'18 | $1,154,953 | $1,400,156 | $1,195,497 |
|---|
'18 | $1,154,953 | $1,452,261 | $1,202,759 |
|---|
'18 | $1,195,896 | $1,499,583 | $1,236,158 |
|---|
'18 | $1,165,963 | $1,508,119 | $1,205,907 |
|---|
'18 | $1,142,518 | $1,405,039 | $1,174,006 |
|---|
'18 | $1,193,411 | $1,433,671 | $1,229,799 |
|---|
'18 | $1,104,096 | $1,304,224 | $1,132,770 |
|---|
'19 | $1,230,479 | $1,408,739 | $1,263,942 |
|---|
'19 | $1,233,989 | $1,453,971 | $1,270,787 |
|---|
'19 | $1,285,854 | $1,482,224 | $1,327,316 |
|---|
'19 | $1,283,502 | $1,542,239 | $1,324,241 |
|---|
'19 | $1,297,613 | $1,444,233 | $1,332,770 |
|---|
'19 | $1,314,230 | $1,546,017 | $1,351,071 |
|---|
'19 | $1,331,406 | $1,568,237 | $1,371,881 |
|---|
'19 | $1,406,623 | $1,543,396 | $1,428,689 |
|---|
'19 | $1,437,199 | $1,572,274 | $1,455,510 |
|---|
'19 | $1,471,716 | $1,606,329 | $1,471,268 |
|---|
'19 | $1,452,672 | $1,664,637 | $1,448,568 |
|---|
'19 | $1,430,937 | $1,714,879 | $1,457,454 |
|---|
'20 | $1,451,198 | $1,714,207 | $1,475,894 |
|---|
'20 | $1,333,431 | $1,573,095 | $1,372,202 |
|---|
'20 | $1,103,477 | $1,378,798 | $1,115,810 |
|---|
'20 | $1,168,500 | $1,555,551 | $1,214,332 |
|---|
'20 | $1,191,450 | $1,629,639 | $1,235,103 |
|---|
'20 | $1,199,903 | $1,662,048 | $1,263,629 |
|---|
'20 | $1,270,985 | $1,755,763 | $1,311,853 |
|---|
'20 | $1,269,680 | $1,881,968 | $1,313,645 |
|---|
'20 | $1,232,052 | $1,810,459 | $1,278,662 |
|---|
'20 | $1,209,758 | $1,762,312 | $1,235,767 |
|---|
'20 | $1,318,604 | $1,955,222 | $1,349,744 |
|---|
'20 | $1,361,205 | $2,030,397 | $1,382,810 |
|---|
'21 | $1,356,593 | $2,009,899 | $1,381,826 |
|---|
'21 | $1,412,596 | $2,065,322 | $1,419,445 |
|---|
'21 | $1,468,282 | $2,155,774 | $1,497,890 |
|---|
'21 | $1,587,224 | $2,270,825 | $1,619,476 |
|---|
'21 | $1,605,726 | $2,286,685 | $1,632,805 |
|---|
'21 | $1,651,232 | $2,340,067 | $1,678,037 |
|---|
'21 | $1,732,168 | $2,395,655 | $1,751,274 |
|---|
'21 | $1,772,636 | $2,468,496 | $1,787,758 |
|---|
'21 | $1,662,894 | $2,353,687 | $1,681,894 |
|---|
'21 | $1,787,428 | $2,518,591 | $1,800,936 |
|---|
'21 | $1,769,447 | $2,501,140 | $1,782,681 |
|---|
'21 | $1,946,919 | $2,613,231 | $1,953,888 |
|---|
'22 | $1,773,686 | $2,478,004 | $1,798,895 |
|---|
'22 | $1,688,851 | $2,403,809 | $1,728,860 |
|---|
'22 | $1,807,648 | $2,493,061 | $1,851,071 |
|---|
'22 | $1,745,463 | $2,275,662 | $1,783,413 |
|---|
'22 | $1,643,251 | $2,279,837 | $1,699,923 |
|---|
'22 | $1,529,166 | $2,091,651 | $1,579,244 |
|---|
'22 | $1,651,088 | $2,284,511 | $1,714,230 |
|---|
'22 | $1,549,731 | $2,191,344 | $1,613,363 |
|---|
'22 | $1,355,788 | $1,989,524 | $1,408,182 |
|---|
'22 | $1,397,141 | $2,150,599 | $1,455,804 |
|---|
'22 | $1,476,894 | $2,270,783 | $1,543,070 |
|---|
'22 | $1,414,410 | $2,139,953 | $1,466,422 |
|---|
'23 | $1,545,827 | $2,274,415 | $1,614,084 |
|---|
'23 | $1,458,958 | $2,218,922 | $1,518,437 |
|---|
'23 | $1,446,818 | $2,300,388 | $1,492,007 |
|---|
'23 | $1,463,208 | $2,336,293 | $1,496,446 |
|---|
'23 | $1,402,117 | $2,346,448 | $1,433,171 |
|---|
'23 | $1,477,268 | $2,501,490 | $1,509,958 |
|---|
'23 | $1,496,746 | $2,581,850 | $1,540,197 |
|---|
'23 | $1,461,537 | $2,540,743 | $1,488,946 |
|---|
'23 | $1,365,044 | $2,419,606 | $1,384,110 |
|---|
'23 | $1,336,418 | $2,368,730 | $1,340,957 |
|---|
'23 | $1,473,525 | $2,585,055 | $1,500,026 |
|---|
'23 | $1,589,038 | $2,702,496 | $1,632,955 |
|---|
'24 | $1,516,327 | $2,747,909 | $1,553,586 |
|---|
'24 | $1,561,014 | $2,894,635 | $1,583,521 |
|---|
'24 | $1,589,363 | $2,987,769 | $1,611,649 |
|---|
'24 | $1,452,218 | $2,865,735 | $1,484,140 |
|---|
'24 | $1,528,410 | $3,007,832 | $1,562,614 |
|---|
'24 | $1,571,436 | $3,115,759 | $1,597,186 |
|---|
'24 | $1,677,935 | $3,153,685 | $1,711,810 |
|---|
'24 | $1,772,175 | $3,230,183 | $1,808,103 |
|---|
'24 | $1,828,235 | $3,299,170 | $1,865,361 |
|---|
'24 | $1,778,178 | $3,269,251 | $1,798,025 |
|---|
'24 | $1,839,787 | $3,461,160 | $1,862,283 |
|---|
'24 | $1,686,779 | $3,378,652 | $1,713,333 |
|---|
'25 | $1,697,681 | $3,472,739 | $1,730,901 |
|---|
'25 | $1,763,875 | $3,427,426 | $1,802,968 |
|---|
'25 | $1,715,870 | $3,234,310 | $1,760,474 |
|---|
'25 | $1,693,932 | $3,212,378 | $1,725,635 |
|---|
'25 | $1,708,819 | $3,414,580 | $1,745,517 |
|---|
'25 | $1,698,703 | $3,588,220 | $1,744,093 |
|---|
'25 | $1,669,551 | $3,668,750 | $1,725,213 |
|---|
'25 | $1,713,673 | $3,743,121 | $1,782,915 |
|---|
'25 | $1,718,907 | $3,879,745 | $1,790,668 |
|---|
'25 | $1,691,950 | $3,970,584 | $1,751,157 |
|---|
'25 | $1,728,422 | $3,980,316 | $1,790,509 |
|---|
'25 | $1,684,560 | $3,982,753 | $1,752,228 |
|---|
|
| Average Annual Return [Table Text Block] |
|
Class/Index
| 1-Year | 5-Year | 10-Year |
|---|
Institutional Class No Sales Charge | -0.13% | 4.35% | 5.35% |
|---|
S&P 500® Index | 17.88% | 14.42% | 14.82% |
|---|
FTSE NAREIT All Equity REITs Index | 2.27% | 4.85% | 5.77% |
|---|
|
| No Deduction of Taxes [Text Block] |
|
The performance graph and returns table do not reflect the deduction of taxes that a shareholder would pay on Fund distributions or the redemption of Fund shares.
|
| Material Change Date |
Jan. 01, 2025
|
|
| AssetsNet |
|
$ 935,017,923
|
| Holdings Count | Holding |
|
37
|
| Advisory Fees Paid, Amount |
|
$ 4,080,213
|
| InvestmentCompanyPortfolioTurnover |
|
100.00%
|
| Additional Fund Statistics [Text Block] |
|
Net Assets ($) | 935,017,923 |
|---|
Number of Portfolio Holdings | 37 |
|---|
Portfolio Turnover Rate (%) | 100 |
|---|
Total Net Advisory Fees Paid ($) | 4,080,213 |
|---|
|
| Holdings [Text Block] |
|
Asset Type | % of Net Assets |
|---|
Common Stocks | 99% |
|---|
Cash Equivalents | 1% |
|---|
Other Assets and Liabilities, Net | 0% |
|---|
Total | 100% |
|---|
Sector | % of Net Assets |
|---|
Specialized REITs | 31% |
|---|
Health Care REITs | 18% |
|---|
Retail REITs | 17% |
|---|
Industrial REITs | 13% |
|---|
Residential REITs | 12% |
|---|
Hotel & Resort REITs | 3% |
|---|
Diversified REITs | 3% |
|---|
Office REITs | 2% |
|---|
Ten Largest Equity HoldingsHoldings | 54.8% of Net Assets |
|---|
Prologis, Inc. | 9.7% | Welltower, Inc. | 8.6% | Simon Property Group, Inc. | 6.0% | Equinix, Inc. | 5.9% | SBA Communications Corp. | 5.2% | Crown Castle, Inc. | 4.8% | Realty Income Corp. | 3.9% | Equity Residential | 3.7% | Ventas, Inc. | 3.6% | Extra Space Storage, Inc. | 3.4% |
|
| Material Fund Change [Text Block] |
|
This is a summary of certain changes of the Fund since January 1, 2025. For more information, review the Fund's current prospectus at dws.com/mutualreports, or call (800) 728-3337. Effective October 1, 2025, the Fund’s contractual cap on total annual operating expense for Instiutional Class shares changed from 0.99% to 0.95%. The cap excludes certain expenses such as extraordinary expenses, taxes, brokerage, interest expense and acquired fund fees and expenses. |
| Material Fund Change Expenses [Text Block] |
|
Effective October 1, 2025, the Fund’s contractual cap on total annual operating expense for Instiutional Class shares changed from 0.99% to 0.95%. The cap excludes certain expenses such as extraordinary expenses, taxes, brokerage, interest expense and acquired fund fees and expenses.
|
| Summary of Change Legend [Text Block] |
|
This is a summary of certain changes of the Fund since January 1, 2025. For more information, review the Fund's current prospectus at dws.com/mutualreports, or call (800) 728-3337.
|