Pay vs Performance Disclosure
Dec. 31, 2025
USD ($)
$ / shares
Dec. 31, 2024
USD ($)
$ / shares
Dec. 31, 2023
USD ($)
$ / shares
Dec. 31, 2022
USD ($)
$ / shares
Dec. 31, 2021
USD ($)
$ / shares
Summary Comp Table Total for PEO — Kapur (b)(1) | Comp Actually Paid to PEO — Kapur (c)(2),(3),(4) | Summary Comp Table Total for PEO — Adamczyk (b)(1) | Comp Actually Paid to PEO — Adamczyk (c)(2),(3),(5) | Avg. Summary Comp Table for Non-PEO NEOs (d)(1) | Avg. Comp Actually Paid to Non-PEO NEOs (e)(2),(3),(6) | Value of Initial Fixed $100 Investment Based on: | CSM: Segment Margin (i)(7) | ||||||||||||||||||||||||||||||||||||||||||||||
Year (a) | Total Shareowner Return ($)(f) | Peer Group Total Shareowner Return (Composite) (g) | Net Income (in millions) (h) | ||||||||||||||||||||||||||||||||||||||||||||||||||
2025 | $ | 20,381,435 | $ | 10,865,674 | $ | — | $ | — | $ | 5,241,759 | $ | 1,804,962 | $ | 107.80 | $ | 189.10 | $ | 4,772 | 21.7 | % | |||||||||||||||||||||||||||||||||
2024 | 18,277,193 | 21,623,963 | — | — | 6,741,799 | 7,708,705 | 115.09 | 158.45 | 5,740 | 22.6 | % | ||||||||||||||||||||||||||||||||||||||||||
2023 | 14,401,630 | 14,757,418 | 23,029,368 | 21,520,786 | 6,531,247 | 6,230,330 | 104.61 | 135.07 | 5,672 | 23.5 | % | ||||||||||||||||||||||||||||||||||||||||||
2022 | — | — | 25,437,598 | 36,729,811 | 8,310,085 | 11,405,134 | 104.59 | 114.34 | 4,967 | 22.6 | % | ||||||||||||||||||||||||||||||||||||||||||
2021 | — | — | 26,100,120 | 15,687,973 | 7,489,516 | 5,024,129 | 99.71 | 121.08 | 5,610 | 22.3 | % | ||||||||||||||||||||||||||||||||||||||||||
| Year | PEO (CEO) | Non-PEO NEOs | ||||||
2025 | Vimal Kapur | Michal Stepniak, James Currier, James Masso, Billal Hammoud, Gregory P. Lewis, Lucian Boldea | ||||||
| 2024 | Vimal Kapur | Gregory P. Lewis, Anne T. Madden, Lucian Boldea, James Currier | ||||||
| 2023 | Vimal Kapur, Darius Adamczyk | Gregory P. Lewis, Anne T. Madden, Lucian Boldea, James Currier | ||||||
| 2022 | Darius Adamczyk | Gregory P. Lewis, Anne T. Madden, Vimal Kapur, Lucian Boldea | ||||||
| 2021 | Darius Adamczyk | Gregory P. Lewis, Anne T. Madden, Que T. Dallara, Michael R. Madsen | ||||||
(3)For the portion of “Compensation Actually Paid” that is based on year-end stock prices, the following prices were used: for 2025: $195.09 (13.6% decrease from prior year), for 2024: $225.89 (7.7% increase from prior year), for 2023: $209.71 (2.1% decrease from prior year), for 2022: $214.30 (2.8% increase from prior year), for 2021: $208.51 (2.0% decrease from prior year).
The dollar amounts reported for Mr. Kapur under “Compensation Actually Paid” represent the amount of “compensation actually paid” to Mr. Kapur, as computed in accordance with Item 402(v) of Regulation S-K. The dollar amounts do not reflect the actual amount of compensation earned by or paid to Mr. Kapur during the applicable year. In accordance with the requirements of Item 402(v) of Regulation S-K, the adjustments in the table below were made to Mr. Kapur's compensation for each year to determine the compensation actually paid:PEO — Kapur ($) | |||||||||||
2025 | 2024 | 2023 | |||||||||
Total Reported in Summary Compensation Table (SCT) | $ | 20,381,435 | $ | 18,277,193 | $ | 14,401,630 | |||||
Less, Value of Stock & Option Awards Reported in SCT | (14,490,183) | (13,027,235) | (10,040,327) | ||||||||
Less, Change in Pension Value and Non-Qualified Deferred Compensation Earnings in SCT | (573,547) | (498,217) | (283,838) | ||||||||
Plus, Pension Service Cost | — | 205,572 | 94,485 | ||||||||
Plus, Year-End Value of Awards Granted in Fiscal Year that are Unvested and Outstanding | 15,866,339 | 16,385,615 | 10,811,208 | ||||||||
Plus, Change in Fair Value of Prior Year Awards that are Outstanding and Unvested | (9,108,010) | 830,991 | 467,763 | ||||||||
Plus, FMV of Awards Granted this Year and that Vested this Year | — | — | — | ||||||||
Plus, Change in Fair Value (from Prior Year-End) of Prior Year Awards that Vested this Year | (1,210,360) | (549,956) | (693,504) | ||||||||
Less, Prior Year Fair Value of Prior Year Awards that Failed to Vest this Year | — | — | — | ||||||||
Total Adjustments | (9,515,761) | 3,346,770 | 355,788 | ||||||||
“Compensation Actually Paid” to PEO — Kapur | $10,865,674 | $21,623,963 | $14,757,418 | ||||||||
PEO — Adamczyk ($) | |||||||||||
2023 | 2022 | 2021 | |||||||||
Total Reported in Summary Compensation Table (SCT) | $ | 23,029,368 | $ | 25,437,598 | $ | 26,100,120 | |||||
Less, Value of Stock & Option Awards Reported in SCT | (18,000,300) | (18,994,812) | (19,734,739) | ||||||||
Less, Change in Pension Value and Non-Qualified Deferred Compensation Earnings in SCT | (515,490) | (757,453) | (608,232) | ||||||||
Plus, Pension Service Cost | 59,709 | 189,227 | 337,104 | ||||||||
Plus, Year-End Value of Awards Granted in Fiscal Year that are Unvested and Outstanding | 18,914,098 | 22,196,690 | 14,602,954 | ||||||||
Plus, Change in Fair Value of Prior Year Awards that are Outstanding and Unvested | 2,029,201 | 9,053,140 | (1,770,930) | ||||||||
Plus, FMV of Awards Granted this Year and that Vested this Year | — | — | — | ||||||||
Plus, Change in Fair Value (from Prior Year-End) of Prior Year Awards that Vested this Year | (3,995,801) | (394,579) | (3,238,305) | ||||||||
Less, Prior Year Fair Value of Prior Year Awards that Failed to Vest this Year | — | — | — | ||||||||
Total Adjustments | (1,508,582) | 11,292,213 | (10,412,147) | ||||||||
“Compensation Actually Paid” to PEO — Adamczyk | $ | 21,520,786 | $ | 36,729,811 | $ | 15,687,973 | |||||
(3)For the portion of “Compensation Actually Paid” that is based on year-end stock prices, the following prices were used: for 2025: $195.09 (13.6% decrease from prior year), for 2024: $225.89 (7.7% increase from prior year), for 2023: $209.71 (2.1% decrease from prior year), for 2022: $214.30 (2.8% increase from prior year), for 2021: $208.51 (2.0% decrease from prior year).
The dollar amounts reported under Average Compensation Actually Paid for Non-PEO NEOs represent the average amount of "compensation actually paid" to the Non-PEO NEOs as a group (excluding the PEOs), as computed in accordance with Items 402(v) of Regulation S-K. The dollar amounts do not reflect the actual average amount of compensation earned by or paid to the Non-PEO NEOs as a group during the applicable year. In accordance with the requirements of Item 402(v) of Regulation S-K, the adjustments in the table below were made to the Non-PEO NEOs' total compensation for each year to determine the compensation actually paid:Non-PEO NEOs Average ($) | |||||||||||||||||
2025 | 2024 | 2023 | 2022 | 2021 | |||||||||||||
Total Reported in Summary Compensation Table (SCT) | $ | 5,241,759 | $ | 6,741,799 | $ | 6,531,247 | $ | 8,310,085 | $ | 7,489,516 | |||||||
Less, Value of Stock & Option Awards Reported in SCT | (3,332,757) | (4,619,960) | (4,410,961) | (6,206,612) | (5,394,884) | ||||||||||||
Less, Change in Pension Value and Non-Qualified Deferred Compensation Earnings in SCT | (73,878) | (240,762) | (228,752) | (257,602) | (151,402) | ||||||||||||
Plus, Pension Service Cost | — | 79,833 | 61,265 | 44,745 | 82,389 | ||||||||||||
Plus, Year-End Value of Awards Granted in Fiscal Year that are Unvested and Outstanding | 3,106,216 | 5,811,584 | 4,710,290 | 7,905,172 | 3,998,779 | ||||||||||||
Plus, Change in Fair Value of Prior Year Awards that are Outstanding and Unvested | (1,518,402) | 376,031 | 282,769 | 1,771,263 | (475,089) | ||||||||||||
Plus, FMV of Awards Granted this Year and that Vested this Year | — | — | — | — | — | ||||||||||||
Plus, Change in Fair Value (from Prior Year-End) of Prior Year Awards that Vested this Year | (366,414) | (439,820) | (715,527) | (161,917) | (525,181) | ||||||||||||
Less, Prior Year Fair Value of Prior Year Awards that Failed to Vest this Year | (1,251,562) | — | — | — | — | ||||||||||||
Total Adjustments | (3,436,796) | 966,906 | (300,916) | 3,095,050 | (2,465,387) | ||||||||||||
Average “Compensation Actually Paid” to Non-PEO NEOs | $ | 1,804,962 | $ | 7,708,705 | $ | 6,230,330 | $ | 11,405,134 | $ | 5,024,129 | |||||||
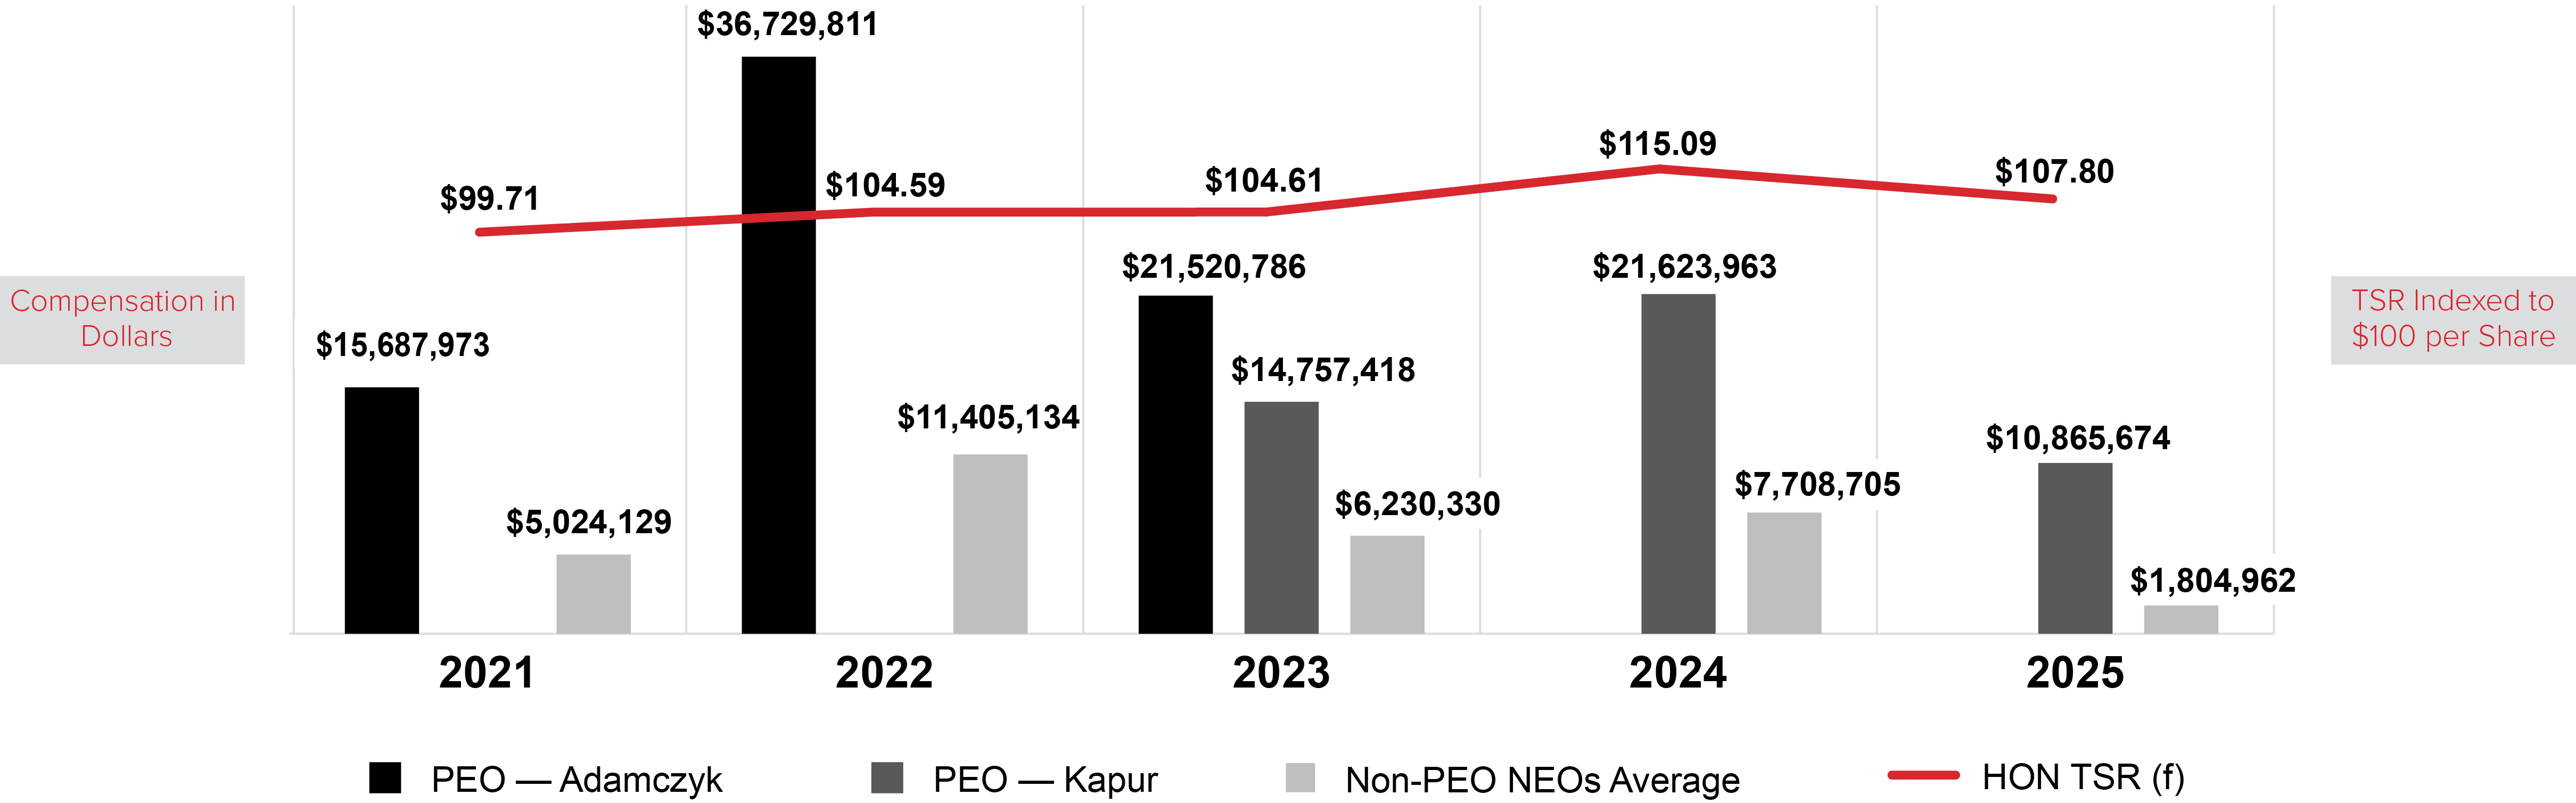
As shown in the chart below, the PEO’s and average non-PEO NEOs’ CAP values are reasonably aligned with Honeywell's TSR. This is primarily due to the Honeywell’s use of Performance Shares (PSUs), NQSOs, and Restricted Stock Units (RSUs), which are tied directly to stock price and the Company’s financial performance.
CAP vs HONEYWELL TSR
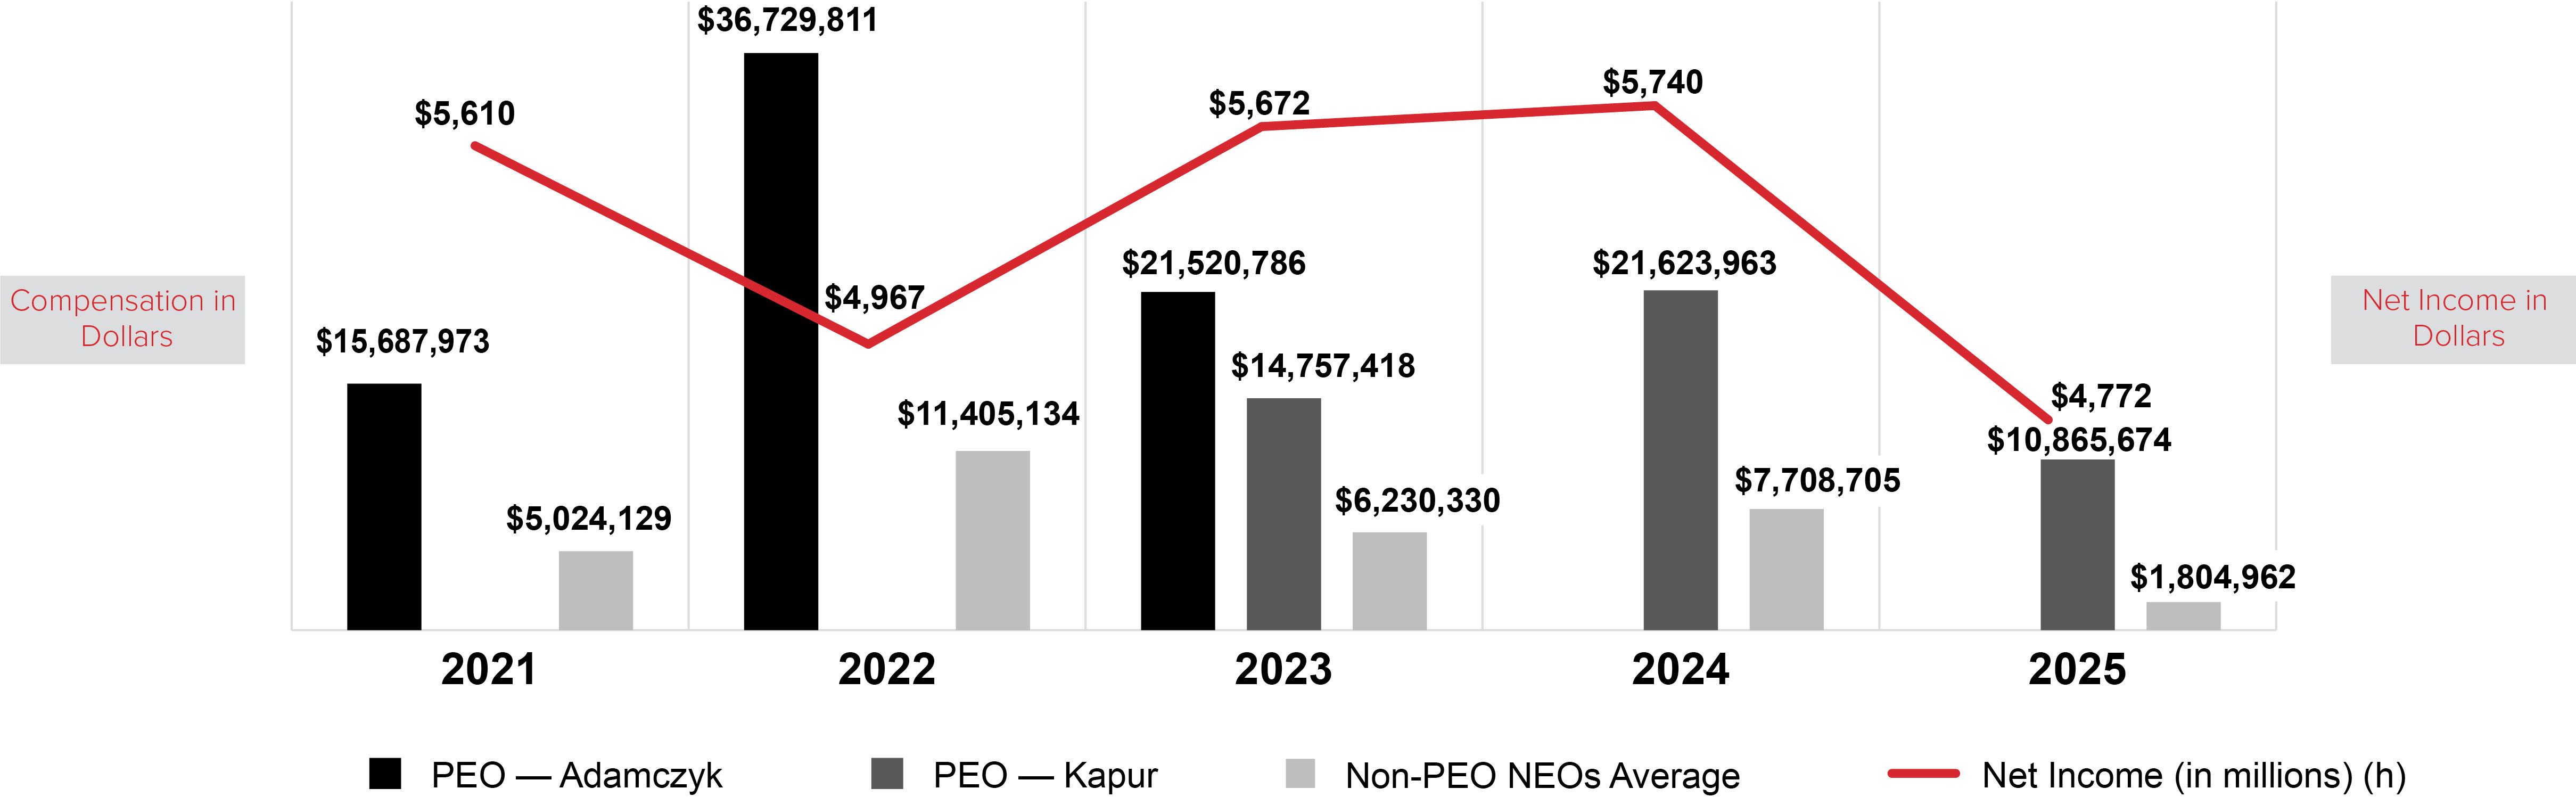
The charts below reflect the relationship between PEO CAP and Average Non-PEO NEOs CAP and Honeywell’s GAAP net income. The Company does not use net income to determine compensation levels, incentive plan payouts, or as a metric in our long-term incentive plans. Since long-term incentives comprise the largest portion of our NEOsʼ pay, and CAP values include multiple years of LTI awards, and only one year of annual incentives, the relationship between CAP and net income is less evident.
CAP vs NET INCOME
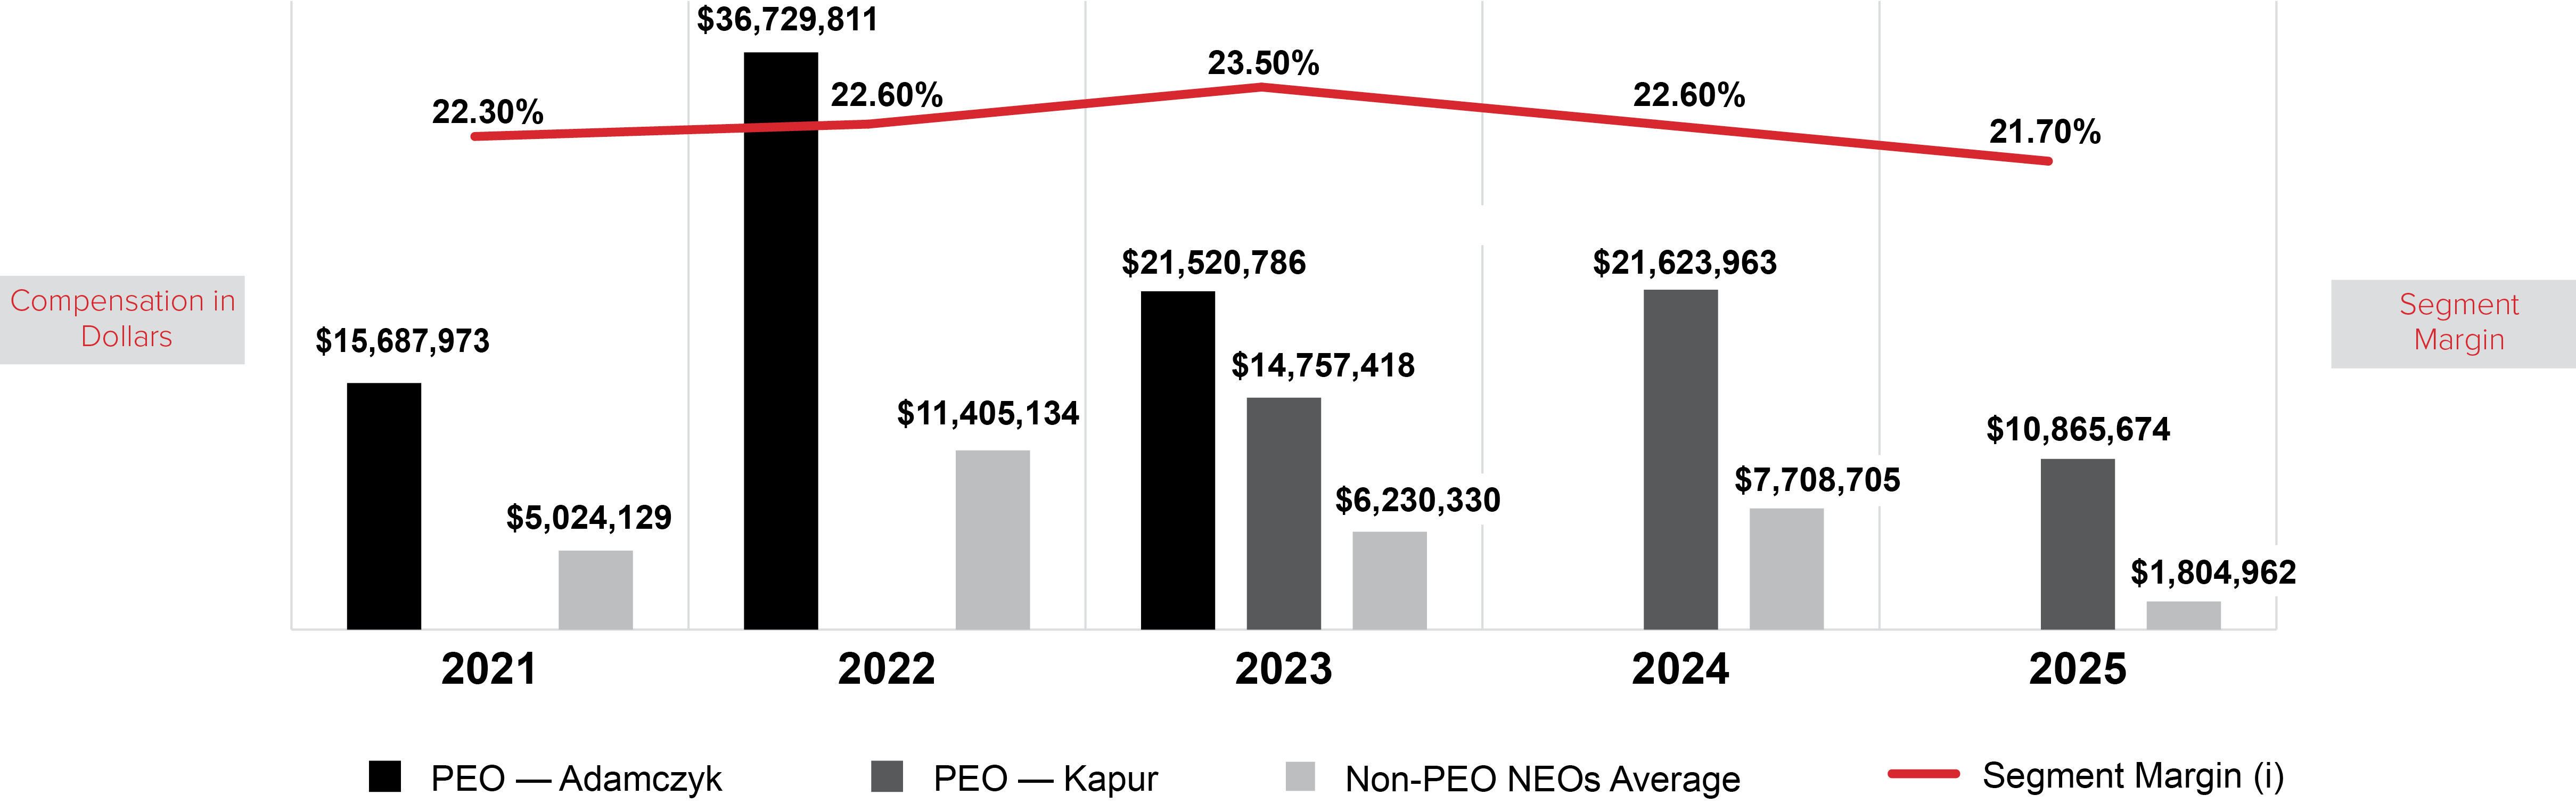
The chart below reflects the relationship between the PEO CAP and Average Non-PEO NEOs CAP and Honeywell’s segment margin for the applicable reporting year. Segment margin for 2021-2024 reflects previously reported financial results, while 2025 reflects continuing operations as a result of the Solstice spin-off and reclassification of the Advanced Materials business to discontinued operations. We consider segment margin to be the most important financial measure used to link pay to performance due to the strong correlation with long-term share price growth.
CAP vs SEGMENT MARGIN
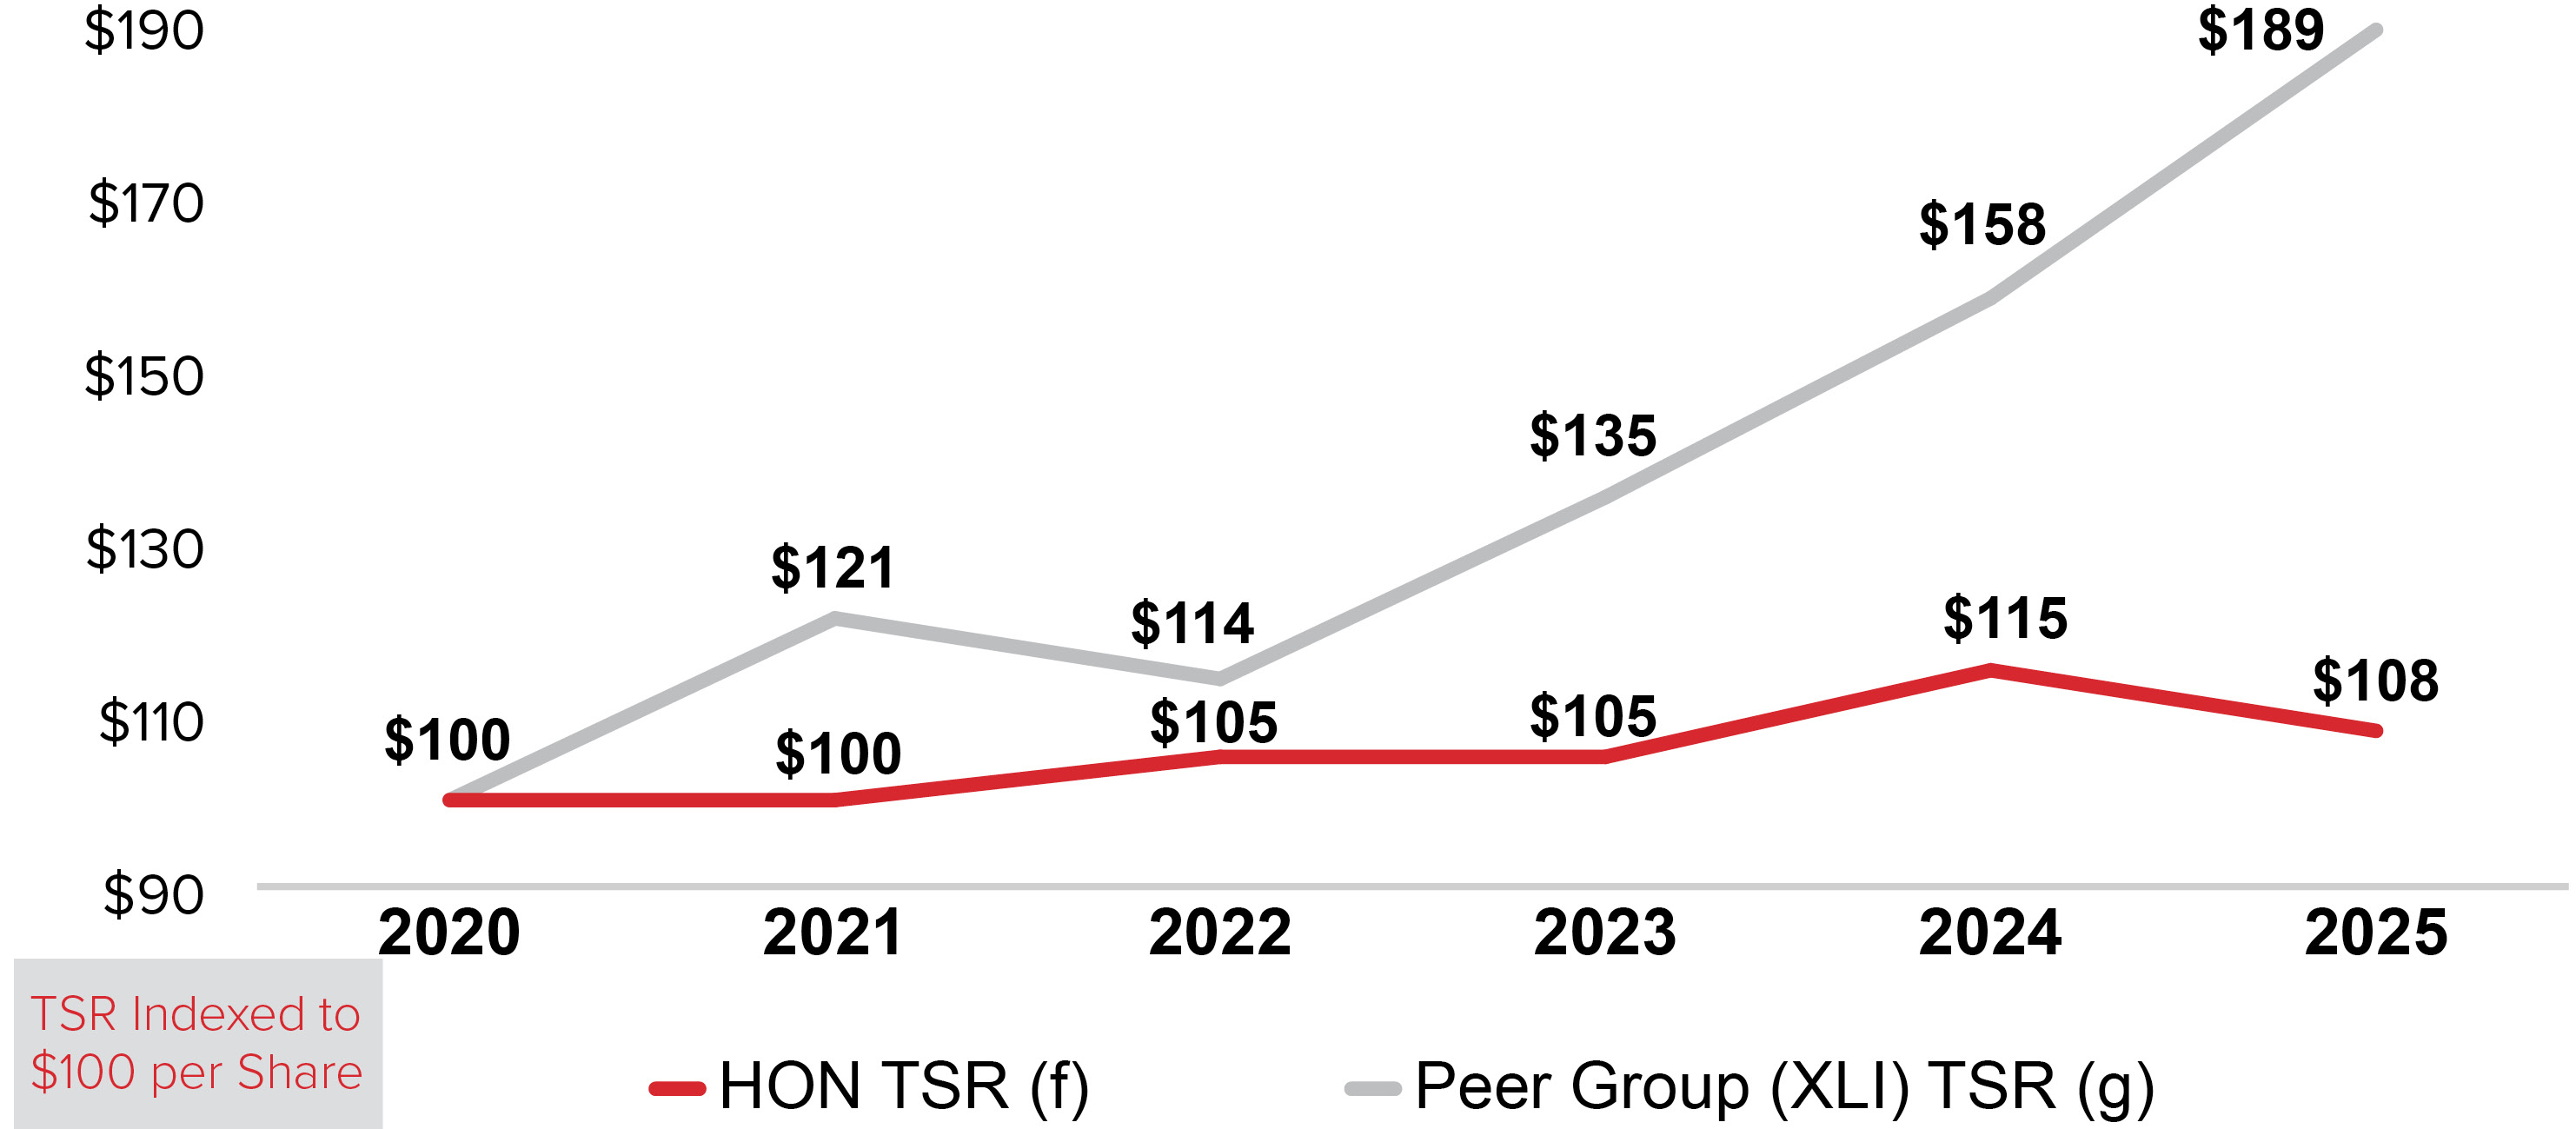
The chart below shows the Company’s TSR as well as that of our comparator index, the Nasdaq Industrial Select Sector Index (XLI), over a five-year period.
TOTAL SHAREOWNER RETURN: HONEYWELL vs XLI
| Most Important Financial Metrics | ||
Adjusted Earnings Per Share | ||
Average Segment Margin | ||
Free Cash Flow | ||
Cumulative Revenue | ||
Average Return on Investment | ||
Relative Total Shareowner Return | ||
As required by Section 953(a) of the Dodd-Frank Wall Street Reform and Consumer Protection Act, and Item 402(v) of Regulation S-K, we are providing the following information regarding executive pay and performance. The table below shows pay both as reported in the Summary Compensation Table (Summary Comp Table Total) for the applicable fiscal year and as “compensation actually paid” (CAP) for our principal executive officer(s) (PEO) and as an average of all of our other named executive officers (Non-PEO NEOs) for the applicable fiscal year. Both Summary Comp Table Total pay and CAP are calculated in accordance with the requirements of Regulation S-K and may differ substantially from the manner in which the MDCC makes executive compensation decisions, which is described in the Compensation Discussion and Analysis beginning on page 52.
The table below also shows (i) Honeywell’s cumulative total shareowner return (TSR), (ii) the TSR of the Nasdaq Industrial Select Sector Index (XLI), which we have used as our peer group for purposes of this table, (iii) Honeywell’s net income for the applicable fiscal year, and (iv) Honeywell’s performance with respect to a Company-selected measure (CSM), which in our assessment represents the single most important financial performance metric used to link compensation actually paid to our NEOs for the most recently completed fiscal year to Honeywell’s performance. We selected segment margin as the CSM for the 2025 fiscal year.
2025 Segment Margin reflects continuing operations, as a result of the Solstice spin-off and reclassification of the Advanced Materials business into discontinued operations. 2021-2024 – Segment Margin included in the table reflects our previously reported financial results and does not reflect the reclassification of the Advanced Materials business to discontinued operations.The six items listed below represent the most important financial performance metrics we used to determine CAP for FY2025 as further described in our Compensation Discussion and Analysis within the sections titled “Annual Incentive Compensation Plan Decisions” and “Long-Term Incentive Compensation Decisions.”
The graphs below illustrate the relationships between, respectively, our TSR and the TSR of our peer group, CAP and our TSR, CAP and our net income, and CAP and the CSM (segment margin).